Embed Size (px)
Citation preview
COMMUNITY CASE MANAGEMENT AT SCALE IN
RWANDA EXPERIENCE OF THE KABEHO MWANA
(EXPANDED IMPACT) PROJECT PROJECT, 2006-2011
DISTRICTS OF GISAGARA, NYARUGURU, KIREHE, NGOMA, NYAMAGABE AND NYAMASHEKE, - REPUBLIC OF RWANDA
CONCERN WORLDWIDE INC. WITH
THE INTERNATIONAL RESCUE COMMITTEE AND WORLD RELIEF
ERIC SARRIOT & THE FINAL EVALUATION TEAM
January 26, 2012
Washington DC
Mothers, Health Workers, and Authorities in the Districts
MOH of Rwanda, particularly MCH Community Health Desk, Nutrition Desk and PNILP
USAID Child Survival and Health Grants Program, and Mission
Members of the Technical Working Group for Nutrition, Community Health and MCH
Evaluation team: - MOH members:
- Concern, the IRC and World Relief Members
EIP Logistics and Support
The “pioneers” of CCM in Rwanda
MCHIP CCM Scale-Up Study
Acknowledgments
1- Background 2- Evaluation Method 4- Findings 6- Conclusions 7- Suggestions
Outline
Background
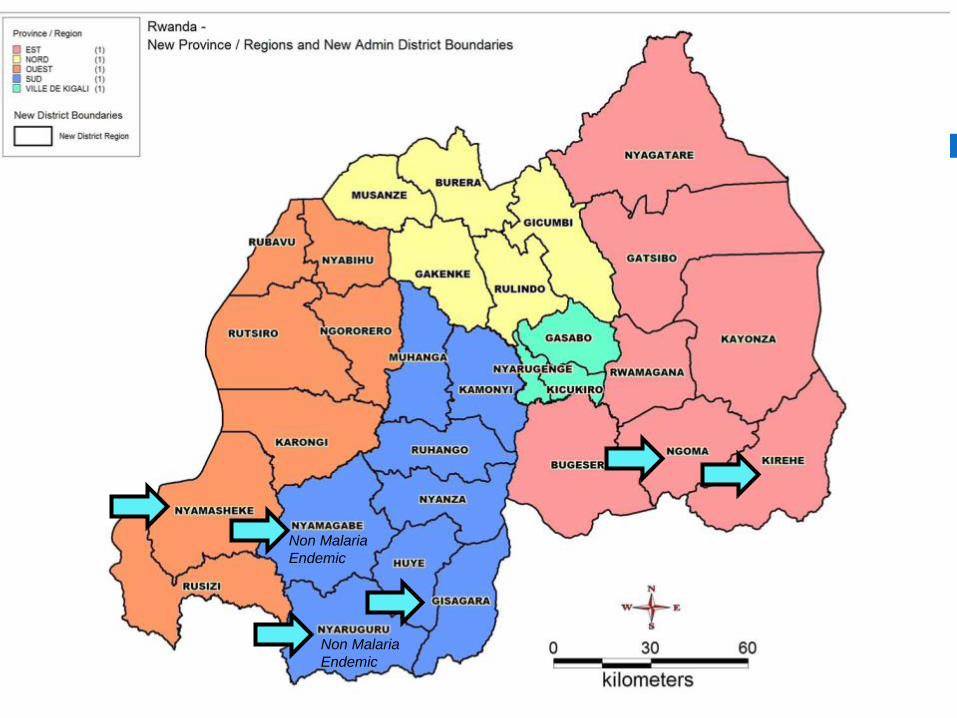
Non Malaria Endemic
Non Malaria Endemic
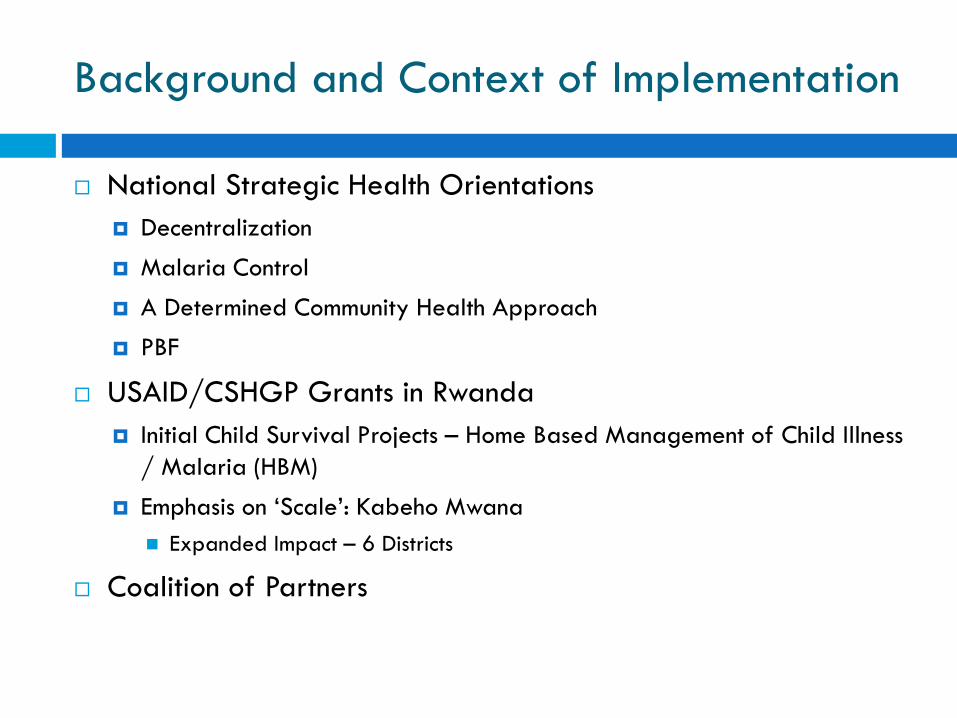
Background and Context of Implementation
National Strategic Health Orientations Decentralization
Malaria Control
A Determined Community Health Approach
PBF
USAID/CSHGP Grants in Rwanda Initial Child Survival Projects – Home Based Management of Child Illness
/ Malaria (HBM)
Emphasis on ‘Scale’: Kabeho Mwana Expanded Impact – 6 Districts
Coalition of Partners
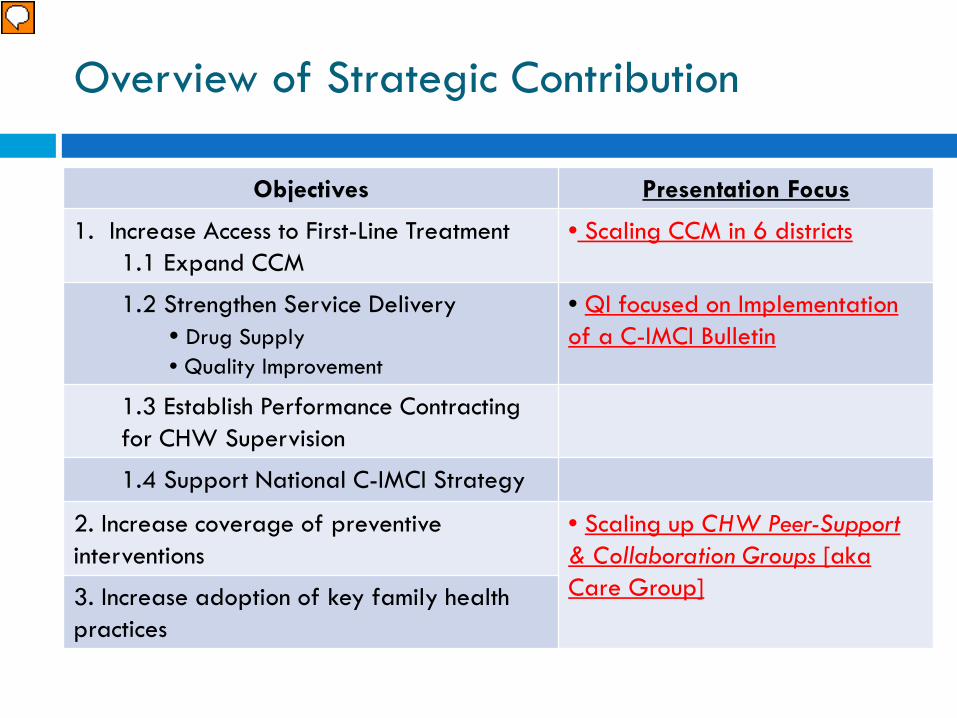
Overview of Strategic Contribution
Objectives Presentation Focus
1. Increase Access to First-Line Treatment 1.1 Expand CCM
• Scaling CCM in 6 districts
1.2 Strengthen Service Delivery • Drug Supply • Quality Improvement
• QI focused on Implementation of a C-IMCI Bulletin
1.3 Establish Performance Contracting for CHW Supervision
1.4 Support National C-IMCI Strategy
2. Increase coverage of preventive interventions
• Scaling up CHW Peer-Support & Collaboration Groups [aka Care Group] 3. Increase adoption of key family health
practices
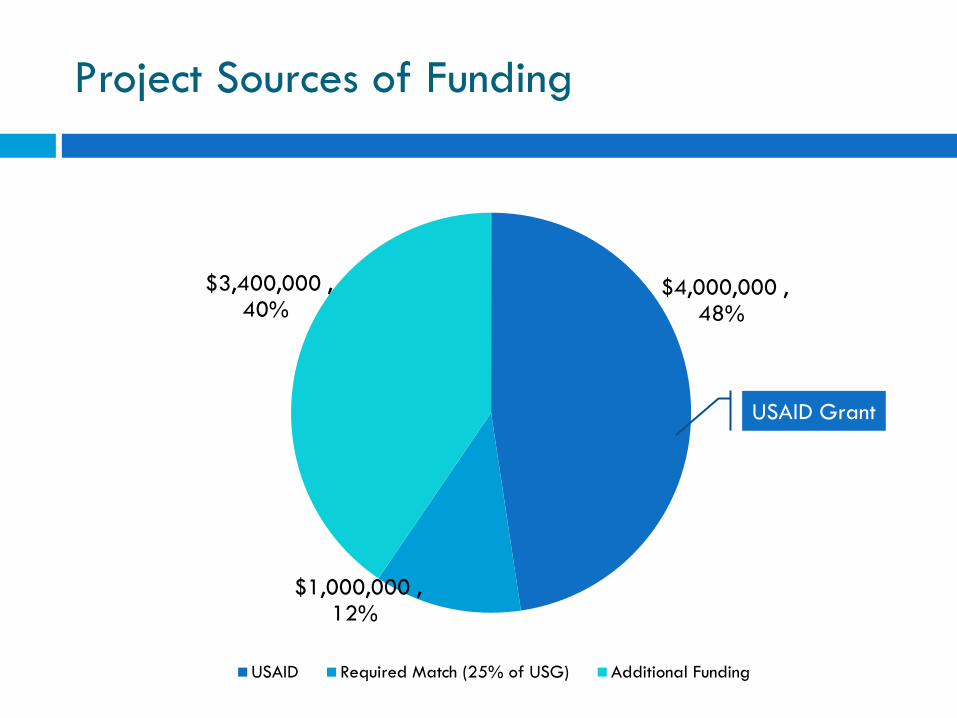
$4,000,000 , 48%
$1,000,000 , 12%
$3,400,000 , 40%
USAID Required Match (25% of USG) Additional Funding
USAID Grant
Project Sources of Funding
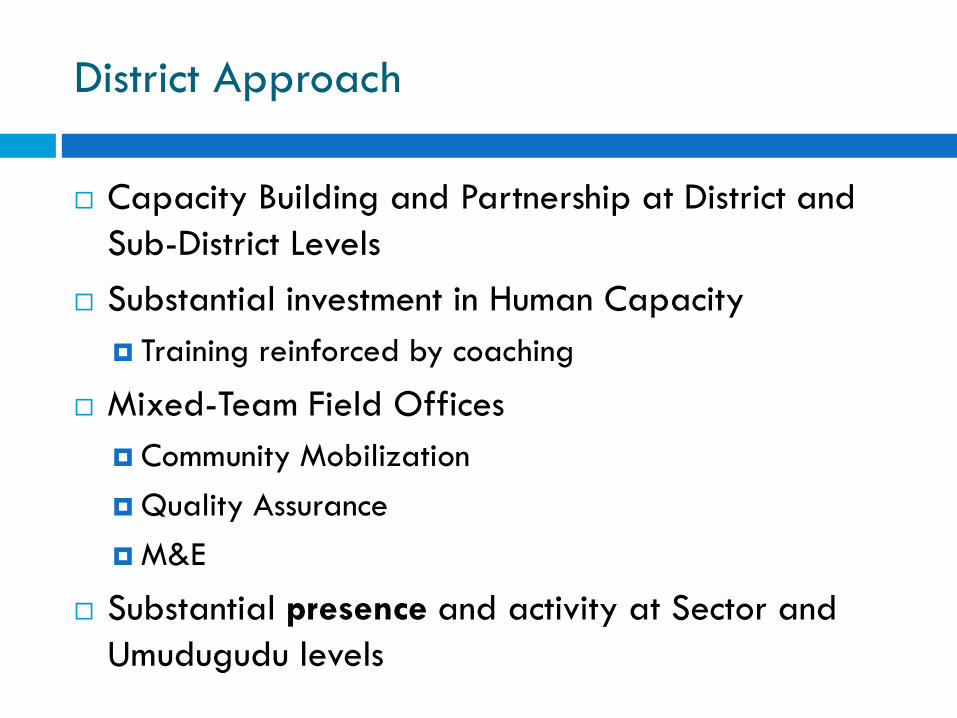
District Approach
Capacity Building and Partnership at District and Sub-District Levels
Substantial investment in Human Capacity Training reinforced by coaching
Mixed-Team Field Offices Community Mobilization Quality Assurance M&E
Substantial presence and activity at Sector and Umudugudu levels
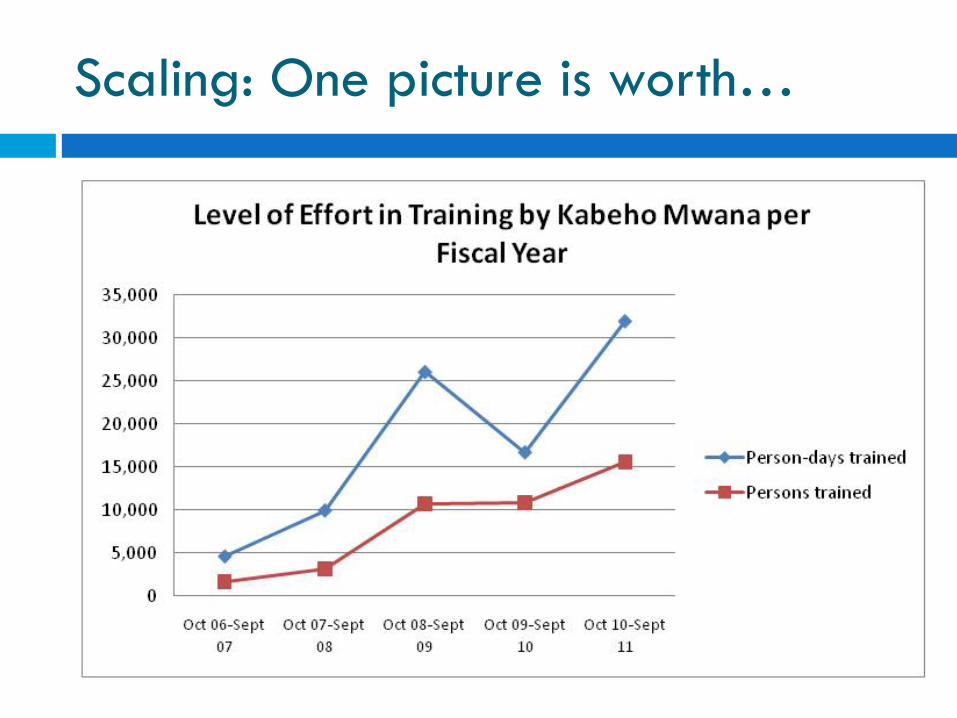
Scaling: One picture is worth…
Mixed Methods Evidence Based & Participatory
Evaluation Method
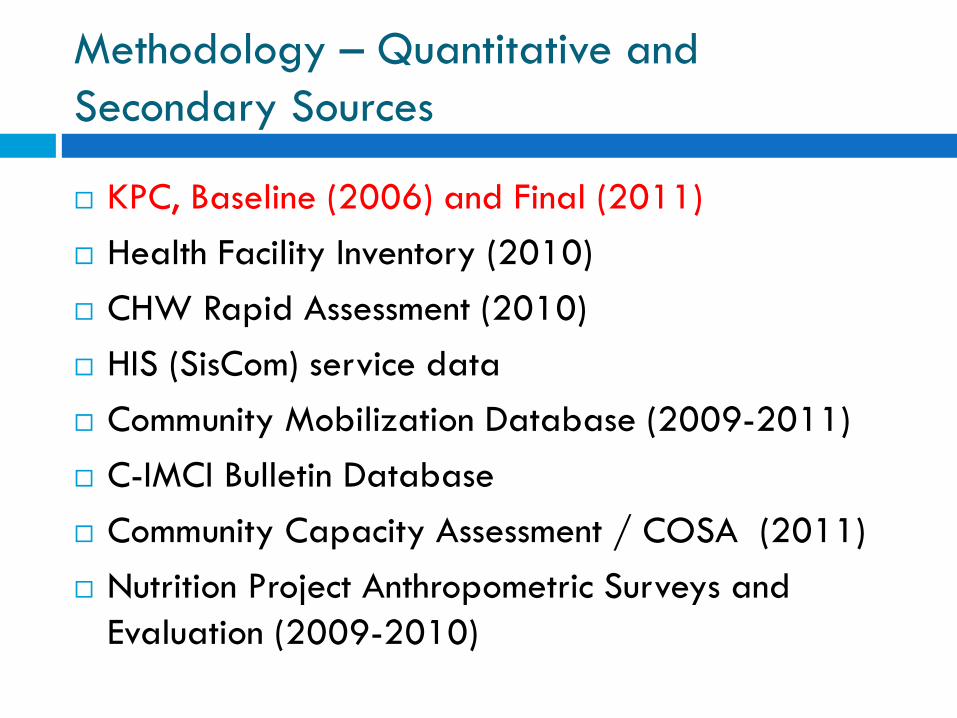
Methodology – Quantitative and Secondary Sources
KPC, Baseline (2006) and Final (2011) Health Facility Inventory (2010) CHW Rapid Assessment (2010) HIS (SisCom) service data Community Mobilization Database (2009-2011) C-IMCI Bulletin Database Community Capacity Assessment / COSA (2011) Nutrition Project Anthropometric Surveys and
Evaluation (2009-2010)
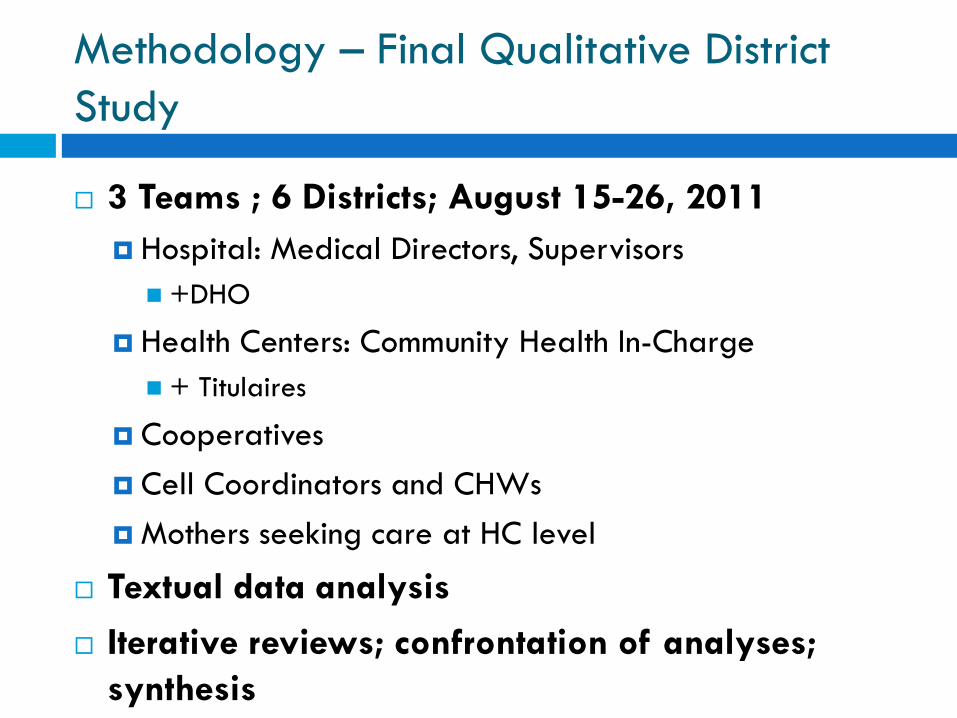
Methodology – Final Qualitative District Study
3 Teams ; 6 Districts; August 15-26, 2011 Hospital: Medical Directors, Supervisors +DHO
Health Centers: Community Health In-Charge + Titulaires
Cooperatives Cell Coordinators and CHWs Mothers seeking care at HC level
Textual data analysis
Iterative reviews; confrontation of analyses; synthesis
Central Level Consultations
Community Health Desk PNILP Nutrition Desk UNICEF MCHIP USAID School of Public Health
Conducted with Dr Laban Tsuma, MCHIP
A Methodological Challenge
Attribution? Contribution?
MOH energy c-IMCI = a moving target
Child Health Achievements
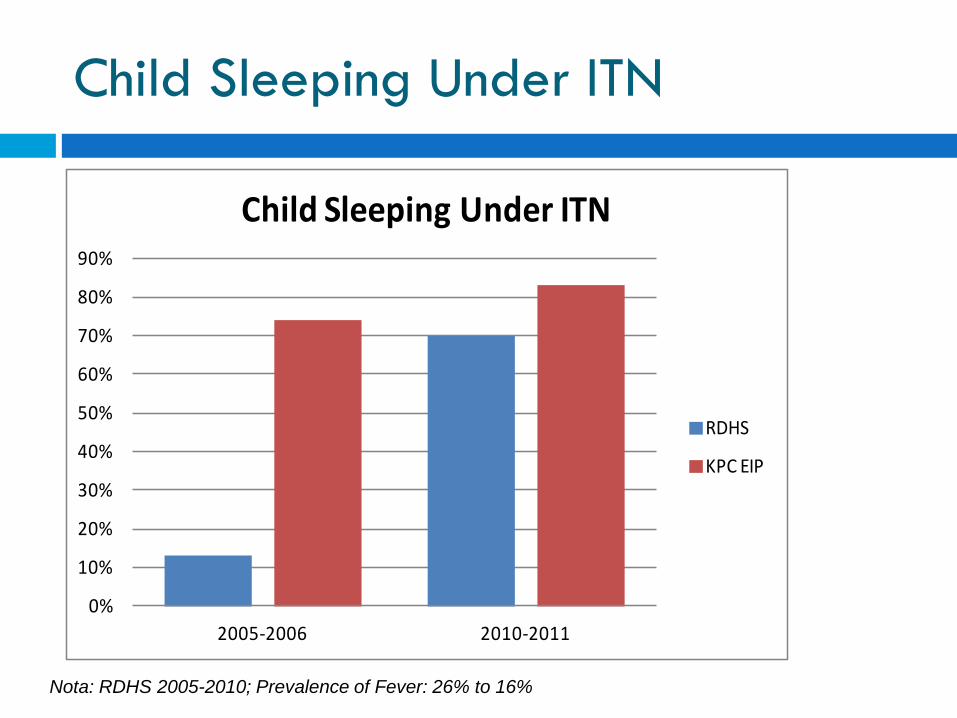
Child Sleeping Under ITN
Nota: RDHS 2005-2010; Prevalence of Fever: 26% to 16%
0%
10%
20%
30%
40%
50%
60%
70%
80%
90%
2005-2006 2010-2011
Child Sleeping Under ITN
RDHS
KPC EIP
0%
10%
20%
30%
40%
50%
60%
70%
80%
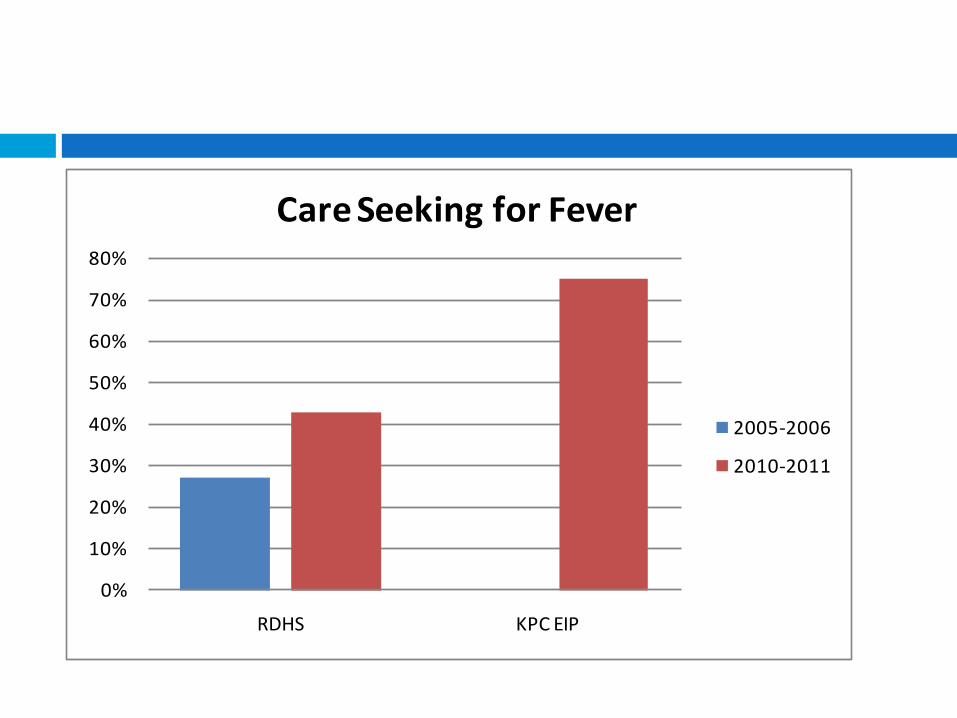
RDHS KPC EIP
Care Seeking for Fever
2005-2006
2010-2011
0%
5%
10%
15%
20%
25%
30%
35%
40%
45%
50%
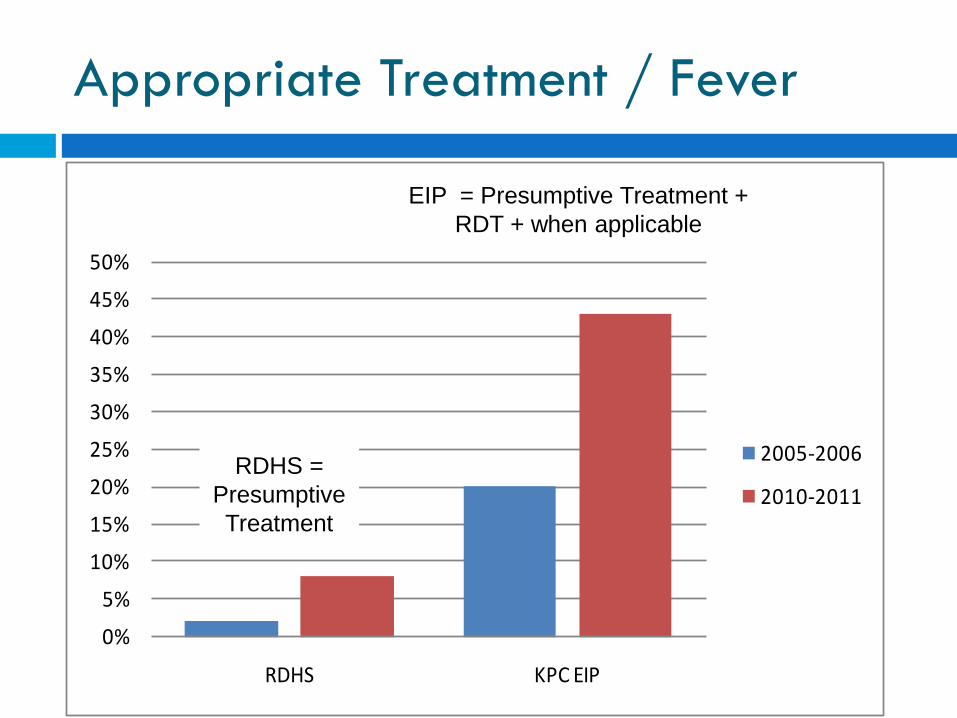
RDHS KPC EIP
Appropriate Treatment of Fever
2005-2006
2010-2011
Appropriate Treatment / Fever
RDHS = Presumptive Treatment
EIP = Presumptive Treatment + RDT + when applicable
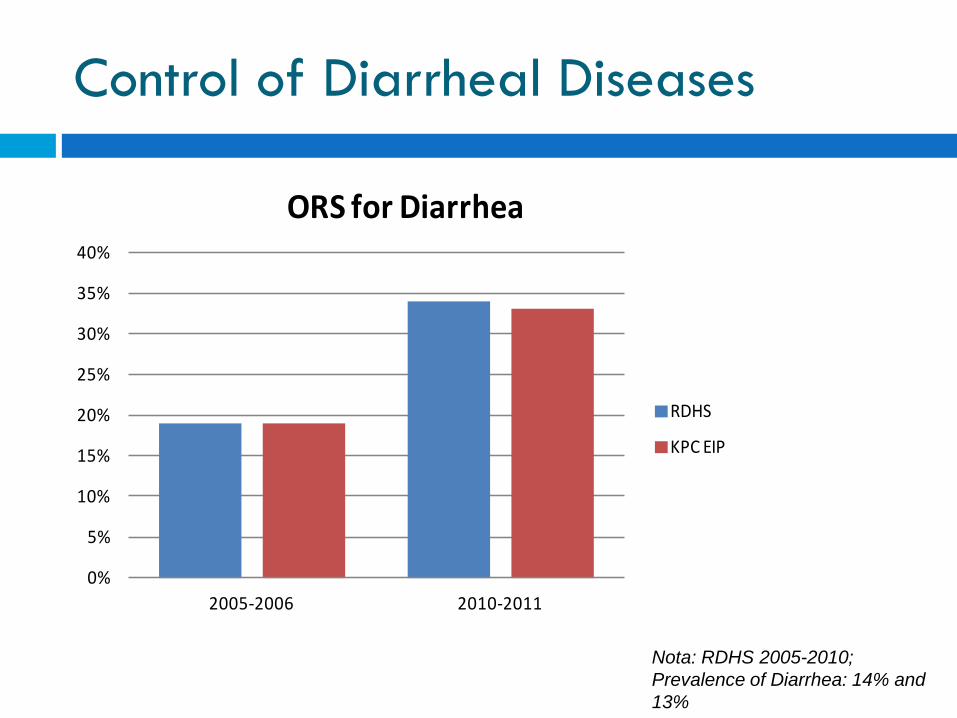
Control of Diarrheal Diseases
Nota: RDHS 2005-2010; Prevalence of Diarrhea: 14% and 13%
0%
5%
10%
15%
20%
25%
30%
35%
40%
2005-2006 2010-2011
ORS for Diarrhea
RDHS
KPC EIP
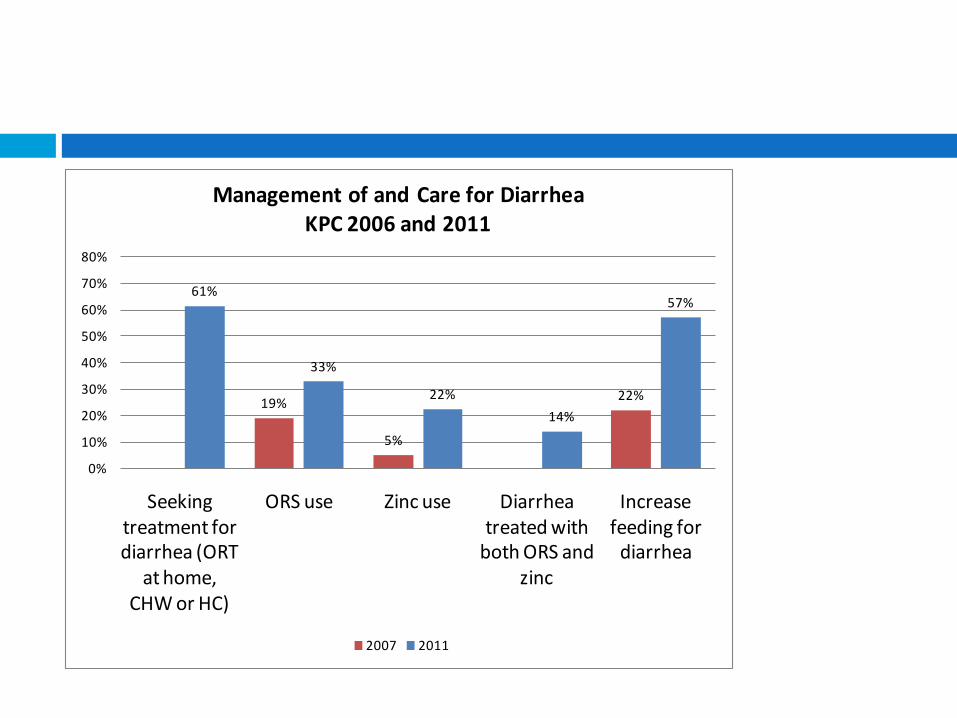
19%
5%
22%
61%
33%
22%14%
57%
0%
10%
20%
30%
40%
50%
60%
70%
80%
Seeking treatment for diarrhea (ORT
at home, CHW or HC)
ORS use Zinc use Diarrhea treated with
both ORS and zinc
Increase feeding for
diarrhea
Management of and Care for DiarrheaKPC 2006 and 2011
2007 2011
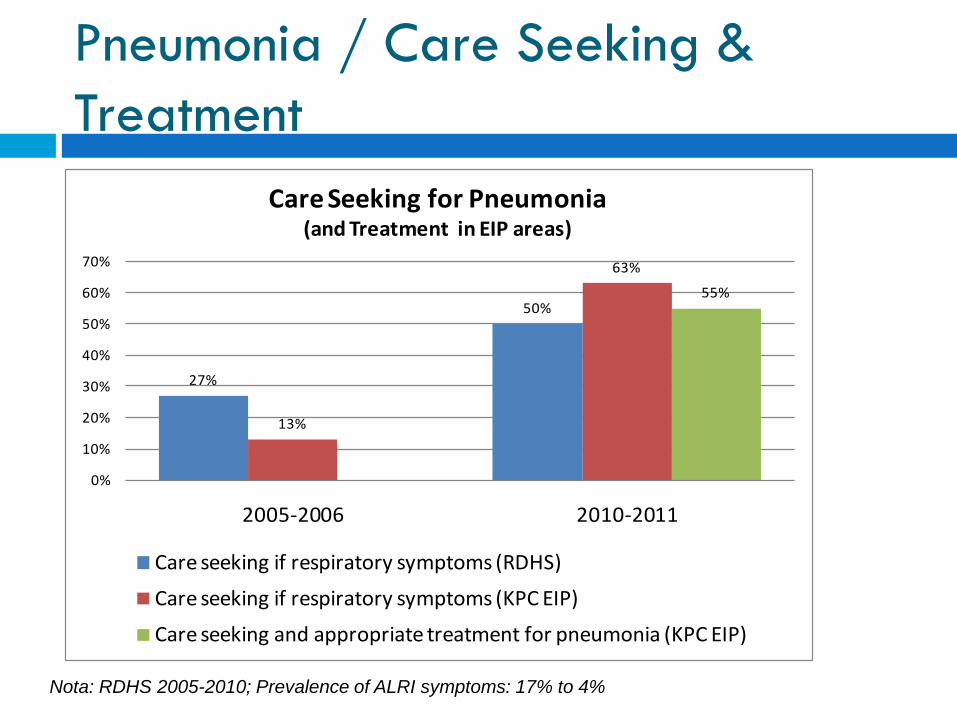
Pneumonia / Care Seeking & Treatment
Nota: RDHS 2005-2010; Prevalence of ALRI symptoms: 17% to 4%
27%
50%
13%
63%
55%
0%
10%
20%
30%
40%
50%
60%
70%
2005-2006 2010-2011
Care Seeking for Pneumonia (and Treatment in EIP areas)
Care seeking if respiratory symptoms (RDHS)
Care seeking if respiratory symptoms (KPC EIP)
Care seeking and appropriate treatment for pneumonia (KPC EIP)
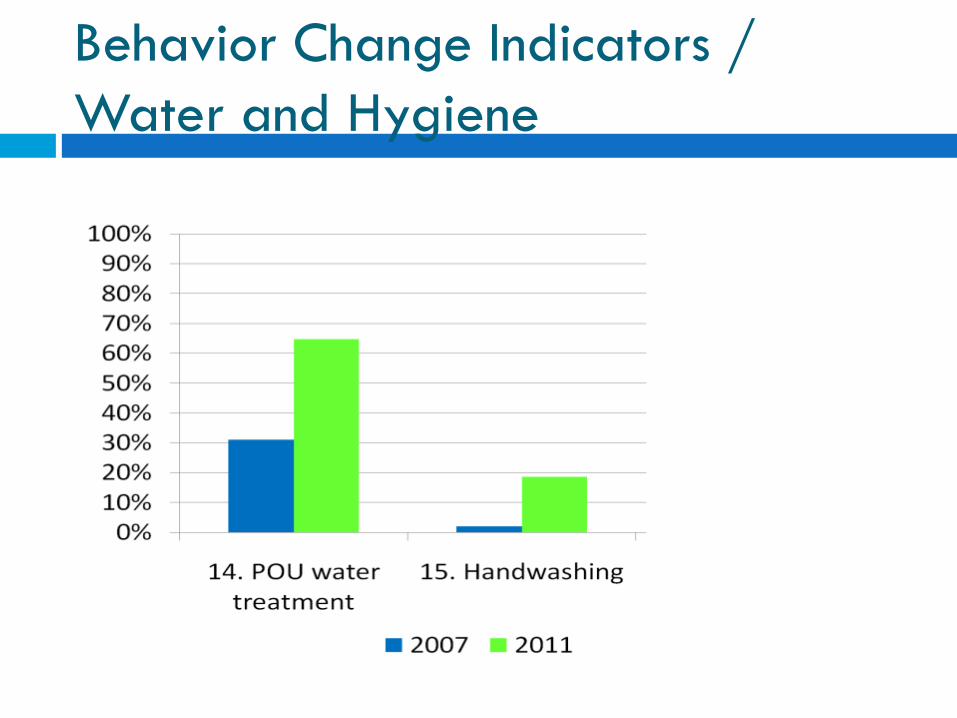
Behavior Change Indicators / Water and Hygiene
1- Expanding CCM in 6 Districts
Strategic Contributions
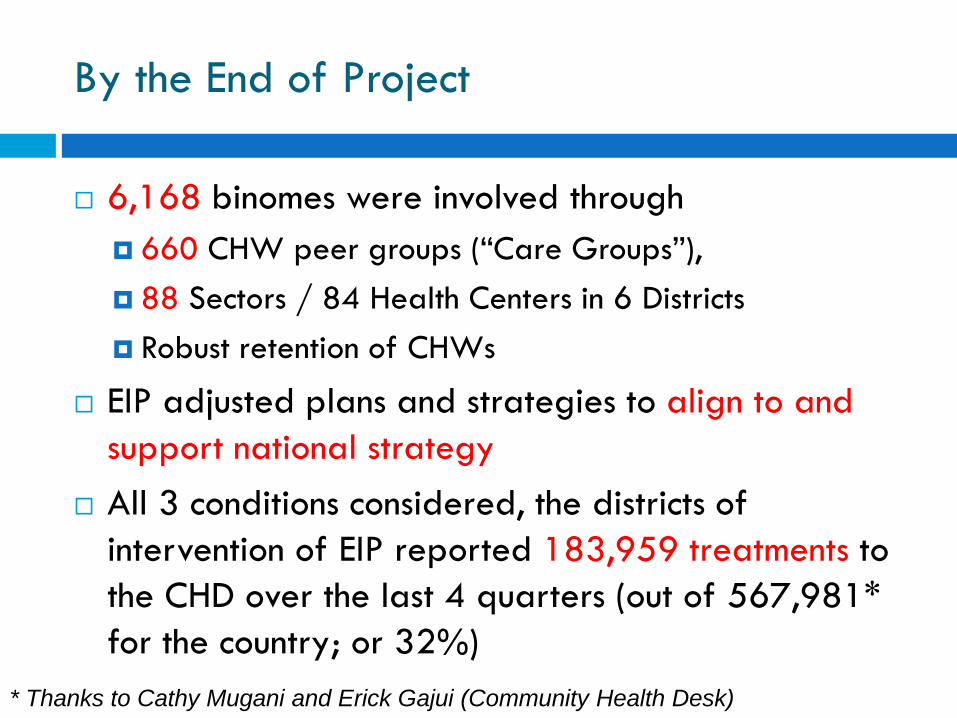
By the End of Project
6,168 binomes were involved through 660 CHW peer groups (“Care Groups”), 88 Sectors / 84 Health Centers in 6 Districts Robust retention of CHWs
EIP adjusted plans and strategies to align to and support national strategy
All 3 conditions considered, the districts of intervention of EIP reported 183,959 treatments to the CHD over the last 4 quarters (out of 567,981* for the country; or 32%)
* Thanks to Cathy Mugani and Erick Gajui (Community Health Desk)
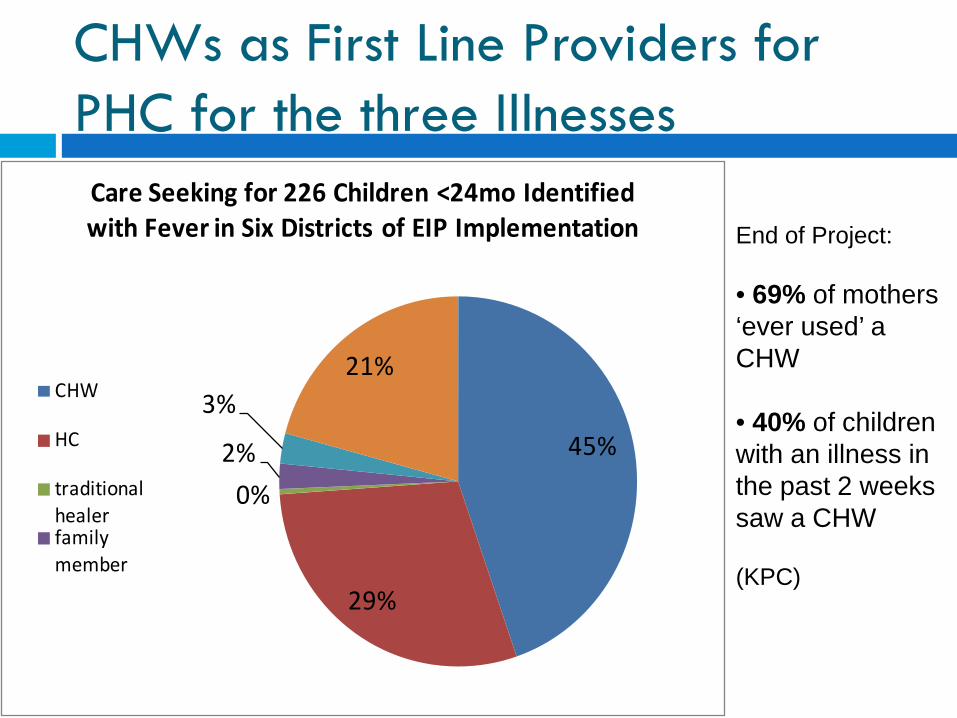
CHWs as First Line Providers for PHC for the three Illnesses
45%
29%
0%2%
3%21%
Care Seeking for 226 Children <24mo Identified with Fever in Six Districts of EIP Implementation
CHW
HC
traditional healerfamily member
End of Project: • 69% of mothers ‘ever used’ a CHW • 40% of children with an illness in the past 2 weeks saw a CHW (KPC)
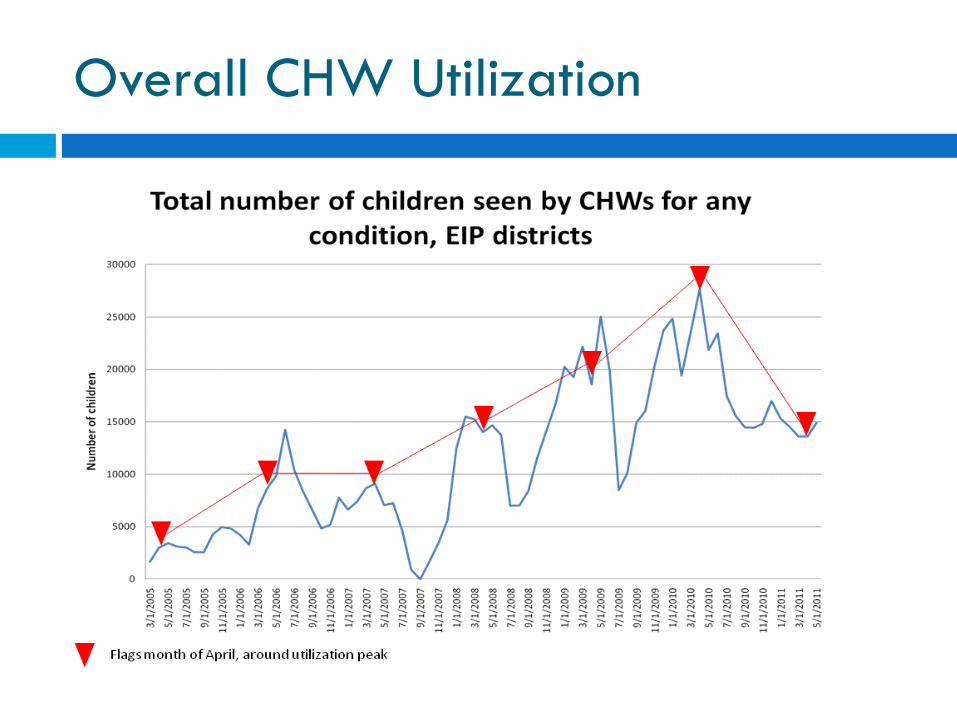
Overall CHW Utilization
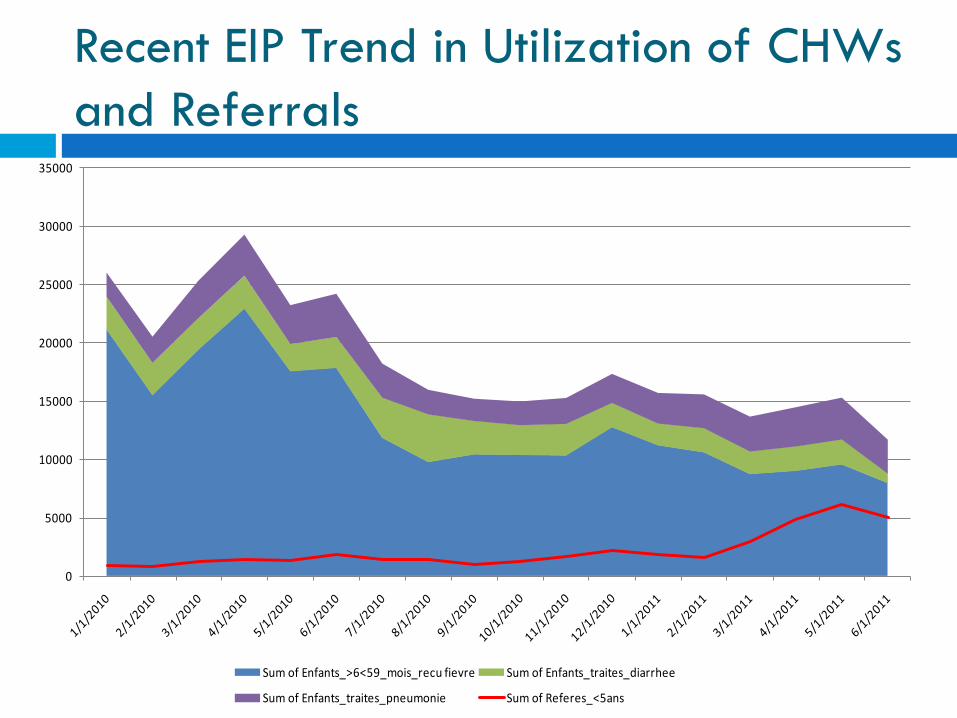
Recent EIP Trend in Utilization of CHWs and Referrals
0
5000
10000
15000
20000
25000
30000
35000
Sum of Enfants_>6<59_mois_recu fievre Sum of Enfants_traites_diarrhee
Sum of Enfants_traites_pneumonie Sum of Referes_<5ans
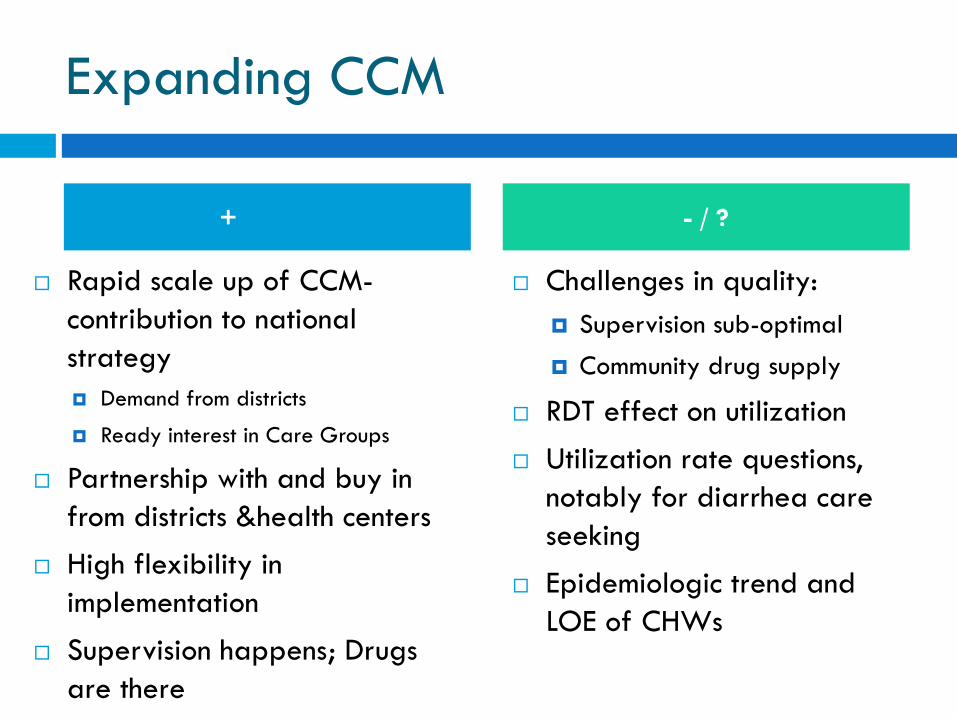
Expanding CCM
Rapid scale up of CCM-contribution to national strategy Demand from districts
Ready interest in Care Groups
Partnership with and buy in from districts &health centers
High flexibility in implementation
Supervision happens; Drugs are there
Challenges in quality: Supervision sub-optimal Community drug supply
RDT effect on utilization Utilization rate questions,
notably for diarrhea care seeking
Epidemiologic trend and LOE of CHWs
+ - / ?
2- Quality of Care
Strategic Contributions
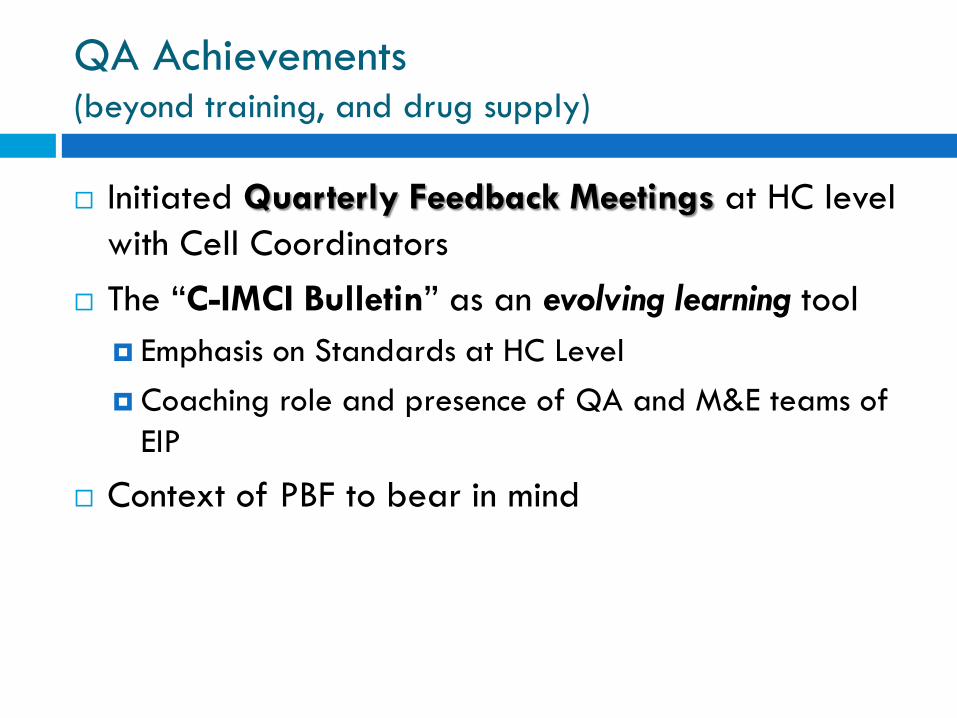
QA Achievements (beyond training, and drug supply)
Initiated Quarterly Feedback Meetings at HC level with Cell Coordinators
The “C-IMCI Bulletin” as an evolving learning tool Emphasis on Standards at HC Level Coaching role and presence of QA and M&E teams of
EIP
Context of PBF to bear in mind
a. Health Promotion and Communication b. THE ‘CARE GROUPS’* IN THE C-IMCI
ARCHITECTURE OF RWANDA
c. * CHW Peer-Support and Collaboration Groups
3- Community Mobilization
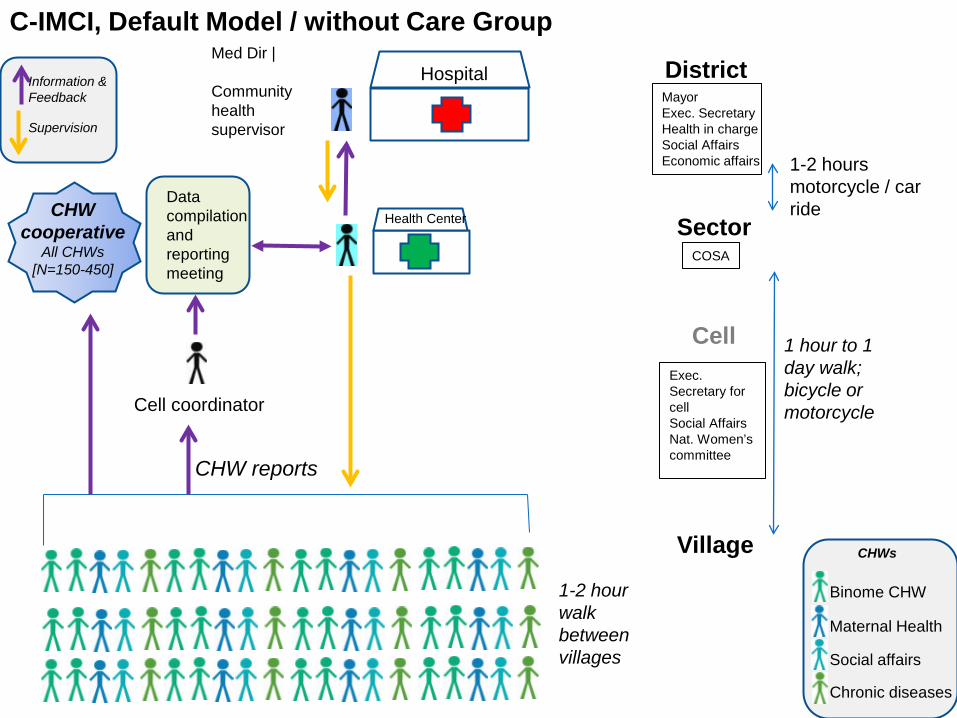
Med Dir | Community health supervisor
CHW cooperative
All CHWs [N=150-450]
Cell coordinator
CHW reports
C-IMCI, Default Model / without Care Group
Hospital
Health Center
Information & Feedback
Supervision
Sector COSA
1-2 hours motorcycle / car ride
Mayor Exec. Secretary Health in charge Social Affairs Economic affairs
District
Village
Exec. Secretary for cell Social Affairs Nat. Women’s committee
Cell 1 hour to 1 day walk; bicycle or motorcycle
1-2 hour walk between villages
Binome CHW
Maternal Health
Social affairs
Chronic diseases
CHWs
Data compilation and reporting meeting
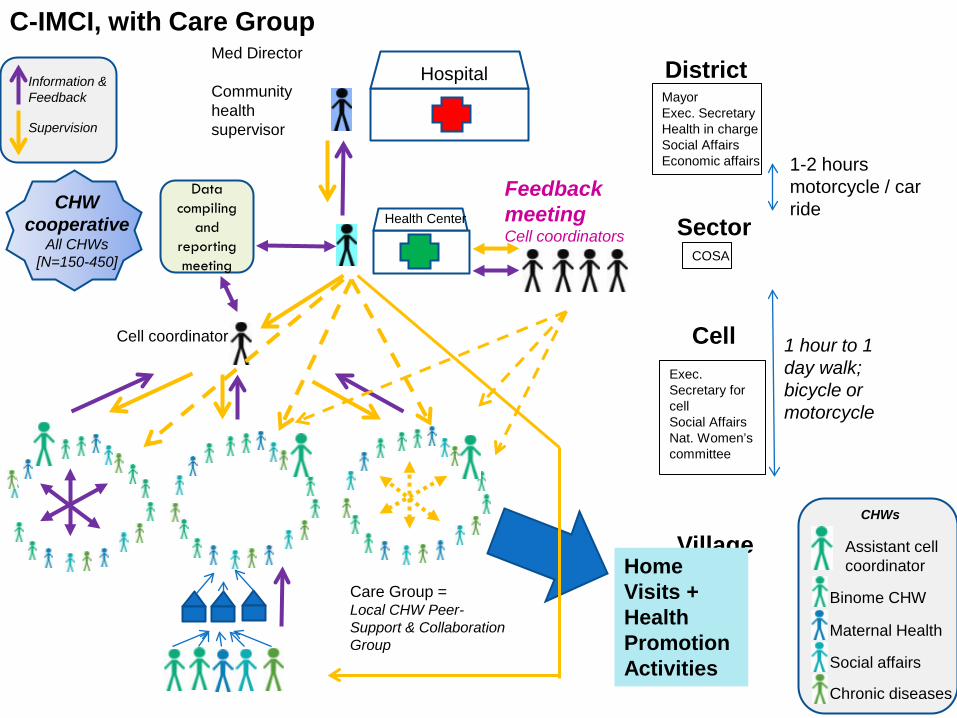
Data compiling
and reporting meeting
Med Director Community health supervisor
CHW cooperative
All CHWs [N=150-450]
Feedback meeting Cell coordinators
Cell coordinator
C-IMCI, with Care Group
Hospital
Health Center
Information & Feedback
Supervision
Care Group = Local CHW Peer-Support & Collaboration Group
Sector COSA
1-2 hours motorcycle / car ride
Mayor Exec. Secretary Health in charge Social Affairs Economic affairs
District
Village
Exec. Secretary for cell Social Affairs Nat. Women’s committee
Cell 1 hour to 1 day walk; bicycle or motorcycle
Binome CHW
Maternal Health
Social affairs
Chronic diseases
CHWs
Assistant cell coordinator Home
Visits + Health Promotion Activities
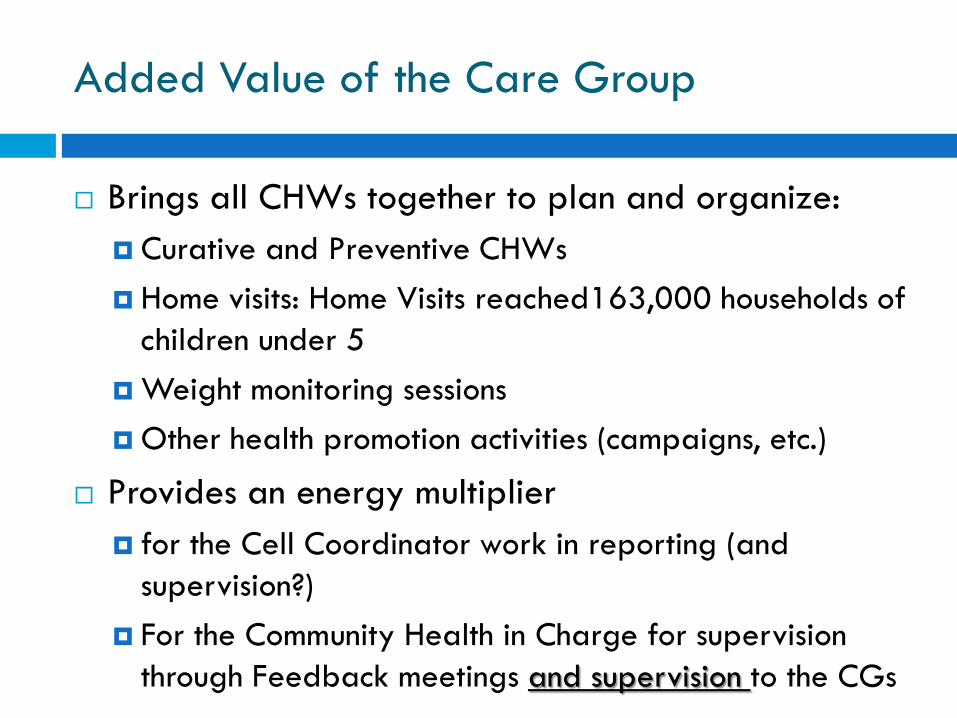
Added Value of the Care Group
Brings all CHWs together to plan and organize: Curative and Preventive CHWs Home visits: Home Visits reached163,000 households of
children under 5 Weight monitoring sessions Other health promotion activities (campaigns, etc.)
Provides an energy multiplier for the Cell Coordinator work in reporting (and
supervision?) For the Community Health in Charge for supervision
through Feedback meetings and supervision to the CGs
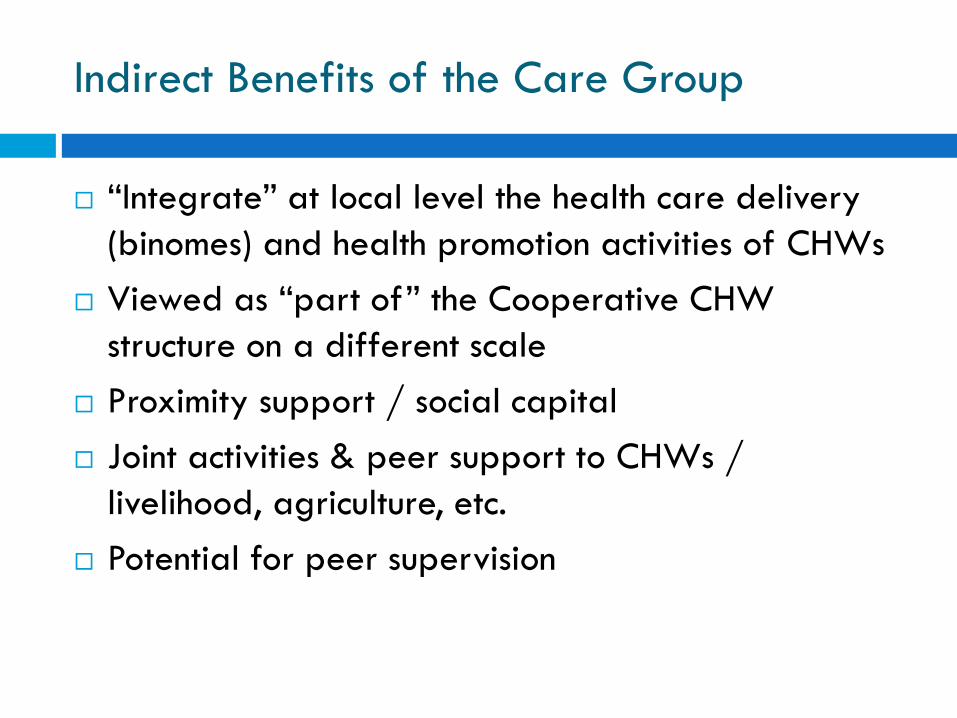
Indirect Benefits of the Care Group
“Integrate” at local level the health care delivery (binomes) and health promotion activities of CHWs
Viewed as “part of” the Cooperative CHW structure on a different scale
Proximity support / social capital Joint activities & peer support to CHWs /
livelihood, agriculture, etc. Potential for peer supervision
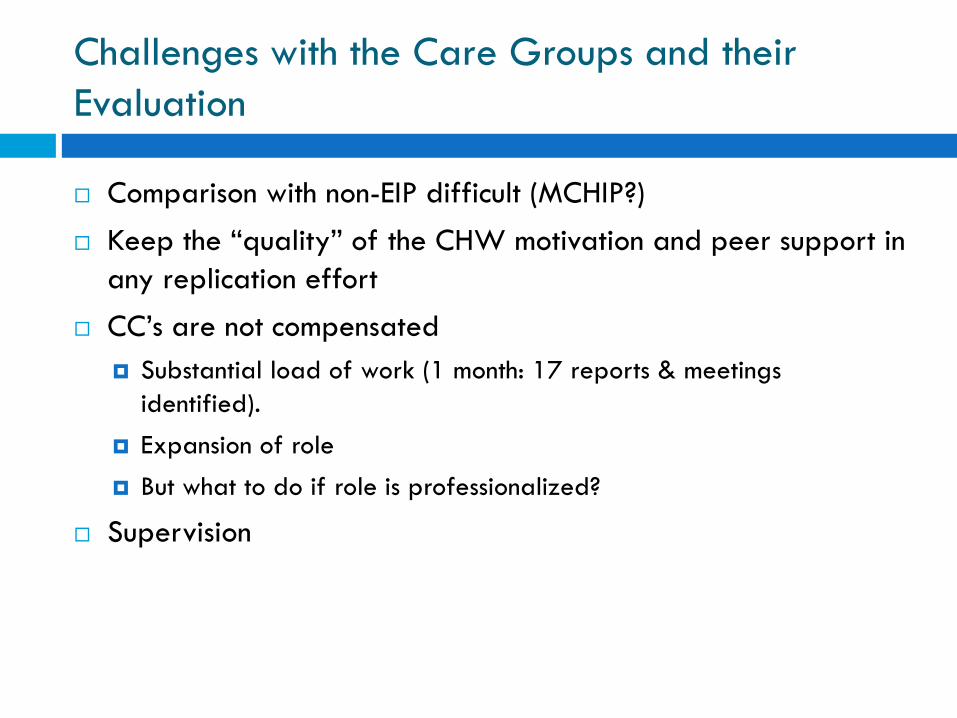
Challenges with the Care Groups and their Evaluation
Comparison with non-EIP difficult (MCHIP?) Keep the “quality” of the CHW motivation and peer support in
any replication effort CC’s are not compensated
Substantial load of work (1 month: 17 reports & meetings identified).
Expansion of role But what to do if role is professionalized?
Supervision
Conclusions
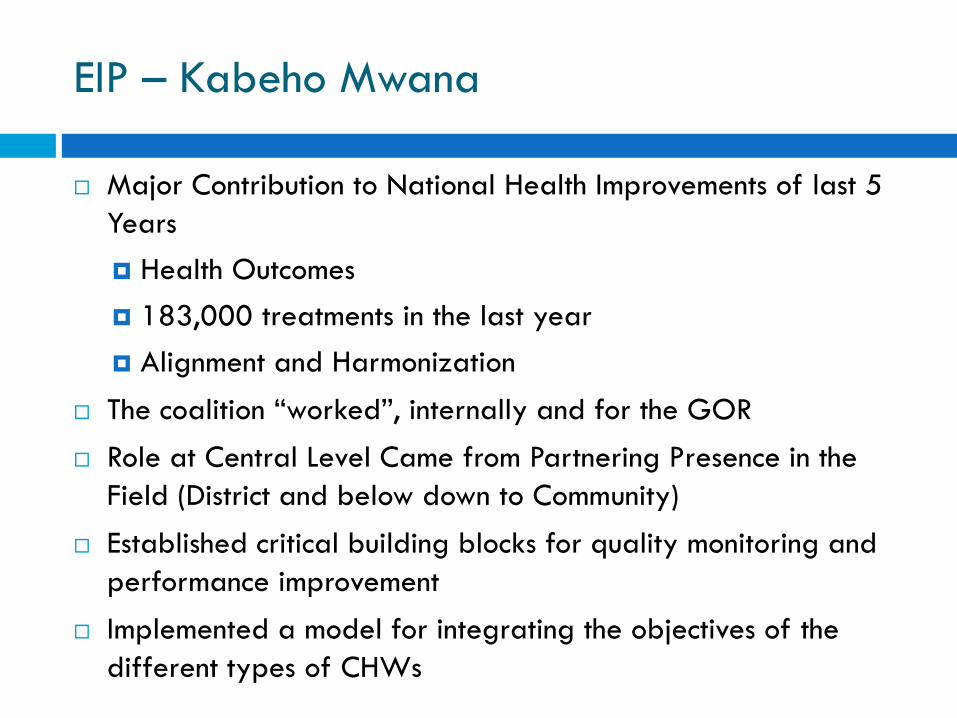
EIP – Kabeho Mwana
Major Contribution to National Health Improvements of last 5 Years Health Outcomes 183,000 treatments in the last year Alignment and Harmonization
The coalition “worked”, internally and for the GOR Role at Central Level Came from Partnering Presence in the
Field (District and below down to Community)
Established critical building blocks for quality monitoring and performance improvement
Implemented a model for integrating the objectives of the different types of CHWs
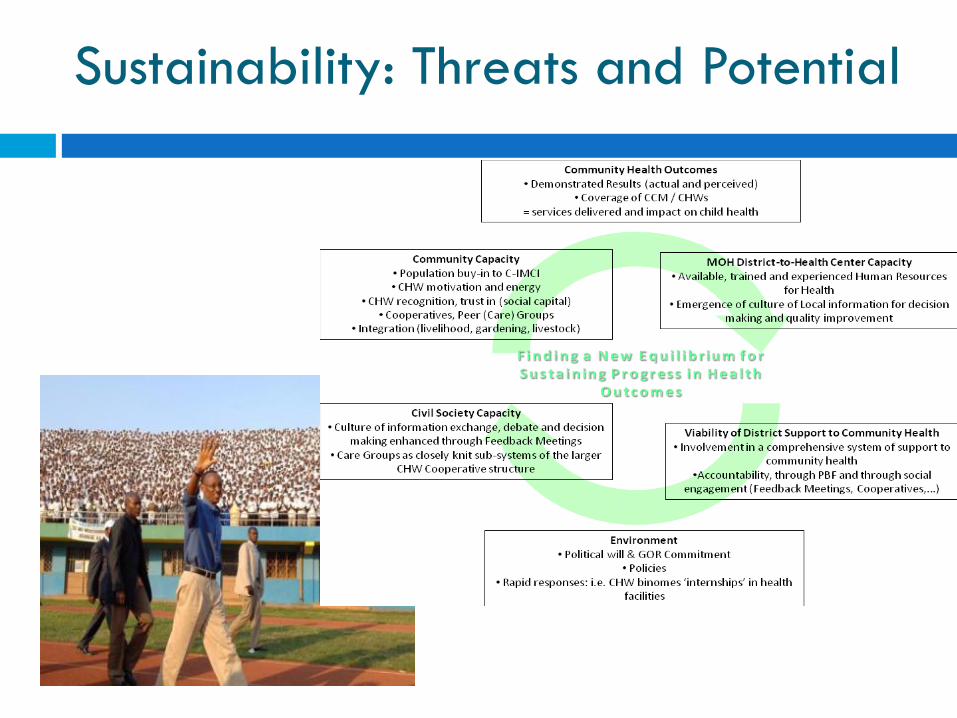
Sustainability: Threats and Potential
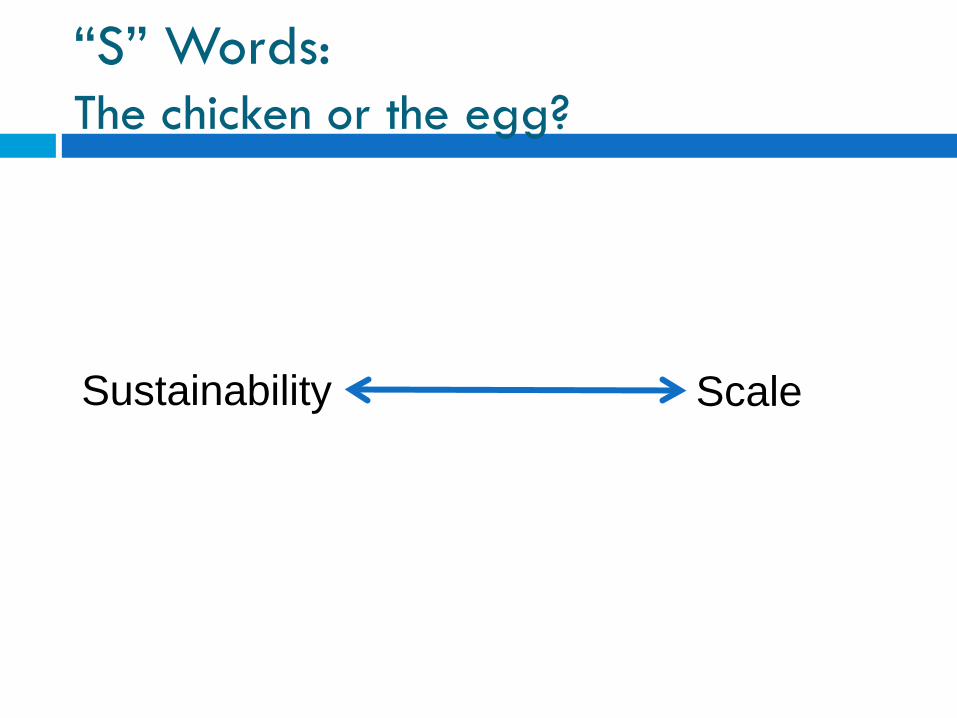
“S” Words: The chicken or the egg?
Sustainability Scale
Suggestions / Recommendations
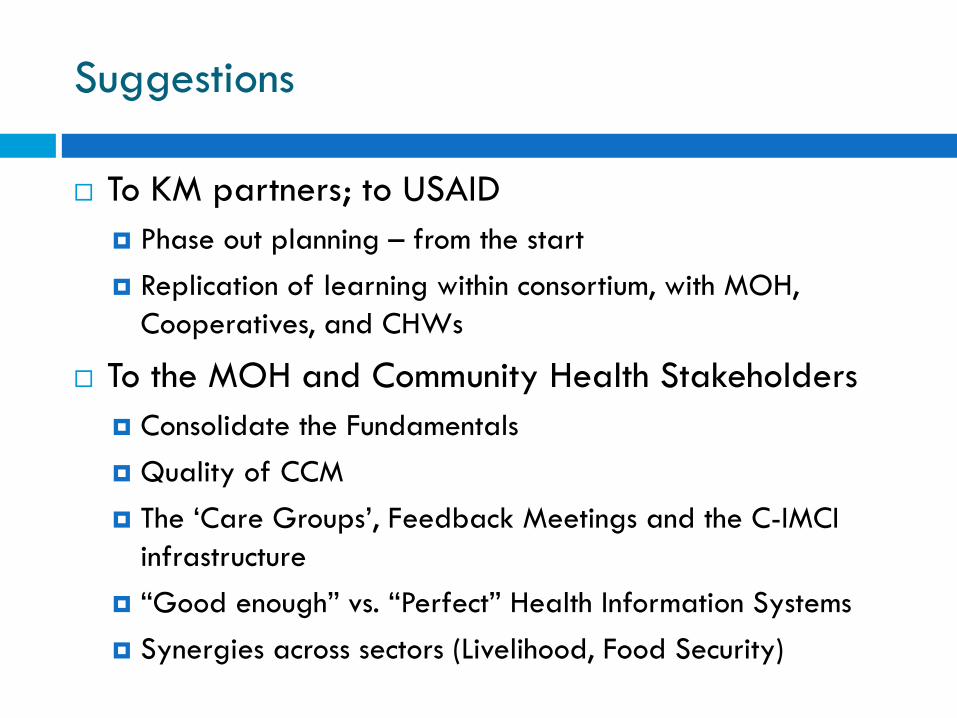
Suggestions
To KM partners; to USAID Phase out planning – from the start Replication of learning within consortium, with MOH,
Cooperatives, and CHWs
To the MOH and Community Health Stakeholders Consolidate the Fundamentals Quality of CCM The ‘Care Groups’, Feedback Meetings and the C-IMCI
infrastructure “Good enough” vs. “Perfect” Health Information Systems Synergies across sectors (Livelihood, Food Security)
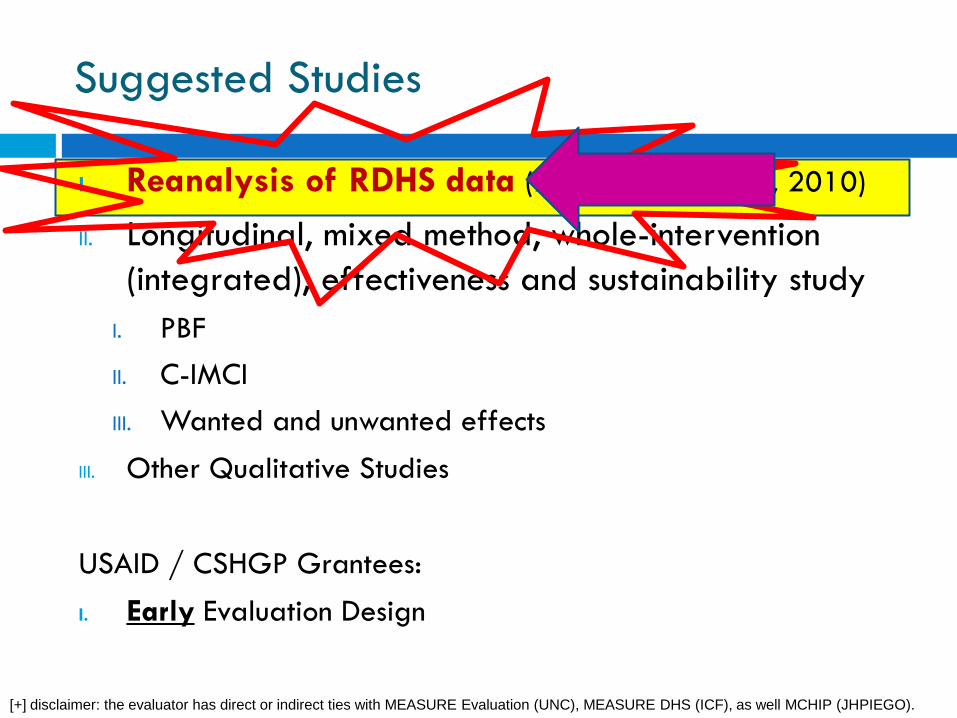
Suggested Studies
I. Reanalysis of RDHS data (2005, 2007-2008, 2010)
II. Longitudinal, mixed method, whole-intervention (integrated), effectiveness and sustainability study
I. PBF II. C-IMCI III. Wanted and unwanted effects
III. Other Qualitative Studies
USAID / CSHGP Grantees: I. Early Evaluation Design
[+] disclaimer: the evaluator has direct or indirect ties with MEASURE Evaluation (UNC), MEASURE DHS (ICF), as well MCHIP (JHPIEGO).
Congratulations and Thank You