Embed Size (px)
Citation preview

Community Change
• Species turnover• Succession–Replacement of one type of
community by another–Nonseasonal directional pattern of
colonization & extinction of species

Succession
• Apparently orderly change in community composition through time
• venerable subject in community ecology• mechanisms that drive succession?
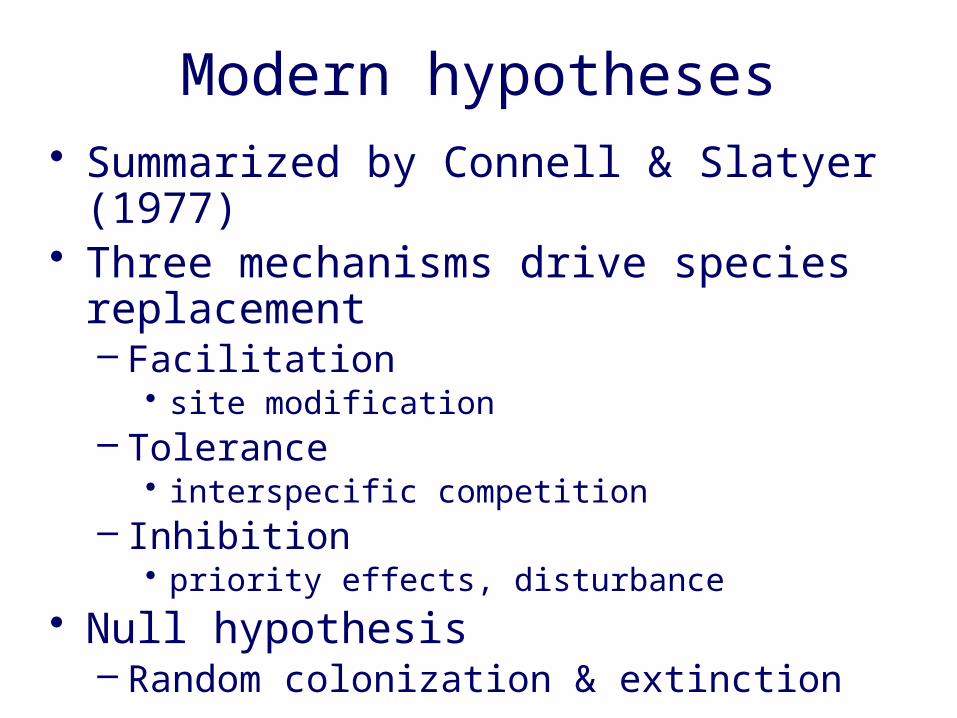
Modern hypotheses• Summarized by Connell & Slatyer (1977)• Three mechanisms drive species
replacement– Facilitation
• site modification– Tolerance
• interspecific competition– Inhibition
• priority effects, disturbance
• Null hypothesis– Random colonization & extinction

Facilitation hypothesis
• Early species make site more suitable for later species
• Early species only are capable of colonizing barren sites– specialists on disturbed sites
• Climax species facilitate their own offspring• Primary process: Site modification (soil)

Tolerance hypothesis• Later species outcompete early species• Adults of any species could grow in a site• Which species starts succession
– Chance– Dispersal ability
• Early species have no effect on later species• Later species replace early species by competition• Climax species are the best competitors• Primary process: Interspecific competition

Inhibition hypothesis• Adults of any species could live at a site• Which species starts succession
– Chance– Dispersal ability
• Early species inhibit (out compete) later species– Persist until disturbed
• Later species replace early species after disturbance
• Climax species are most resistant to disturbance• Primary process: Priority effects

Random colonization hypothesis• Nothing but chance determines succession• No competition, no facilitation, no inhibition• Colonists arrive at random• Species in the community go extinct at
random

Resource ratios and succession
• Based on Tilman & Wedin 1991a, 1991b• As secondary succession procedes:
– soil N increases over time– light at soil surface decreases over time
• Consider light and soil resource (N) as two essential resources
• Successional sequence of species may result from changing resource ratios

Light
NLATE
EARLY
12
23
43
Resource ratio hypothesis of succession
Resource ratio hypothesis of succession
SUCCESION

Resource ratiohypothesis of succession
• Early species (3, 4) are good competitors for N• Late species (1, 2) are good competitors for light• Resource competition drives succession• Alternative succession hypotheses e.g.,
colonization-competition hypothesis– early - good dispersers, poor competitors– late - good competitors, poor dispersers– most similar to tolerance hypotheses

Experimental tests of the resource ratio hypothesis of succession
• Test resource competition theory for this system– determine R*
for N a set of species
– determine whether R* values predict the competitive winners: Low R* high competitive ability
• Test resource ratio hypothesis of succession– determine R* for N for a set of species– test prediction that R* is low for early species– test prediction that early species win in competition
• possible to refute one or both

Old field successional grasses
• 5 species studied• Agrostis scabra (As) Early Native• Agropyron repens (Ar) Early Introd.• Poa pratensis (Pp) Mid Introd.• Schizachyrium scoparium (Ss) Late Native• Andropogon gerardi (Ag) Late Native

% cover during succession

Predictions based on RR hypothesis for succession
• R* for N• As < Ar < Pp < Ss < Ag• In competition for N
–As best–Ag worst

Experimental gardens• Bulldoze to 60 - 80 cm … bare
sand–N = 90 mg/kg
• Add topsoil (0% to 100%) & mix• 4 N levels
1 2 3 40 - 20% 40 - 55% 70-100% 100%+ 6.55 g/m2/yr
180 mg/kg 460 mg/kg 800 mg/kg 1000 mg/kg

Determining R*
• Raise each species in monoculture• After 3 yr. determine Soil N (R*)• Also determine:
–Root mass–Shoot mass–Root:Shoot –Reproductive mass–Viable seed production

Measured R* values
• Soil NO3 –As > Ar, Pp > Ss, Ag
• Soil NH4
–As, Ar > Pp, Ss, Ag• Does not support RR
hypothesis of succession

Root masses at all N levels• Ag, Ss > Pp > Ar, As• Root mass predicts R*
– accounts for 73% of variation in R* (NO3)
– N uptake + related to root mass
log(R*)
log(root)
AsAr Pp
SsAg
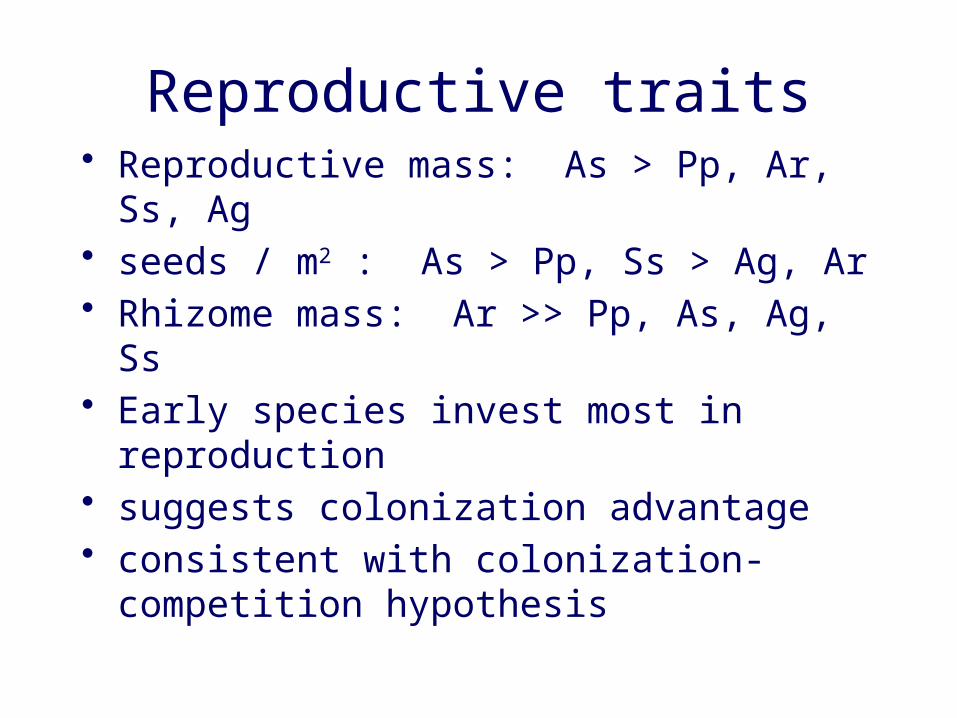
Reproductive traits• Reproductive mass: As > Pp, Ar, Ss, Ag• seeds / m2 : As > Pp, Ss > Ag, Ar• Rhizome mass: Ar >> Pp, As, Ag, Ss• Early species invest most in reproduction• suggests colonization advantage• consistent with colonization- competition
hypothesis
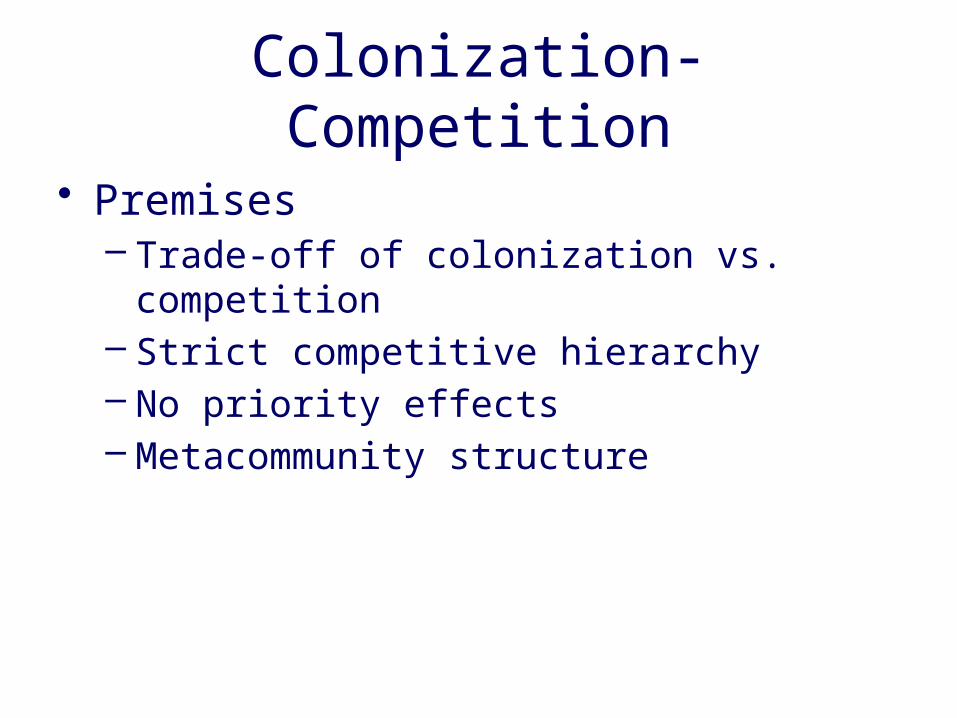
Colonization-Competition
• Premises– Trade-off of colonization vs. competition– Strict competitive hierarchy– No priority effects– Metacommunity structure

Does R* = competitive ability?• If low R* competitive ability:
– resource competition theory is incorrect– succession may still be driven by resource
ratios• If low R* = competitive ability:
– resource competition theory is correct– resource ratio hypothesis is refuted
• 3 pairwise competition experiments

Competition experiments• Schizachyrium scoparium vs. Agrostis
scaber• Andropogon gerardi vs. Agrostis scaber• Agropyron repens vs. Agrostis scaber • Based on R*, predict As loses
– As and Ar closest, longest time to exclusion• seedling ratios 80:20, 50:50, 20:80• 3 soil N levels (1, 2, 3)
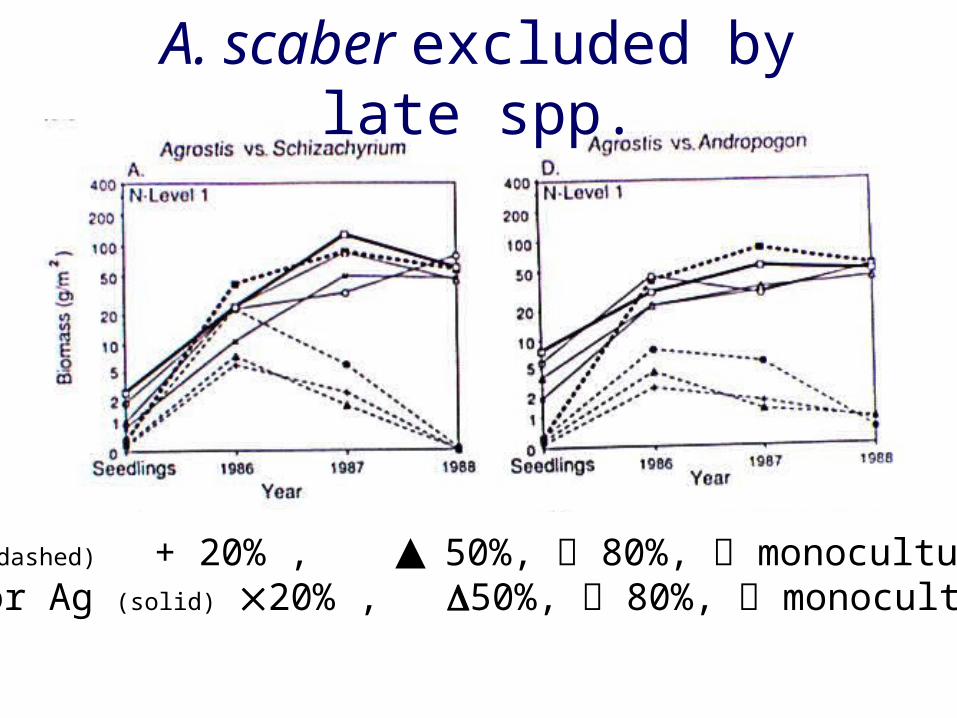
A. scaber excluded by late spp.
As (dashed) + 20% , 50%, 80%, monocultureSs or Ag (solid) 20% , 50%, 80%, monoculture

As (dashed) + 20% , 50%, 80%, monocultureAr (solid) 20% , 50%, 80%, monoculture
A. scaber & A. repens - 3 yr.

Measured R* values
• Soil NO3 –As > Ar, Pp > Ss, Ag
• Soil NH4
–As, Ar > Pp, Ss, Ag• Does not support RR
hypothesis of succession
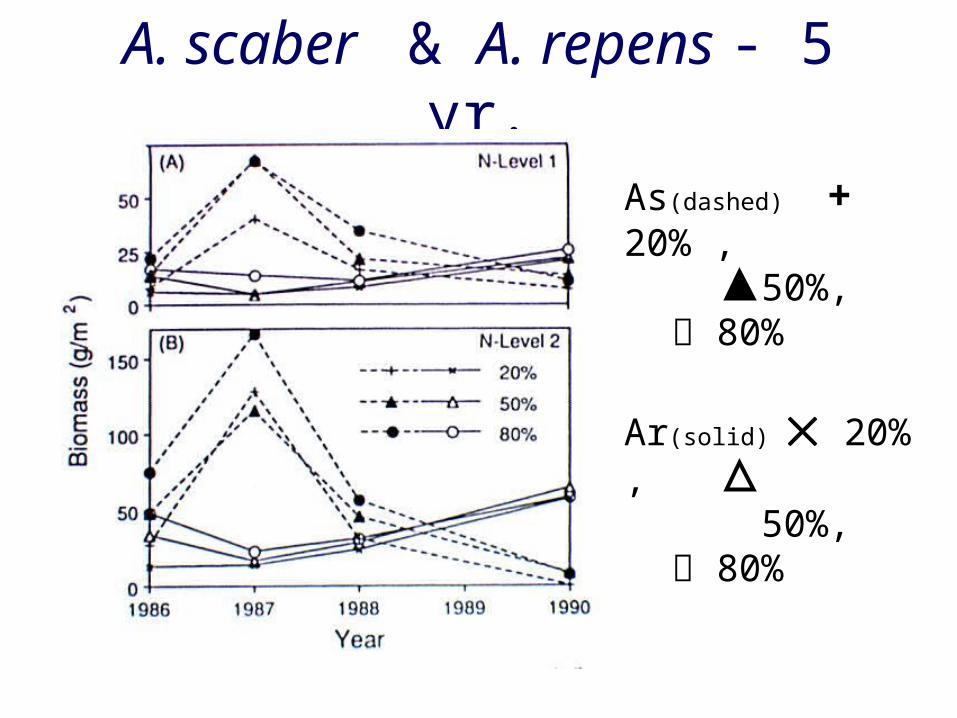
A. scaber & A. repens - 5 yr.
As(dashed) + 20% , 50%, 80%
Ar(solid) 20% , 50%, 80%

Overall conclusions
• Resource competition theory supported– R* accurately predicts competitive ability
• Resource ratio hypothesis of succession refuted– early species are the worst competitors for N
• Colonization-competition hypothesis of succession consistent with results
MetaCommunities(Leibold 2004 Ecol. Lett. 7:601-613)
• set of local communities linked by dispersal of >1 potentially interacting species
• two levels of community organization– local level – regional level
• Patterns of regional persistence of species depend on local interactions and dispersal

Spatial dynamics (regional)
• Mass effect : net flow of individuals created by differences in population size (or density) in different patches
• Rescue effect: prevention of local extinction by immigration
• Source–sink effects: enhancement of local populations by immigration into sinks, from sources

Balance between regional & local
• What determines local and regional species persistence?– Strengths of local interactions– Dispersal among locations– Patterns of spatial dynamics

Metacommunity paradigms
• Patch dynamics• Species-sorting• Mass-effect • Neutral

Metacommunity paradigms• Patch dynamics
– patches are identical & capable of containing populations
– patches occupied or unoccupied.– local diversity is limited by dispersal. – spatial dynamics dominated by local
extinction and colonization– Similar ideas to colonization-competition
hypothesis

Metacommunity paradigms• Species-sorting
– resource gradients or patch type heterogeneity cause differences in outcomes of local species interactions
–patch type partly determines local community composition.
–spatial niche separation –dispersal allows compositional
changes to track changes in local environmental conditions

Metacommunity paradigms• Mass-effect
– immigration and emigration dominate local population dynamics.
–species rescued from local competitive exclusion in communities where they are bad competitors via immigration from communities where they are good competitors

Metacommunity paradigms• Neutral
– all species are similar in their competitive ability, movement, and fitness
– population interactions consist of random walks that alter relative frequencies of species
– dynamics of diversity depend on equilibrium between species loss (extinction, emigration) and gain (immigration, speciation).

MetaCommunities
• Leibold et al. 04 Ecol. Lett.• Ellis et al. 06. Ecology.
– tested data on mosquito assemblages in Florida tree holes for consistency with the 4 paradigms
– 15 tree holes censused every 2 wk. from 1978 to 2003
– mosquito species enumerated

Ellis et al.
Ecological Niche
• Grinnell emphasized abiotic variables• Elton emphasized biotic interactions• Slightly later (1920’s & 30’s)
– Gause, Park lab experiments on competition– competitive exclusion principle– “Two species cannot occupy the same niche”

Ecological Niche
• Quantitative approaches to ecology (1960’s)• G. E. Hutchinson
– relate fitness or reproductive success (performance) to quantitative variables related to resources, space, etc.
fitne
ss
resource

More axes (dimensions)
A
B
A
B
C
Fitn
ess

In multiple dimensions… • multidimensional space describing
resource use• N-dimensional hypervolume,
expressing species response to all possible biotic & abiotic variables
• You can quantify– Niche breadth– Niche overlap

Simplified Niches of Argiope
Prey size
Web
hei
ght
A. aurantiaA. trifasciata

Simplified Niches of barnacles
Particle size
Inte
rtid
al h
eigh
t
BalanusChthamalus

Niche overlap• Literature on niche
– overlap = competition (e.g., Culver 1970)– overlap = lack of competition (e.g., Pianka
1972)

Chase-Leibold Approach• Niche axes are quantitative measures of factors in
the environment• Niche defined by
– Requirements (isoclines – amount needed for ZPG)– Impacts (vectors – effects on a factor)
• Trade-offs required for coexistence

Niche
• What was the question?– Diversity– Coexistence / Lack of coexistence– Hypotheses?
• Niche overlap/Niche breadth– Does not yield testable hypotheses
• Chase-Leibold– Testable hypotheses about requirements and impacts

Neutral theory of biodiversity
• Hubbell, SP 2001. The unified neutral theory of biodiversity and biogeography. Princeton Univ. Press.
• see also Chase & Leibold ch. 11• Reading: Adler et al. Ecol. Lett. 10:95–
104.
Understanding species diversity
• Hubbell is interested in biodiversity in the narrow sense– biodiversity = species diversity– S, E– Conservation biology and policy oriented
discussions use a broader definition• Hubbell specifically considers diversity
within a tropic level– e.g., trees, or other primary producers

Neutrality• Does not mean that species
interactions are absent or unimportant• Neutrality: all individuals and species
are the same in all relevant properties– hence random processes are what govern
community dynamics– differs from "neutral models" used to test
statistically for presence of ecological interactions

Understanding diversity
• Niche assembly perspective– diversity is a result of interspecific differences
– trade-offs -- that enable species to coexist despite the diversity-eroding effects of competition
– assembly of communities governed by rules about which species can coexist
– typically tied to equilibrium conditions
Understanding diversity
• Dispersal assembly perspective– diversity is a result of chance and history, and
the balance between species arrival and loss– arrival = colonization, speciation– loss = extinction– assembly of communities governed chance– despite name, need not be based on
dispersal– species all equivalent, hence there are no
rules about coexistence

MacArthur & Wilson
• equilibrium theory of island biogeography
• neutral model– species pool, all
equivalent– includes effects of
competitionS
rate
(co
loni
zatio
n o
r e
xtin
ctio
n)
farnear
smal
lla
rge

MacArthur & Wilson
• accounts for variation in S• does not account for variation in E
– species abundances• Hubbell's theories explicitly seek to
explain species abundance patterns

Neutral theory: important premises
• Numbers of individuals in a community must be limited– J = r A, where…– J = number of individuals (e.g. trees)– A = Area– r = density of individuals
• and, in any large area communities are saturated with individuals
• No unused space

Zero-sum game• Dynamics of the community are thus a
zero-sum game• for one species to increase in
abundance another must decrease• extinctions associated with changes in
abundance of others• inter- and intraspecific competition

Rules for zero-sum game
• J individuals• each individual occupies one space unit• resists displacement by other individuals• [think of trees]• individuals die with probability m• replacing individual
– probability it is species i is proportional to species abundance of i

Probabilities of species' population change
• decrease:
Pr{Ni-1|Ni} = m Ni (J – Ni)/J(J-1)
• no change:
Pr{Ni|Ni} = 1 – 2m Ni(J – Ni)/J(J-1)
• increase:
Pr{Ni+1|Ni} = m Ni (J – Ni)/J(J-1)– Note: Pr(increase) = Pr(decrease)– Ni = abundance of the ith species

Ecological drift• all species equal competitors on a per capita
basis• all species have average rate of increase r = 0• dynamics of any species' population is a random
walk• species' abundances may increase to J or
decrease to 0– absorbing boundary– time to extinction via ecological drift can be long

Consequences
• zero-sum game plus ecological drift– relative abundances approximately log normal
• but with excess rare species• referred to as "zero-sum multinomial"
• if instead the zero-sum game occurs with frequency or density dependent transitions– relative abundances do not approximate log
normal

Significance
• Log normal has been argued to be the most widespread species abundance pattern in communities
log2(individuals/species)
0 1 2 3 4 5 6 7 8 9 10 11
Nu
mb
er
of s
pe
cie
s
analogy to genetics
• allele frequencies• what maintains genetic diversity in the
face of tendency for selection to erode genetic diversity?
• selective neutrality– allele frequencies change at random– random walk to extinction

Problem: absorbing boundaries• end of the process for any species is always
either extinction or complete dominance• time to extinction increases with J• expected abundance depends on J, but not
immigration rate• variance of abundance depends on
immigration rate• metacommunity dynamics - recolonization

Metacommunity
• All trophically similar individuals and species in a region– multiple connected local communities.– JM = metacommunity size

Speciation
• Ultimately species replaced by speciation• = speciation rate

Fundamental biodiversity number
• = 2 JM n• q is the fundamental biodiversity
number• controls equilibrium S and relative
abundances (E )• controls shape of dominance-diversity
plot

Effects of q on metacommunity
Rank abundance
log
(re
lativ
e a
bu
nda
nce
)
q = 100
q = 20q = 50
q = 0.1q = 5
Outcome• Postulate
– species saturation of the community– random processes of species replacement– metacommunity
• Yield: wide array of possible species abundance distributions
• "Niche differentiation" and coexistence mechanisms are not necessary for diversity

Unified Neutral Theory (UNT) • many community ecologists resistant to UNT
– careers invested in research on coexistence mechanisms; rendered irrelevant in UNT
– data show that coexistence mechanisms are often a prominent feature of species' biologies
– UNT disconnects behavioral, physiological, and population ecology from community ecology
– renders studies of ecology of individual species largely trivial (from community perspective)

Where does UNT get us?• UNT and "niche based" coexistence mechanisms are
not necessarily mutually exclusive in the large sense• some kinds of organisms or communities may be
governed by one, some by the other• What is the domain of applicability of each?• Even if UNT explains broad diversity patterns of
whole communities, "niche based" coexistence mechanisms may be vital to understand dynamics of small sets of strongly interacting species.

Reconciling UNT and Niche based community ecology
• Under what circumstances is ecological drift quantitatively important?– Hubbell: ecological drift is always present;
when does it matter?– much like genetic drift
• UNT designed to explain species number and evenness at the whole community level

Hubbell 2005. Functional Ecology 19:166-172
• “Probably no ecologist in the world with even a modicum of field experience would seriously question the existence of niche differences among competing species on the same trophic level. The real question, however is … what niche differences, if any, matter to the assembly of ecological communities.”

Hubbell 2005
• functional equivalence of species– seems to fit tropical trees well– suspect it will be less likely for mobile animals
• still, neutral theory predicts species number and relative abundance well
• neutral theory captures “aggregate statistical behavior” of biodiversity