Embed Size (px)
Citation preview
COMMUNITY DEVELOPMENT FINANCIAL INSTITUTIONS FUNDwww.cdfifund.gov
New Markets Tax Credit (NMTC) Public Data ReleaseFY 2003 to FY 2015 Summary Report
Table of ContentsSlide Heading
Slide 3 NMTC Program and Summary Report Overview
Slide 4 NMTC Program Terms and Definitions
Slide 5 NMTC Program Allocation Totals
Slide 6 NMTC Real Estate and Non-Real Estate QALICBs
Slide 7 NMTC Investments by Reporting Period
Slide 8 NMTC Investments by Sector (NAICS)
Slide 9 NMTC Investments by Sector : Office, Retail, Industrial, Residential Single and Mixed-Use Real Estate
Slide 10 NMTC Investments by Sector: Healthcare and Social Services
Slide 11 NMTC Investments by Sector: Manufacturing
Slide 12 NMTC Investments by Sector: Education Services
Slide 13 Geographic Distribution of NMTC Investments: Northeast Region
Slide 14 Geographic Distribution of NMTC Investments: Midwest Region
Slide 15 Geographic Distribution of NMTC Investments: South Region
Slide 16 Geographic Distribution of NMTC Investments: West Region
Slide 17 NMTC Investments in Areas of Higher Distress: Areas of Severe Distress
Slide 18 NMTC Investments in Areas of Higher Distress: Rural or Non-Metropolitan Areas
Slide 19 NMTC Investments in Areas of Higher Distress: Targeted Populations
Slide 20 NMTC Investments in Areas of Higher Distress: Other Areas of Higher Distress
Slide 21 Flexible or Non-traditional Rates and Terms
Slide 22 Flexible or Non-traditional Rates and Terms
Slide 23 Other NMTC Program Highlights
Slide 24 NMTC Data Correction and Future Updates
8/3/2017COMMUNITY DEVELOPMENT FINANCIAL INSTITUTIONS FUND // www.cdfifund.gov
2
8/3/2017COMMUNITY DEVELOPMENT FINANCIAL INSTITUTIONS FUND // www.cdfifund.gov
3
NMTC Program and Summary Report Overview
• The New Markets Tax Credit Program (NMTC Program) permits taxpayers to receive a credit against Federal income taxes for making qualified equity investments in designated Community Development Entities (CDEs). Substantially all of the qualified equity investment (QEI) must in turn be used by the CDE to provide investments in low-income communities. The credit provided to the investor totals 39 percent of the cost of the investment and is claimed over a seven-year credit allowance period.
• The CDFI Fund requires all CDEs that have been awarded NMTC allocations to submit an annual report detailing how they invested QEI proceeds in low-income communities.
• These reports must be submitted to the CDFI Fund by the CDEs, along with their audited financial statements, within six months after the end of their fiscal year.
• All NMTC investments must meet statutory qualifications for their investors to be able to claim the tax credit.
• The vast majority of NMTC investments are made within statutorily defined “Low-Income Communities.” In addition to investments located in Low-Income Communities, investments can qualify for NMTCs by using
other statutory provisions designed to target certain areas or populations, including provisions for Rural Counties, and Low-Income Targeted Populations.
The data represented in this summary report and accompanying data file was submitted by CDEs prior to September 30, 2016. CDEs must submit their annual report to the CDFI Fund within six months after the end of their fiscal year (FY), therefore the data submitted by September 30, 2016 represents nearly all investments for FY 2015.
8/3/2017COMMUNITY DEVELOPMENT FINANCIAL INSTITUTIONS FUND // www.cdfifund.gov
4
NMTC Program Terms and Definitions• Community Development Entity (CDE): A financial intermediary certified by the CDFI Fund that may apply
to receive an Allocation Award of New Markets Tax Credits to make qualified investments in low-income communities.
• Low Income Community (LIC): In the NMTC context, this refers to an NMTC-qualified census tract that meets certain criteria based on poverty rates, unemployment, and median household income.
• North American Industry Classification System (NAICS): The North American Industry Classification System (NAICS) is the standard used by Federal statistical agencies in classifying business establishments for the purpose of collecting, analyzing, and publishing statistical data related to the U.S. business economy. NAICS categories are used in this summary report to classify the types of businesses where NMTC investments are used.
• NMTC Project: NMTC Project is a CDFI Fund term used to identify groups of QLICIs invested toward a common target or objective (e.g. a group of QLICIs sharing the same project address).
• Qualified Equity Investment (QEI): An equity investment made into an eligible CDE that generates New Markets Tax Credits for the investor, equal to 39 percent of the investment over a seven-year period.
• Qualified Low-Income Community Investments (QLICI): Qualified Low-Income Community Investment –Any investment from a CDE into a QALICB that uses and complies with the NMTC Allocation Award.
• Qualified Active Low-Income Community Businesses (QALICB): A nonprofit or for-profit entity in an NMTC-eligible census tract that receives an investment from a CDE through the NMTC Program.
8/3/2017COMMUNITY DEVELOPMENT FINANCIAL INSTITUTIONS FUND // www.cdfifund.gov
5
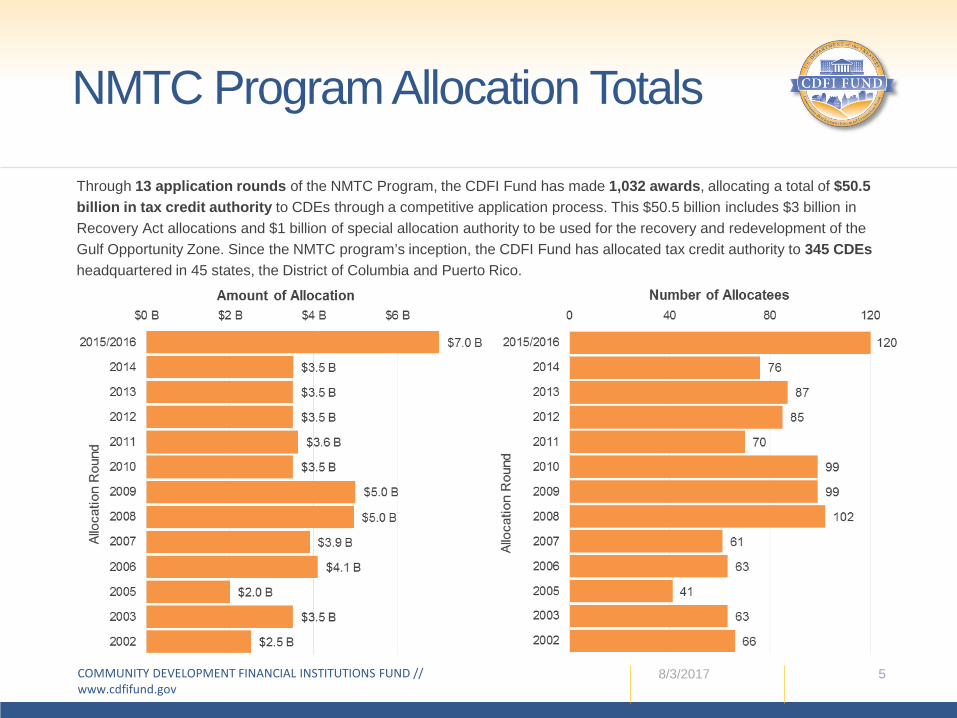
NMTC Program Allocation Totals
Through 13 application rounds of the NMTC Program, the CDFI Fund has made 1,032 awards, allocating a total of $50.5 billion in tax credit authority to CDEs through a competitive application process. This $50.5 billion includes $3 billion in Recovery Act allocations and $1 billion of special allocation authority to be used for the recovery and redevelopment of the Gulf Opportunity Zone. Since the NMTC program’s inception, the CDFI Fund has allocated tax credit authority to 345 CDEsheadquartered in 45 states, the District of Columbia and Puerto Rico.
8/3/2017COMMUNITY DEVELOPMENT FINANCIAL INSTITUTIONS FUND // www.cdfifund.gov
6
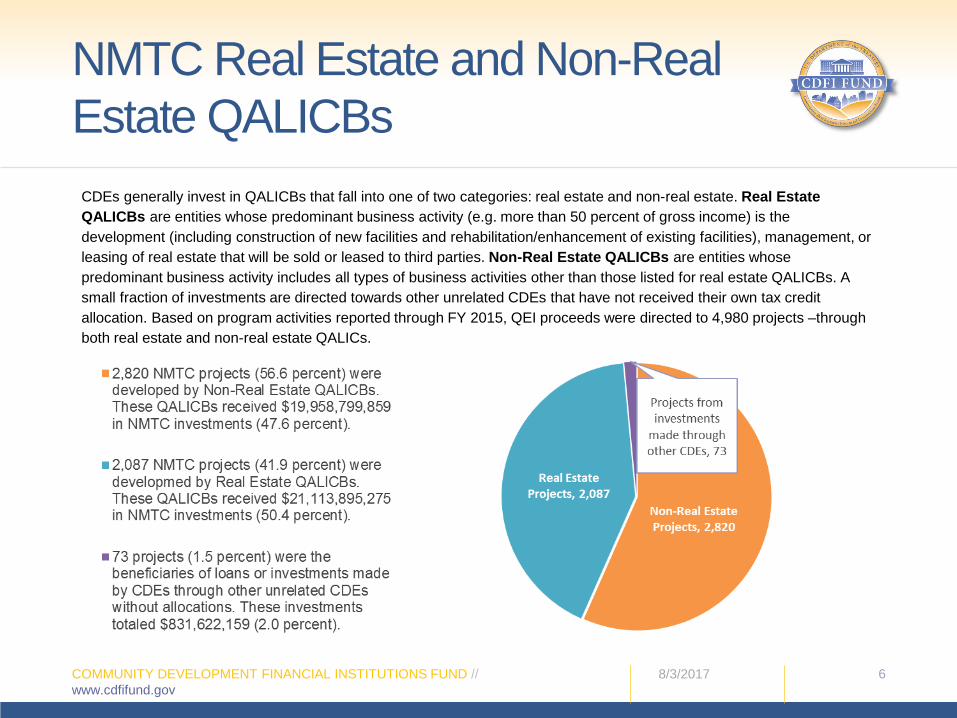
NMTC Real Estate and Non-Real Estate QALICBs
CDEs generally invest in QALICBs that fall into one of two categories: real estate and non-real estate. Real Estate QALICBs are entities whose predominant business activity (e.g. more than 50 percent of gross income) is the development (including construction of new facilities and rehabilitation/enhancement of existing facilities), management, or leasing of real estate that will be sold or leased to third parties. Non-Real Estate QALICBs are entities whose predominant business activity includes all types of business activities other than those listed for real estate QALICBs. A small fraction of investments are directed towards other unrelated CDEs that have not received their own tax credit allocation. Based on program activities reported through FY 2015, QEI proceeds were directed to 4,980 projects –through both real estate and non-real estate QALICs.
8/3/2017COMMUNITY DEVELOPMENT FINANCIAL INSTITUTIONS FUND // www.cdfifund.gov
7
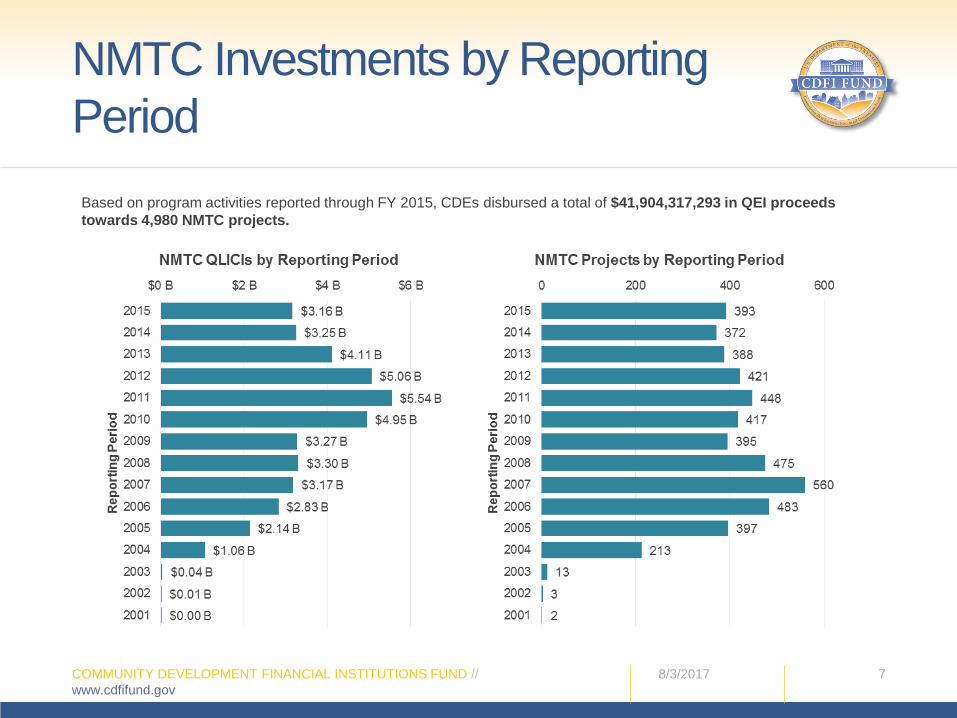
NMTC Investments by Reporting Period
Based on program activities reported through FY 2015, CDEs disbursed a total of $41,904,317,293 in QEI proceeds towards 4,980 NMTC projects.
8/3/2017COMMUNITY DEVELOPMENT FINANCIAL INSTITUTIONS FUND // www.cdfifund.gov
8
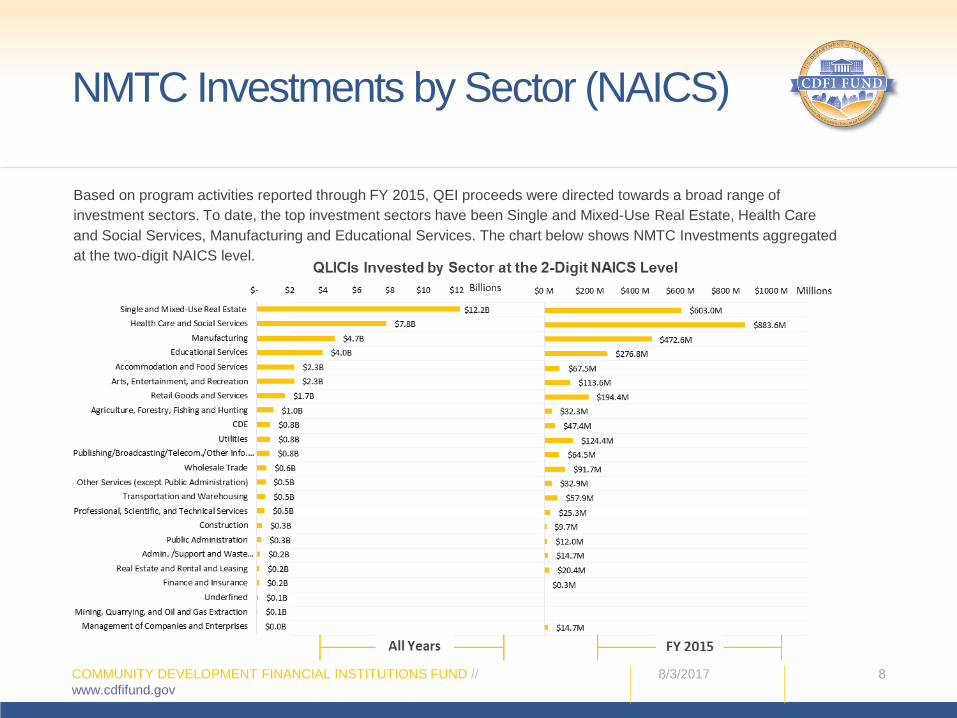
NMTC Investments by Sector (NAICS)
Based on program activities reported through FY 2015, QEI proceeds were directed towards a broad range of investment sectors. To date, the top investment sectors have been Single and Mixed-Use Real Estate, Health Care and Social Services, Manufacturing and Educational Services. The chart below shows NMTC Investments aggregated at the two-digit NAICS level.
8/3/2017COMMUNITY DEVELOPMENT FINANCIAL INSTITUTIONS FUND // www.cdfifund.gov
9
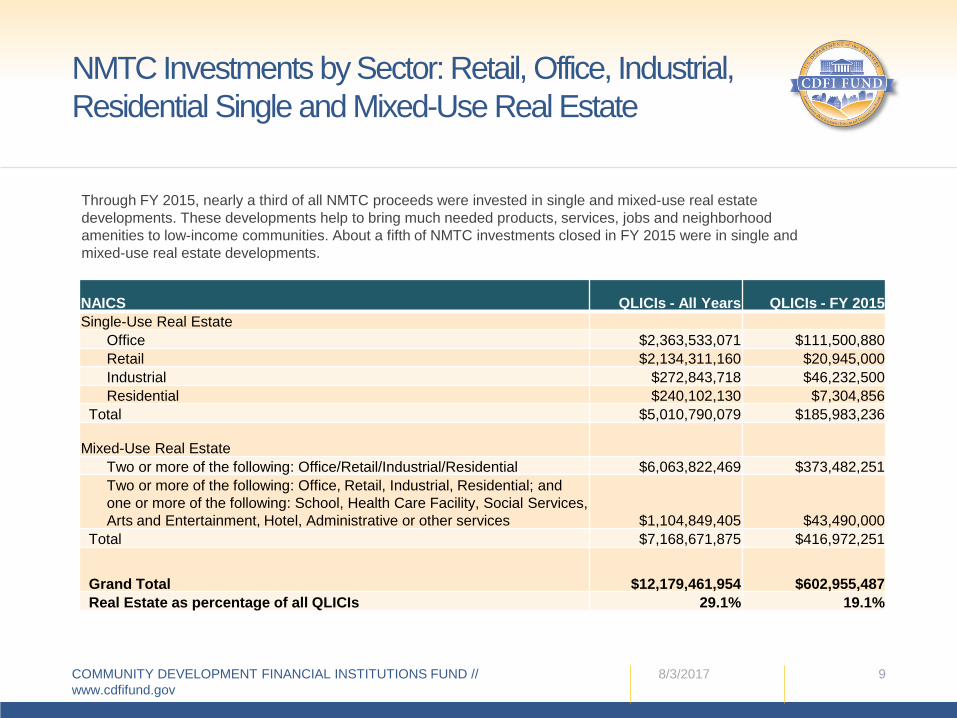
NMTC Investments by Sector: Retail, Office, Industrial, Residential Single and Mixed-Use Real Estate
Through FY 2015, nearly a third of all NMTC proceeds were invested in single and mixed-use real estate developments. These developments help to bring much needed products, services, jobs and neighborhood amenities to low-income communities. About a fifth of NMTC investments closed in FY 2015 were in single and mixed-use real estate developments.
NAICS QLICIs - All Years QLICIs - FY 2015Single-Use Real Estate
Office $2,363,533,071 $111,500,880Retail $2,134,311,160 $20,945,000Industrial $272,843,718 $46,232,500Residential $240,102,130 $7,304,856
Total $5,010,790,079 $185,983,236
Mixed-Use Real EstateTwo or more of the following: Office/Retail/Industrial/Residential $6,063,822,469 $373,482,251Two or more of the following: Office, Retail, Industrial, Residential; and one or more of the following: School, Health Care Facility, Social Services, Arts and Entertainment, Hotel, Administrative or other services $1,104,849,405 $43,490,000
Total $7,168,671,875 $416,972,251
Grand Total $12,179,461,954 $602,955,487Real Estate as percentage of all QLICIs 29.1% 19.1%
8/3/2017COMMUNITY DEVELOPMENT FINANCIAL INSTITUTIONS FUND // www.cdfifund.gov
10
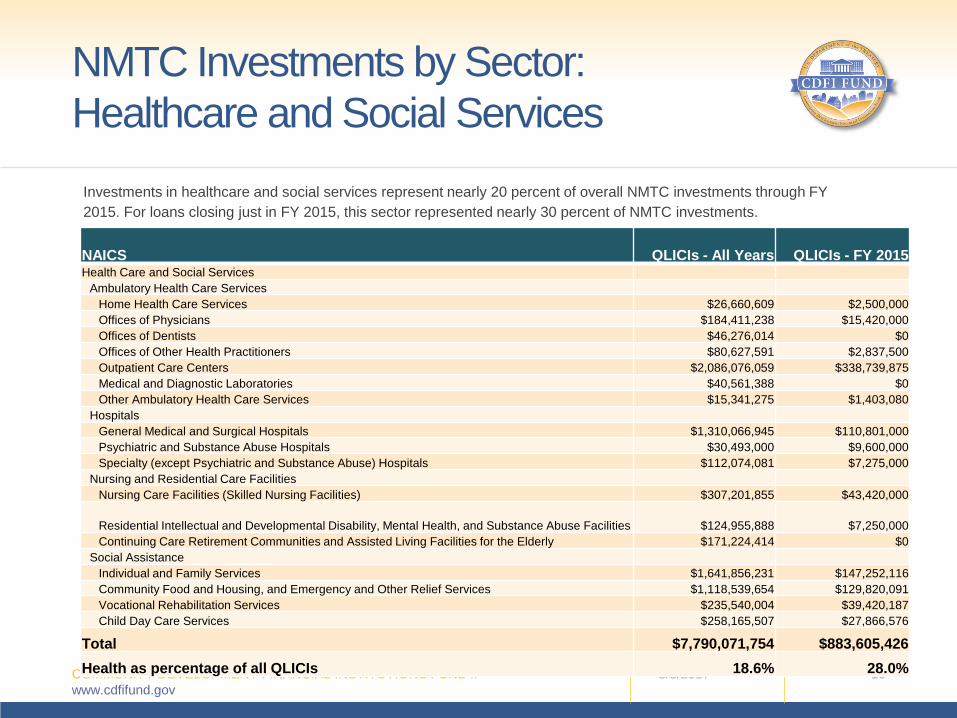
NMTC Investments by Sector: Healthcare and Social Services
Investments in healthcare and social services represent nearly 20 percent of overall NMTC investments through FY 2015. For loans closing just in FY 2015, this sector represented nearly 30 percent of NMTC investments.
NAICS QLICIs - All Years QLICIs - FY 2015Health Care and Social Services
Ambulatory Health Care ServicesHome Health Care Services $26,660,609 $2,500,000Offices of Physicians $184,411,238 $15,420,000Offices of Dentists $46,276,014 $0Offices of Other Health Practitioners $80,627,591 $2,837,500Outpatient Care Centers $2,086,076,059 $338,739,875Medical and Diagnostic Laboratories $40,561,388 $0Other Ambulatory Health Care Services $15,341,275 $1,403,080
HospitalsGeneral Medical and Surgical Hospitals $1,310,066,945 $110,801,000Psychiatric and Substance Abuse Hospitals $30,493,000 $9,600,000Specialty (except Psychiatric and Substance Abuse) Hospitals $112,074,081 $7,275,000
Nursing and Residential Care FacilitiesNursing Care Facilities (Skilled Nursing Facilities) $307,201,855 $43,420,000
Residential Intellectual and Developmental Disability, Mental Health, and Substance Abuse Facilities $124,955,888 $7,250,000Continuing Care Retirement Communities and Assisted Living Facilities for the Elderly $171,224,414 $0
Social AssistanceIndividual and Family Services $1,641,856,231 $147,252,116Community Food and Housing, and Emergency and Other Relief Services $1,118,539,654 $129,820,091Vocational Rehabilitation Services $235,540,004 $39,420,187Child Day Care Services $258,165,507 $27,866,576
Total $7,790,071,754 $883,605,426Health as percentage of all QLICIs 18.6% 28.0%
8/3/2017COMMUNITY DEVELOPMENT FINANCIAL INSTITUTIONS FUND // www.cdfifund.gov
11
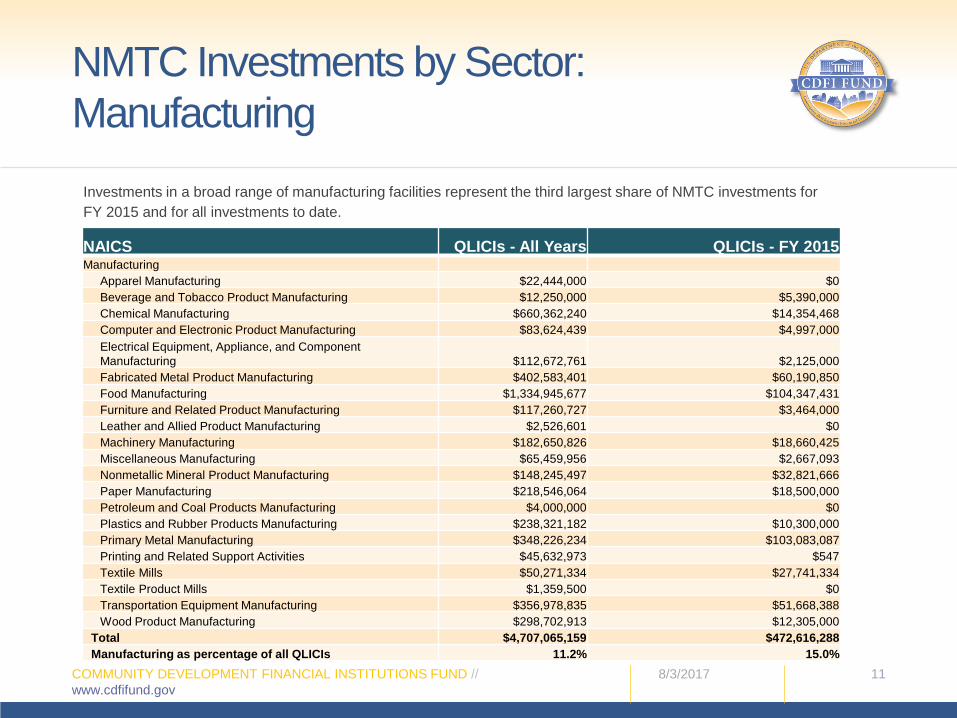
NMTC Investments by Sector: Manufacturing
Investments in a broad range of manufacturing facilities represent the third largest share of NMTC investments for FY 2015 and for all investments to date.
NAICS QLICIs - All Years QLICIs - FY 2015Manufacturing
Apparel Manufacturing $22,444,000 $0Beverage and Tobacco Product Manufacturing $12,250,000 $5,390,000Chemical Manufacturing $660,362,240 $14,354,468Computer and Electronic Product Manufacturing $83,624,439 $4,997,000Electrical Equipment, Appliance, and Component Manufacturing $112,672,761 $2,125,000Fabricated Metal Product Manufacturing $402,583,401 $60,190,850Food Manufacturing $1,334,945,677 $104,347,431Furniture and Related Product Manufacturing $117,260,727 $3,464,000Leather and Allied Product Manufacturing $2,526,601 $0Machinery Manufacturing $182,650,826 $18,660,425Miscellaneous Manufacturing $65,459,956 $2,667,093Nonmetallic Mineral Product Manufacturing $148,245,497 $32,821,666Paper Manufacturing $218,546,064 $18,500,000Petroleum and Coal Products Manufacturing $4,000,000 $0Plastics and Rubber Products Manufacturing $238,321,182 $10,300,000Primary Metal Manufacturing $348,226,234 $103,083,087Printing and Related Support Activities $45,632,973 $547Textile Mills $50,271,334 $27,741,334Textile Product Mills $1,359,500 $0Transportation Equipment Manufacturing $356,978,835 $51,668,388Wood Product Manufacturing $298,702,913 $12,305,000
Total $4,707,065,159 $472,616,288Manufacturing as percentage of all QLICIs 11.2% 15.0%
8/3/2017COMMUNITY DEVELOPMENT FINANCIAL INSTITUTIONS FUND // www.cdfifund.gov
12
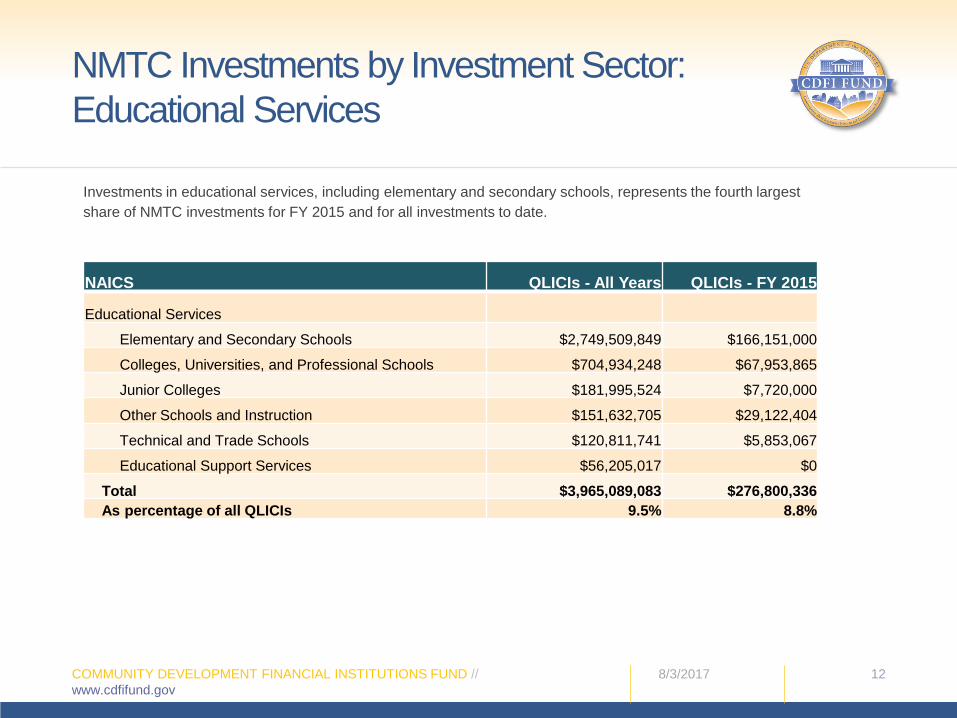
NMTC Investments by Investment Sector: Educational Services
Investments in educational services, including elementary and secondary schools, represents the fourth largest share of NMTC investments for FY 2015 and for all investments to date.
NAICS QLICIs - All Years QLICIs - FY 2015
Educational Services
Elementary and Secondary Schools $2,749,509,849 $166,151,000
Colleges, Universities, and Professional Schools $704,934,248 $67,953,865
Junior Colleges $181,995,524 $7,720,000
Other Schools and Instruction $151,632,705 $29,122,404
Technical and Trade Schools $120,811,741 $5,853,067
Educational Support Services $56,205,017 $0
Total $3,965,089,083 $276,800,336As percentage of all QLICIs 9.5% 8.8%
8/3/2017COMMUNITY DEVELOPMENT FINANCIAL INSTITUTIONS FUND // www.cdfifund.gov
13
Geographic Distribution of NMTC Investments: Northeast
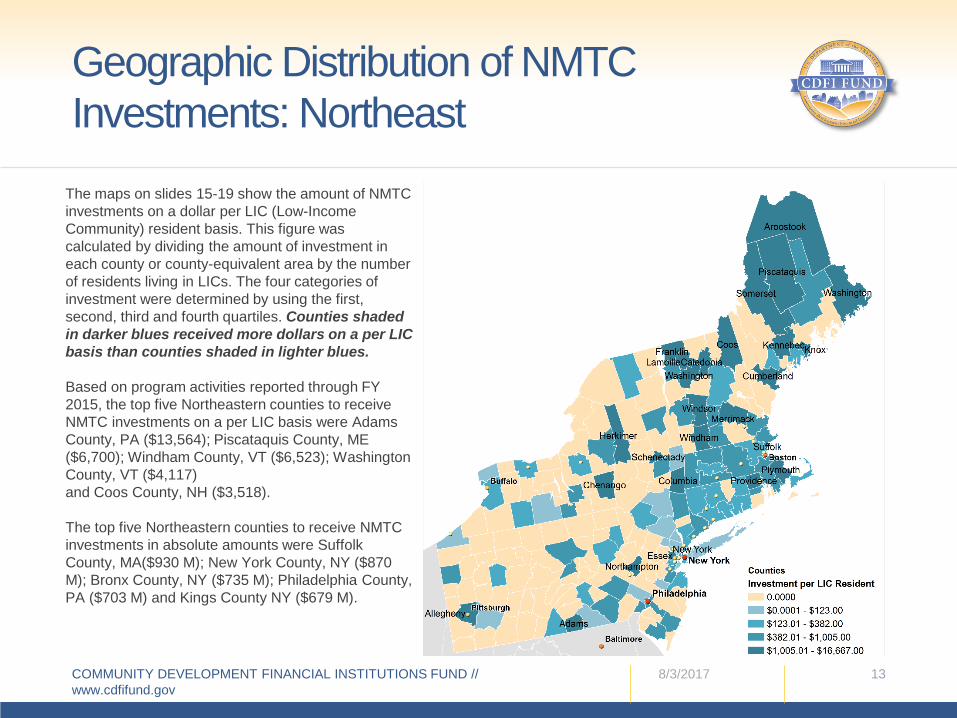
The maps on slides 15-19 show the amount of NMTC investments on a dollar per LIC (Low-Income Community) resident basis. This figure was calculated by dividing the amount of investment in each county or county-equivalent area by the number of residents living in LICs. The four categories of investment were determined by using the first, second, third and fourth quartiles. Counties shaded in darker blues received more dollars on a per LIC basis than counties shaded in lighter blues.
Based on program activities reported through FY 2015, the top five Northeastern counties to receive NMTC investments on a per LIC basis were Adams County, PA ($13,564); Piscataquis County, ME ($6,700); Windham County, VT ($6,523); Washington County, VT ($4,117)and Coos County, NH ($3,518).
The top five Northeastern counties to receive NMTC investments in absolute amounts were Suffolk County, MA($930 M); New York County, NY ($870 M); Bronx County, NY ($735 M); Philadelphia County, PA ($703 M) and Kings County NY ($679 M).
8/3/2017COMMUNITY DEVELOPMENT FINANCIAL INSTITUTIONS FUND // www.cdfifund.gov
14
Geographic Distribution of NMTC Investments: Midwest
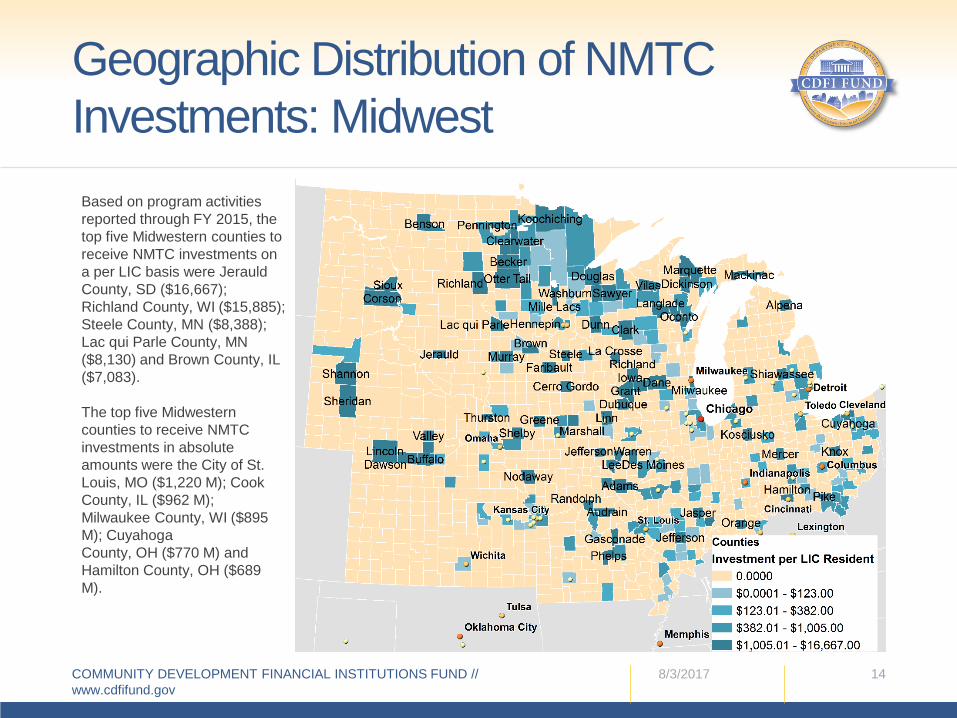
Based on program activities reported through FY 2015, the top five Midwestern counties to receive NMTC investments on a per LIC basis were JerauldCounty, SD ($16,667); Richland County, WI ($15,885); Steele County, MN ($8,388); Lac qui Parle County, MN ($8,130) and Brown County, IL ($7,083).
The top five Midwestern counties to receive NMTC investments in absolute amounts were the City of St. Louis, MO ($1,220 M); CookCounty, IL ($962 M); Milwaukee County, WI ($895 M); CuyahogaCounty, OH ($770 M) and Hamilton County, OH ($689 M).
8/3/2017COMMUNITY DEVELOPMENT FINANCIAL INSTITUTIONS FUND // www.cdfifund.gov
15
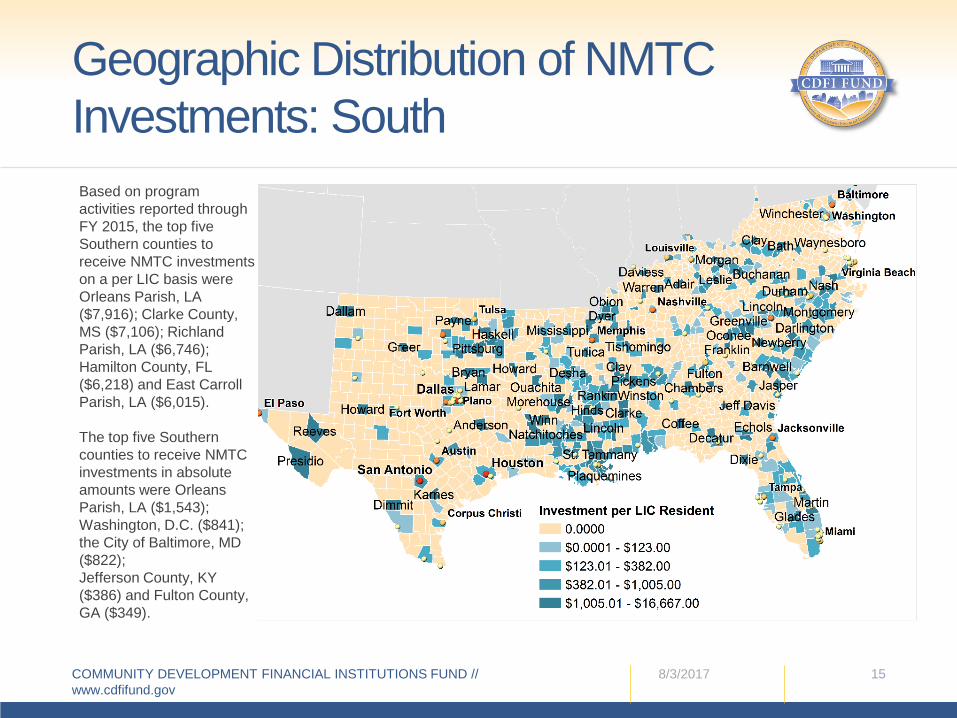
Geographic Distribution of NMTC Investments: SouthBased on program activities reported through FY 2015, the top five Southern counties to receive NMTC investments on a per LIC basis were Orleans Parish, LA ($7,916); Clarke County, MS ($7,106); Richland Parish, LA ($6,746);Hamilton County, FL ($6,218) and East Carroll Parish, LA ($6,015).
The top five Southern counties to receive NMTC investments in absolute amounts were Orleans Parish, LA ($1,543); Washington, D.C. ($841); the City of Baltimore, MD ($822);Jefferson County, KY ($386) and Fulton County, GA ($349).
8/3/2017COMMUNITY DEVELOPMENT FINANCIAL INSTITUTIONS FUND // www.cdfifund.gov
16
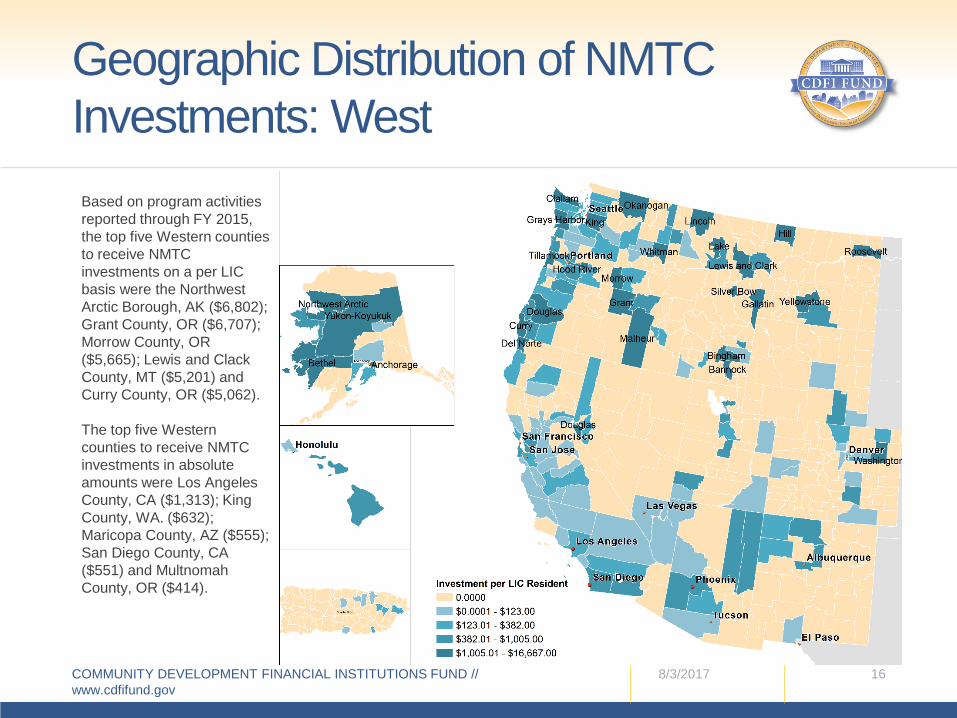
Geographic Distribution of NMTC Investments: West
Based on program activities reported through FY 2015, the top five Western counties to receive NMTC investments on a per LIC basis were the Northwest Arctic Borough, AK ($6,802); Grant County, OR ($6,707); Morrow County, OR ($5,665); Lewis and Clack County, MT ($5,201) and Curry County, OR ($5,062).
The top five Western counties to receive NMTC investments in absolute amounts were Los Angeles County, CA ($1,313); King County, WA. ($632); Maricopa County, AZ ($555);San Diego County, CA ($551) and Multnomah County, OR ($414).
8/3/2017COMMUNITY DEVELOPMENT FINANCIAL INSTITUTIONS FUND // www.cdfifund.gov
17
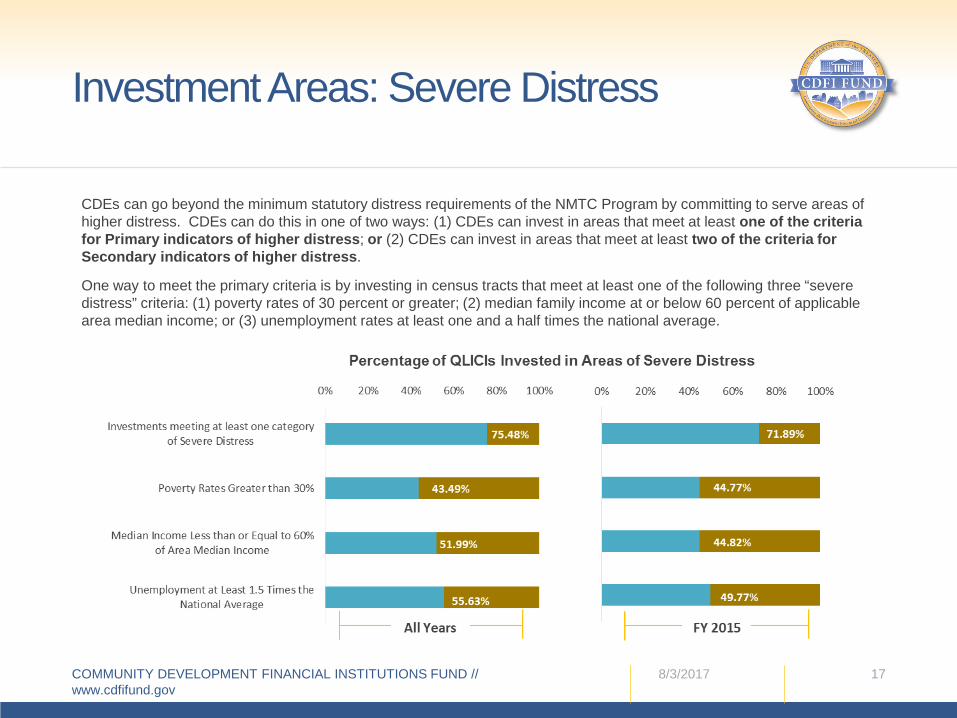
Investment Areas: Severe Distress
CDEs can go beyond the minimum statutory distress requirements of the NMTC Program by committing to serve areas of higher distress. CDEs can do this in one of two ways: (1) CDEs can invest in areas that meet at least one of the criteria for Primary indicators of higher distress; or (2) CDEs can invest in areas that meet at least two of the criteria for Secondary indicators of higher distress.
One way to meet the primary criteria is by investing in census tracts that meet at least one of the following three “severe distress” criteria: (1) poverty rates of 30 percent or greater; (2) median family income at or below 60 percent of applicablearea median income; or (3) unemployment rates at least one and a half times the national average.
8/3/2017COMMUNITY DEVELOPMENT FINANCIAL INSTITUTIONS FUND // www.cdfifund.gov
18
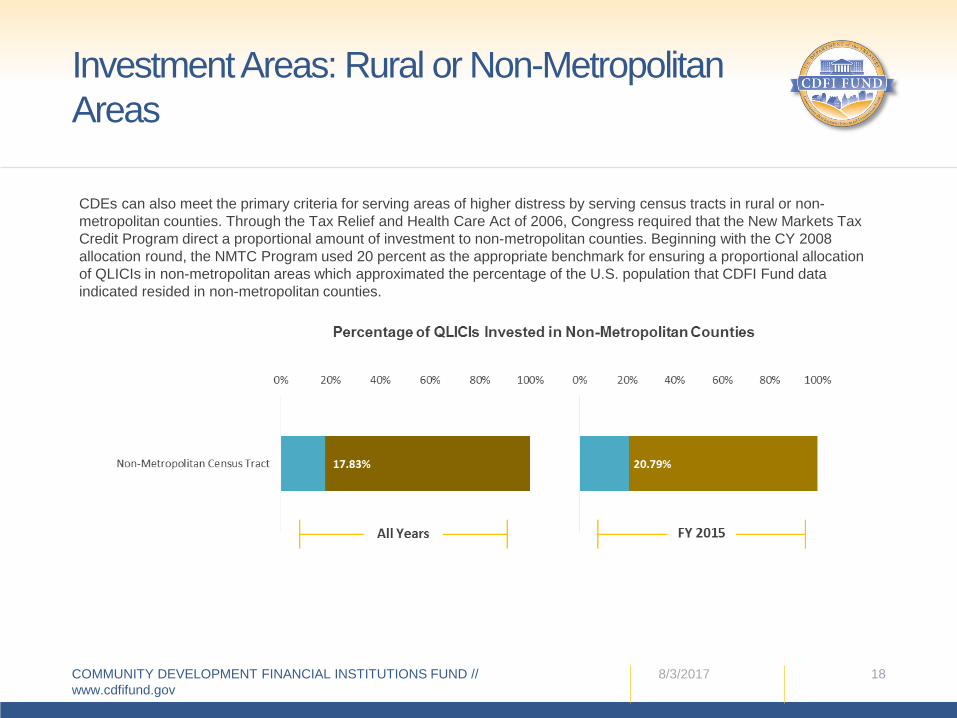
Investment Areas: Rural or Non-Metropolitan Areas
CDEs can also meet the primary criteria for serving areas of higher distress by serving census tracts in rural or non-metropolitan counties. Through the Tax Relief and Health Care Act of 2006, Congress required that the New Markets Tax Credit Program direct a proportional amount of investment to non-metropolitan counties. Beginning with the CY 2008 allocation round, the NMTC Program used 20 percent as the appropriate benchmark for ensuring a proportional allocation of QLICIs in non-metropolitan areas which approximated the percentage of the U.S. population that CDFI Fund data indicated resided in non-metropolitan counties.
8/3/2017COMMUNITY DEVELOPMENT FINANCIAL INSTITUTIONS FUND // www.cdfifund.gov
19
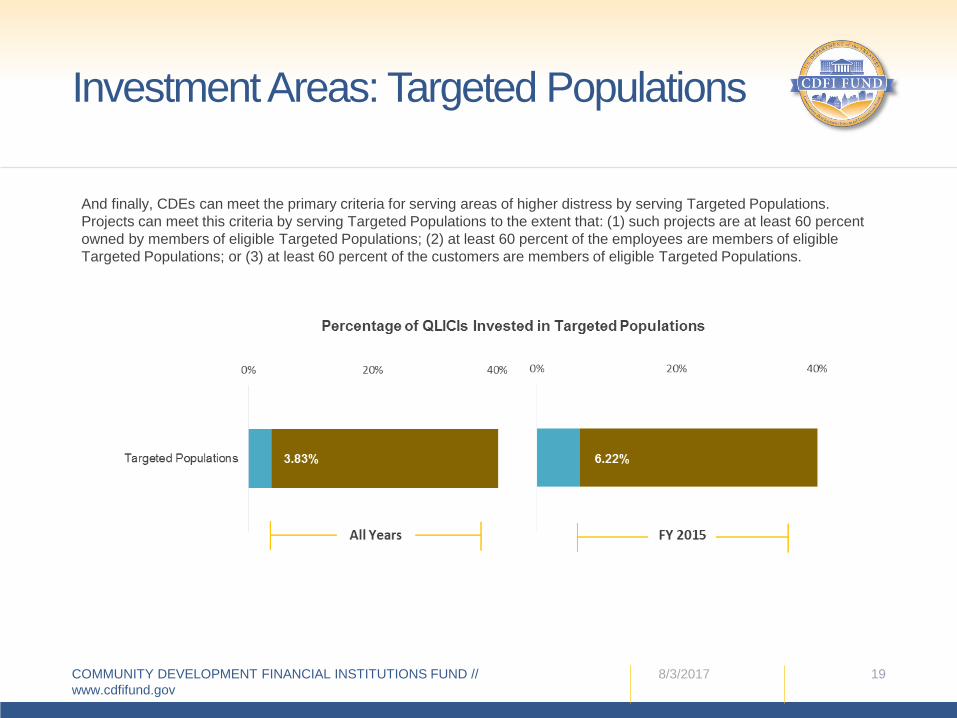
Investment Areas: Targeted Populations
And finally, CDEs can meet the primary criteria for serving areas of higher distress by serving Targeted Populations. Projects can meet this criteria by serving Targeted Populations to the extent that: (1) such projects are at least 60 percentowned by members of eligible Targeted Populations; (2) at least 60 percent of the employees are members of eligible Targeted Populations; or (3) at least 60 percent of the customers are members of eligible Targeted Populations.
8/3/2017COMMUNITY DEVELOPMENT FINANCIAL INSTITUTIONS FUND // www.cdfifund.gov
20
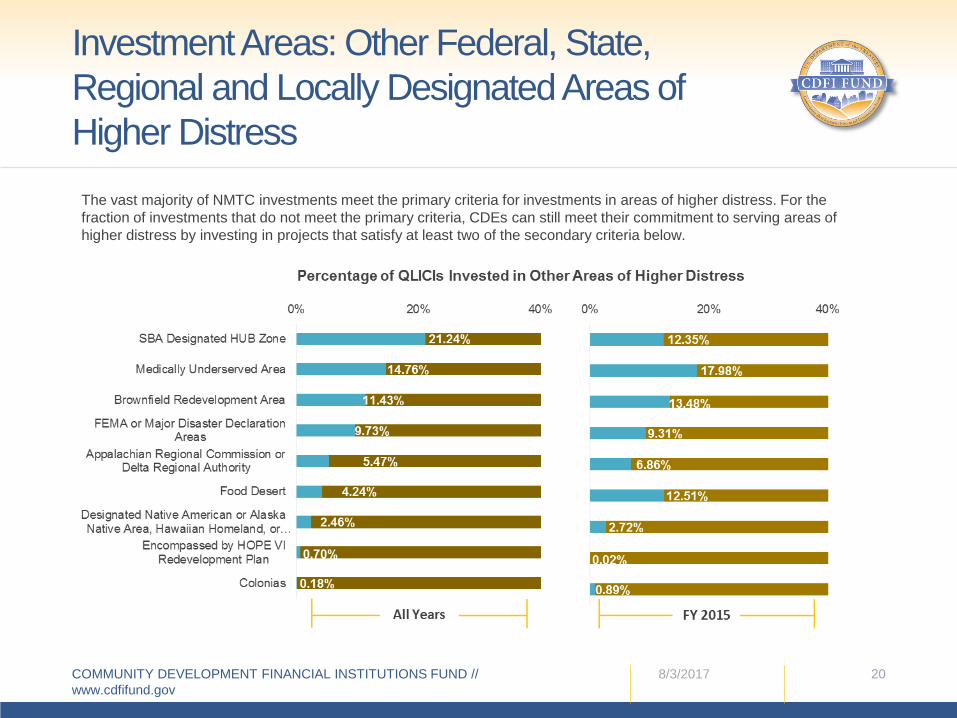
Investment Areas: Other Federal, State, Regional and Locally Designated Areas of Higher Distress
The vast majority of NMTC investments meet the primary criteria for investments in areas of higher distress. For the fraction of investments that do not meet the primary criteria, CDEs can still meet their commitment to serving areas of higher distress by investing in projects that satisfy at least two of the secondary criteria below.
8/3/2017COMMUNITY DEVELOPMENT FINANCIAL INSTITUTIONS FUND // www.cdfifund.gov
21
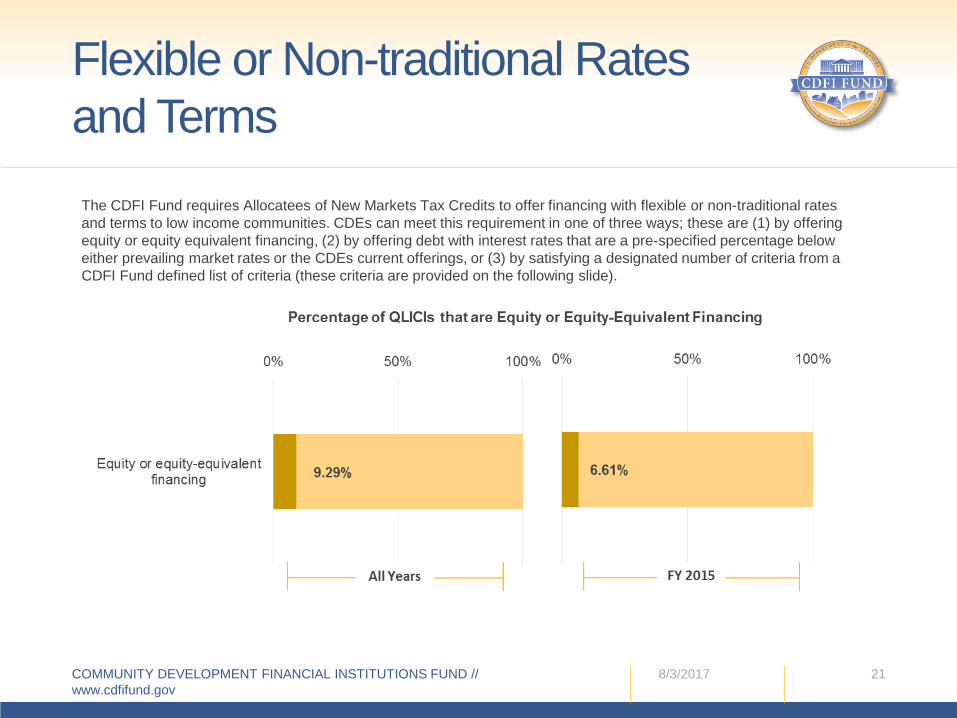
Flexible or Non-traditional Rates and Terms
The CDFI Fund requires Allocatees of New Markets Tax Credits to offer financing with flexible or non-traditional rates and terms to low income communities. CDEs can meet this requirement in one of three ways; these are (1) by offering equity or equity equivalent financing, (2) by offering debt with interest rates that are a pre-specified percentage below either prevailing market rates or the CDEs current offerings, or (3) by satisfying a designated number of criteria from a CDFI Fund defined list of criteria (these criteria are provided on the following slide).
8/3/2017COMMUNITY DEVELOPMENT FINANCIAL INSTITUTIONS FUND // www.cdfifund.gov
22
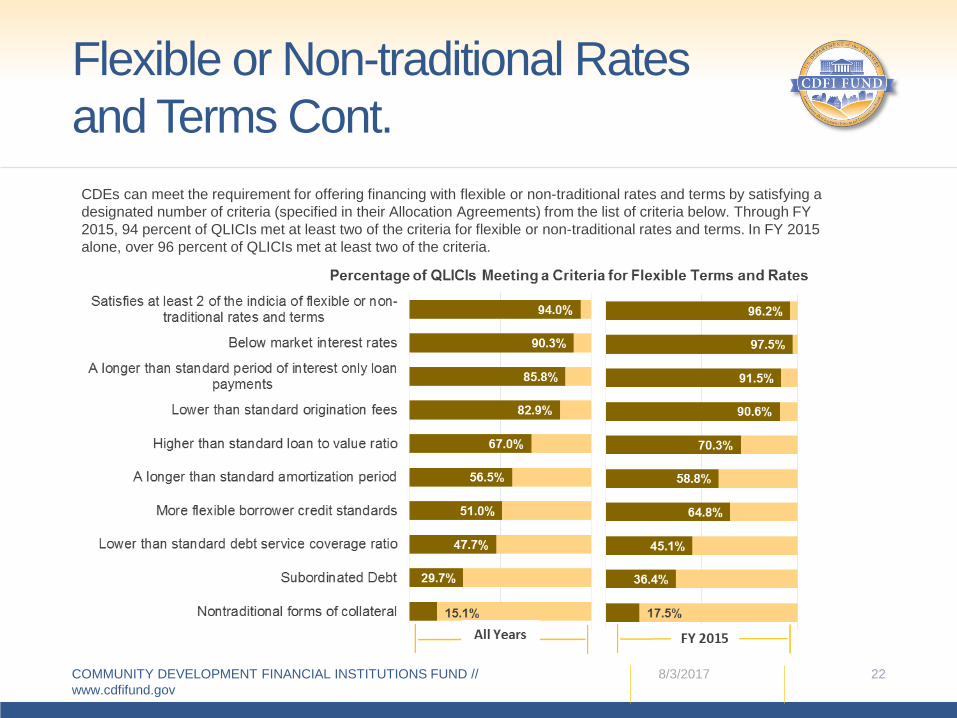
Flexible or Non-traditional Rates and Terms Cont.
CDEs can meet the requirement for offering financing with flexible or non-traditional rates and terms by satisfying a designated number of criteria (specified in their Allocation Agreements) from the list of criteria below. Through FY 2015, 94 percent of QLICIs met at least two of the criteria for flexible or non-traditional rates and terms. In FY 2015 alone, over 96 percent of QLICIs met at least two of the criteria.
8/3/2017COMMUNITY DEVELOPMENT FINANCIAL INSTITUTIONS FUND // www.cdfifund.gov
23
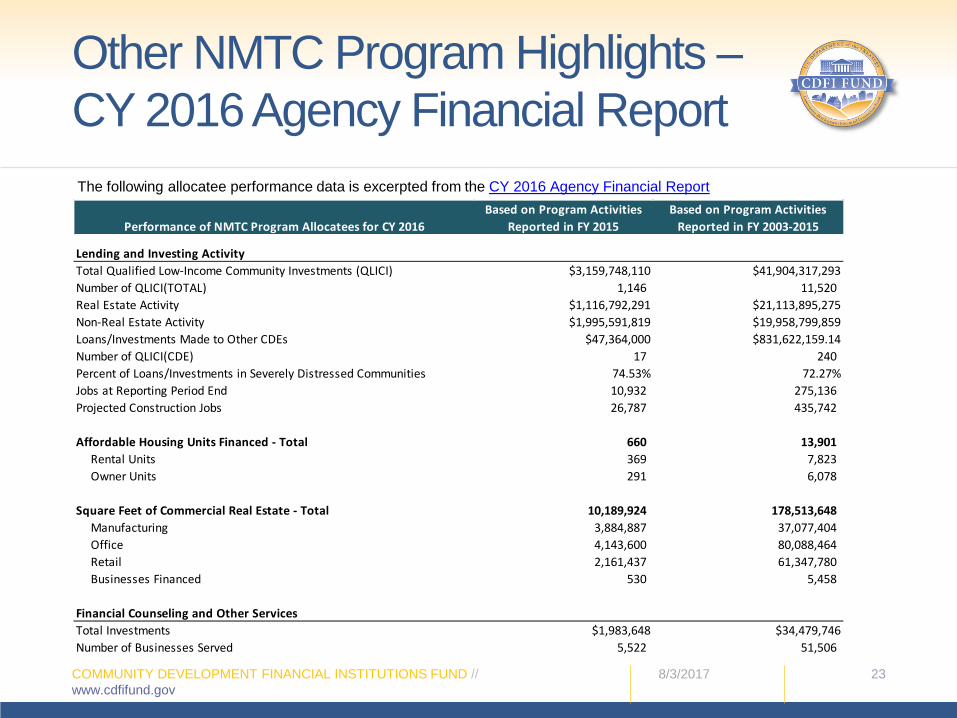
Other NMTC Program Highlights –CY 2016 Agency Financial ReportThe following allocatee performance data is excerpted from the CY 2016 Agency Financial Report
Performance of NMTC Program Allocatees for CY 2016Based on Program Activities
Reported in FY 2015Based on Program Activities
Reported in FY 2003-2015
Lending and Investing Activity Total Qualified Low-Income Community Investments (QLICI) $3,159,748,110 $41,904,317,293Number of QLICI(TOTAL) 1,146 11,520 Real Estate Activity $1,116,792,291 $21,113,895,275Non-Real Estate Activity $1,995,591,819 $19,958,799,859Loans/Investments Made to Other CDEs $47,364,000 $831,622,159.14Number of QLICI(CDE) 17 240 Percent of Loans/Investments in Severely Distressed Communities 74.53% 72.27%Jobs at Reporting Period End 10,932 275,136 Projected Construction Jobs 26,787 435,742
Affordable Housing Units Financed - Total 660 13,901 Rental Units 369 7,823 Owner Units 291 6,078
Square Feet of Commercial Real Estate - Total 10,189,924 178,513,648 Manufacturing 3,884,887 37,077,404 Office 4,143,600 80,088,464 Retail 2,161,437 61,347,780 Businesses Financed 530 5,458
Financial Counseling and Other ServicesTotal Investments $1,983,648 $34,479,746Number of Businesses Served 5,522 51,506
8/3/2017COMMUNITY DEVELOPMENT FINANCIAL INSTITUTIONS FUND // www.cdfifund.gov
24
NMTC Data Correction and Future Updates
With the publication of this report, CDEs and other allocatees may identify updates or corrections related to the data published in the summary report and accompanying data file. In such cases, the CDEs may contact the CDFI Fund’s Financial Strategies & Research department at [email protected].
Please provide the Originator Transaction ID, Project Number, Project Address and Project FIPS for the data records you wish to modify. The CDFI Fund will incorporate such information in future NMTC public data releases. Please do not attempt to make such corrections in the CIIS TLR unless instructed to do so through guidance published by the CDFI Fund.


![Audited Financial Results FY 2018-19 April 24, 2019 · Key Financial Highlights: FY 18-19 vs FY 17-18 as per Indian Accounting Standards [IndAS] Key Financial Highlights: Q4 FY 18-19](https://img.pdfslide.net/doc/110x75/5f1a178b938ef210d370e190/audited-financial-results-fy-2018-19-april-24-2019-key-financial-highlights-fy.jpg)