Embed Size (px)
Citation preview

Community Health Assessment
& Community Health Improvement Plan
Lee County, Florida 2012-2015
Prepared by: Florida Department of Health in Lee County September 2012 (Revised September 2014)
Lee County CHA/CHIP 2012-2015
Table of Contents Executive Summary
Recommendations Introduction
What produces our health? What is public health? What is a Community Health Improvement Plan?
Background How was this Community Health Improvement Plan developed? Assessment 1: Community Health Visioning 2017 Assessment 2: Lee County Sustainability Assessment Assessment 3: Local Public Health System Performance Assessment Lee County, Florida Community Profile
Demographic Characteristics Socio-Economic Characteristics Health Profile
Community Health Assessment Highlights Local Public Health Assessment Community Health Status County Health Rankings Forces of Change
Strategic Issue Priority Areas How were priorities identified? Priority Area 1: Healthy Lifestyles Priority Area 2: Health Care Access Priority Area 3: Health Disparities Priority Area 4: Maternal, Infant & Child Health Priority Area 5: Safe Community Environments
How to use this Community Health Improvement Plan Appendices
Accomplishments Glossary of Terms Acronyms & Selected Data Sources Acknowledgments and Partners Lee County Community Health Assessment and Health Improvement Planning Models Matrix Healthy Lee Scorecard / PRC Survey Data (2014)
ii
Lee County CHA/CHIP 2012-2015
Executive Summary The Florida Department of Health in Lee County’s (FDOH Lee) Community Health Improvement Plan (CHIP) and Community Health Assessment (CHA) were developed through collaborative efforts involving local residents, health care professionals, and organizations. A diverse group of partners with an interest in and impact on improving the health of Lee County’s residents and visitors created this CHIP, which was then compiled by the Florida Department of Health in Lee County.
This Plan is based on a shared vision of creating a healthy Lee, and brings together information from a wide range of sources regarding health in our community. The goal of this project was to create a strategic plan that prioritized public health issues and set measurable targets to move Lee County’s community health forward.
It is important to recognize that no institution or organization alone can improve community health; this can only be achieved through strong partnerships. We thank the individuals, health care professionals, and organizations who participated in the development of this CHIP. The following Plan outlines a framework for achieving improved health and a healthy Lee.
“The high burden of illness responsible for appalling
premature loss of life arises in large part because of the conditions in which people are born, grow, live, work, and age – conditions that together provide the freedom people need to
live lives they value.”
(Sen, 1999; Marmot, 2004). WHO Closing the Gap page 26
iii
Lee County CHA/CHIP 2012-2015
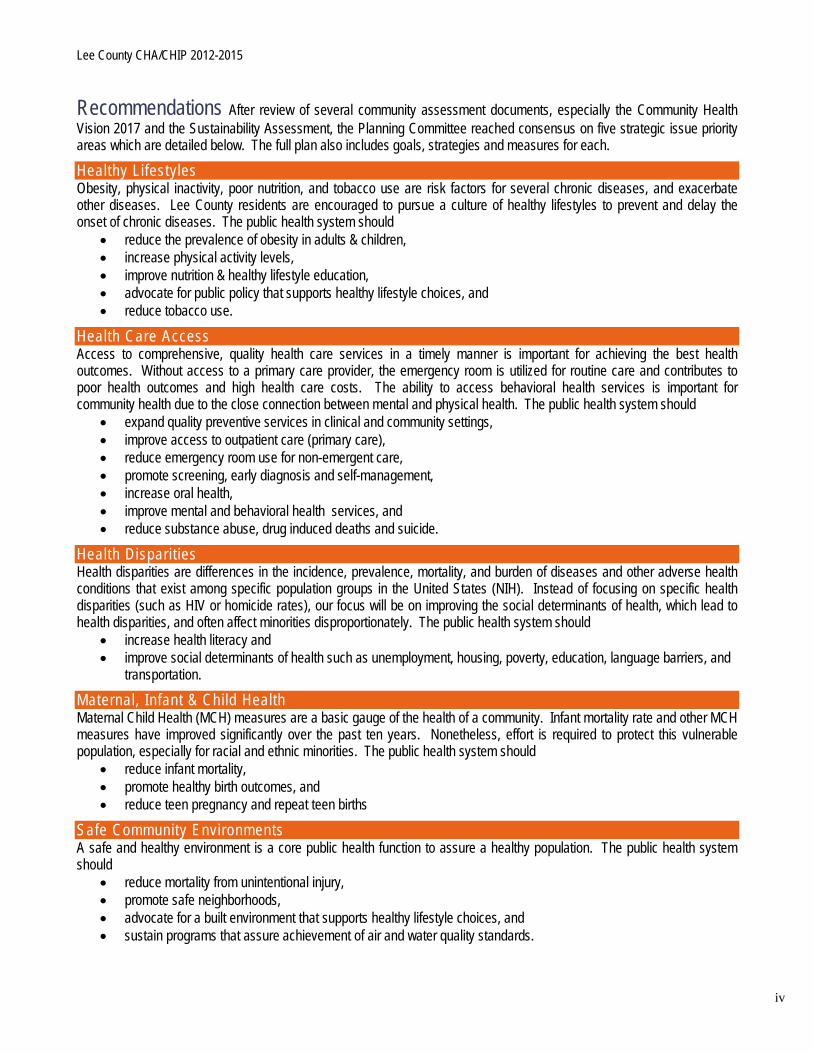
Recommendations After review of several community assessment documents, especially the Community Health Vision 2017 and the Sustainability Assessment, the Planning Committee reached consensus on five strategic issue priority areas which are detailed below. The full plan also includes goals, strategies and measures for each.
Healthy Lifestyles Obesity, physical inactivity, poor nutrition, and tobacco use are risk factors for several chronic diseases, and exacerbate other diseases. Lee County residents are encouraged to pursue a culture of healthy lifestyles to prevent and delay the onset of chronic diseases. The public health system should
• reduce the prevalence of obesity in adults & children, • increase physical activity levels, • improve nutrition & healthy lifestyle education, • advocate for public policy that supports healthy lifestyle choices, and • reduce tobacco use.
Health Care Access Access to comprehensive, quality health care services in a timely manner is important for achieving the best health outcomes. Without access to a primary care provider, the emergency room is utilized for routine care and contributes to poor health outcomes and high health care costs. The ability to access behavioral health services is important for community health due to the close connection between mental and physical health. The public health system should
• expand quality preventive services in clinical and community settings, • improve access to outpatient care (primary care), • reduce emergency room use for non-emergent care, • promote screening, early diagnosis and self-management, • increase oral health, • improve mental and behavioral health services, and • reduce substance abuse, drug induced deaths and suicide.
Health Disparities Health disparities are differences in the incidence, prevalence, mortality, and burden of diseases and other adverse health conditions that exist among specific population groups in the United States (NIH). Instead of focusing on specific health disparities (such as HIV or homicide rates), our focus will be on improving the social determinants of health, which lead to health disparities, and often affect minorities disproportionately. The public health system should
• increase health literacy and • improve social determinants of health such as unemployment, housing, poverty, education, language barriers, and
transportation.
Maternal, Infant & Child Health Maternal Child Health (MCH) measures are a basic gauge of the health of a community. Infant mortality rate and other MCH measures have improved significantly over the past ten years. Nonetheless, effort is required to protect this vulnerable population, especially for racial and ethnic minorities. The public health system should
• reduce infant mortality, • promote healthy birth outcomes, and • reduce teen pregnancy and repeat teen births
Safe Community Environments A safe and healthy environment is a core public health function to assure a healthy population. The public health system should
• reduce mortality from unintentional injury, • promote safe neighborhoods, • advocate for a built environment that supports healthy lifestyle choices, and • sustain programs that assure achievement of air and water quality standards.
iv
Lee County CHA/CHIP 2012-2015
Introduction What produces our health? Health is not only the absence of a disease or disability but “a state of complete physical, mental and social well-being.” Health involves more than health care, doctors, and hospitals. Most of us know in order to stay healthy we should eat right, exercise, wash our hands, limit the amount of alcohol we drink, avoid smoking, receive preventive screenings and immunizations, and go to the doctor when we are sick. However, many are unaware that health is also shaped by the environment we live in and access to social and economic opportunities.
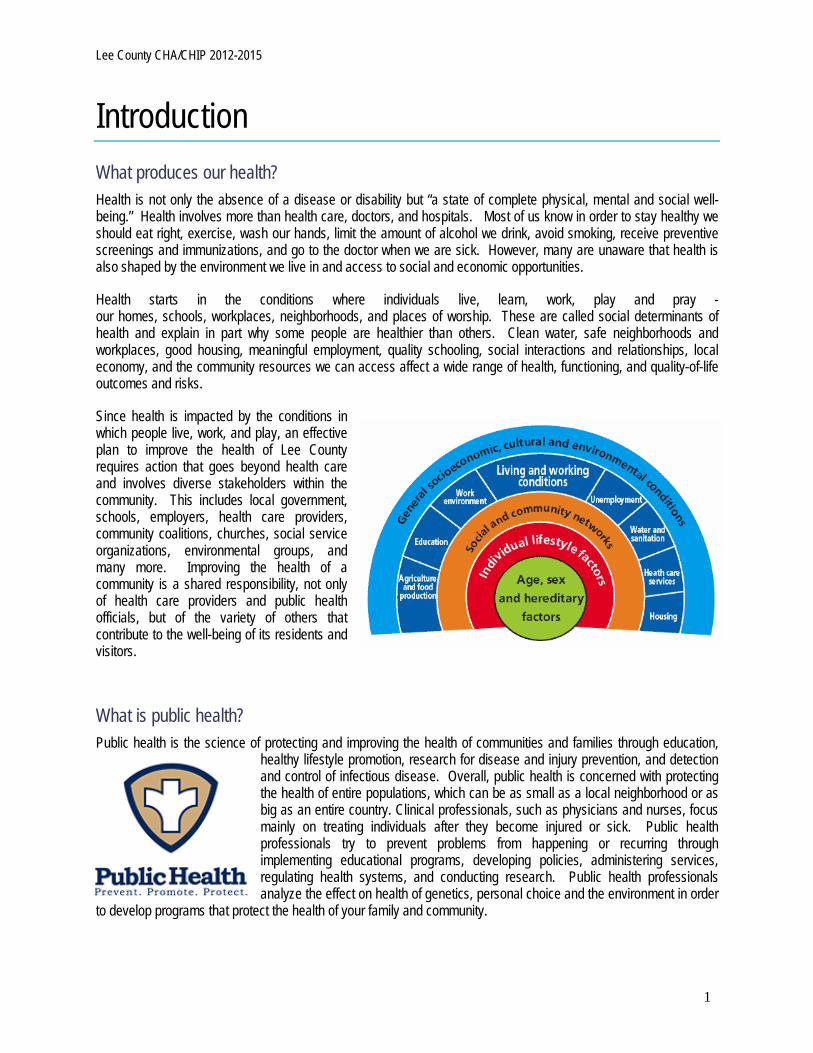
Health starts in the conditions where individuals live, learn, work, play and pray - our homes, schools, workplaces, neighborhoods, and places of worship. These are called social determinants of health and explain in part why some people are healthier than others. Clean water, safe neighborhoods and workplaces, good housing, meaningful employment, quality schooling, social interactions and relationships, local economy, and the community resources we can access affect a wide range of health, functioning, and quality-of-life outcomes and risks.
Since health is impacted by the conditions in which people live, work, and play, an effective plan to improve the health of Lee County requires action that goes beyond health care and involves diverse stakeholders within the community. This includes local government, schools, employers, health care providers, community coalitions, churches, social service organizations, environmental groups, and many more. Improving the health of a community is a shared responsibility, not only of health care providers and public health officials, but of the variety of others that contribute to the well-being of its residents and visitors.
What is public health? Public health is the science of protecting and improving the health of communities and families through education,
healthy lifestyle promotion, research for disease and injury prevention, and detection and control of infectious disease. Overall, public health is concerned with protecting the health of entire populations, which can be as small as a local neighborhood or as big as an entire country. Clinical professionals, such as physicians and nurses, focus mainly on treating individuals after they become injured or sick. Public health professionals try to prevent problems from happening or recurring through implementing educational programs, developing policies, administering services, regulating health systems, and conducting research. Public health professionals analyze the effect on health of genetics, personal choice and the environment in order
to develop programs that protect the health of your family and community.
1
Lee County CHA/CHIP 2012-2015
1. Monitor health status to identify community health problems.
2. Diagnose and investigate health problems and health hazards in the community.
3. Inform, educate, and empower people about health issues.
4. Mobilize community partnerships to identify and solve health problems.
5. Develop policies and plans that support individual and community health efforts.
6. Enforce laws and regulations that protect health and ensure safety.
7. Link people to needed personal health services and assure the provision of health care when otherwise unavailable.
8. Assure a competent public health and personal healthcare workforce.
9. Evaluate effectiveness, accessibility, and quality of personal and population-based health services.
10. Research for new insights and innovative solutions to health problems.
Since 1900, the life expectancy of Americans has increased about 30 years, with over twenty-five of those 30 years attributed to public health initiatives, and less than four years due to medical advances. These public health achievements include infectious disease control resulting from improved sanitation through clean air, clean water, and proper sewage disposal; vaccination; and reducing the infant mortality rate.
Public health is also concerned with limiting health disparities. A large part of public health is the fight for health care equity, quality, and accessibility. The field of public health is highly varied and encompasses many academic disciplines.
What is a Community Health Improvement Plan? According to the Centers for Disease Control, a CHIP is a long-term, systematic effort to address public health problems on the basis of the results of community health assessment activities and the community health improvement process. Community partners who make up the public health system- the public, private, and voluntary entities that contribute to the health and wellbeing of the community- collaborate to identify health issues, set priorities and target resources. The plan identifies strategic issues and desired health and public health system outcomes to be achieved. A CHIP serves to address issues, roles, and common goals and objectives throughout the community. A CHIP can be used by health departments, as well as other government, education, and human service agencies, to coordinate efforts and target resources that promote health. The plan can be used to guide action and monitor and measure progress toward achievement of goals and objectives.
2
Lee County CHA/CHIP 2012-2015
Background How was this Community Health Improvement Plan developed? The Florida Department of Health in Lee County Community Health Improvement Plan is based upon three major community assessment documents:
Community Health Visioning 2017 Lee County Sustainability Assessment Local Public Health System Performance Assessment
and the strategic planning of three community coalitions: Lee County Injury Prevention Coalition Tobacco-Free Lee Coalition Healthy Lee Coalition.
Assessment 1: Community Health Visioning 2017 Lee Memorial Health System (LMHS) launched Community Health Visioning 2017 to fully engage its community members to create a united, shared vision for coordinated, community-wide health care. Focusing on quality, efficiency, and shared planning for the future, a 38-member steering committee of community leaders guided the Visioning effort. Committee members were from all areas of the community, including health care, education, government, private businesses and non-profit organizations.
Beginning in 2007, several avenues were used to collect feedback from the community, including conducting a 1,000-person telephone survey, an online survey, four town hall meetings and 150 focus groups. Key members of the LMHS staff worked with the committee to penetrate deep into the community- reaching 4,000 stakeholders in only a few months.
Behavioral and mental health services were the top priority in 2007. A community-led task force studied the need for increased access to mental health services and initiated several strategies including a new inpatient psychiatric hospital, improved appointment system at the community mental health center, and a low demand shelter to serve as an alternative to incarceration for non-violent offenders. A strong sense of community-wide ownership emerged from the work of the task force. The community realized that the complexities of both short- and long-term health needs are challenges for the entire community to tackle together.
In 2012, the Steering Committee assessed progress and health indicators and re-ordered the goal areas: 1. Healthy Lifestyles 2. Primary Care Alternatives 3. Chronic Disease Management 4. Behavioral Health 5. Public Awareness of Services 6. Healthcare Workforce Shortage 7. Electronic Medical Record
3
Lee County CHA/CHIP 2012-2015
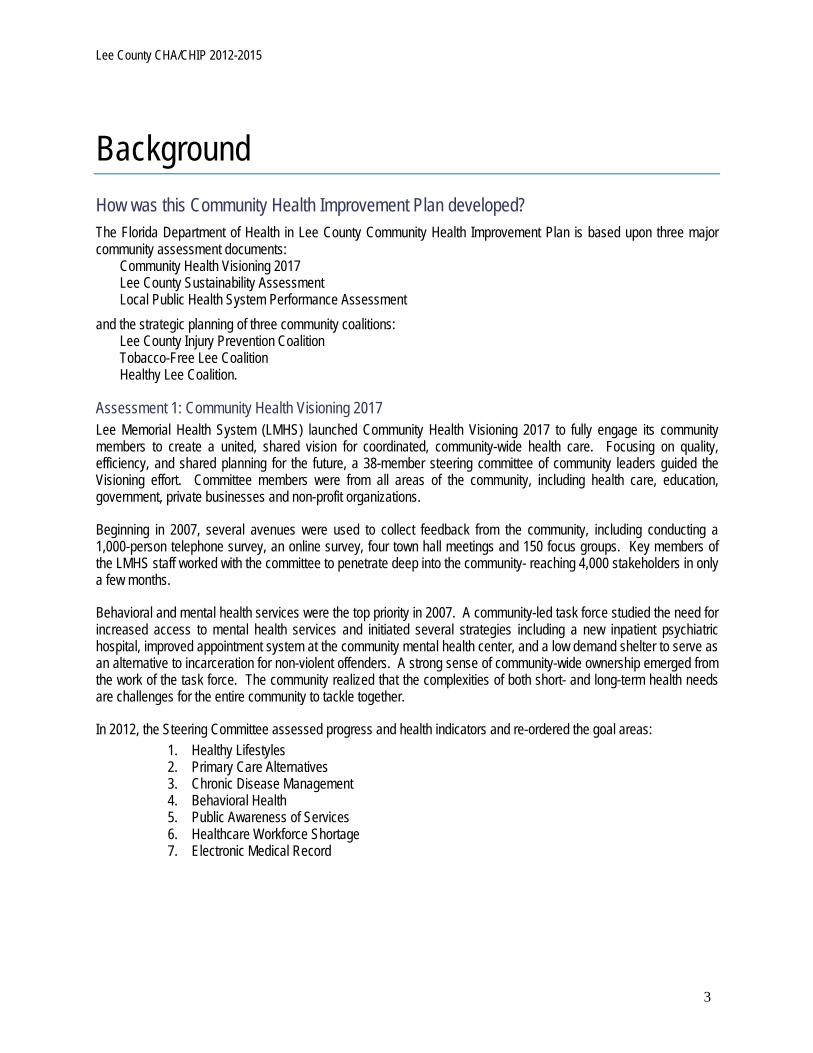
Assessment 2: Lee County Sustainability Assessment The Lee County Sustainability Advisory Committee and the Lee County Office of Sustainability were established in June 2010 and tasked with the functions of guiding and coordinating Lee County’s sustainability efforts, incorporating the tenets of smart growth, and maximizing opportunities to promote balanced social, economic, and environmental resources in our community. The Committee’s goal is to position Lee County to achieve long-term sustainability. Their purpose has been defined as identify goals and realize Lee County’s commitment to conducting the most efficient, responsible and coordinated operations; and providing leadership in the cultivation of a livable and resilient community where there is an unmistakable balance between social well-being and equity, economic prosperity and environmental resource conservation.
As a result the Lee County Sustainability Advisory Committee conducted several community assessments. This CHIP includes the Society, Economy, and Environment (S.E.E.) Synergies examined during the Health and Safety Assessment:
• Good health requires social respect, self respect, fresh air, good nutrition, safe environments and a feeling of usefulness. People need to control their own destiny, including the ability to adequately care for themselves.
• A sustainable community requires a shared responsibility in the health of the community. Proper nutritional and physical activity programs will promote, encourage and educate our community on the benefits of healthy choices and actions.
• Encouraging involvement in growing and consuming local foods can raise nutritional awareness, provide economic support to local farmers and grocers and influence dietary habits. Consuming more locally grown foods will reduce our ecological footprint (transportation of foods), encourage collaboration and employ local residents, further sustaining our local economy.
• Developing strategies for preventive health services must include policies on land use reform, education, affordable housing, recreation and social safety nets.
4
Lee County CHA/CHIP 2012-2015
• For industrial companies, workplace safety is a key measure of financial performance and assurance. Safe work environments are the result of creating a sustainable culture where there is respect for all stakeholders, from the employees to the community to the environment.
• The Health and Safety S.E.E. Synergies subgroup has identified the following priorities, not in rank order: - Health System - Health and Safety Literacy - Workplace Health and Safety - Food Access and Nutrition - Drinking Water Quality - Outdoor Air Quality - Indoor Air Quality - Toxics Reduction - Natural and Human Hazards - Emergency Prevention and Response - Safe Communities - Active Living
Assessment 3: Local Public Health System Performance Assessment The Local Public Health System Performance Assessment evaluated the activities and capabilities of not only our health department but also Lee County’s overall public health system against the Ten Essential Public Health Services. We were able to determine how well we, as a local health department, are providing the Essential Public Health Services.
Three strong community coalitions were formed as a result of previous Community Health Assessments. Each coalition has identified and is implementing strategies to address specific health needs in the community. The CHIP honors that work and incorporates these strategies. Coalition 1: Lee County Injury Prevention Coalition
Since 1995, Lee County Injury Prevention Coalition (IPC) has been working to deliver a unified safety message, provide valuable safety-related resources and offer education and training related to injury prevention.
Members include health and safety agencies, educators, governments and volunteers, including emergency medical services, fire and rescue agencies, law enforcement agencies, hospital outreach programs, health agencies, and public and private schools. The strategic goals of IPC are to
• Reduce injury, disability and death from falls, • Reduce injury, disability and death from traffic crashes, • Reduce injury, disability and death from intentional injuries, • Reduce injury, disability and death from unintentional poisonings, • Reduce injury, disability and death from drowning, • Reduce injury, disability and death from natural and man-made environmental hazards, • Reduce injury, disability and death from sports and recreational activities, • Expand and strengthen the Injury Prevention Coalition, and • Achieve International Safe Community designation.
5

Lee County CHA/CHIP 2012-2015
Coalition 2: Tobacco-Free Lee The Tobacco-Free Lee Coalition’s mission is to reduce the incidence and prevalence of tobacco use through advocating for evidence-based prevention strategies and policy change. The Coalition is facilitated by staff of the Florida Department of Health in Lee County. Membership includes representatives of hospitals, health care providers, law enforcement, Bureau of Tobacco and Firearms, voluntary health agencies, students and teachers. Their strategic goals are to
• Establish one policy to “prohibit/limit tobacco industry advertising in retail outlets” by June 30, 2015,
• Establish one policy to implement “Model Policy in K-12 Schools” by June 30, 2013,
• Establish one policy to “Create Tobacco-Free Multi-Unit Dwellings” by June 30, 2013,
• Establish one policy that “increases the number of larger employers that offer access to cessation services to their employees,” and
• Establish one policy to “restrict the sale of candy-flavored tobacco products not restricted by FDA” by June 30, 2013.
Coalition 3: Healthy Lee Healthy Lee was formed in 2010 to address the problem of overweight and obesity in Lee County, and the increasing prevalence of chronic diseases associated with obesity. The Coalition boasts over 100 active members from health care, government, education, social services, and the private sector. In 2013, Healthy Lee updated its five strategic goals:
• Expand commitment to Healthy Lee • Improve the Nutritional Habits of the People in Lee County • Increase the Physical Activity of the People in Lee County • Encourage Healthy Lifestyles and Wellness Initiative in the Workplace, Neighborhoods, and Churches • Influence Policy and Environmental changes in support of healthier lifestyles
These coalitions meet monthly and the dates may be found on the following calendar sites: Lee County Injury Prevention Coalition http://www.leecountyinjuryprevention.org/calendar/calendar.html Tobacco-Free Lee http://calendar.doh.state.fl.us/main.php?calendar=CHDLee&view=month Healthy Lee http://www.healthylee.com/
6
Lee County CHA/CHIP 2012-2015
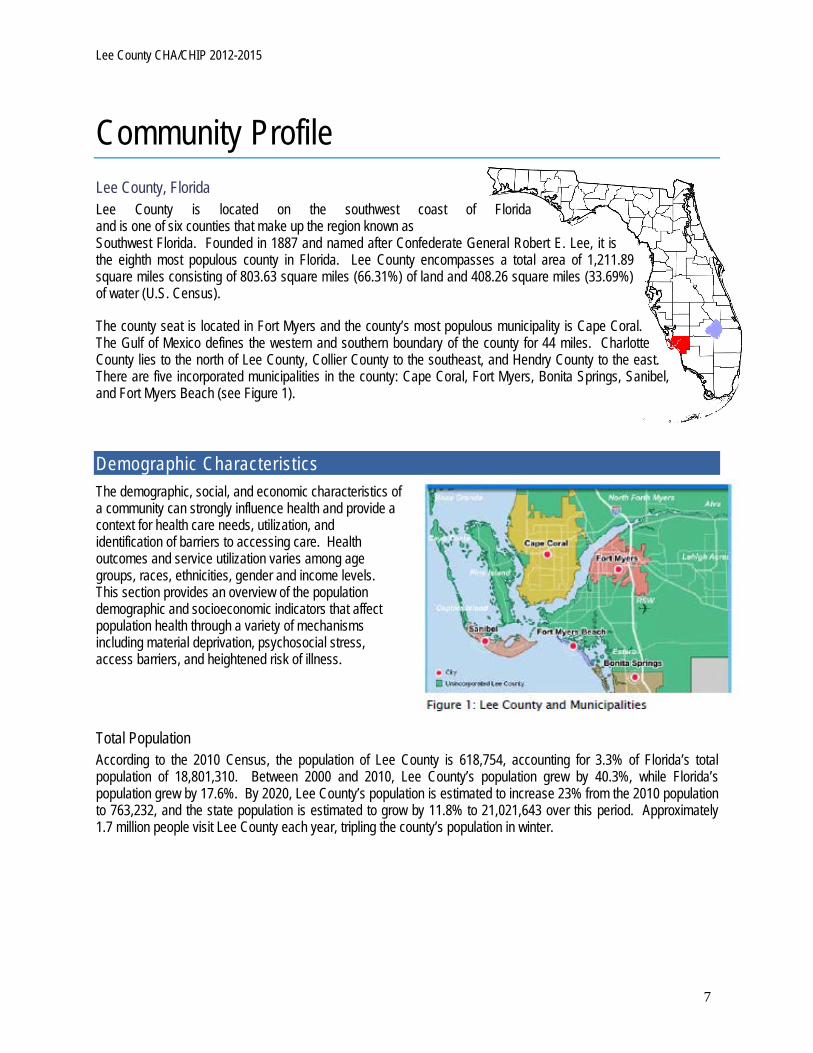
Community Profile Lee County, Florida Lee County is located on the southwest coast of Florida and is one of six counties that make up the region known as Southwest Florida. Founded in 1887 and named after Confederate General Robert E. Lee, it is the eighth most populous county in Florida. Lee County encompasses a total area of 1,211.89 square miles consisting of 803.63 square miles (66.31%) of land and 408.26 square miles (33.69%) of water (U.S. Census).
The county seat is located in Fort Myers and the county’s most populous municipality is Cape Coral. The Gulf of Mexico defines the western and southern boundary of the county for 44 miles. Charlotte County lies to the north of Lee County, Collier County to the southeast, and Hendry County to the east. There are five incorporated municipalities in the county: Cape Coral, Fort Myers, Bonita Springs, Sanibel, and Fort Myers Beach (see Figure 1).
Demographic Characteristics The demographic, social, and economic characteristics of a community can strongly influence health and provide a context for health care needs, utilization, and identification of barriers to accessing care. Health outcomes and service utilization varies among age groups, races, ethnicities, gender and income levels. This section provides an overview of the population demographic and socioeconomic indicators that affect population health through a variety of mechanisms including material deprivation, psychosocial stress, access barriers, and heightened risk of illness. Total Population According to the 2010 Census, the population of Lee County is 618,754, accounting for 3.3% of Florida’s total population of 18,801,310. Between 2000 and 2010, Lee County’s population grew by 40.3%, while Florida’s population grew by 17.6%. By 2020, Lee County’s population is estimated to increase 23% from the 2010 population to 763,232, and the state population is estimated to grow by 11.8% to 21,021,643 over this period. Approximately 1.7 million people visit Lee County each year, tripling the county’s population in winter.
7
Lee County CHA/CHIP 2012-2015
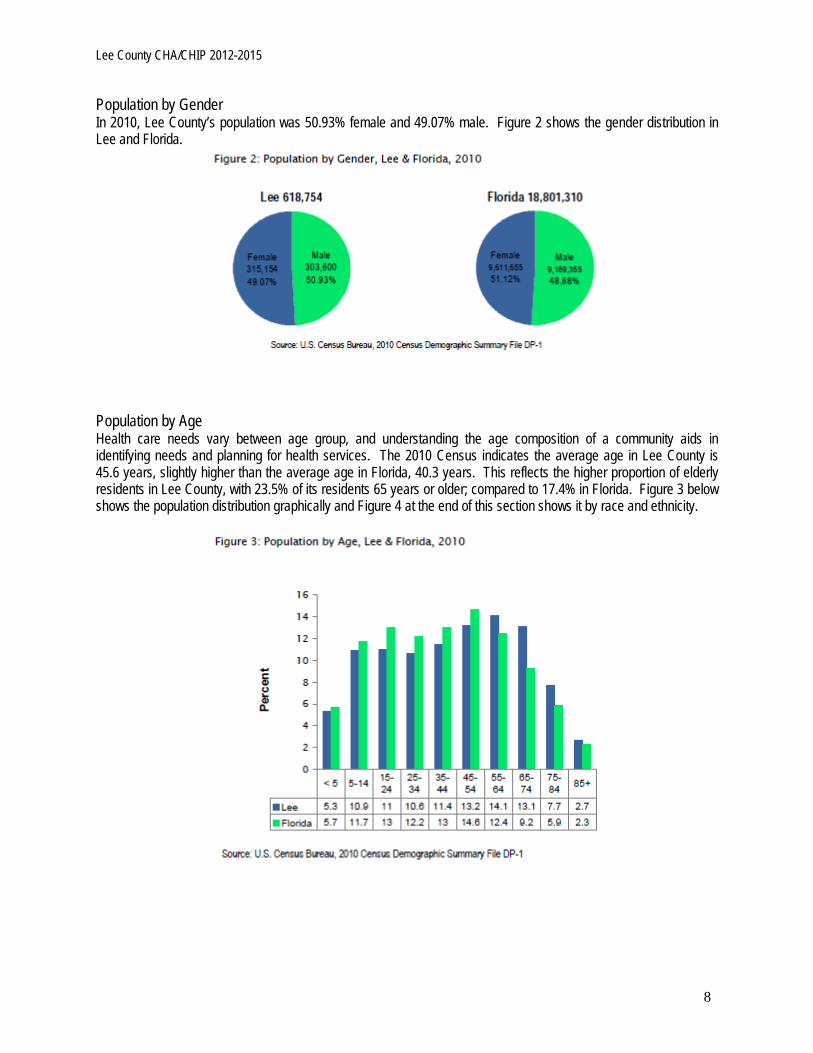
Population by Gender In 2010, Lee County’s population was 50.93% female and 49.07% male. Figure 2 shows the gender distribution in Lee and Florida.
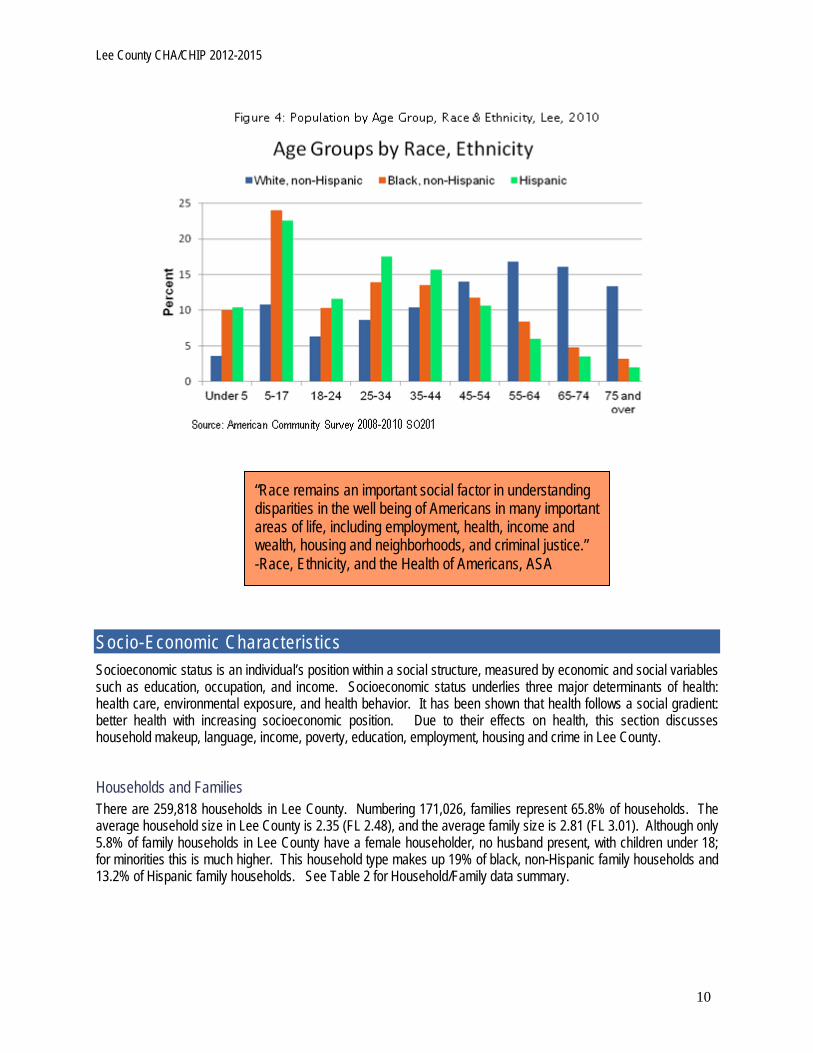
Population by Age Health care needs vary between age group, and understanding the age composition of a community aids in identifying needs and planning for health services. The 2010 Census indicates the average age in Lee County is 45.6 years, slightly higher than the average age in Florida, 40.3 years. This reflects the higher proportion of elderly residents in Lee County, with 23.5% of its residents 65 years or older; compared to 17.4% in Florida. Figure 3 below shows the population distribution graphically and Figure 4 at the end of this section shows it by race and ethnicity.
8

Lee County CHA/CHIP 2012-2015
Population by Race and Ethnicity The racial and ethnic diversity within an area is an important consideration for health planning because health behavior, the quantity and quality of care, and health outcomes differ between races and ethnicities. Race refers to an individual’s physical appearance, such as skin color, bone structure, hair type, etc. Ethnicity, on the other hand, relates to cultural factors such as nationality, ancestry, language, and religion, which cause common norms, customs and practices. Although race is a social concept without any biological basis, health disparities persist due to racial inequality in society and its institutions. Lee County’s population is 83% white, 8.3% black, and 8.7% other (including more than one race designation). Currently at 18.3% of the population, the percentage of Hispanics has increased from six years ago when they comprised just below 11% of the population. Table 1 shows the racial and ethnic composition of Lee County and Florida.
9
Lee County CHA/CHIP 2012-2015
Socio-Economic Characteristics Socioeconomic status is an individual’s position within a social structure, measured by economic and social variables such as education, occupation, and income. Socioeconomic status underlies three major determinants of health: health care, environmental exposure, and health behavior. It has been shown that health follows a social gradient: better health with increasing socioeconomic position. Due to their effects on health, this section discusses household makeup, language, income, poverty, education, employment, housing and crime in Lee County.
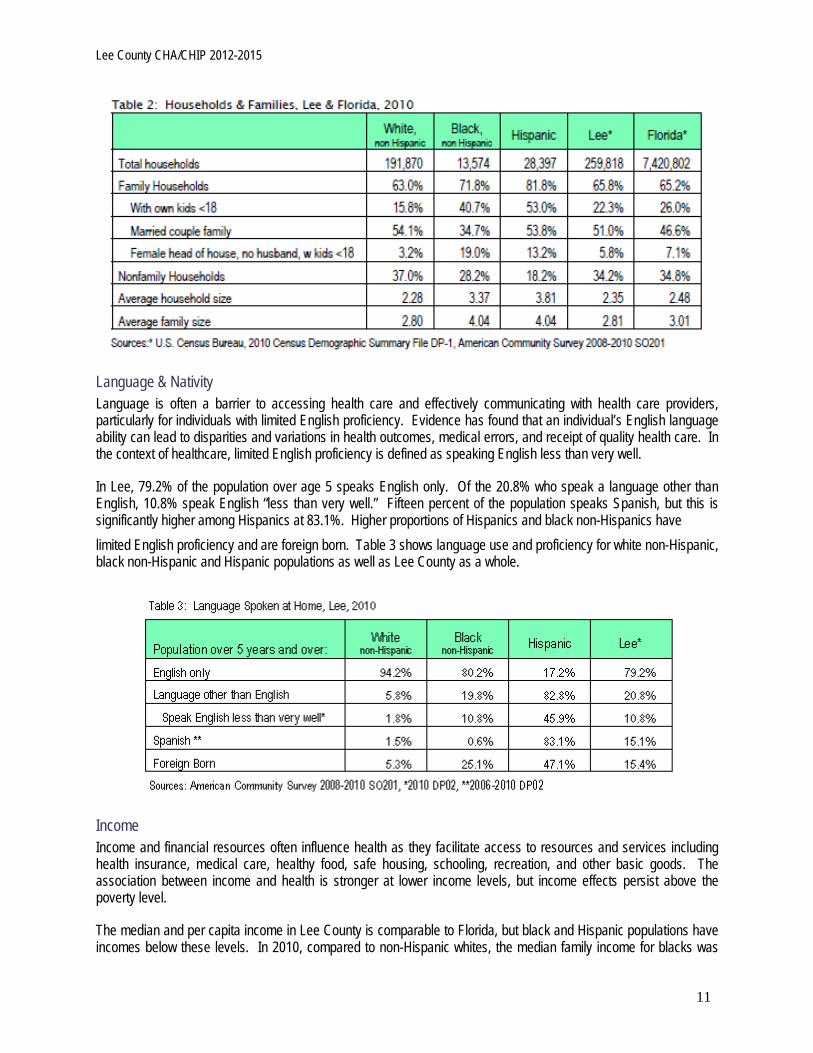
Households and Families There are 259,818 households in Lee County. Numbering 171,026, families represent 65.8% of households. The average household size in Lee County is 2.35 (FL 2.48), and the average family size is 2.81 (FL 3.01). Although only 5.8% of family households in Lee County have a female householder, no husband present, with children under 18; for minorities this is much higher. This household type makes up 19% of black, non-Hispanic family households and 13.2% of Hispanic family households. See Table 2 for Household/Family data summary.
“Race remains an important social factor in understanding disparities in the well being of Americans in many important areas of life, including employment, health, income and wealth, housing and neighborhoods, and criminal justice.” -Race, Ethnicity, and the Health of Americans, ASA
10
Lee County CHA/CHIP 2012-2015
Language & Nativity Language is often a barrier to accessing health care and effectively communicating with health care providers, particularly for individuals with limited English proficiency. Evidence has found that an individual’s English language ability can lead to disparities and variations in health outcomes, medical errors, and receipt of quality health care. In the context of healthcare, limited English proficiency is defined as speaking English less than very well.
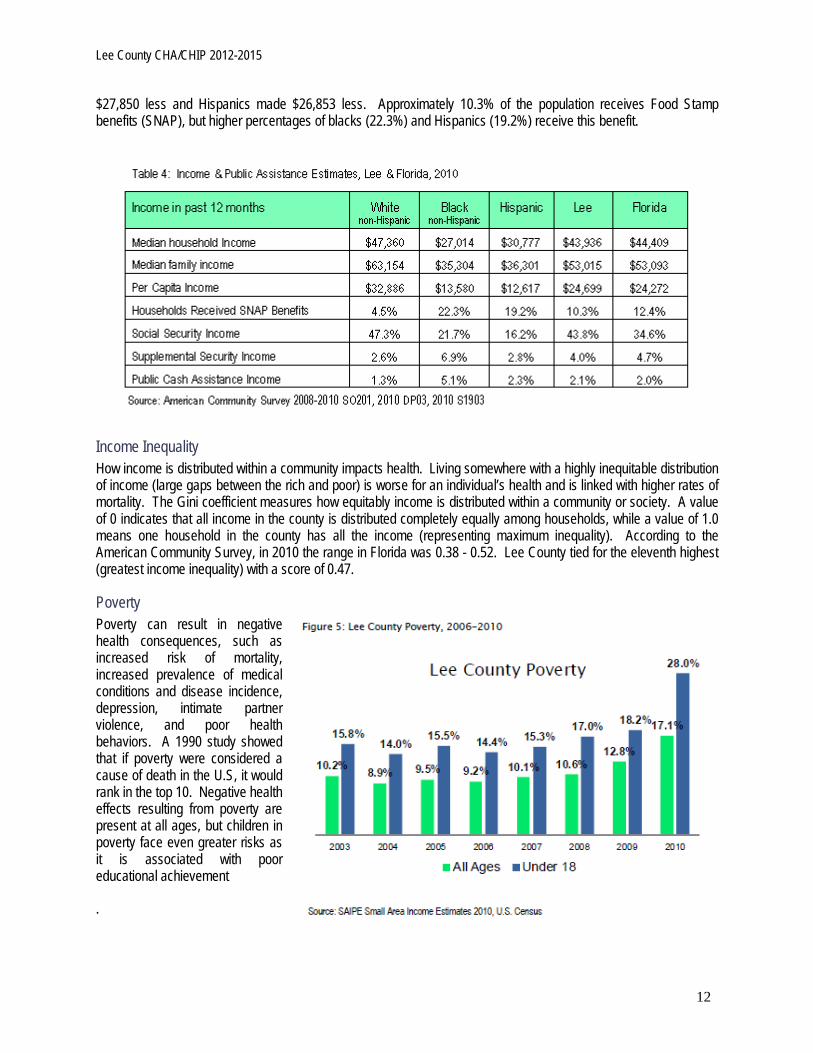
In Lee, 79.2% of the population over age 5 speaks English only. Of the 20.8% who speak a language other than English, 10.8% speak English “less than very well.” Fifteen percent of the population speaks Spanish, but this is significantly higher among Hispanics at 83.1%. Higher proportions of Hispanics and black non-Hispanics have limited English proficiency and are foreign born. Table 3 shows language use and proficiency for white non-Hispanic, black non-Hispanic and Hispanic populations as well as Lee County as a whole.
Income Income and financial resources often influence health as they facilitate access to resources and services including health insurance, medical care, healthy food, safe housing, schooling, recreation, and other basic goods. The association between income and health is stronger at lower income levels, but income effects persist above the poverty level.
The median and per capita income in Lee County is comparable to Florida, but black and Hispanic populations have incomes below these levels. In 2010, compared to non-Hispanic whites, the median family income for blacks was
11
Lee County CHA/CHIP 2012-2015
$27,850 less and Hispanics made $26,853 less. Approximately 10.3% of the population receives Food Stamp benefits (SNAP), but higher percentages of blacks (22.3%) and Hispanics (19.2%) receive this benefit.
Income Inequality How income is distributed within a community impacts health. Living somewhere with a highly inequitable distribution of income (large gaps between the rich and poor) is worse for an individual’s health and is linked with higher rates of mortality. The Gini coefficient measures how equitably income is distributed within a community or society. A value of 0 indicates that all income in the county is distributed completely equally among households, while a value of 1.0 means one household in the county has all the income (representing maximum inequality). According to the American Community Survey, in 2010 the range in Florida was 0.38 - 0.52. Lee County tied for the eleventh highest (greatest income inequality) with a score of 0.47.
Poverty Poverty can result in negative health consequences, such as increased risk of mortality, increased prevalence of medical conditions and disease incidence, depression, intimate partner violence, and poor health behaviors. A 1990 study showed that if poverty were considered a cause of death in the U.S, it would rank in the top 10. Negative health effects resulting from poverty are present at all ages, but children in poverty face even greater risks as it is associated with poor educational achievement
.
12
Lee County CHA/CHIP 2012-2015
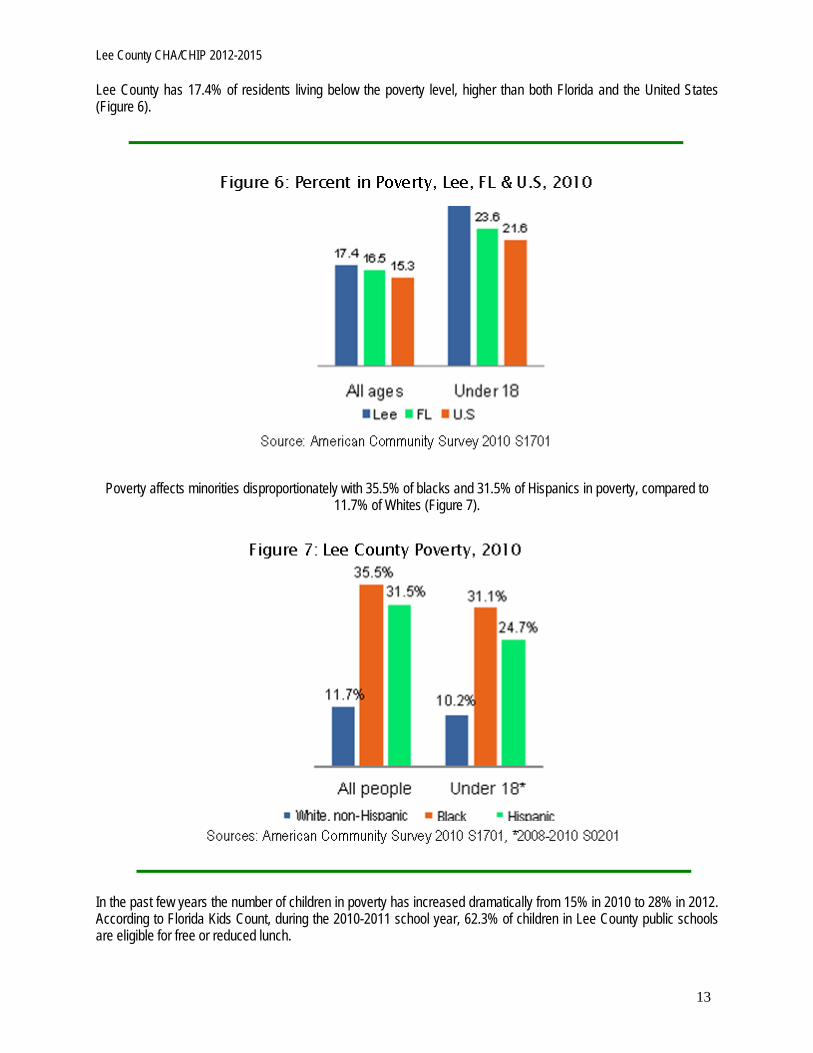
Lee County has 17.4% of residents living below the poverty level, higher than both Florida and the United States (Figure 6).
Poverty affects minorities disproportionately with 35.5% of blacks and 31.5% of Hispanics in poverty, compared to 11.7% of Whites (Figure 7).
In the past few years the number of children in poverty has increased dramatically from 15% in 2010 to 28% in 2012. According to Florida Kids Count, during the 2010-2011 school year, 62.3% of children in Lee County public schools are eligible for free or reduced lunch.
13
Lee County CHA/CHIP 2012-2015
Education Educational attainment is a basic component of an individual’s socioeconomic status, as it shapes future occupational opportunities and earning potential. Education provides the knowledge and life-skills which allow those who are better educated improved access to information and opportunities, leading to improved health outcomes. The total number of years of education, as well as involvement in early childhood education, has been found to affect health outcomes.
Wide gaps in educational attainment exist within Lee County. Overall, 14% of Lee residents over age 25 are not high school graduates. About 35% of Hispanics and 27% of black non-Hispanics have less than a high school education compared with only 8% of whites. The number of white non-Hispanics with a Bachelor (17.3%) or Graduate (10%) degree is higher than both the county and state. Statistics show that 16.6% of Floridians have a Bachelors Degree, and 9.2% have a Graduate Degree. Only about 8% of black non-Hispanics have a Bachelors Degree, and less than 4% of Hispanics have a Graduate Degree. The data is summarized in Table 5.
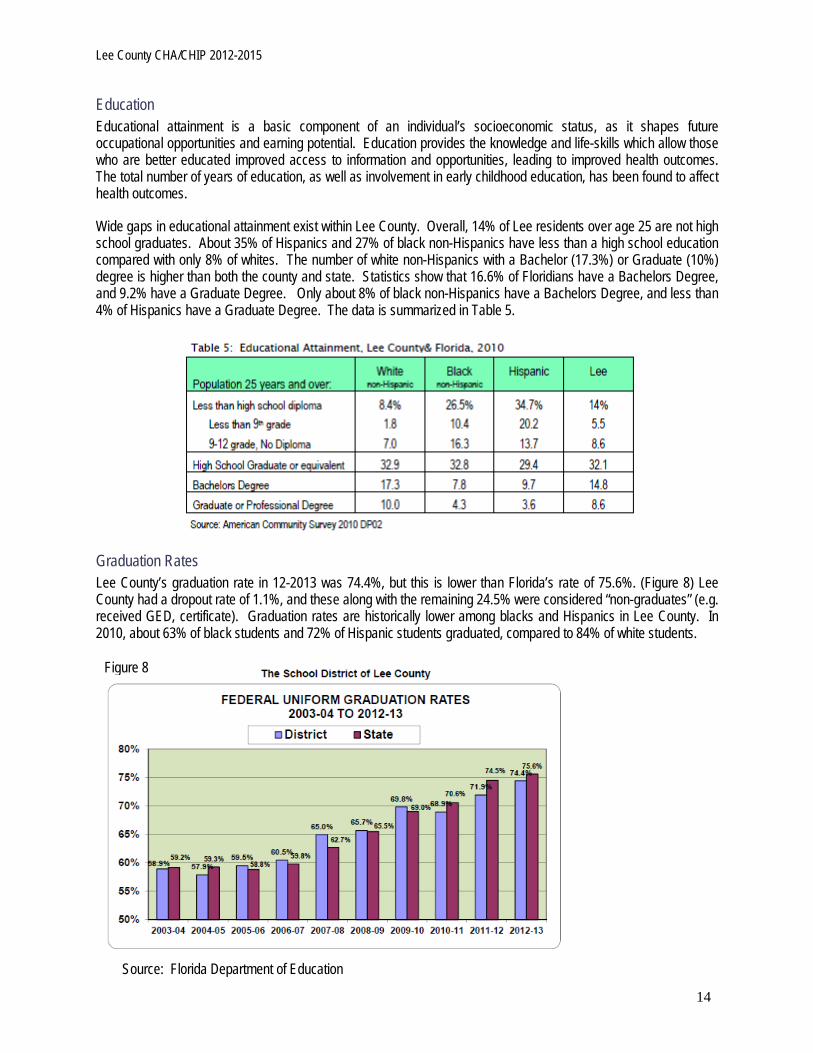
Graduation Rates Lee County’s graduation rate in 12-2013 was 74.4%, but this is lower than Florida’s rate of 75.6%. (Figure 8) Lee County had a dropout rate of 1.1%, and these along with the remaining 24.5% were considered “non-graduates” (e.g. received GED, certificate). Graduation rates are historically lower among blacks and Hispanics in Lee County. In 2010, about 63% of black students and 72% of Hispanic students graduated, compared to 84% of white students.
Source: Florida Department of Education
Figure 8
14
Lee County CHA/CHIP 2012-2015
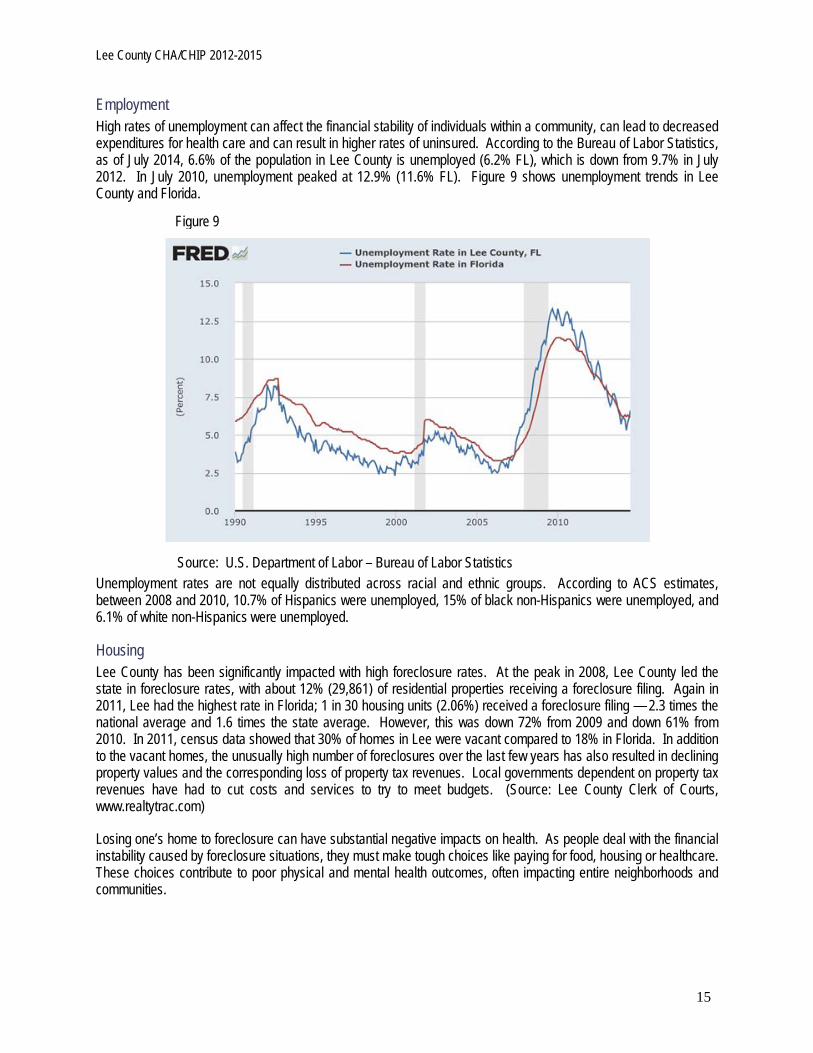
Employment High rates of unemployment can affect the financial stability of individuals within a community, can lead to decreased expenditures for health care and can result in higher rates of uninsured. According to the Bureau of Labor Statistics, as of July 2014, 6.6% of the population in Lee County is unemployed (6.2% FL), which is down from 9.7% in July 2012. In July 2010, unemployment peaked at 12.9% (11.6% FL). Figure 9 shows unemployment trends in Lee County and Florida.
Unemployment rates are not equally distributed across racial and ethnic groups. According to ACS estimates, between 2008 and 2010, 10.7% of Hispanics were unemployed, 15% of black non-Hispanics were unemployed, and 6.1% of white non-Hispanics were unemployed.
Housing Lee County has been significantly impacted with high foreclosure rates. At the peak in 2008, Lee County led the state in foreclosure rates, with about 12% (29,861) of residential properties receiving a foreclosure filing. Again in 2011, Lee had the highest rate in Florida; 1 in 30 housing units (2.06%) received a foreclosure filing — 2.3 times the national average and 1.6 times the state average. However, this was down 72% from 2009 and down 61% from 2010. In 2011, census data showed that 30% of homes in Lee were vacant compared to 18% in Florida. In addition to the vacant homes, the unusually high number of foreclosures over the last few years has also resulted in declining property values and the corresponding loss of property tax revenues. Local governments dependent on property tax revenues have had to cut costs and services to try to meet budgets. (Source: Lee County Clerk of Courts, www.realtytrac.com)
Losing one’s home to foreclosure can have substantial negative impacts on health. As people deal with the financial instability caused by foreclosure situations, they must make tough choices like paying for food, housing or healthcare. These choices contribute to poor physical and mental health outcomes, often impacting entire neighborhoods and communities.
Figure 9
Source: U.S. Department of Labor – Bureau of Labor Statistics
15

Lee County CHA/CHIP 2012-2015
Crime and Domestic Violence Crime in a community can influence health status both as a result of direct injury from the crimes themselves and as a result of the emotional stresses present in areas of high crime. Of the 67 counties in Florida, Lee County ranks 30th for crime, and 43rd for violent crime. From 2010 to 2011 there was a 4.3% increase in the county crime rate,
but violent crimes decreased 4.3%. Approximately 29% of new commitments to prison in 2011 were due to drugs. Of these, 45% were for manufacture/sale/purchase, 31% for drug trafficking, and 24% for drug possession. Table 6 shows counts of reported crimes in Lee County by the type of crime from the Uniform Crime Report (UCR). Table 7 summarizes crime rates in Lee and Florida.
16
Lee County CHA/CHIP 2012-2015
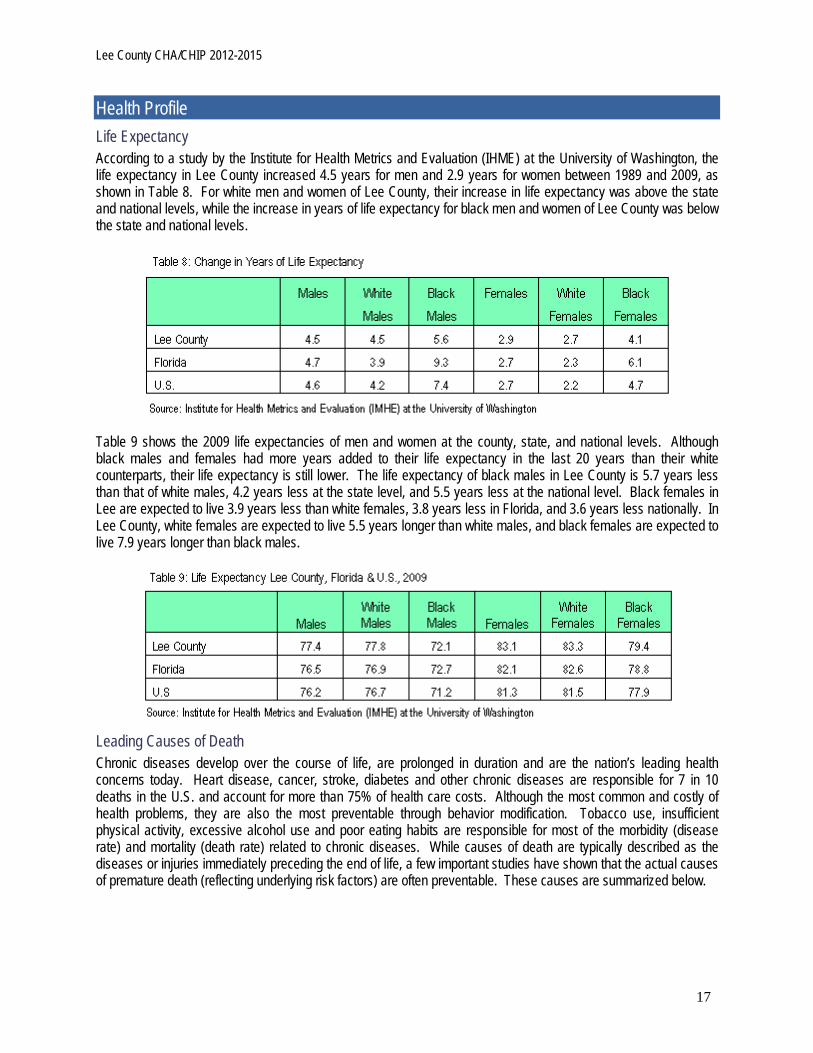
Health Profile Life Expectancy According to a study by the Institute for Health Metrics and Evaluation (IHME) at the University of Washington, the life expectancy in Lee County increased 4.5 years for men and 2.9 years for women between 1989 and 2009, as shown in Table 8. For white men and women of Lee County, their increase in life expectancy was above the state and national levels, while the increase in years of life expectancy for black men and women of Lee County was below the state and national levels.
Table 9 shows the 2009 life expectancies of men and women at the county, state, and national levels. Although black males and females had more years added to their life expectancy in the last 20 years than their white counterparts, their life expectancy is still lower. The life expectancy of black males in Lee County is 5.7 years less than that of white males, 4.2 years less at the state level, and 5.5 years less at the national level. Black females in Lee are expected to live 3.9 years less than white females, 3.8 years less in Florida, and 3.6 years less nationally. In Lee County, white females are expected to live 5.5 years longer than white males, and black females are expected to live 7.9 years longer than black males.
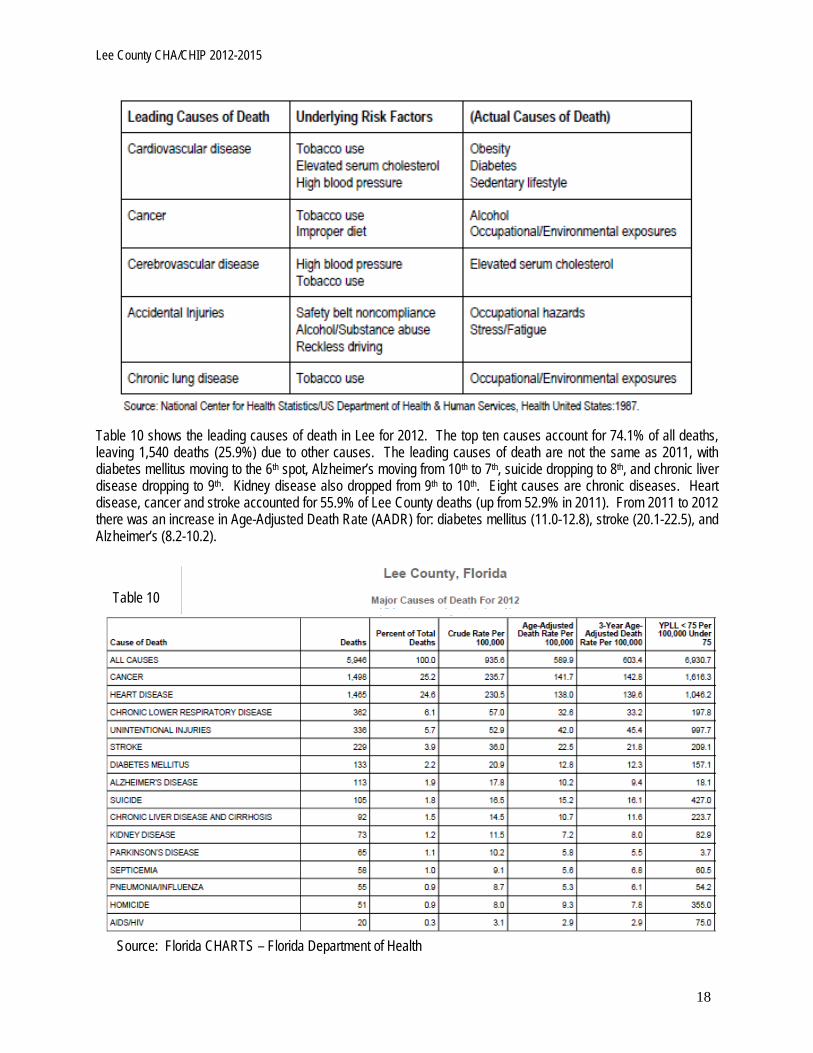
Leading Causes of Death Chronic diseases develop over the course of life, are prolonged in duration and are the nation’s leading health concerns today. Heart disease, cancer, stroke, diabetes and other chronic diseases are responsible for 7 in 10 deaths in the U.S. and account for more than 75% of health care costs. Although the most common and costly of health problems, they are also the most preventable through behavior modification. Tobacco use, insufficient physical activity, excessive alcohol use and poor eating habits are responsible for most of the morbidity (disease rate) and mortality (death rate) related to chronic diseases. While causes of death are typically described as the diseases or injuries immediately preceding the end of life, a few important studies have shown that the actual causes of premature death (reflecting underlying risk factors) are often preventable. These causes are summarized below.
17
Lee County CHA/CHIP 2012-2015
Table 10 shows the leading causes of death in Lee for 2012. The top ten causes account for 74.1% of all deaths, leaving 1,540 deaths (25.9%) due to other causes. The leading causes of death are not the same as 2011, with diabetes mellitus moving to the 6th spot, Alzheimer’s moving from 10th to 7th, suicide dropping to 8th, and chronic liver disease dropping to 9th. Kidney disease also dropped from 9th to 10th. Eight causes are chronic diseases. Heart disease, cancer and stroke accounted for 55.9% of Lee County deaths (up from 52.9% in 2011). From 2011 to 2012 there was an increase in Age-Adjusted Death Rate (AADR) for: diabetes mellitus (11.0-12.8), stroke (20.1-22.5), and Alzheimer’s (8.2-10.2).
Source: Florida CHARTS – Florida Department of Health
Table 10
18
Lee County CHA/CHIP 2012-2015
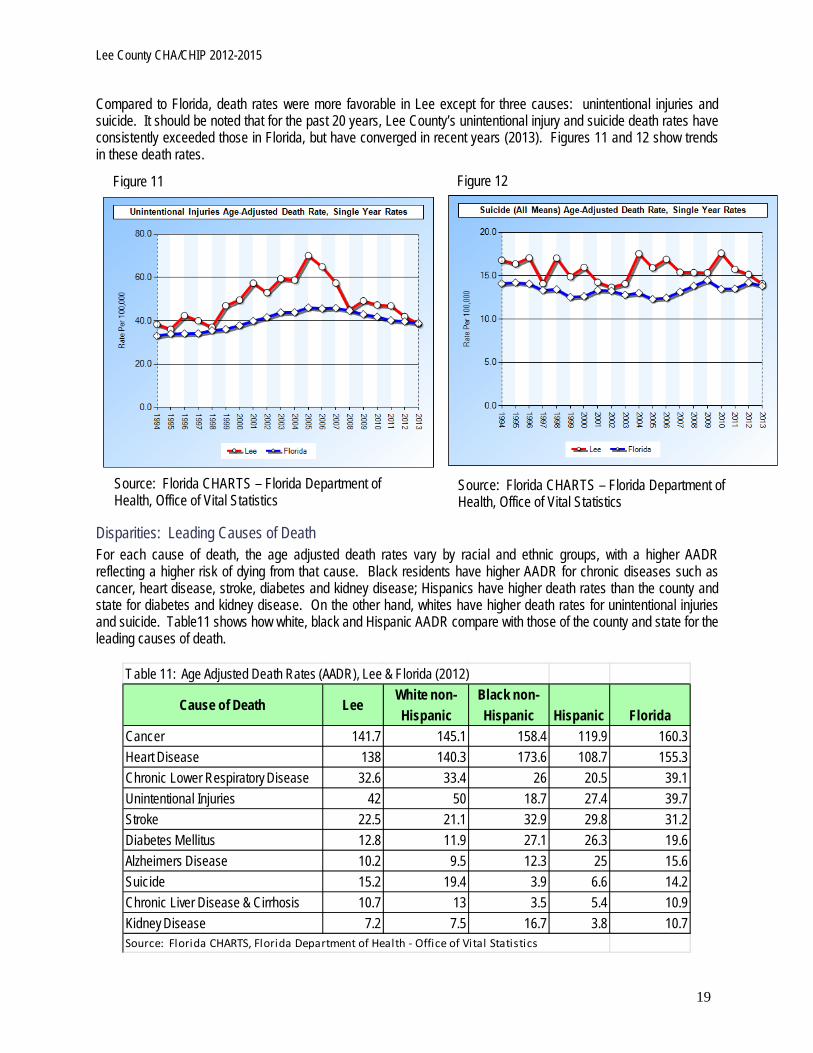
Compared to Florida, death rates were more favorable in Lee except for three causes: unintentional injuries and suicide. It should be noted that for the past 20 years, Lee County’s unintentional injury and suicide death rates have consistently exceeded those in Florida, but have converged in recent years (2013). Figures 11 and 12 show trends in these death rates.
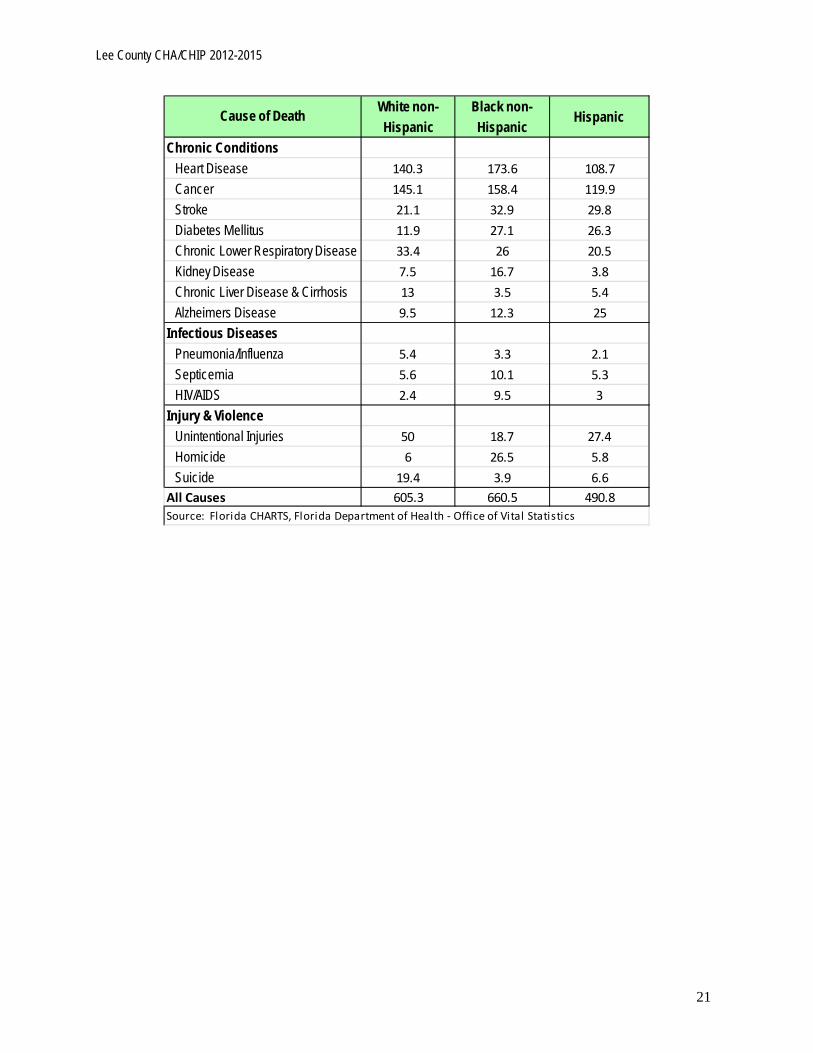
Disparities: Leading Causes of Death For each cause of death, the age adjusted death rates vary by racial and ethnic groups, with a higher AADR reflecting a higher risk of dying from that cause. Black residents have higher AADR for chronic diseases such as cancer, heart disease, stroke, diabetes and kidney disease; Hispanics have higher death rates than the county and state for diabetes and kidney disease. On the other hand, whites have higher death rates for unintentional injuries and suicide. Table11 shows how white, black and Hispanic AADR compare with those of the county and state for the leading causes of death.
Table 11: Age Adjusted Death Rates (AADR), Lee & Florida (2012)
Cause of Death LeeWhite non-Hispanic
Black non-Hispanic Hispanic Florida
Cancer 141.7 145.1 158.4 119.9 160.3Heart Disease 138 140.3 173.6 108.7 155.3Chronic Lower Respiratory Disease 32.6 33.4 26 20.5 39.1Unintentional Injuries 42 50 18.7 27.4 39.7Stroke 22.5 21.1 32.9 29.8 31.2Diabetes Mellitus 12.8 11.9 27.1 26.3 19.6Alzheimers Disease 10.2 9.5 12.3 25 15.6Suicide 15.2 19.4 3.9 6.6 14.2Chronic Liver Disease & Cirrhosis 10.7 13 3.5 5.4 10.9Kidney Disease 7.2 7.5 16.7 3.8 10.7Source: Florida CHARTS, Florida Department of Health - Office of Vital Statistics
Figure 11 Figure 12
Source: Florida CHARTS – Florida Department of Health, Office of Vital Statistics
Source: Florida CHARTS – Florida Department of Health, Office of Vital Statistics
19

Lee County CHA/CHIP 2012-2015
Leading causes of death varied by race and ethnicity. The ten leading causes of death for whites were the same as for the population as a whole, which is to be expected since 89% of decedents were white.
Table 12 shows the major causes of death for white non-Hispanic, black non-Hispanic, and Hispanic Lee County residents (all ages). The leading causes of death are not equally distributed across all racial and ethnic groups. Cancer, heart disease, chronic lower respiratory disease, unintentional injury, stroke, and diabetes are common to the top ten causes of death for all groups. However, chronic liver disease is a leading cause among whites only, and hypertensive/renal conditions are top causes among blacks only. Homicide and perinatal conditions is a leading cause only among black and Hispanic populations.
Table 12: Major Causes of Death by Race / Ethnicity, Lee County, 2012
Rank OrderPercent Deaths
Rank OrderPercent Deaths
Rank OrderPercent Deaths
Cancer 30.9 Heart Disease 28.3 Cancer 28.8Heart Disease 30.4 Cancer 27.2 Heart Disease 22.5Chronic Lower Respiratory Disease
7.7 Homicide 6.6 Unintentional Injuries 9.4
Unintentional Injuries 6.9 Stroke 5.9 Stroke 6.4Stroke 4.5 Diabetes Mellitus 4.8 Diabetes Mellitus 5.6
Diabetes Mellitus 2.4Chronic Lower Respiratory Disease
4.5Chronic Lower Respiratory Disease
4.5
Alzheimers Disease 2.2 Unintentional Injuries 3.4 Alzheimers Disease 4.1
Suicide 2.2 Kidney Disease 2.8 Suicide 3.0Chronic Liver Disease & Cirrhosis
2 Hypertension/Renal 2.8 Homicide 3.0
Kidney Disease 1.5 Perinatal 2.8 Perinatal 2.2Source: Florida CHARTS, Florida Department of Health - Office of Vital Statistics
White non-Hispanic Black non-Hispanic Hispanic
Hispanic residents had AADRs higher than non-Hispanic whites for diabetes, kidney disease, septicemia, homicide and HIV. In comparison to non-Hispanic whites, the Hispanic age-adjusted death rate for diabetes was 98% higher, 139% higher for kidney disease, 43.6% higher for septicemia, 55.6% higher for homicide, and 308.3% higher for HIV. Black non-Hispanics had AADR for stroke at 16.5% greater than whites, AADR for stroke 208.8% higher, and AADR for kidney disease at 292.2% higher. Among black non-Hispanics, in comparison to white non-Hispanics, the greatest disparities in death rates are for HIV and homicide. The black AADR for homicide is 444% higher than whites and 1850% greater for HIV. Table 13 compares AADRs for causes of death by race and ethnicity.
20
Lee County CHA/CHIP 2012-2015
White non-Hispanic
Black non-Hispanic
Hispanic
140.3 173.6 108.7145.1 158.4 119.921.1 32.9 29.811.9 27.1 26.333.4 26 20.57.5 16.7 3.813 3.5 5.49.5 12.3 25
5.4 3.3 2.15.6 10.1 5.32.4 9.5 3
50 18.7 27.46 26.5 5.8
19.4 3.9 6.6605.3 660.5 490.8
Injury & ViolenceUnintentional InjuriesHomicide
All Causes
Diabetes MellitusChronic Lower Respiratory DiseaseKidney DiseaseChronic Liver Disease & Cirrhosis Alzheimers Disease
Suicide
Infectious DiseasesPneumonia/InfluenzaSepticemiaHIV/AIDS
Source: Florida CHARTS, Florida Department of Health - Office of Vital Statistics
Cause of Death
Chronic ConditionsHeart DiseaseCancerStroke
21
Lee County CHA/CHIP 2012-2015
Community Health Assessment Highlights Local Public Health System Assessment Led by the Centers for Disease Control (CDC), the National Public Health Performance Standards Program (NPHPSP) is an initiative that developed national performance standards for both state and local public health systems. These performance standards are intended to guide the development of stronger public health systems capable of improving the health of populations.
The local version of the Assessment instrument was used by the Florida Department of Health in Lee County to help identify strengths and opportunities for improvement within the Lee County public health system. The Local Public Health System Assessment (LPHSA) answers:
What are the activities and capacities of our local public health system? How well are the “10 Essential Public Health Services” being provided to our community?
The 10 Essential Public Health Services are the core public health functions that should be undertaken in every community and they provide the framework for the Local Public Health System Assessment.
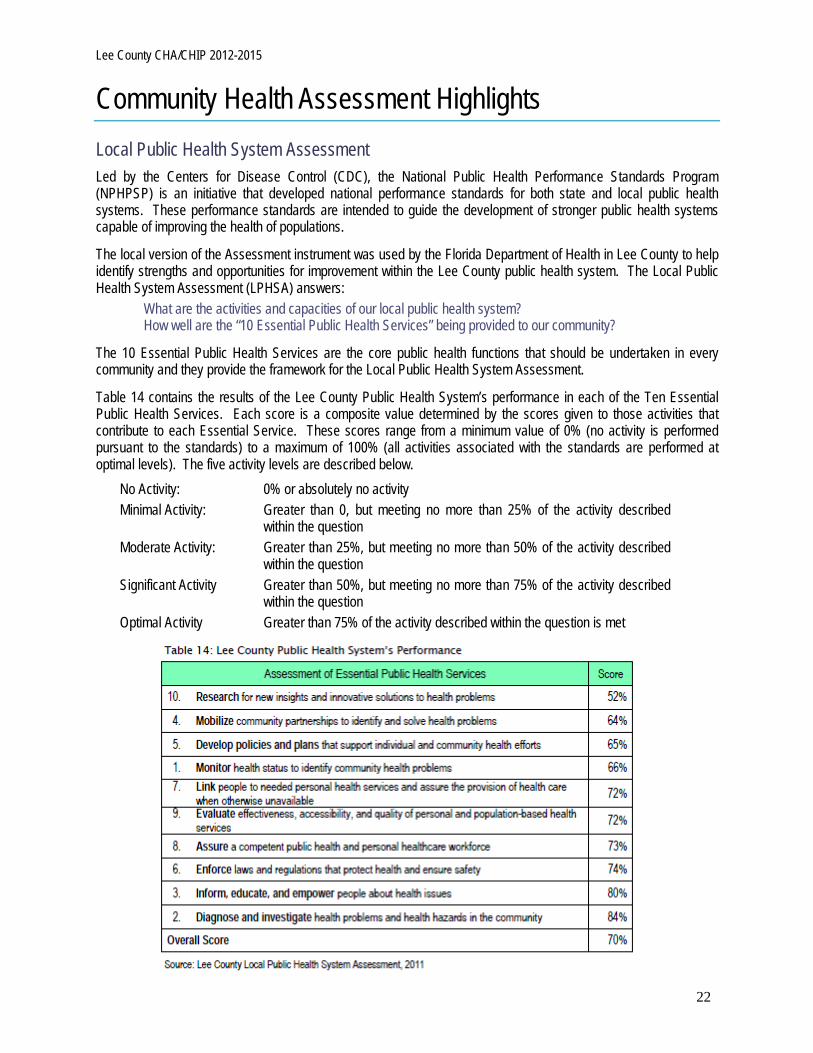
Table 14 contains the results of the Lee County Public Health System’s performance in each of the Ten Essential Public Health Services. Each score is a composite value determined by the scores given to those activities that contribute to each Essential Service. These scores range from a minimum value of 0% (no activity is performed pursuant to the standards) to a maximum of 100% (all activities associated with the standards are performed at optimal levels). The five activity levels are described below.
No Activity: 0% or absolutely no activity Minimal Activity: Greater than 0, but meeting no more than 25% of the activity described
within the question Moderate Activity: Greater than 25%, but meeting no more than 50% of the activity described
within the question Significant Activity Greater than 50%, but meeting no more than 75% of the activity described
within the question Optimal Activity Greater than 75% of the activity described within the question is met
22
Lee County CHA/CHIP 2012-2015
Based on the assessment, 80% of the Essential Services scored in the significant activity level and 20% in the optimal level. Essential Service 10 scored the lowest at 52%. Typically, Essential Public Health Service 10 is relatively more out of the direct control of the local public health system as it is generally dictated by geographical dynamics or macroeconomic trends and circumstances.
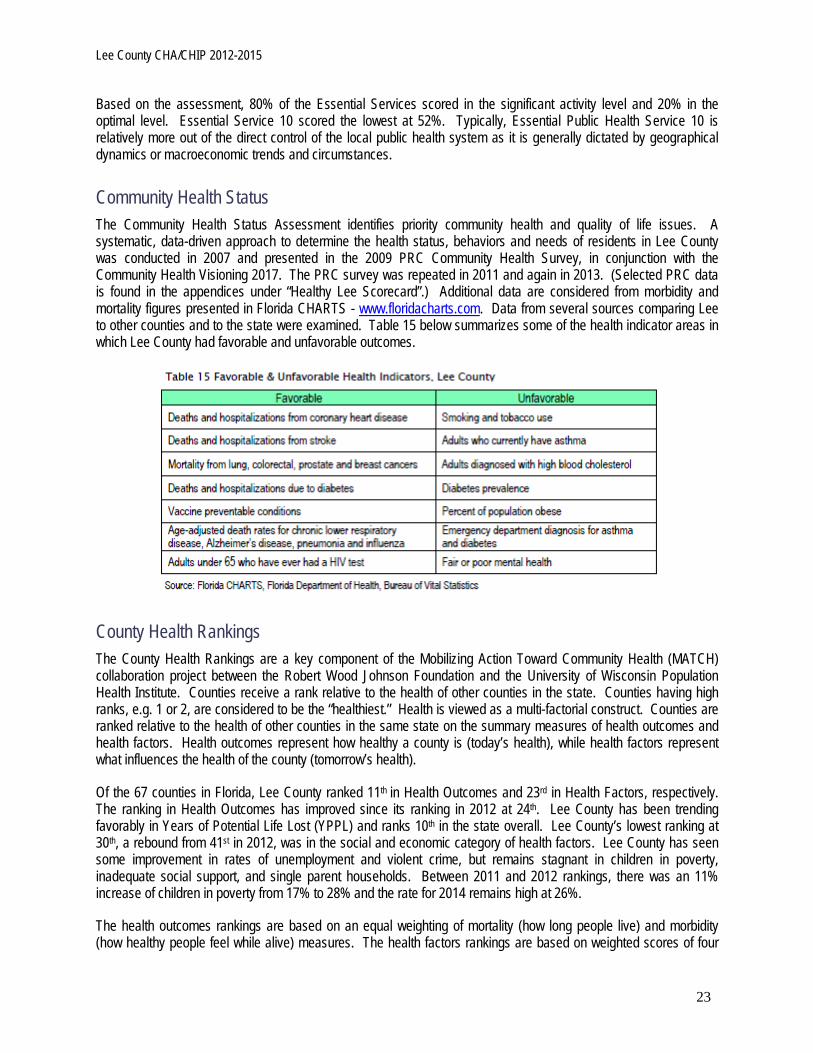
Community Health Status The Community Health Status Assessment identifies priority community health and quality of life issues. A systematic, data-driven approach to determine the health status, behaviors and needs of residents in Lee County was conducted in 2007 and presented in the 2009 PRC Community Health Survey, in conjunction with the Community Health Visioning 2017. The PRC survey was repeated in 2011 and again in 2013. (Selected PRC data is found in the appendices under “Healthy Lee Scorecard”.) Additional data are considered from morbidity and mortality figures presented in Florida CHARTS - www.floridacharts.com. Data from several sources comparing Lee to other counties and to the state were examined. Table 15 below summarizes some of the health indicator areas in which Lee County had favorable and unfavorable outcomes.
County Health Rankings The County Health Rankings are a key component of the Mobilizing Action Toward Community Health (MATCH) collaboration project between the Robert Wood Johnson Foundation and the University of Wisconsin Population Health Institute. Counties receive a rank relative to the health of other counties in the state. Counties having high ranks, e.g. 1 or 2, are considered to be the “healthiest.” Health is viewed as a multi-factorial construct. Counties are ranked relative to the health of other counties in the same state on the summary measures of health outcomes and health factors. Health outcomes represent how healthy a county is (today’s health), while health factors represent what influences the health of the county (tomorrow’s health).
Of the 67 counties in Florida, Lee County ranked 11th in Health Outcomes and 23rd in Health Factors, respectively. The ranking in Health Outcomes has improved since its ranking in 2012 at 24th. Lee County has been trending favorably in Years of Potential Life Lost (YPPL) and ranks 10th in the state overall. Lee County’s lowest ranking at 30th, a rebound from 41st in 2012, was in the social and economic category of health factors. Lee County has seen some improvement in rates of unemployment and violent crime, but remains stagnant in children in poverty, inadequate social support, and single parent households. Between 2011 and 2012 rankings, there was an 11% increase of children in poverty from 17% to 28% and the rate for 2014 remains high at 26%.
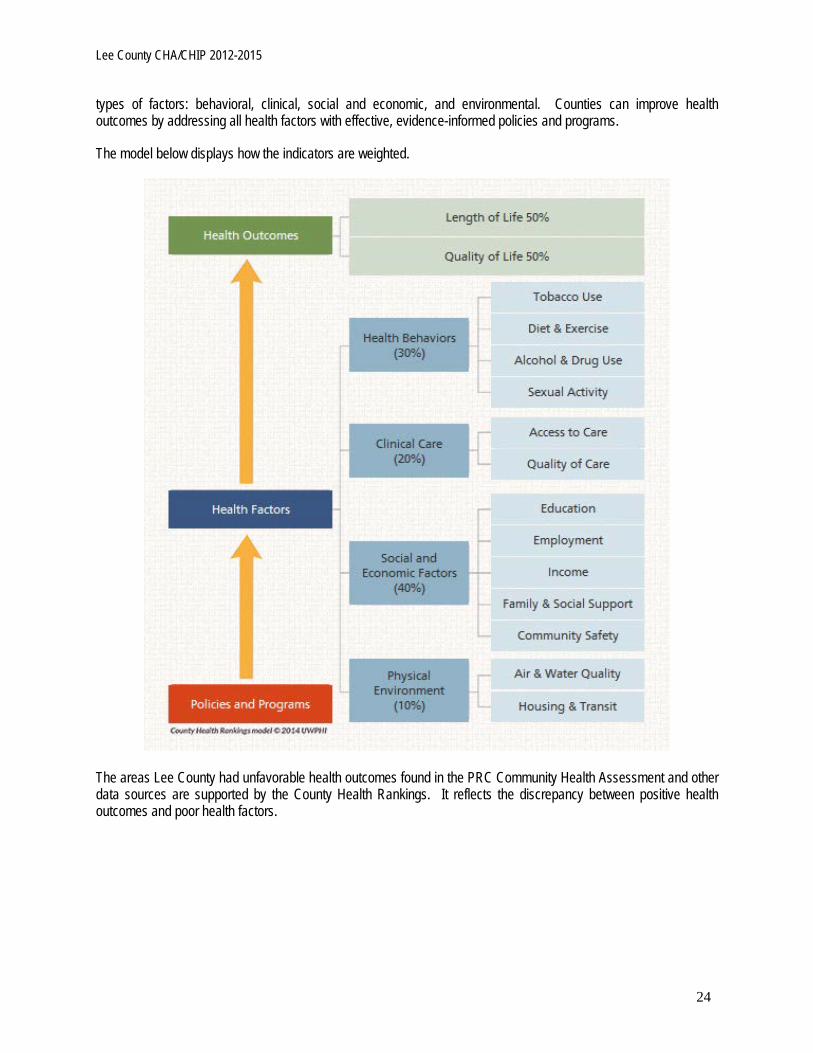
The health outcomes rankings are based on an equal weighting of mortality (how long people live) and morbidity (how healthy people feel while alive) measures. The health factors rankings are based on weighted scores of four
23
Lee County CHA/CHIP 2012-2015
types of factors: behavioral, clinical, social and economic, and environmental. Counties can improve health outcomes by addressing all health factors with effective, evidence-informed policies and programs.
The model below displays how the indicators are weighted.
The areas Lee County had unfavorable health outcomes found in the PRC Community Health Assessment and other data sources are supported by the County Health Rankings. It reflects the discrepancy between positive health outcomes and poor health factors.
24
Lee County CHA/CHIP 2012-2015
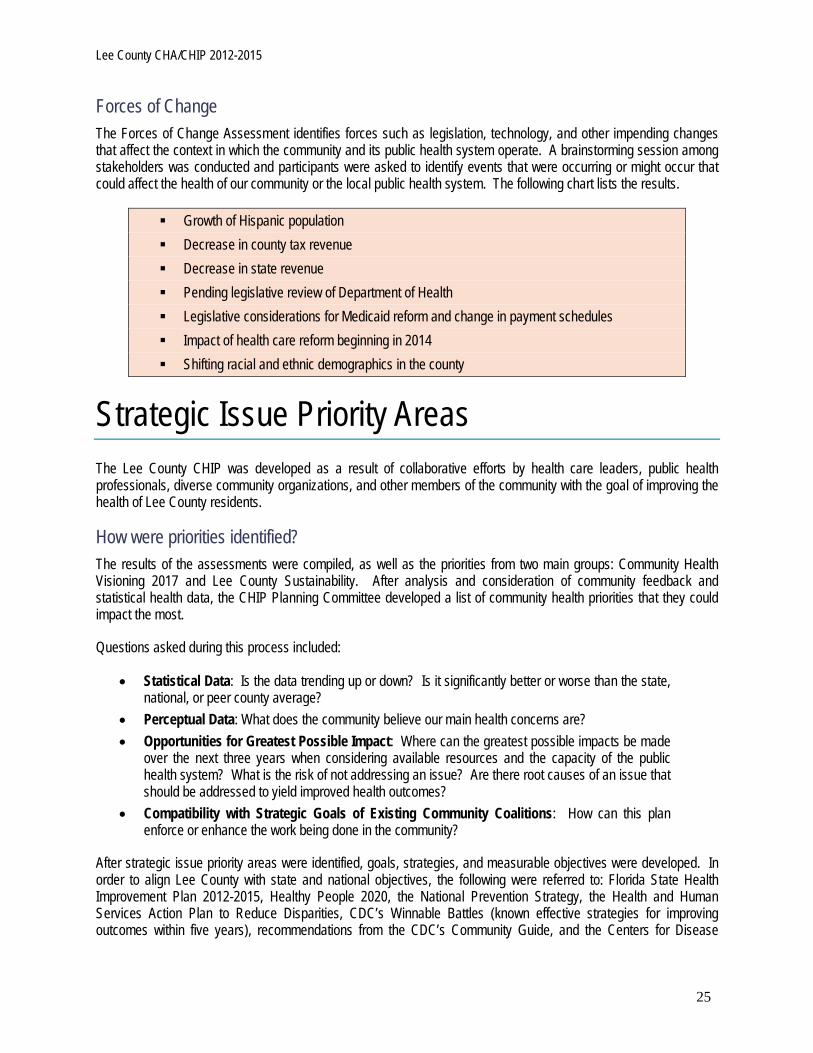
Forces of Change The Forces of Change Assessment identifies forces such as legislation, technology, and other impending changes that affect the context in which the community and its public health system operate. A brainstorming session among stakeholders was conducted and participants were asked to identify events that were occurring or might occur that could affect the health of our community or the local public health system. The following chart lists the results.
Growth of Hispanic population Decrease in county tax revenue Decrease in state revenue Pending legislative review of Department of Health Legislative considerations for Medicaid reform and change in payment schedules Impact of health care reform beginning in 2014 Shifting racial and ethnic demographics in the county
Strategic Issue Priority Areas The Lee County CHIP was developed as a result of collaborative efforts by health care leaders, public health professionals, diverse community organizations, and other members of the community with the goal of improving the health of Lee County residents.
How were priorities identified? The results of the assessments were compiled, as well as the priorities from two main groups: Community Health Visioning 2017 and Lee County Sustainability. After analysis and consideration of community feedback and statistical health data, the CHIP Planning Committee developed a list of community health priorities that they could impact the most.
Questions asked during this process included:
• Statistical Data: Is the data trending up or down? Is it significantly better or worse than the state, national, or peer county average?
• Perceptual Data: What does the community believe our main health concerns are? • Opportunities for Greatest Possible Impact: Where can the greatest possible impacts be made
over the next three years when considering available resources and the capacity of the public health system? What is the risk of not addressing an issue? Are there root causes of an issue that should be addressed to yield improved health outcomes?
• Compatibility with Strategic Goals of Existing Community Coalitions: How can this plan enforce or enhance the work being done in the community?
After strategic issue priority areas were identified, goals, strategies, and measurable objectives were developed. In order to align Lee County with state and national objectives, the following were referred to: Florida State Health Improvement Plan 2012-2015, Healthy People 2020, the National Prevention Strategy, the Health and Human Services Action Plan to Reduce Disparities, CDC’s Winnable Battles (known effective strategies for improving outcomes within five years), recommendations from the CDC’s Community Guide, and the Centers for Disease
25
Lee County CHA/CHIP 2012-2015
Control and Prevention Public Health Preparedness Performance Measures. Targets and measures outlined in this Plan are aligned with the objectives that were applicable.
This Plan does not address every strength and weakness identified in the Community Health Assessment, or all the priorities of community partners, but it does reflect the shared vision of creating a healthier Lee The Public Health Accreditation Board’s Local Standard 5.2.2 requires alignment between community priorities described in the community health improvement plan and both state and national priorities. Local health departments must demonstrate alignment with both Tribal and state health improvement priorities, where appropriate. National and state priority alignment would include the National Prevention Strategy and Healthy People 2020.
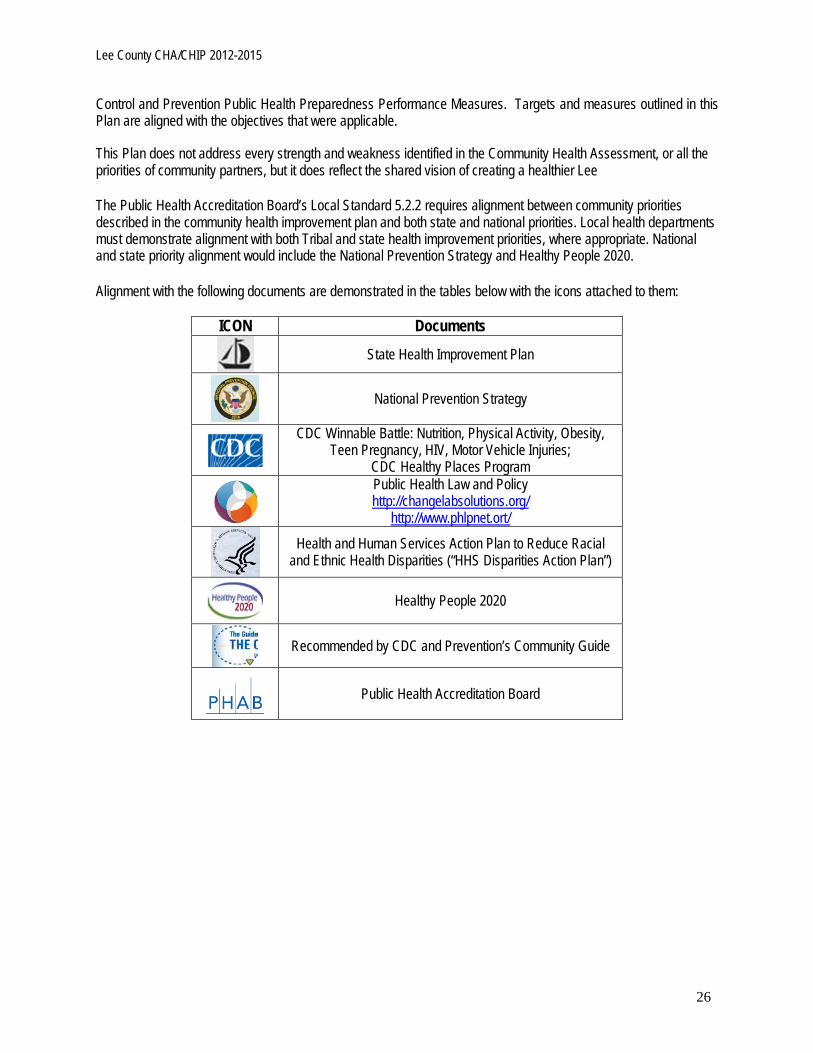
Alignment with the following documents are demonstrated in the tables below with the icons attached to them:
ICON Documents
State Health Improvement Plan
National Prevention Strategy
CDC Winnable Battle: Nutrition, Physical Activity, Obesity, Teen Pregnancy, HIV, Motor Vehicle Injuries;
CDC Healthy Places Program
Public Health Law and Policy http://changelabsolutions.org/
http://www.phlpnet.ort/
Health and Human Services Action Plan to Reduce Racial and Ethnic Health Disparities (“HHS Disparities Action Plan”)
Healthy People 2020
Recommended by CDC and Prevention’s Community Guide
Public Health Accreditation Board
26
Lee County CHA/CHIP 2012-2015
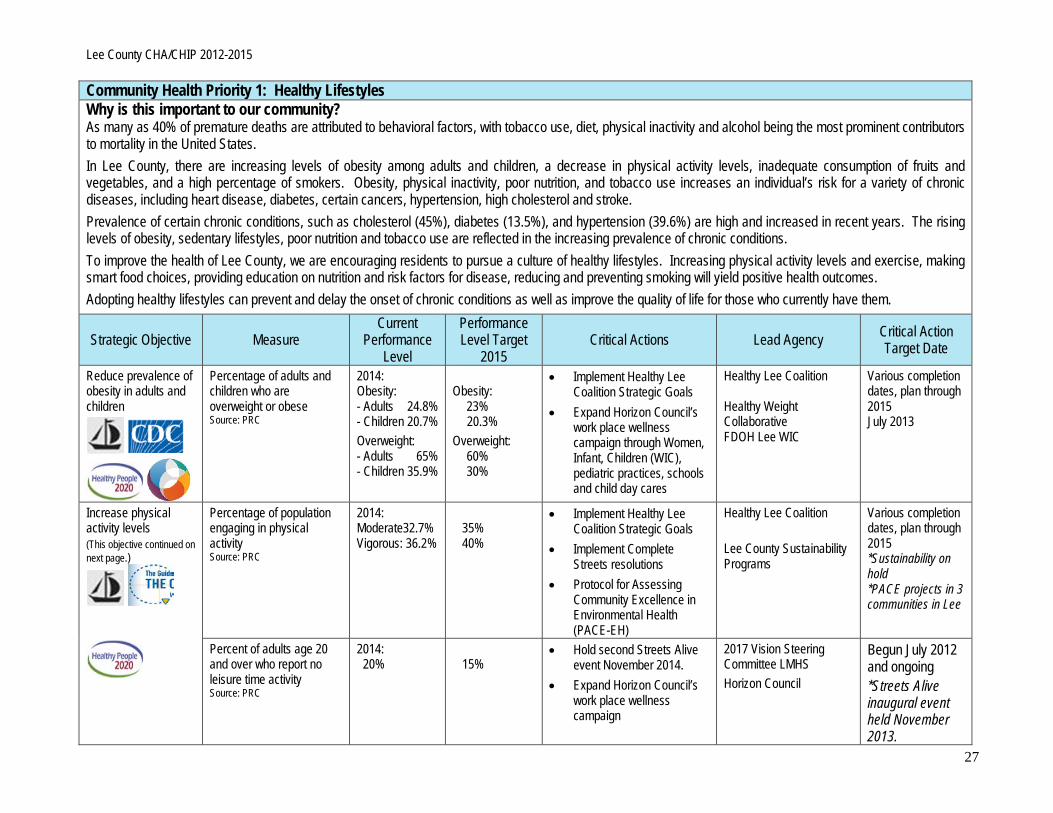
Community Health Priority 1: Healthy Lifestyles Why is this important to our community? As many as 40% of premature deaths are attributed to behavioral factors, with tobacco use, diet, physical inactivity and alcohol being the most prominent contributors to mortality in the United States. In Lee County, there are increasing levels of obesity among adults and children, a decrease in physical activity levels, inadequate consumption of fruits and vegetables, and a high percentage of smokers. Obesity, physical inactivity, poor nutrition, and tobacco use increases an individual’s risk for a variety of chronic diseases, including heart disease, diabetes, certain cancers, hypertension, high cholesterol and stroke. Prevalence of certain chronic conditions, such as cholesterol (45%), diabetes (13.5%), and hypertension (39.6%) are high and increased in recent years. The rising levels of obesity, sedentary lifestyles, poor nutrition and tobacco use are reflected in the increasing prevalence of chronic conditions. To improve the health of Lee County, we are encouraging residents to pursue a culture of healthy lifestyles. Increasing physical activity levels and exercise, making smart food choices, providing education on nutrition and risk factors for disease, reducing and preventing smoking will yield positive health outcomes. Adopting healthy lifestyles can prevent and delay the onset of chronic conditions as well as improve the quality of life for those who currently have them.
Strategic Objective Measure Current
Performance Level
Performance Level Target
2015 Critical Actions Lead Agency Critical Action
Target Date
Reduce prevalence of obesity in adults and children
Percentage of adults and children who are overweight or obese Source: PRC
2014: Obesity: - Adults 24.8% - Children 20.7% Overweight: - Adults 65% - Children 35.9%
Obesity:
23% 20.3%
Overweight: 60% 30%
• Implement Healthy Lee Coalition Strategic Goals
• Expand Horizon Council’s work place wellness campaign through Women, Infant, Children (WIC), pediatric practices, schools and child day cares
Healthy Lee Coalition Healthy Weight Collaborative FDOH Lee WIC
Various completion dates, plan through 2015 July 2013
Increase physical activity levels (This objective continued on next page.)
Percentage of population engaging in physical activity Source: PRC
2014: Moderate32.7% Vigorous: 36.2%
35% 40%
• Implement Healthy Lee Coalition Strategic Goals
• Implement Complete Streets resolutions
• Protocol for Assessing Community Excellence in Environmental Health (PACE-EH)
Healthy Lee Coalition Lee County Sustainability Programs
Various completion dates, plan through 2015 *Sustainability on hold *PACE projects in 3 communities in Lee
Percent of adults age 20 and over who report no leisure time activity Source: PRC
2014: 20%
15%
• Hold second Streets Alive event November 2014.
• Expand Horizon Council’s work place wellness campaign
2017 Vision Steering Committee LMHS Horizon Council
Begun July 2012 and ongoing *Streets Alive inaugural event held November 2013.
27
Lee County CHA/CHIP 2012-2015
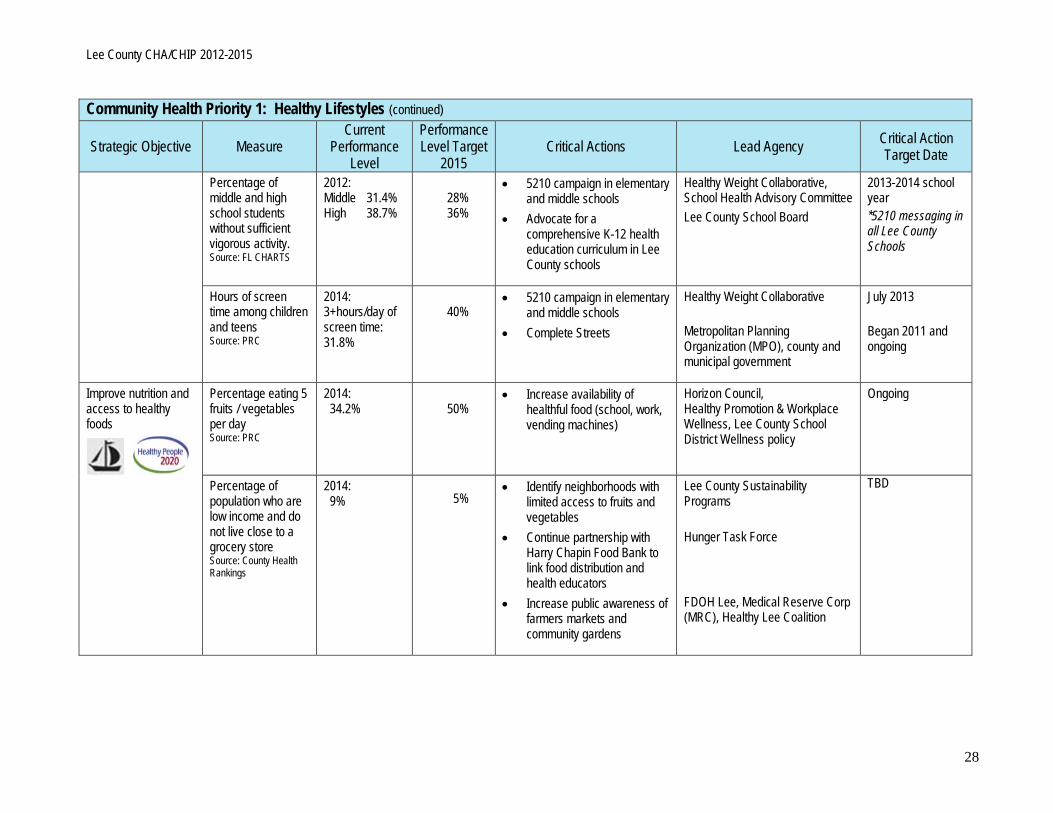
Community Health Priority 1: Healthy Lifestyles (continued)
Strategic Objective Measure Current
Performance Level
Performance Level Target
2015 Critical Actions Lead Agency Critical Action
Target Date
Percentage of middle and high school students without sufficient vigorous activity. Source: FL CHARTS
2012: Middle 31.4% High 38.7%
28% 36%
• 5210 campaign in elementary and middle schools
• Advocate for a comprehensive K-12 health education curriculum in Lee County schools
Healthy Weight Collaborative, School Health Advisory Committee Lee County School Board
2013-2014 school year *5210 messaging in all Lee County Schools
Hours of screen time among children and teens Source: PRC
2014: 3+hours/day of screen time: 31.8%
40%
• 5210 campaign in elementary and middle schools
• Complete Streets
Healthy Weight Collaborative Metropolitan Planning Organization (MPO), county and municipal government
July 2013 Began 2011 and ongoing
Improve nutrition and access to healthy foods
Percentage eating 5 fruits / vegetables per day Source: PRC
2014: 34.2%
50%
• Increase availability of healthful food (school, work, vending machines)
Horizon Council, Healthy Promotion & Workplace Wellness, Lee County School District Wellness policy
Ongoing
Percentage of population who are low income and do not live close to a grocery store Source: County Health Rankings
2014: 9%
5%
• Identify neighborhoods with limited access to fruits and vegetables
• Continue partnership with Harry Chapin Food Bank to link food distribution and health educators
• Increase public awareness of farmers markets and community gardens
Lee County Sustainability Programs Hunger Task Force FDOH Lee, Medical Reserve Corp (MRC), Healthy Lee Coalition
TBD
28
Lee County CHA/CHIP 2012-2015
Community Health Priority 1: Healthy Lifestyles (continued)
Strategic Objective Measure Current
Performance Level
Performance Level Target
2015 Critical Actions Lead Agency Critical Action
Target Date
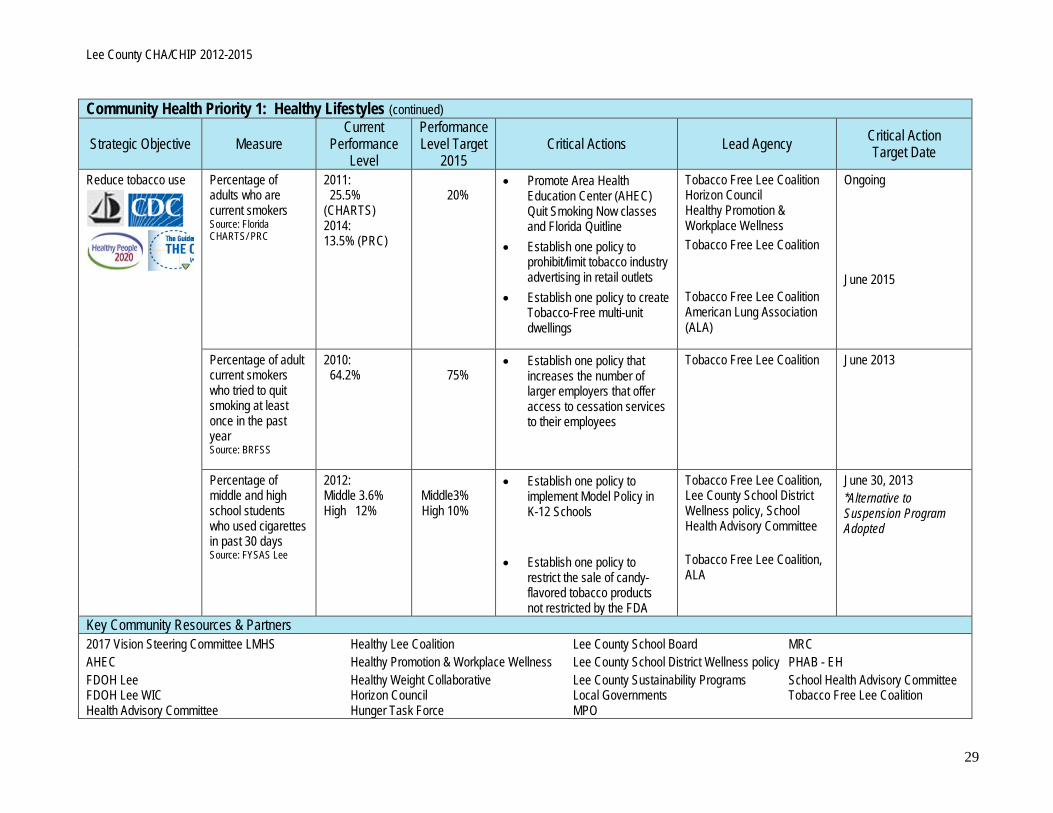
Reduce tobacco use
Percentage of adults who are current smokers Source: Florida CHARTS/ PRC
2011: 25.5% (CHARTS) 2014: 13.5% (PRC)
20%
• Promote Area Health Education Center (AHEC) Quit Smoking Now classes and Florida Quitline
• Establish one policy to prohibit/limit tobacco industry advertising in retail outlets
• Establish one policy to create Tobacco-Free multi-unit dwellings
Tobacco Free Lee Coalition Horizon Council Healthy Promotion & Workplace Wellness Tobacco Free Lee Coalition Tobacco Free Lee Coalition American Lung Association (ALA)
Ongoing
June 2015
Percentage of adult current smokers who tried to quit smoking at least once in the past year Source: BRFSS
2010: 64.2%
75%
• Establish one policy that increases the number of larger employers that offer access to cessation services to their employees
Tobacco Free Lee Coalition June 2013
Percentage of middle and high school students who used cigarettes in past 30 days Source: FYSAS Lee
2012: Middle 3.6% High 12%
Middle3% High 10%
• Establish one policy to implement Model Policy in K-12 Schools
• Establish one policy to
restrict the sale of candy-flavored tobacco products not restricted by the FDA
Tobacco Free Lee Coalition, Lee County School District Wellness policy, School Health Advisory Committee Tobacco Free Lee Coalition, ALA
June 30, 2013 *Alternative to Suspension Program Adopted
Key Community Resources & Partners 2017 Vision Steering Committee LMHS Healthy Lee Coalition Lee County School Board MRC AHEC Healthy Promotion & Workplace Wellness Lee County School District Wellness policy PHAB - EH FDOH Lee Healthy Weight Collaborative Lee County Sustainability Programs School Health Advisory Committee FDOH Lee WIC Horizon Council Local Governments Tobacco Free Lee Coalition Health Advisory Committee Hunger Task Force MPO
29
Lee County CHA/CHIP 2012-2015
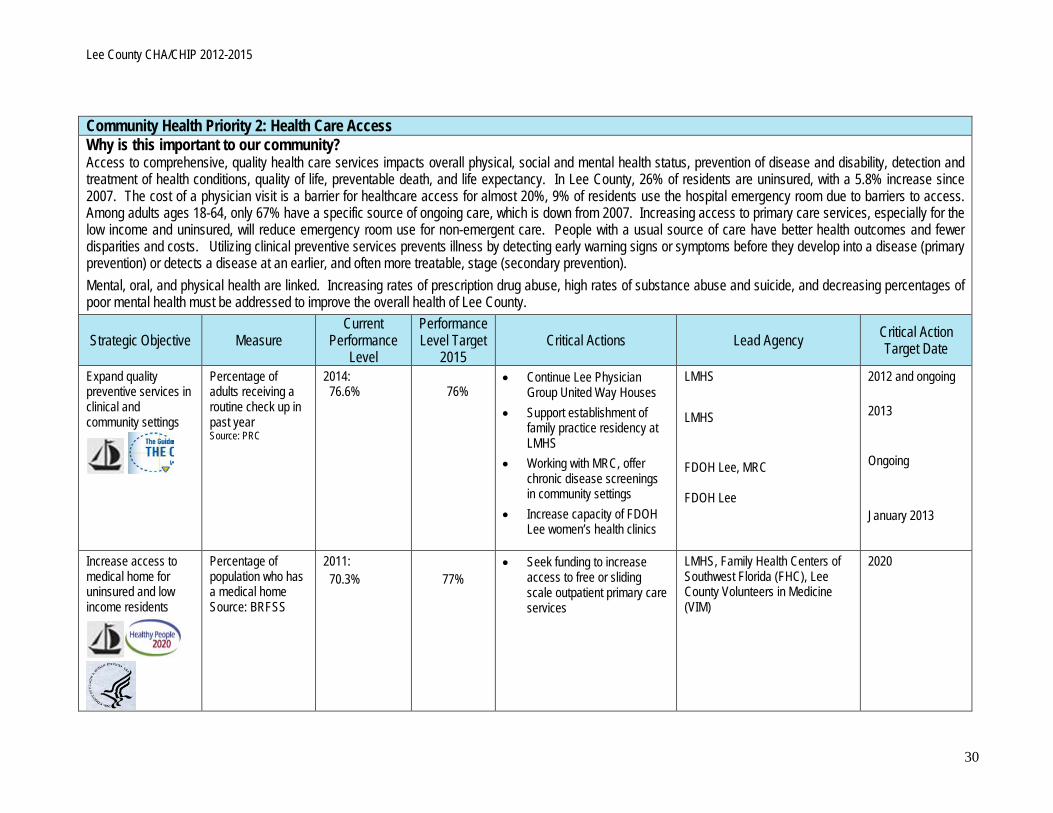
Community Health Priority 2: Health Care Access Why is this important to our community? Access to comprehensive, quality health care services impacts overall physical, social and mental health status, prevention of disease and disability, detection and treatment of health conditions, quality of life, preventable death, and life expectancy. In Lee County, 26% of residents are uninsured, with a 5.8% increase since 2007. The cost of a physician visit is a barrier for healthcare access for almost 20%, 9% of residents use the hospital emergency room due to barriers to access. Among adults ages 18-64, only 67% have a specific source of ongoing care, which is down from 2007. Increasing access to primary care services, especially for the low income and uninsured, will reduce emergency room use for non-emergent care. People with a usual source of care have better health outcomes and fewer disparities and costs. Utilizing clinical preventive services prevents illness by detecting early warning signs or symptoms before they develop into a disease (primary prevention) or detects a disease at an earlier, and often more treatable, stage (secondary prevention). Mental, oral, and physical health are linked. Increasing rates of prescription drug abuse, high rates of substance abuse and suicide, and decreasing percentages of poor mental health must be addressed to improve the overall health of Lee County.
Strategic Objective Measure Current
Performance Level
Performance Level Target
2015 Critical Actions Lead Agency Critical Action
Target Date
Expand quality preventive services in clinical and community settings
Percentage of adults receiving a routine check up in past year Source: PRC
2014: 76.6%
76%
• Continue Lee Physician Group United Way Houses
• Support establishment of family practice residency at LMHS
• Working with MRC, offer chronic disease screenings in community settings
• Increase capacity of FDOH Lee women’s health clinics
LMHS LMHS FDOH Lee, MRC FDOH Lee
2012 and ongoing 2013 Ongoing January 2013
Increase access to medical home for uninsured and low income residents
Percentage of population who has a medical home Source: BRFSS
2011: 70.3%
77%
• Seek funding to increase access to free or sliding scale outpatient primary care services
LMHS, Family Health Centers of Southwest Florida (FHC), Lee County Volunteers in Medicine (VIM)
2020
30
Lee County CHA/CHIP 2012-2015
Community Health Priority 2: Health Care Access (continued)
Strategic Objective Measure Current
Performance Level
Performance Level Target
2015 Critical Actions Lead Agency Critical Action
Target Date
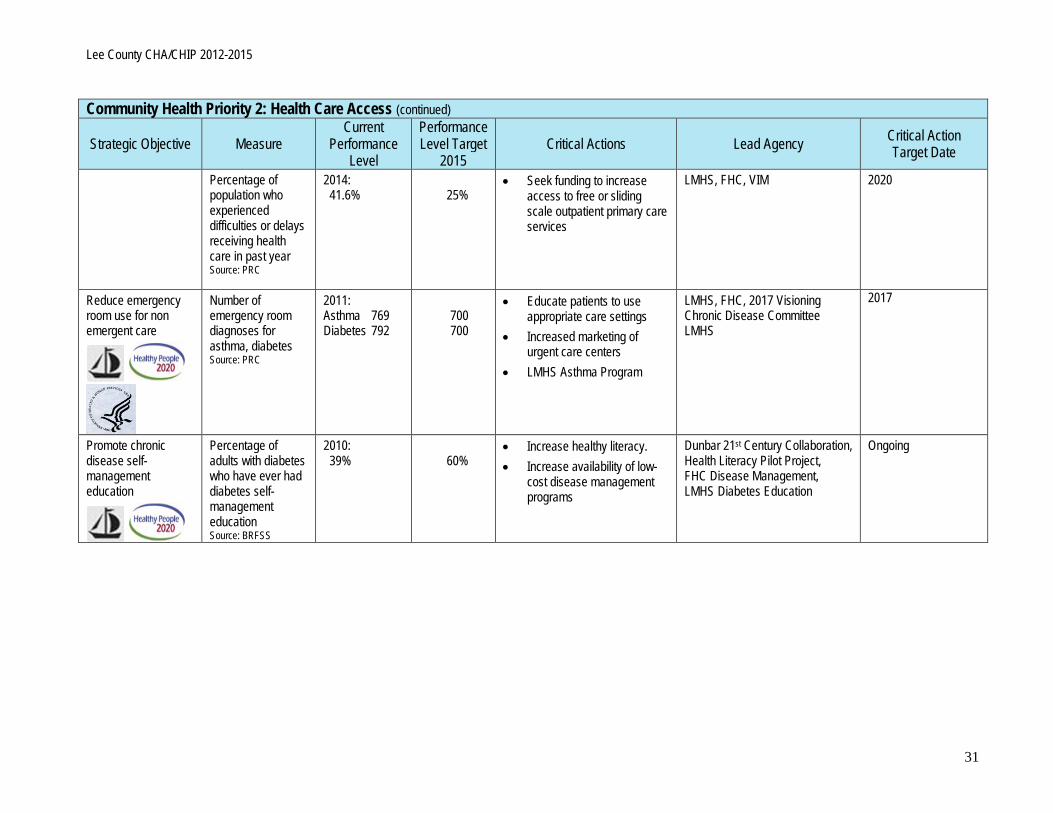
Percentage of population who experienced difficulties or delays receiving health care in past year Source: PRC
2014: 41.6%
25%
• Seek funding to increase access to free or sliding scale outpatient primary care services
LMHS, FHC, VIM 2020
Reduce emergency room use for non emergent care
Number of emergency room diagnoses for asthma, diabetes Source: PRC
2011: Asthma 769 Diabetes 792
700 700
• Educate patients to use appropriate care settings
• Increased marketing of urgent care centers
• LMHS Asthma Program
LMHS, FHC, 2017 Visioning Chronic Disease Committee LMHS
2017
Promote chronic disease self-management education
Percentage of adults with diabetes who have ever had diabetes self-management education Source: BRFSS
2010: 39%
60%
• Increase healthy literacy. • Increase availability of low-
cost disease management programs
Dunbar 21st Century Collaboration, Health Literacy Pilot Project, FHC Disease Management, LMHS Diabetes Education
Ongoing
31
Lee County CHA/CHIP 2012-2015
Community Health Priority 2: Health Care Access (continued)
Strategic Objective Measure Current
Performance Level
Performance Level Target
2015 Critical Actions Lead Agency Critical Action
Target Date
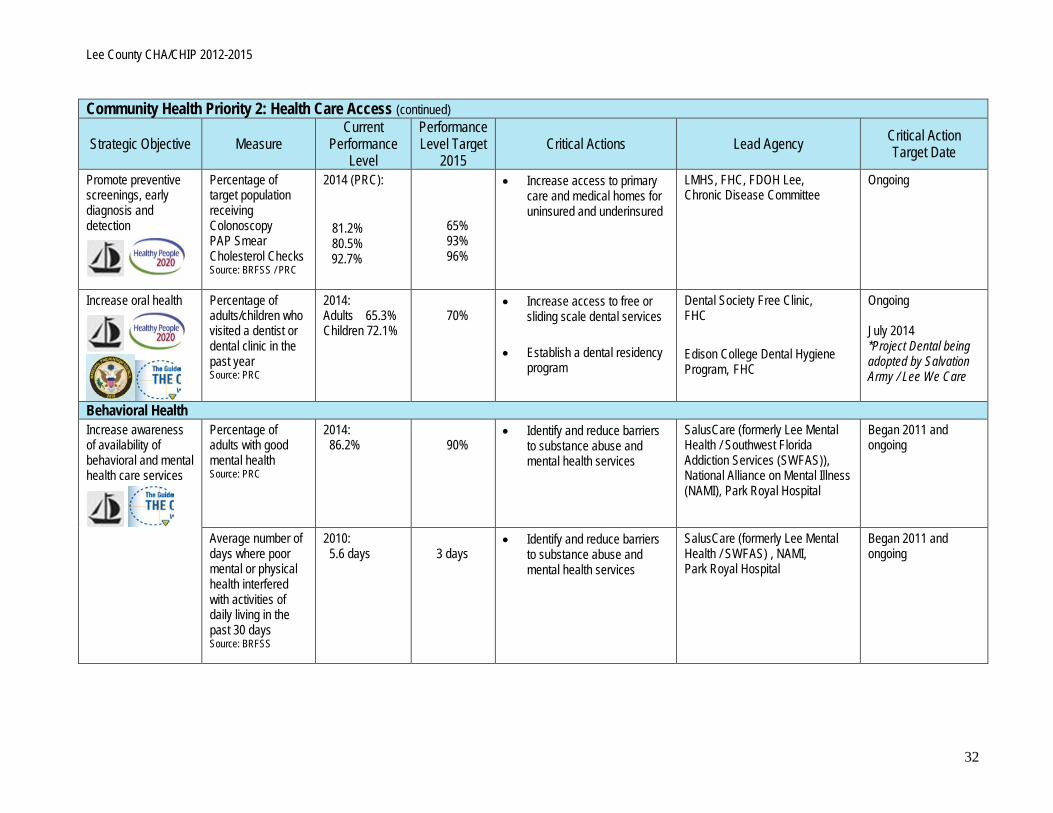
Promote preventive screenings, early diagnosis and detection
Percentage of target population receiving Colonoscopy PAP Smear Cholesterol Checks Source: BRFSS / PRC
2014 (PRC):
81.2% 80.5% 92.7%
65% 93% 96%
• Increase access to primary care and medical homes for uninsured and underinsured
LMHS, FHC, FDOH Lee, Chronic Disease Committee
Ongoing
Increase oral health
Percentage of adults/children who visited a dentist or dental clinic in the past year Source: PRC
2014: Adults 65.3% Children 72.1%
70%
• Increase access to free or sliding scale dental services
• Establish a dental residency program
Dental Society Free Clinic, FHC
Edison College Dental Hygiene Program, FHC
Ongoing July 2014 *Project Dental being adopted by Salvation Army / Lee We Care
Behavioral Health Increase awareness of availability of behavioral and mental health care services
Percentage of adults with good mental health Source: PRC
2014: 86.2%
90%
• Identify and reduce barriers to substance abuse and mental health services
SalusCare (formerly Lee Mental Health / Southwest Florida Addiction Services (SWFAS)), National Alliance on Mental Illness (NAMI), Park Royal Hospital
Began 2011 and ongoing
Average number of days where poor mental or physical health interfered with activities of daily living in the past 30 days Source: BRFSS
2010: 5.6 days
3 days
• Identify and reduce barriers to substance abuse and mental health services
SalusCare (formerly Lee Mental Health / SWFAS) , NAMI, Park Royal Hospital
Began 2011 and ongoing
32
Lee County CHA/CHIP 2012-2015
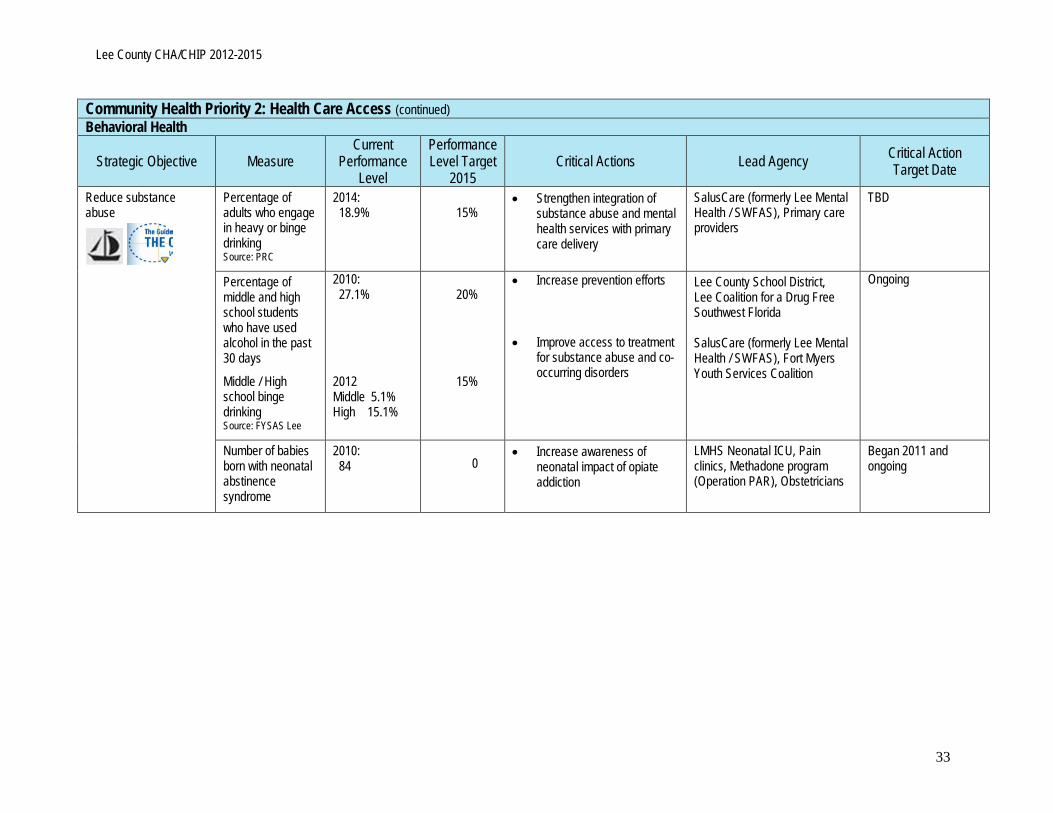
Community Health Priority 2: Health Care Access (continued) Behavioral Health
Strategic Objective Measure Current
Performance Level
Performance Level Target
2015 Critical Actions Lead Agency Critical Action
Target Date
Reduce substance abuse
Percentage of adults who engage in heavy or binge drinking Source: PRC
2014: 18.9%
15%
• Strengthen integration of substance abuse and mental health services with primary care delivery
SalusCare (formerly Lee Mental Health / SWFAS), Primary care providers
TBD
Percentage of middle and high school students who have used alcohol in the past 30 days
Middle / High school binge drinking Source: FYSAS Lee
2010: 27.1% 2012 Middle 5.1% High 15.1%
20%
15%
• Increase prevention efforts • Improve access to treatment
for substance abuse and co-occurring disorders
Lee County School District, Lee Coalition for a Drug Free Southwest Florida SalusCare (formerly Lee Mental Health / SWFAS), Fort Myers Youth Services Coalition
Ongoing
Number of babies born with neonatal abstinence syndrome
2010: 84
0
• Increase awareness of neonatal impact of opiate addiction
LMHS Neonatal ICU, Pain clinics, Methadone program (Operation PAR), Obstetricians
Began 2011 and ongoing
33
Lee County CHA/CHIP 2012-2015
Community Health Priority 2: Health Care Access (continued) Behavioral Health
Strategic Objective Measure Current
Performance Level
Performance Level Target
2015 Critical Actions Lead Agency Critical Action
Target Date
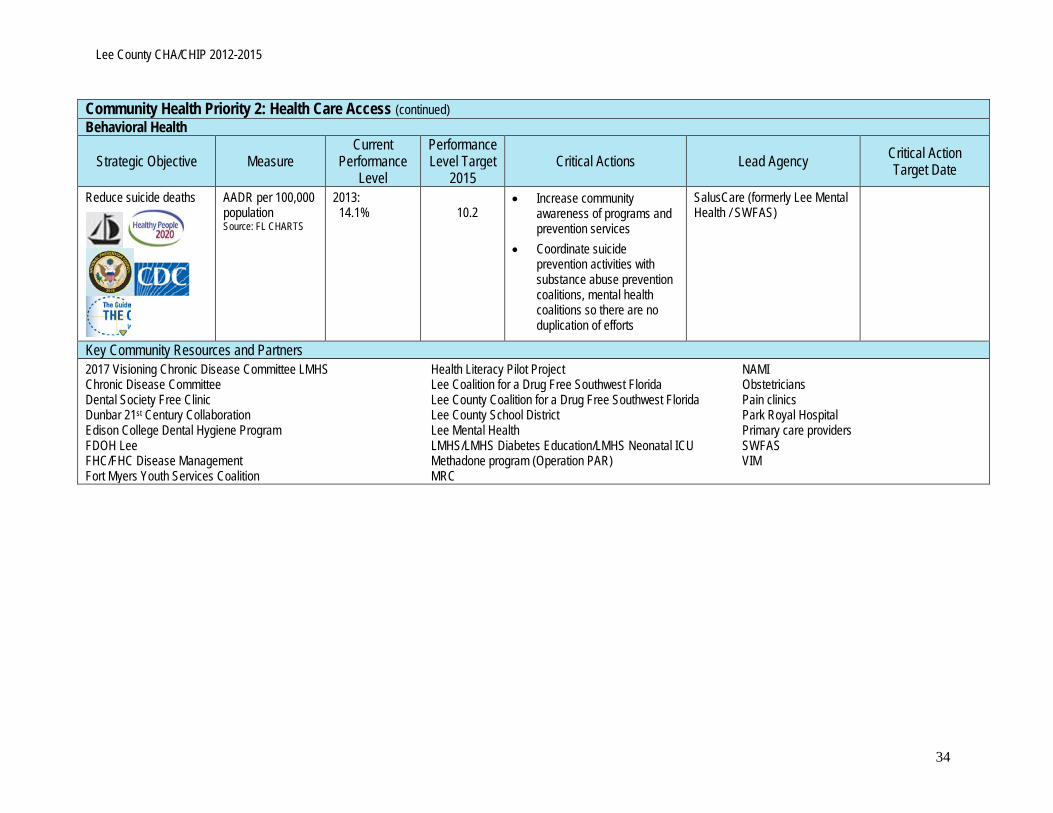
Reduce suicide deaths
AADR per 100,000 population Source: FL CHARTS
2013: 14.1%
10.2
• Increase community awareness of programs and prevention services
• Coordinate suicide prevention activities with substance abuse prevention coalitions, mental health coalitions so there are no duplication of efforts
SalusCare (formerly Lee Mental Health / SWFAS)
Key Community Resources and Partners 2017 Visioning Chronic Disease Committee LMHS Health Literacy Pilot Project NAMI Chronic Disease Committee Lee Coalition for a Drug Free Southwest Florida Obstetricians Dental Society Free Clinic Lee County Coalition for a Drug Free Southwest Florida Pain clinics Dunbar 21st Century Collaboration Lee County School District Park Royal Hospital Edison College Dental Hygiene Program Lee Mental Health Primary care providers FDOH Lee LMHS/LMHS Diabetes Education/LMHS Neonatal ICU SWFAS FHC/FHC Disease Management Methadone program (Operation PAR) VIM Fort Myers Youth Services Coalition MRC
34
Lee County CHA/CHIP 2012-2015
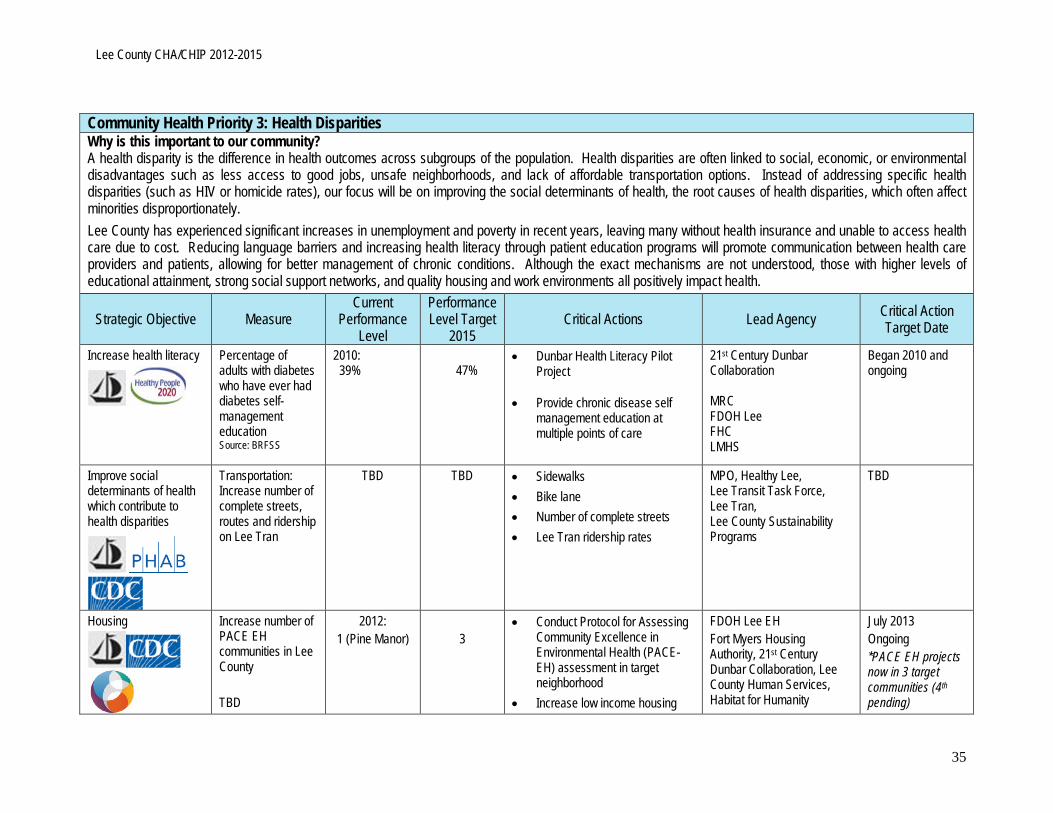
Community Health Priority 3: Health Disparities Why is this important to our community? A health disparity is the difference in health outcomes across subgroups of the population. Health disparities are often linked to social, economic, or environmental disadvantages such as less access to good jobs, unsafe neighborhoods, and lack of affordable transportation options. Instead of addressing specific health disparities (such as HIV or homicide rates), our focus will be on improving the social determinants of health, the root causes of health disparities, which often affect minorities disproportionately. Lee County has experienced significant increases in unemployment and poverty in recent years, leaving many without health insurance and unable to access health care due to cost. Reducing language barriers and increasing health literacy through patient education programs will promote communication between health care providers and patients, allowing for better management of chronic conditions. Although the exact mechanisms are not understood, those with higher levels of educational attainment, strong social support networks, and quality housing and work environments all positively impact health.
Strategic Objective Measure Current
Performance Level
Performance Level Target
2015 Critical Actions Lead Agency Critical Action
Target Date
Increase health literacy
Percentage of adults with diabetes who have ever had diabetes self-management education Source: BRFSS
2010: 39%
47%
• Dunbar Health Literacy Pilot Project
• Provide chronic disease self
management education at multiple points of care
21st Century Dunbar Collaboration MRC FDOH Lee FHC LMHS
Began 2010 and ongoing
Improve social determinants of health which contribute to health disparities
Transportation: Increase number of complete streets, routes and ridership on Lee Tran
TBD TBD • Sidewalks • Bike lane • Number of complete streets • Lee Tran ridership rates
MPO, Healthy Lee, Lee Transit Task Force, Lee Tran, Lee County Sustainability Programs
TBD
Housing
Increase number of PACE EH communities in Lee County TBD
2012: 1 (Pine Manor)
3
• Conduct Protocol for Assessing Community Excellence in Environmental Health (PACE-EH) assessment in target neighborhood
• Increase low income housing
FDOH Lee EH Fort Myers Housing Authority, 21st Century Dunbar Collaboration, Lee County Human Services, Habitat for Humanity
July 2013 Ongoing *PACE EH projects now in 3 target communities (4th pending)
35

Lee County CHA/CHIP 2012-2015
Community Health Priority 3: Health Disparities (continued)
Strategic Objective Measure Current
Performance Level
Performance Level Target
2015 Critical Actions Lead Agency Critical Action
Target Date
Poverty
Percentage of adults who could not see a doctor at least once in the past year due to cost Source: PRC
2014: 20.3%
16.4%
• Seek funding to increase access to free or sliding scale outpatient primary care services
LMHS FHC VIM
Unknown
Percent uninsured Source: County Health Rankings
2014: 31%
15%
• Increase employment Economic Development Council 21st Century Dunbar Collaboration
TBD
Percentage of children under 18 in poverty Source: County Health Rankings
2014: 26%
11%
• TBD TBD TBD
Language
Percentage of adults who think they would get better medical care if they belonged to a different race/ethnic group Source: BRFSS
2010: 14.2%
10%
• English as Second Language classes for adults
Literacy Council Gulf Coast
Ongoing
Percent of population linguistically isolated Source: FL CHARTS
2011: 5.5%
2%
• Cultural and linguistic competency training for health care providers
Health care providers, Continuing education providers
Ongoing
36
Lee County CHA/CHIP 2012-2015
Community Health Priority 3: Health Disparities (continued)
Strategic Objective Measure Current
Performance Level
Performance Level Target
2015 Critical Actions Lead Agency Critical Action
Target Date
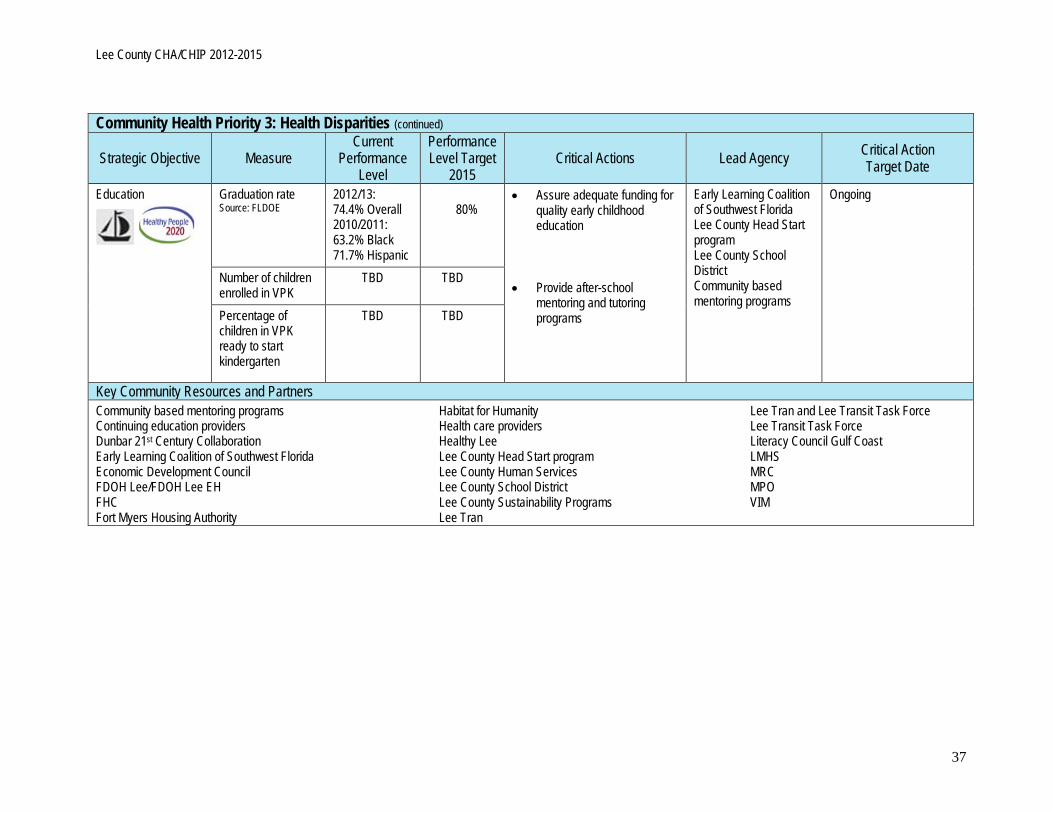
Education
Graduation rate Source: FLDOE
2012/13: 74.4% Overall 2010/2011: 63.2% Black 71.7% Hispanic
80%
• Assure adequate funding for quality early childhood education
• Provide after-school
mentoring and tutoring programs
Early Learning Coalition of Southwest Florida Lee County Head Start program Lee County School District Community based mentoring programs
Ongoing
Number of children enrolled in VPK
TBD TBD
Percentage of children in VPK ready to start kindergarten
TBD TBD
Key Community Resources and Partners Community based mentoring programs Habitat for Humanity Lee Tran and Lee Transit Task Force Continuing education providers Health care providers Lee Transit Task Force Dunbar 21st Century Collaboration Healthy Lee Literacy Council Gulf Coast Early Learning Coalition of Southwest Florida Lee County Head Start program LMHS Economic Development Council Lee County Human Services MRC FDOH Lee/FDOH Lee EH Lee County School District MPO FHC Lee County Sustainability Programs VIM Fort Myers Housing Authority Lee Tran
37

Lee County CHA/CHIP 2012-2015
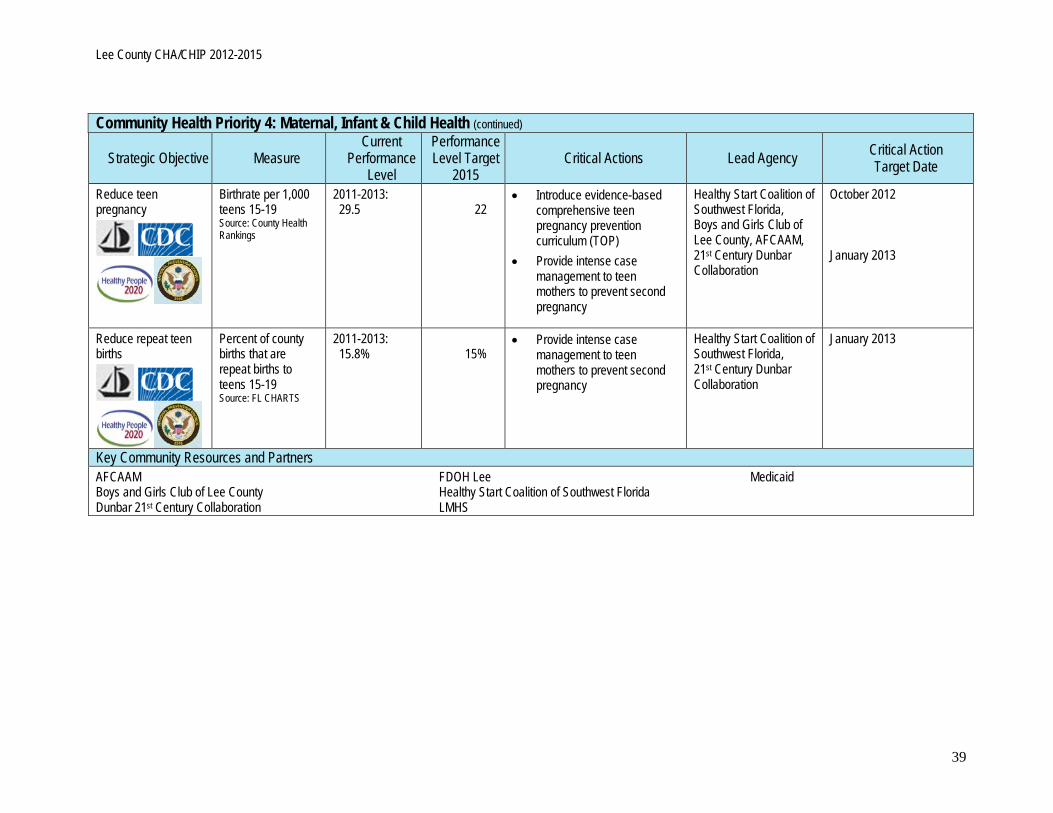
Community Health Priority 4: Maternal, Infant & Child Health Why is this important to our community? Infant mortality is often used as a measure of overall population health. The well-being of mothers, infants, and children determines the health of the next generation and can help predict future public health challenges for families, communities and the medical care system. In 2011, Lee County’s infant mortality rate of 6.7 exceeded state and national levels. Black babies born in Lee County were 3.7 times as likely to experience an infant death as white babies, and Hispanic babies were 2.06 times as likely to experience an infant death. Increasing the percentage of women who receive first trimester prenatal care will promote healthy birth outcomes; reduce low birth weight babies and premature births. Lee County has higher teen birthrates and repeat teen births than Florida and the U.S. Between 2008 and 2010, 20.5% of Lee County births were repeat births to teens aged 15-19. Teen mothers are less likely to graduate high school or get a GED by age 30, earn less per year, and receive nearly twice as much federal aid for nearly twice as long. Children of teen parents are more likely to have lower cognitive attainment and exhibit more behavior problems. Sons of teen moms are more likely to be incarcerated, and daughters are more likely to become teen moms.
Strategic Objective Measure Current
Performance Level
Performance Level Target
2015 Critical Actions Lead Agency Critical Action
Target Date
Reduce infant mortality
Infant mortality rate per 1,000 live births Source: FL CHARTS
2013: 5.9
6.0
• Preconception education and care
• Promote “baby spacing” • Assure access to prenatal
care in first trimester • Reduce tobacco usage
among pregnant women • Promote healthy pre-
pregnancy BMIs
Healthy Start Coalition of Southwest Florida FDOH Lee LMHS Medicaid
Ongoing
Percentage of low birth weight infants Source: PRC
2011- 2013: 8.5%
7.8% or less
Percentage of premature births (<37 weeks) Source: FL CHARTS
2011-2013: 13.4%
11.4%
• Assure access to prenatal care in first trimester
• Reduce incidence of elective C-sections
Healthy Start Coalition of Southwest Florida FDOH Lee LMHS
Ongoing
38
Lee County CHA/CHIP 2012-2015
Community Health Priority 4: Maternal, Infant & Child Health (continued)
Strategic Objective Measure Current
Performance Level
Performance Level Target
2015 Critical Actions Lead Agency Critical Action
Target Date
Reduce teen pregnancy
Birthrate per 1,000 teens 15-19 Source: County Health Rankings
2011-2013: 29.5
22
• Introduce evidence-based comprehensive teen pregnancy prevention curriculum (TOP)
• Provide intense case management to teen mothers to prevent second pregnancy
Healthy Start Coalition of Southwest Florida, Boys and Girls Club of Lee County, AFCAAM, 21st Century Dunbar Collaboration
October 2012 January 2013
Reduce repeat teen births
Percent of county births that are repeat births to teens 15-19 Source: FL CHARTS
2011-2013: 15.8%
15%
• Provide intense case management to teen mothers to prevent second pregnancy
Healthy Start Coalition of Southwest Florida, 21st Century Dunbar Collaboration
January 2013
Key Community Resources and Partners AFCAAM FDOH Lee Medicaid Boys and Girls Club of Lee County Healthy Start Coalition of Southwest Florida Dunbar 21st Century Collaboration LMHS
39
Lee County CHA/CHIP 2012-2015
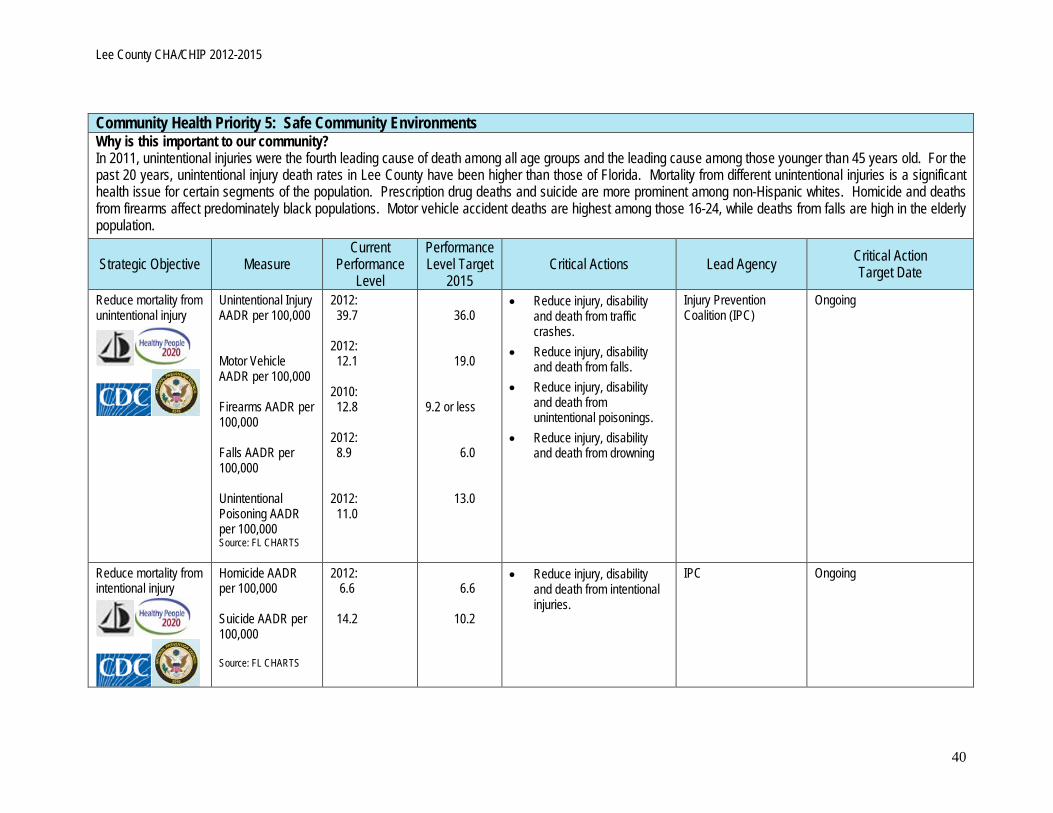
Community Health Priority 5: Safe Community Environments Why is this important to our community? In 2011, unintentional injuries were the fourth leading cause of death among all age groups and the leading cause among those younger than 45 years old. For the past 20 years, unintentional injury death rates in Lee County have been higher than those of Florida. Mortality from different unintentional injuries is a significant health issue for certain segments of the population. Prescription drug deaths and suicide are more prominent among non-Hispanic whites. Homicide and deaths from firearms affect predominately black populations. Motor vehicle accident deaths are highest among those 16-24, while deaths from falls are high in the elderly population.
Strategic Objective Measure Current
Performance Level
Performance Level Target
2015 Critical Actions Lead Agency Critical Action
Target Date
Reduce mortality from unintentional injury
Unintentional Injury AADR per 100,000 Motor Vehicle AADR per 100,000 Firearms AADR per 100,000 Falls AADR per 100,000 Unintentional Poisoning AADR per 100,000 Source: FL CHARTS
2012: 39.7 2012: 12.1 2010: 12.8 2012: 8.9 2012: 11.0
36.0
19.0 9.2 or less
6.0
13.0
• Reduce injury, disability and death from traffic crashes.
• Reduce injury, disability and death from falls.
• Reduce injury, disability and death from unintentional poisonings.
• Reduce injury, disability and death from drowning
Injury Prevention Coalition (IPC)
Ongoing
Reduce mortality from intentional injury
Homicide AADR per 100,000 Suicide AADR per 100,000 Source: FL CHARTS
2012: 6.6 14.2
6.6
10.2
• Reduce injury, disability and death from intentional injuries.
IPC Ongoing
40
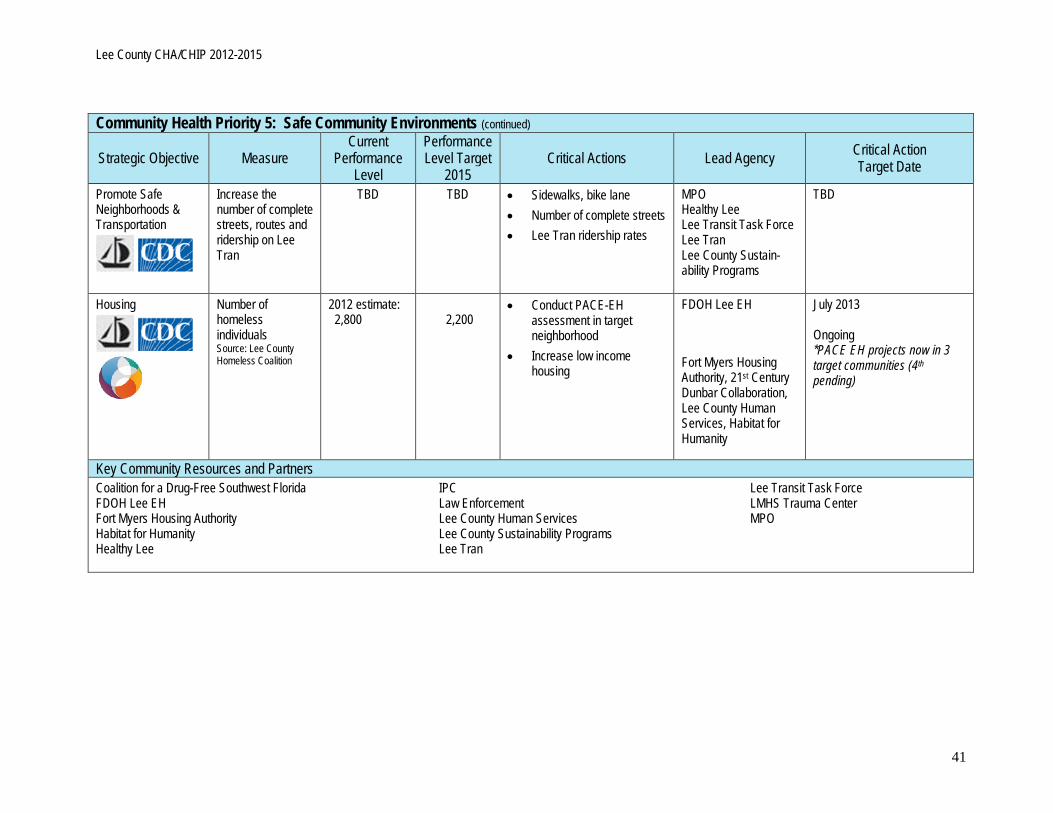
Lee County CHA/CHIP 2012-2015
Community Health Priority 5: Safe Community Environments (continued)
Strategic Objective Measure Current
Performance Level
Performance Level Target
2015 Critical Actions Lead Agency Critical Action
Target Date
Promote Safe Neighborhoods & Transportation
Increase the number of complete streets, routes and ridership on Lee Tran
TBD TBD • Sidewalks, bike lane • Number of complete streets • Lee Tran ridership rates
MPO Healthy Lee Lee Transit Task Force Lee Tran Lee County Sustain-ability Programs
TBD
Housing
Number of homeless individuals Source: Lee County Homeless Coalition
2012 estimate: 2,800
2,200
• Conduct PACE-EH assessment in target neighborhood
• Increase low income housing
FDOH Lee EH Fort Myers Housing Authority, 21st Century Dunbar Collaboration, Lee County Human Services, Habitat for Humanity
July 2013 Ongoing *PACE EH projects now in 3 target communities (4th pending)
Key Community Resources and Partners Coalition for a Drug-Free Southwest Florida IPC Lee Transit Task Force FDOH Lee EH Law Enforcement LMHS Trauma Center Fort Myers Housing Authority Lee County Human Services MPO Habitat for Humanity Lee County Sustainability Programs Healthy Lee Lee Tran
41
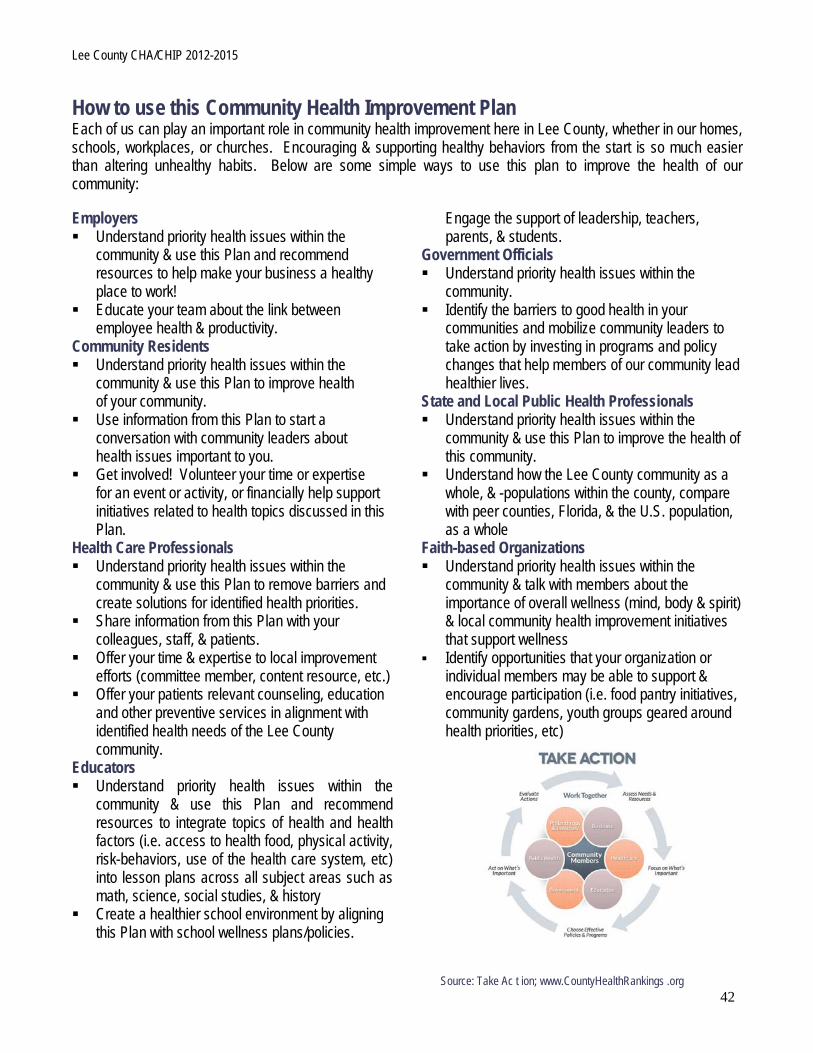
Lee County CHA/CHIP 2012-2015
How to use this Community Health Improvement Plan Each of us can play an important role in community health improvement here in Lee County, whether in our homes, schools, workplaces, or churches. Encouraging & supporting healthy behaviors from the start is so much easier than altering unhealthy habits. Below are some simple ways to use this plan to improve the health of our community:
Employers Understand priority health issues within the
community & use this Plan and recommend resources to help make your business a healthy place to work!
Educate your team about the link between employee health & productivity.
Community Residents Understand priority health issues within the
community & use this Plan to improve health of your community.
Use information from this Plan to start a conversation with community leaders about health issues important to you.
Get involved! Volunteer your time or expertise for an event or activity, or financially help support initiatives related to health topics discussed in this Plan.
Health Care Professionals Understand priority health issues within the
community & use this Plan to remove barriers and create solutions for identified health priorities.
Share information from this Plan with your colleagues, staff, & patients.
Offer your time & expertise to local improvement efforts (committee member, content resource, etc.)
Offer your patients relevant counseling, education and other preventive services in alignment with identified health needs of the Lee County community.
Educators Understand priority health issues within the
community & use this Plan and recommend resources to integrate topics of health and health factors (i.e. access to health food, physical activity, risk-behaviors, use of the health care system, etc) into lesson plans across all subject areas such as math, science, social studies, & history
Create a healthier school environment by aligning this Plan with school wellness plans/policies.
Engage the support of leadership, teachers, parents, & students.
Government Officials Understand priority health issues within the
community. Identify the barriers to good health in your
communities and mobilize community leaders to take action by investing in programs and policy changes that help members of our community lead healthier lives.
State and Local Public Health Professionals Understand priority health issues within the
community & use this Plan to improve the health of this community.
Understand how the Lee County community as a whole, & -populations within the county, compare with peer counties, Florida, & the U.S. population, as a whole
Faith-based Organizations Understand priority health issues within the
community & talk with members about the importance of overall wellness (mind, body & spirit) & local community health improvement initiatives that support wellness
Identify opportunities that your organization or individual members may be able to support & encourage participation (i.e. food pantry initiatives, community gardens, youth groups geared around health priorities, etc)
Source: Take Ac t ion; www.CountyHealthRankings .org
42
Lee County CHA/CHIP 2012-2015
Appendices Accomplishments In addition to the hard work of the Community Health Visioning 2017 and the Lee County Sustainability steering committee it is clear that Lee County has been hard at work in creating an environment of health and safety. Below is just a sampling of the community collaborations at work related to this CHIP
The Dunbar 21st Century Collaboration is a collection of community trustees, including faith-based leaders, who are united by the common purpose of assessing community
cultural, spiritual and socio-economic problems, developing solutions to those problems and assembling a collaborating partnership to take positive action in implementing them. This group is working hard to minimize health disparities in Lee County.
The Lee County Injury Prevention Coalition is a multi-disciplinary coalition of approximately 100 private and public organizations focused on reducing and preventing injuries among Lee
County residents and visitors. The members include health and safety agencies, educators, governments and volunteers, including emergency medical services, fire and rescue agencies, law enforcement agencies, hospital outreach programs, health agencies, and public and private schools. The Lee County IPC has been working to deliver a unified safety message, provide valuable safety-related resources and offer education and training related to injury prevention.
The Lee County Coalition for a Drug Free Southwest Florida is a multidisciplinary coalition of private and public organizations. Their mission is to reduce youth alcohol and drug abuse and empower parents to raise drug free children in Southwest Florida.
In response to concerns about the rising level of obesity, heart disease and diabetes, the Healthy Lee Coalition of Southwest Florida is teaming up with area organizations and businesses. The goal is to offer education and awareness about healthy lifestyles through programs that encourage physical activity and smart food choices. Start! Fit-Friendly Companies is a national program that annually recognizes companies for promoting physical activity and health in the workplace. Worksite wellness programs can help people be more aware of the major risk factors that they can modify and potentially change – smoking, being overweight, high blood pressure, high cholesterol and diabetes. According to the Healthy Lee Coalition, it is estimated that companies can save up to $15 for every $1 spent on health and wellness within 12 to18 months of implementing a worksite wellness program. Each employee who works to lower their risk status and maintains it can save the company an estimated $53 per year.
43

Lee County CHA/CHIP 2012-2015
NAMI of Lee County’s mission is to eliminate the discrimination and ignorance against those individuals living with mental illnesses and their families through education, information, and advocacy to our community, consumers, and family members.
Healthy Start of Southwest Florida is on a mission to reduce the number of infant deaths, reduce the number of premature or low- birth weight babies, and improve health and developmental outcomes for young children. In 2010, Healthy Start served more than 17,000 pregnant women, babies and young children up to age
three who were at higher risk for poor health outcomes. The Lee County Pocket Guide to Emergency Assistance was prepared to help those who find themselves homeless or in immediate need of some sort of assistance. It does not contain all the services which may be available to assist you or guarantee services are still available.
The Tobacco-Free Lee Coalition brings together the student and adult community, business and faith leaders to cut tobacco-use rates. “The Tobacco-Free initiative is a community partnership that brings together organizational resources to decrease the rate of smokers in Lee County. Among the coalition’s top goals will be to partner with the health care community to target pregnant women with a tobacco cessation intervention at every prenatal care visit and make sure they know about resources to help them quit. Also, the coalition wants to work toward enacting litter laws to curtail the cigarette butts collecting on county streets and beaches as well as pushing toward making all county buildings tobacco-free.
The vision of the Fort Myers Youth Services Coalition is to empower our youth today for a better tomorrow. To effectively empower youth today for a better tomorrow a community-wide
focus on providing a caring, supportive environment where all children can grow to be healthy, self-sufficient, contributing adults is necessary. Through youth empowerment via positive programs, services and events it is believed that negative behaviors will reduce while involvement in constructive, healthy behaviors will increase. The mission of the Fort Myers Youth Service Coalition is designed to be proactive, inclusive of all youth ages 0-20 years old, and based upon the pivotal concept that youth are indeed a vital community resource who should be engaged in the development of the community in which they grow.
The Horizon Council is a public-private board established in 1991 to advise the Lee County Board of Commissioners on economic development issues. The Council has up to 80 members representing five cities; 10 chambers of commerce; 16 economic development and trade organizations; 14 community, business, and education organizations; along with various officers and at-large
44
Lee County CHA/CHIP 2012-2015
members. The mission of the Horizon Council is to 1) Help improve the business environment in Lee County; 2) Retain and encourage the expansion of existing businesses; and 3) Attract new and diversified employment to the area.
The Pine Manor Improvement Association is a private non-profit agency that provides services to children and families that are at risk in the Pine Manor area of Fort Myers. Pine Manor is 1 of 6 neighborhoods designated
by the Lee County Board of Commissioners as “blighted” and in need of direct social service delivery. Pine Manor is a neighborhood where 28% of the population is foreign-born, almost all of those from Latin America, and where 84% of the population rents rather than owns their place of residence. Many of these families do not speak English. Most of them live in poverty. The Association serves almost 1,500 unduplicated clients each month, with 55% of those served being children between the ages of 0 -18. The Florida Department of Health in Lee County appointed an Environmental Manager to coordinate a program called “Protocol for Assessing Community Excellence in Environmental Health” (PACE EH) for the purpose
of promoting Healthy Lifestyles. The shared mission is to improve the neighborhood by developing effective, cost efficient, holistic neighborhood revitalization strategies designed to provide decent, affordable housing, suitable living environments and expand economic opportunities to the residents.
The Lee County Healthy Weight Collaborative is dedicated to creating sustainable strategies that will promote healthy lifestyle choices across our community with the ultimate goal of helping all in Lee County
obtain and maintain a healthy weight. We will work together to implement evidence-based and promising interventions to promote healthy weight in our target population: children aged 2 through 10 years and their extended families.
• We will achieve a composite score of >80 on the Wilder Collaboration Factors Inventory
• 50% of our target population will have been reached by the healthy weight message
• 25% of children of Family Health Centers pediatric practice and a second large pediatric practice (still to be recruited) will have undergone assessment of weight status including measurement of BMI and healthy weight assessment.
• 10% of children in the target pediatric practices will have been offered an evidence-based, standardized healthy weight plan
• 25% of children aged 2-5 enrolled in WIC will be assessed using a tool consistent with the healthy weight assessment.
• The Core Message will be adopted/incorporated by at least three community agencies. • The team will develop action plans and begin implementation for two policies: one to promote
healthy eating and one to promote physical activity.
The Early Learning Coalition of Southwest Florida serves the families of Collier, Glades Hendry and Lee Counties. It is our goal to make certain that children ages birth to five and beyond, have access to high quality early education experiences to cultivate their natural enthusiasm for learning.
45

Lee County CHA/CHIP 2012-2015
Glossary of Terms: Age-adjusted Death Rate (AADR): a statistical technique utilized to better allow populations to be compared when the age profiles and distributions within the populations are different; often used to answer the question, “How does the rate in my county compare to the rate in another even though the distribution of persons by age may vary?” The frequency with which health events occur is almost always related to age. Therefore, in order to examine other risk factors independent of age, age adjustments are often used in public health analyses. The 2000 US Standard population is often used as a guideline to calculate age-adjusted rates.
Chronic disease: a condition that lasts 12 months or longer and meets one or both of the following tests: (a) the condition places limitations on self-care, independent living and social interactions; (b) the condition results in the need for ongoing intervention with medical products, services and special equipment.
Family household: consists of a householder and one or more other people related to the householder by birth, marriage, or adoption.
Household: all people who occupy a housing unit; the occupants may or may not be related
Household income: the totaled amount of income of all workers within a household
Median income: depicts the middle point of income distribution within a given area; the amount that would divide the income distribution within an area into two equal parts: one-half of the cases falling below the median income and one-half above the median. This measure is not as affected by a few extreme values as an average, such as per capita income.
Per capita income: calculated by adding all income in an area and dividing by the total population.
Public assistance income: Public assistance income includes general assistance and Temporary Assistance to Needy Families (TANF). Separate payments received for hospital or other medical care (vendor payments) are excluded. This does not include Supplemental Security Income (SSI) or noncash benefits such as Food Stamps. The terms “public assistance income” and “cash public assistance” are used interchangeably.
Social Security income: includes Social Security pensions and survivor benefits, permanent disability insurance payments made by the Social Security Administration prior to deductions for medical insurance, and railroad retirement insurance checks from the U.S. government. Medicare reimbursements are not included
Supplemental Security Income (SSI): a nationwide U.S. assistance program administered by the Social Security Administration that guarantees a minimum level of income for needy aged, blind, or disabled individuals
Women, Infant, Children (WIC): a supplemental nutrition program that serves to safeguard the health of low-income pregnant, postpartum, and breastfeeding women, infants, and children up to age 5 who are at nutritional risk. The program provides nutritious foods to supplement diets, information on healthy eating, breastfeeding promotion and support and referrals to health care services.
46
Lee County CHA/CHIP 2012-2015
Acronyms: • AADR: Age-Adjusted Death Rate • ACS: American Community Survey • AFCAAM: Africa Caribbean American Center (recruits K-5 students from communities who would
benefit from additional reading and mentoring services) • AHEC: Area Health Education Center • ALA: American Lung Association • BRFSS: Behavioral Risk Factor Surveillance System • CDC: Center for Disease Control • CHA: Community Health Assessment • CHIP: Community Health Improvement Plan • FHC: Family Health Centers of Southwest Florida • FLDOE: Florida Department of Education • FYSAS Lee: Florida Youth Substance Abuse Survey for Lee County • HHS: Health and Human Services Action Plan to Reduce Racial and Ethnic Health Disparities
(“HHS Disparities Action Plan”) • FDOH Lee: Florida Department of Health in Lee County • FDOH Lee EH: Florida Department of Health in Lee County Environmental Health • IPC: Injury Prevention Coalition in Lee County • LMHS: Lee Memorial Health System • MPO: Metropolitan Planning Organization • MRC: Medical Reserve Corp • NAMI: National Alliance on Mental Illness • PACE-EH: Protocol for Assessing Community Excellence in Environmental Health • PHAB: Public Health Accreditation Board • PRC: Professional Research Consultants, Inc. 2011 PRC Community Health Report • SAIPE: Small Area Income and Population Estimates • SHIP: State Health Improvement Plan • SNAP: Supplemental Nutrition Assistance Program • SWFAS: Southwest Florida Addiction Services • TANF: Temporary Assistance for Needy Families • TOP: Teen Pregnancy Prevention Curriculum • VIM: Volunteers in Medicine • VPK: Voluntary Prekindergarten
Selected Data Sources: ACS: www.factfinder2.census.gov BRFSS: www.cdc.gov/brfss, www.doh.state.fl.us/Disease_ctrl/epi/BRFSS_Reports/2010/Lee.pdf Bureau of Labor Statistics: www.bls.gov County Health Rankings 2012: www.countyhealthrankings.org Florida Community Health Assessment Resource Tool Set (CHARTS): www.floridacharts.com FLDOE: http://www.fldoe.org/eias/eiaspubs/word/GradRate-1011.doc FYSAS Lee: www.dcf.state.fl.us/programs/samh/publications/fysas/10Survey/Lee%20County.pdf Lee County Homeless Coalition: http://www.leehomeless.org/Downloads/LCHCAnnualReport2012.pdf 2014 PRC Community Health Report: www.leecounty.healthforecast.net/report.pdf
47
Lee County CHA/CHIP 2012-2015
Acknowledgments and Partners Community Health Visioning 2017:
Samira Beckwith, Hope HealthCare Services Mike Biel, Internal Medicine Associates of Lee County, Inc Linda Brown, ARNP, LMHS Board of Directors Erick Burton, MD, Lee County Medical Society Joe Catti, FineMark National Bank and Trust Mei-Mei Chan, The News-Press Media Group Mitchell Cordova, PhD, Florida Gulf Coast University Veronica Culberson, SWFL Hispanic Chamber of Commerce Peter Dys, Shell Point Retirement Community Regina Eberwein, LMHS Jeff Elsberry, PhD, Edison State College Don Eslick, Estero Council of Community Members Leonardo Garcia, Hispanic American Business Alliance (HABA) Todd Gates, GATES Construction Pastor William Glover, Glove Ministries International Brian Hamman, CenturyLink Judith Hartner, MD, Florida Department of Health in Lee County Al Haser, The Sanibel Captiva Trust Company Karen Hawes, Lee County Administration Larry Hobbs, MD, Lee County Medical Society Sandie Horvath, RN, Health and Human Services Planning Committee of North Fort Myers Ed Houck, District Eight Health Planning Council Gary Hudson, Hudson Consulting Sally Jackson, LMHS Connie Jones, PhD, The School District of Lee County Chuck Krivenko, LMHS David Lucas, Bonita Bay Group Richard Macchiaroli, MD, Lee County Medical Society Gail Markham, Markham Norton Mosteller Wright & Co, P.A. Joe Mazurkiewicz, PhD, BJM Consulting, Inc. Frank Mazzeo Jr, DDS, Family Health Centers of SWFL Bill Mitchell, City of Fort Myers Marliese Mooney, Hospital Operations Consultant Jim Moore, Lee County’s Economic Development Office Fred Morgan II, Edison State College Abdul’Haq Muhammed, Quality Life Center of SWFL, Inc. Jim Nathan, LMHS Kevin Newingham, LMHS Steve Personette, Embarq Fred Pezeshkan, Manhattan Kraft Construction, Inc Brad Pollins, LMHS Annette Pounders, Physicians Primary Care Robbie Roepstorff, Edison National Bank Bill Schroeder, U.S Trust Bank David Shellenbarger, Southwest Florida Community Foundation Cliff Smith, United Way of Lee County Roxi Smith, Pink Shell Development Corp Sara Stensrud, Chicos Sandy Stilwell, Stilwell Enterprises
48
Lee County CHA/CHIP 2012-2015
J. Nathan Stout, J. Nathan Stout, CPA, PA Reverend Israel Suarez, Nations Association Shahid Sultan, MD, Lee County Medical Society Craig Sweet, MD, Lee County Medical Society Elmer Tabor, Wonderland Realty Dean Traiger, MD, Lee County Medical Society Gary Trippe, BB&T-Oswald Trippe & Co.
City of Fort Myers Dunbar 21st Century Collaboration Florida Gulf Coast University Fort Myers Youth Services Coalition Gora-McGahey Architects Gulf Citrus Growers HAS Engineers & Scientists Healthy Lee Healthy Start Lee County Coalition for a Drug Free SWFL Lee County Injury Prevention Coalition Lee County Sustainability NAMI Realty Executives SWFL SalusCare Tobacco Free Lee
49

Lee County CHA/CHIP 2012-2015
50
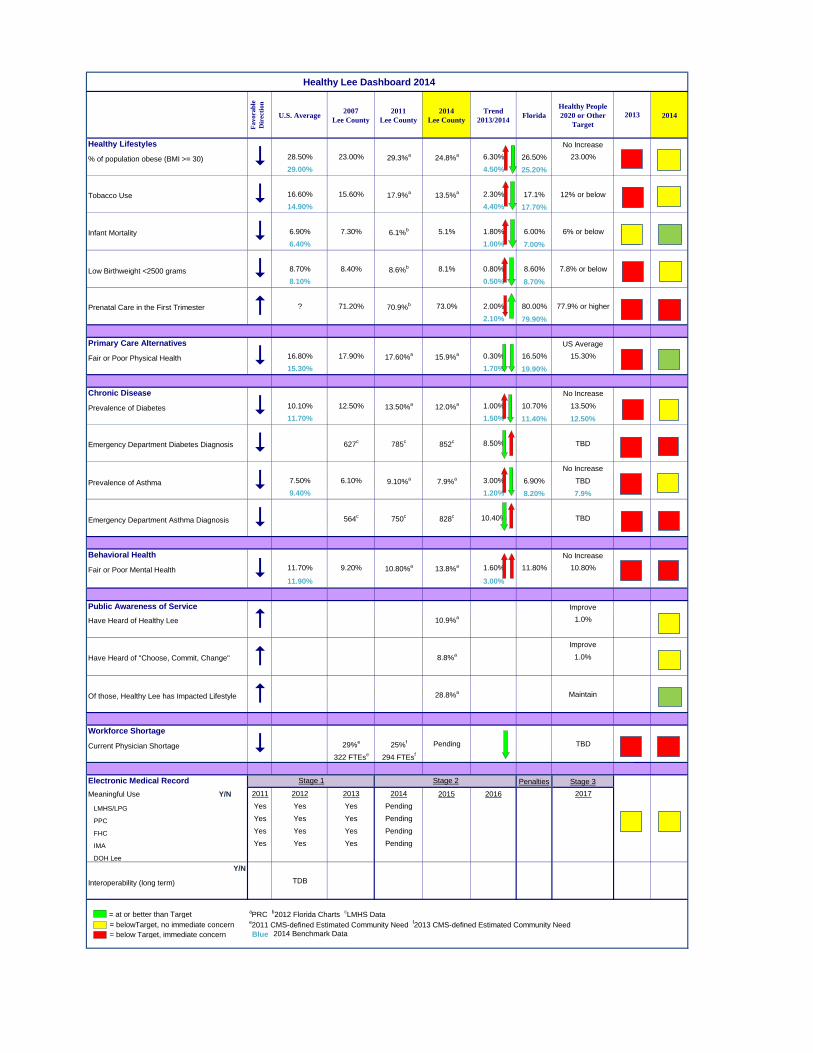
Healthy Lee Dashboard 2014
Fa
vo
ra
ble
Dir
ecti
on
U.S. Average2007
Lee County
2011
Lee County
2014
Lee County
Trend
2013/2014Florida
Healthy People
2020 or Other
Target
2014
Healthy Lifestyles No Increase
% of population obese (BMI >= 30) 28.50% 23.00% 29.3%a
24.8%a 6.30% 26.50% 23.00%
29.00% 4.50% 25.20%
Tobacco Use 16.60% 15.60% 17.9%a
13.5%a 2.30% 17.1% 12% or below
14.90% 4.40% 17.70%
Infant Mortality 6.90% 7.30% 6.1%b 5.1% 1.80% 6.00% 6% or below
6.40% 1.00% 7.00%
Low Birthweight <2500 grams 8.70% 8.40% 8.6%b 8.1% 0.80% 8.60% 7.8% or below
8.10% 0.50% 8.70%
Prenatal Care in the First Trimester ? 71.20% 70.9%b 73.0% 2.00% 80.00% 77.9% or higher
2.10% 79.90%
Primary Care Alternatives US Average
Fair or Poor Physical Health 16.80% 17.90% 17.60%a
15.9%a 0.30% 16.50% 15.30%
15.30% 1.70% 19.90%
Chronic Disease No Increase
Prevalence of Diabetes 10.10% 12.50% 13.50%a
12.0%a 1.00% 10.70% 13.50%
11.70% 1.50% 11.40% 12.50%
Emergency Department Diabetes Diagnosis 627c
785c
852c 8.50% TBD
No Increase
Prevalence of Asthma 7.50% 6.10% 9.10%a
7.9%a 3.00% 6.90% TBD
9.40% 1.20% 8.20% 7.9%
Emergency Department Asthma Diagnosis 564c
750c
828c 10.40% TBD
Behavioral Health No Increase
Fair or Poor Mental Health 11.70% 9.20% 10.80%a
13.8%a 1.60% 11.80% 10.80%
11.90% 3.00%
Public Awareness of Service Improve
Have Heard of Healthy Lee 10.9%a 1.0%
Improve
Have Heard of "Choose, Commit, Change" 8.8%a 1.0%
Of those, Healthy Lee has Impacted Lifestyle 28.8%a Maintain
Workforce Shortage
Current Physician Shortage 29%e
25%f Pending TBD
322 FTEse
294 FTEsf
Electronic Medical Record Penalties Stage 3
Meaningful Use Y/N 2011 2012 2013 2014 2015 2016 2017
LMHS/LPG Yes Yes Yes Pending
PPC Yes Yes Yes Pending
FHC Yes Yes Yes Pending
IMA Yes Yes Yes Pending
DOH Lee
Y/N
Interoperability (long term) TDB
= at or better than Target
= belowTarget, no immediate concern
= below Target, immediate concern Blue 2014 Benchmark Data
#
2013
$
$
$
$
e2011 CMS-defined Estimated Community Need
f2013 CMS-defined Estimated Community Need
aPRC
b2012 Florida Charts
cLMHS Data
$
$
$
$
$
$
$
#
#
#
Stage 1 Stage 2