Embed Size (px)
Citation preview

Exposure Assessment and Risk
Management in Mining
Communities:
The Bunker Hill Site Example
Susan Spalinger TerraGraphics Environmental Engineering, Inc. April 22, 2013
Risk Assessment
• Risk = probability of harm from exposure to a hazard
• In U.S. – Risk assessment is the method chosen to help make decisions
▫ decide what needs to be cleaned up, where, and to what level
• To protect public health and the environment
• People do not have to be sick to take action

Risk Assessment Answers These
Main Questions:
• Do hazards exist at a site? (Hazard Identification)
• How toxic is it? (Toxicity Assessment)
• Who is exposed to it, how much, how often, and for how long? (Exposure Assessment)
• How great is the risk and what is causing the risk? (Risk Characterization)

Exposure Assessment
• Early community involvement is important
▫ Community members can help answer questions about who is exposed, how they get exposed, and where they get exposed
• Develop Conceptual Site Model ▫ evaluates sources of contamination, transport
mechanisms, exposure pathways
-EPA/540/R-99/013, July 2000

Exposure Requires Understanding:
• Culture
• Demographics
• Economics
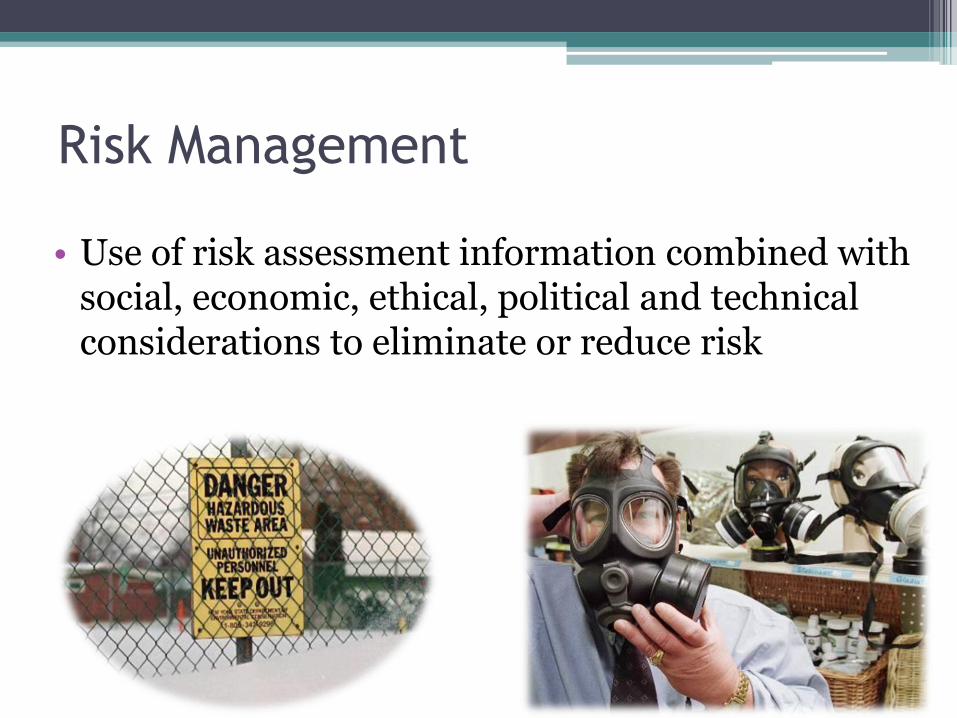
Risk Management
• Use of risk assessment information combined with social, economic, ethical, political and technical considerations to eliminate or reduce risk

Application of Risk Management and
Exposure Assessment at the Bunker
Hill Site

Located in North Idaho


West

Bunker Hill Company
Mining and Smelter Complex
• Produced ⅓ the nation’s lead, ½ the silver, ¼ zinc
• Idaho’s largest employer

Residential Community
School
Tailings and Waste Impoundment

In 1973, one of the
worst child lead
poisoning events
in U.S. history
occurred at the
Bunker Hill
Smelter.

1974 Mean Blood Lead Levels B
loo
d L
ea
d L
ev
el
(ug
/dL
)

Home Exposures at the Bunker Hill Site

1974 Blood Lead and Environmental
Data Analysis
BLOOD LEAD = ƒ [ AIR LEVELS
YARD SOIL LEVEL
HOME DUSTINESS
CHILD’S AGE
FATHER’S OCCUPATION ]
-Yankel, von Lindern, & Walter. The Silver Valley Lead
Study: the relation ship between childhood blood lead levels and environmental exposures. J. Air Pollut Control Assoc, 27(8). 1977.

Important Exposure Co-Factors:
• Poverty
• Poor Grass Cover
• Nutritional Deficiencies
• Poor Hygiene
• Smoking
• Low Socio-economic Status
• Parents’ Occupation
• Use of Locally Grown Produce
• Child’s Age
• Number of Hours Spent Outside by Children

Intervention and Risk Management
Objective:
• Minimize lead absorption while source control actions were underway by:
▫ In-home intervention
▫ Public awareness
▫ Outreach and Education

Biological Monitoring & Public
Outreach
• 1984 – voluntary fixed-site screening and was met with low participation
• 1985 – door-to-door solicitation was employed to secure blood samples
• 1988 – payment for participation strategy was initiated for blood samples
• CONTINUES TODAY

Industrial Complex Demolished and
Disposed of in High Level Waste
Repository
Lead Smelter in Operation 1970’s Smelter Demolished in 1990’s
Smelter Landfill after Closure 2000

Fugitive Dust Sources Eliminated

Common Area Cleanups
Parks, Playgrounds, Schools, Daycares

Water Pollution and Treatment

Hillsides Re-vegetation and Restoration

Residential Area Cleanups

Bunker Hill Site
Remediation Action Objectives
• 95% of all children blood lead levels ≤10 µg/dl
• No child with blood lead level > 15 µg/dl

Soil and Dust Lead to Blood
Pathways
R E M E D I A T I O N
Neighborhood Soil
House Dust
Blood
Community Soil
Yard Soil
30%
30%
40% 20%
60%
20%
-TerraGraphics Environmental Engineering, Inc. Final 1999 Five Year Review Report. 2000.


Factors Correlated to House Dust
Lead Loading Rates (1998)
• Nearby Soil Concentrations
• Use of Entry Mats
• Number of Adults that Regularly Live at the Home
• Number of Children that Regularly Live at the Home
• Hours Spent Outside by Children
• Interior Paint Condition -TerraGraphics Environmental Engineering, Inc. Final 1999 Five Year Review Report. 2000.


SOURCE CONTROL + INTERVENTION =
ELIMINATE EXPOSURE =
RISK MANAGEMENT

Children’s Blood Levels by Year, 1974-1999

More to come…