Embed Size (px)
Citation preview
Community pharmacists’ role in the continuity of care of Type 2 diabetes: An evaluation of a model
1
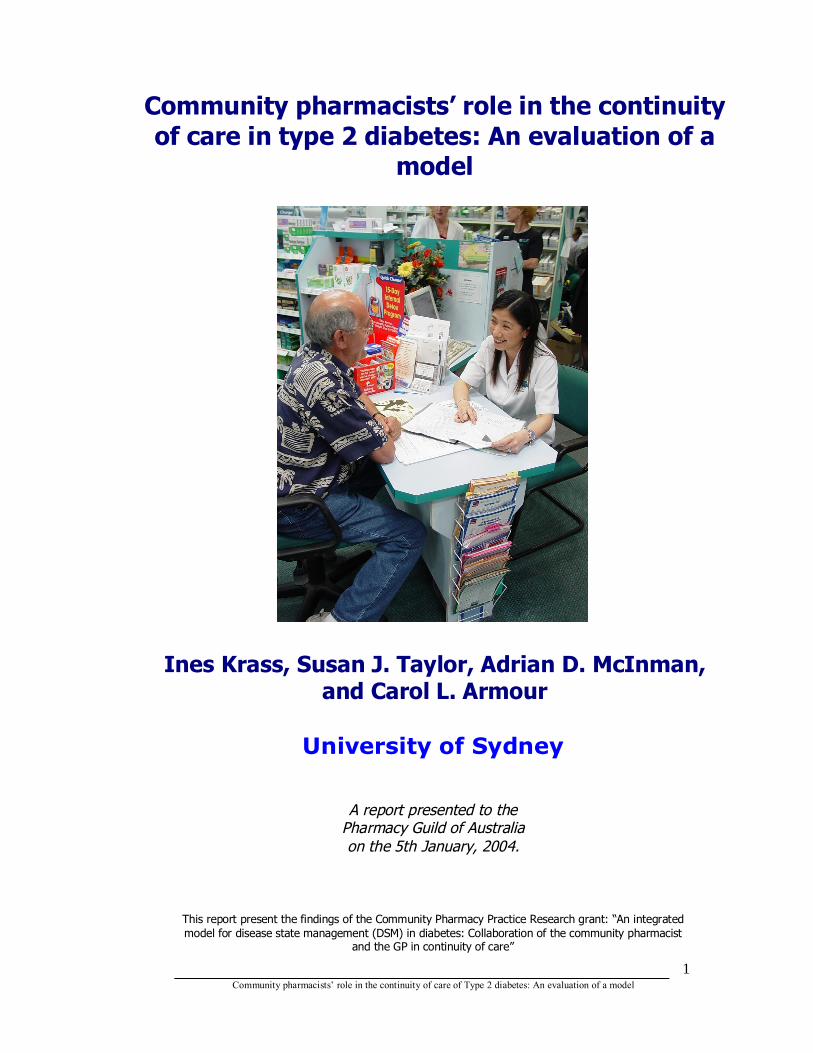
Community pharmacists’ role in the continuity of care in type 2 diabetes: An evaluation of a
model
Ines Krass, Susan J. Taylor, Adrian D. McInman, and Carol L. Armour
University of Sydney
A report presented to the Pharmacy Guild of Australia on the 5th January, 2004.
This report present the findings of the Community Pharmacy Practice Research grant: “An integrated model for disease state management (DSM) in diabetes: Collaboration of the community pharmacist
and the GP in continuity of care”
Community pharmacists’ role in the continuity of care of Type 2 diabetes: An evaluation of a model
2
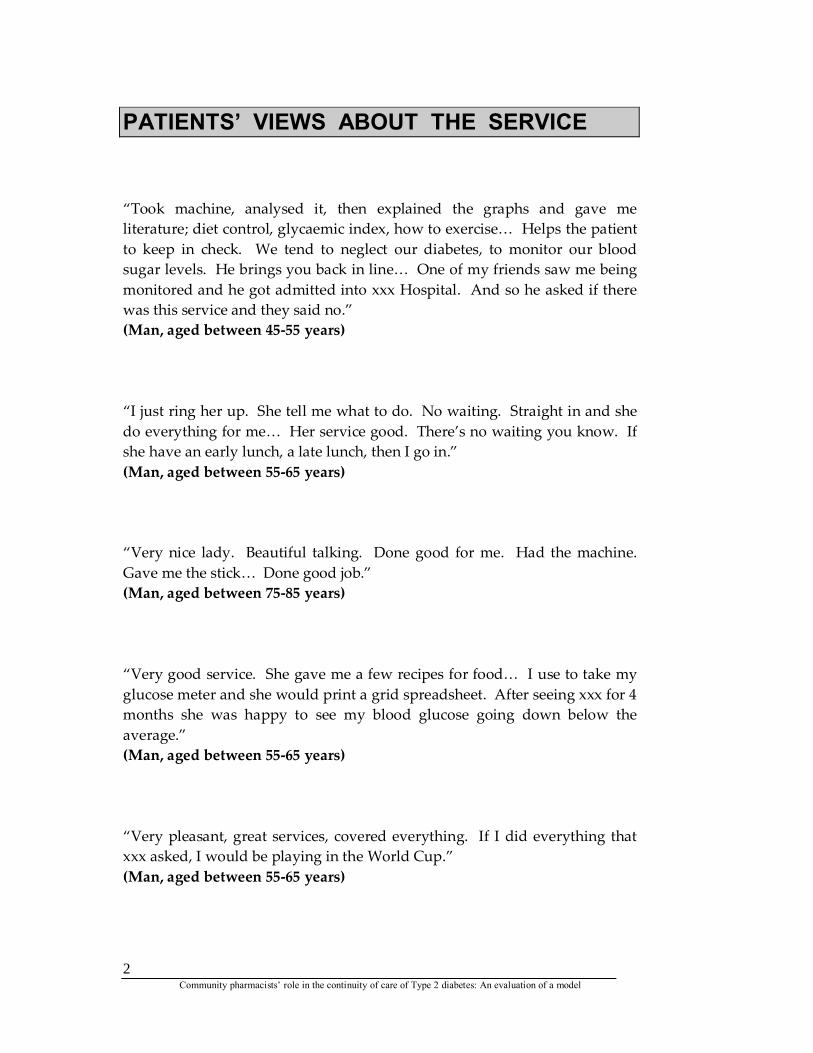
PATIENTS’ VIEWS ABOUT THE SERVICE
“Took machine, analysed it, then explained the graphs and gave me literature; diet control, glycaemic index, how to exercise… Helps the patient to keep in check. We tend to neglect our diabetes, to monitor our blood sugar levels. He brings you back in line… One of my friends saw me being monitored and he got admitted into xxx Hospital. And so he asked if there was this service and they said no.” (Man, aged between 45-55 years) “I just ring her up. She tell me what to do. No waiting. Straight in and she do everything for me… Her service good. There’s no waiting you know. If she have an early lunch, a late lunch, then I go in.” (Man, aged between 55-65 years) “Very nice lady. Beautiful talking. Done good for me. Had the machine. Gave me the stick… Done good job.” (Man, aged between 75-85 years) “Very good service. She gave me a few recipes for food… I use to take my glucose meter and she would print a grid spreadsheet. After seeing xxx for 4 months she was happy to see my blood glucose going down below the average.” (Man, aged between 55-65 years) “Very pleasant, great services, covered everything. If I did everything that xxx asked, I would be playing in the World Cup.” (Man, aged between 55-65 years)
Community pharmacists’ role in the continuity of care of Type 2 diabetes: An evaluation of a model
3
FOREWORD
The Research Team obtained funding for this project from the Commonwealth Department of Health and Ageing as part of the Third Community Pharmacy Agreement. Its aim was to developing and evaluate an integrated continuity of care model for type 2 diabetes. The authors of the grant were as follows:
Krass I, Armour C, Taylor S. “An integrated model for disease state management (DSM) in diabetes: Collaboration of the community pharmacist and GP in continuity of care.” The University of Sydney, 2001.
The basis of this model was that diabetes-specialist pharmacists delivered medication management services in clinic settings. Continuity of care was then maintained by community pharmacists focusing on on-going monitoring, education and support of the patient. This model was seen as highly promising, given the untapped potential of the pharmacist to play a significant role in diabetes care, both in specialist centres and the community, and the great need to improve communication between health care providers, including specialist staff in the diabetes clinics, general practitioners and pharmacists. Furthermore, this model was seen as likely to be highly successful due to the results of a previous study (SugarCare), conducted by many of the researchers involved in this current study [1]:
Armour C, Krass I, Taylor S, Smith C, Hourihan F. “SugarCare: Development Implementation and Evaluation of a Best Practice Guidelines for a Disease Management Program and Professional Remuneration Strategy for Diabetes in Community Pharmacy.” Final report. The University of Sydney, April, 2002.
Community pharmacists’ role in the continuity of care of Type 2 diabetes: An evaluation of a model
4
ACKNOWLEDGEMENTS
The authors wish to acknowledge the funding of this project by the Commonwealth Department of Health and Ageing as part of the Third Community Pharmacy Agreement as well as the contribution of the Guild as managers of the Third Community Pharmacy Agreement Research and Development Grants (CPA R&D Grants) Program. We also wish to thank Abbott Diagnostics for their donation of blood glucose meters, and Pat Noble (MediSense Products) for training the community pharmacists and all the health care professionals who presented at training workshops, including Prof. Don Chisholm (Garvan Institute of Medical Research), Lance Emerson (Pharmacy Guild of Australia), Bruce Fraser and Dr. Lilian Jackson (Diabetes Australia), Barbara Gates (Royal North Shore Hospital), Renee Mallon (Westmead Hospital), and Dr. Abilio de Almeida Neto (University of Sydney). Similar thanks are expressed to the members on the Steering Committee: Jan Alford (St Vincent’s Diabetes Centre), A/Prof. Steven Colagiuri (Prince of Wales Hospital), Brian Conway (Diabetes Australia National), Lance Emerson, Dr. Naomi Liskowski (South Eastern Sydney Division of General Practice), and Matthew Ryan (Pharmaceutical Society of Australia). Likewise, the community pharmacists’ professionalism was outstanding. We are grateful to all the participants who kindly agreed to join this study. The time they spent and the efforts they made in attending appointments, sometimes during extremely difficult times in their lives, was very much appreciated. We are grateful for the supportiveness of all the staff at the Prince of Wales Diabetes Centre, especially Linda Turner, Anna Lopez, and Isabell Ghikas. We also thank the staff at St Vincent’s Diabetes Centre, especially Prof. Lesley Campbell and Jan Alford, along with the staff in the Diabetes Outpatients section of St Vincent’s Hospital, especially Sylvia Simon and Alana Duncan. We wish to thank Carlene Smith and Albert Regoli for assisting in the hospital clinics. Above all other people, however, we wish to thank Jane Ludington (Diabetes Specialist Practitioner Teacher, St. Vincent’s Hospital). Her clinical skills and dedication towards the patients was exemplary. Without Jane, this study would not have been completed.
Community pharmacists’ role in the continuity of care of Type 2 diabetes: An evaluation of a model
5
ABOUT THE AUTHORS Dr. Ines Krass Associate Professor, Faculty of Pharmacy, University of Sydney Ines completed her PhD in 1991, and joined the Faculty of Pharmacy in 1993. She has a special interest in the pharmacotherapy of cardiovascular disease and diabetes and has lectured over the past decade to both undergraduates and community practitioners on these topics. Her main research focus centres on the development and evaluation of extended professional pharmacy services (provision of medicine information, counselling on medication use, screening and primary prevention in cardiovascular disease, and disease state management programs in asthma and diabetes), with a particular focus on community practice. Dr. Sue Taylor Lecturer, Faculty of Pharmacy, University of Sydney Sue has extensive hospital pharmacy experience and has worked as a community pharmacist. She also has 15 years teacher/academic experience. Her main research focus has been in the areas of pharmacoeconomics, health economics, economic evaluation and willingness to pay for pharmacy services. Adrian McInman Project Officer, Faculty of Pharmacy, University of Sydney Adrian McInman has two undergraduate degrees in sociology and physical education, a master’s degree specialising in sport psychology, an Honours degree majoring in psychology, and a teaching diploma. He has twelve years post-study research experience, based at several universities and hospitals and since 1998 has had his own research business (McInman Research Centre) specialising in health research. His research has focused on: smoking, diabetes, gastroenterology, psychiatric illness, Aboriginal health, and sport/exercise psychology. Prof. Carol Armour Professor, Faculty of Pharmacy, University of Sydney After completing a PhD in Pharmacology, Carol pursued postdoctoral study in Canada. She has worked for the NH and MRC as a Senior Research Officer for 7 years. In 1989 she joined the Faculty of Pharmacy at the University of Sydney as a lecturer. She has extensive research experience, especially in diabetes care, cost effectiveness, asthma, airway smooth muscle, inflammation, cytokines, corticosteroids, drug utilisation, and antibiotics.
Community pharmacists’ role in the continuity of care of Type 2 diabetes: An evaluation of a model
6
DEFINITIONS Type 2 Diabetes Mellitus Is a disorder in which the pancreas produces some insulin, but the tissues do not respond to it properly. As a result, high concentrations of sugar build up in the blood after eating (hyperglycaemia). Prolonged hyperglycaemia can lead to long-term complications such as retinopathy, nephropathy, peripheral neuropathy, gangrene, atherosclerosis, and erectile dysfunction. Impaired Glucose Tolerance (IGT) Is a condition in which blood sugar levels are higher than normal, but are not high enough to be classified as diabetes. The condition is a major risk factor for type 2 diabetes mellitus. Diabetes Australia [2] suggests that individuals who have a value between 7.8 and 11.0 mmol/l on an oral glucose tolerance test be considered to have IGT. HbA1c “The HbA1c (glycated-haemoglobin) test measures your average blood glucose control over the preceding three months. This test is important in the ongoing assessment of the risk of complications together with regular blood glucose self-testing” (Diabetes Australia, 2000, p. 14) [3]. People with diabetes, are encouraged by Diabetes Australia [2], to have a HbA1c level of 7.0% or less. Blood Glucose Test Self-monitoring of blood glucose by patients using blood glucose meters, such as the MediSense Precision QID, is a spot check and reveals information only on the day of the blood glucose test. People with diabetes, are encouraged by Diabetes Australia [2], to have a fasting blood glucose level between 4.0 and 6.0 mmol/l.
Community pharmacists’ role in the continuity of care of Type 2 diabetes: An evaluation of a model
7
Total Cholesterol A total cholesterol test measures the amount of cholesterol in the serum part of blood. Excess cholesterol in the blood is correlated with cardiovascular disease; the higher the total cholesterol, the higher the risk for heart disease. People with diabetes, are encouraged by Diabetes Australia [2], to have a total cholesterol level of 4.5 mmol/l or less. HDL Cholesterol Transports cholesterol from the liver through the bloodstream to cells throughout the body. It is often referred to as ‘good cholesterol’, because high levels may actually protect against heart disease. People with diabetes, are encouraged by Diabetes Australia [2], to have a HDL cholesterol level of 1.0 mmol/l or greater. Triglycerides Are a type of lipid that are formed from a combination of fatty acids and glycerol. High levels are associated with an increased incidence of arteriosclerosis, alcoholism, diabetes mellitus, nephrotic syndrome and hypothyroidism. People with diabetes, are encouraged by Diabetes Australia [2], to have triglyceride levels of 2.0 mmol/l or less. Blood pressure Is a measurement of the force applied to the walls of the arteries as the heart pumps blood through the body. The pressure is determined by the force and the amount of blood pumped and the size and flexibility of the arteries. Systolic blood pressure This reflects the maximum pressure exerted when the heart contracts. People with diabetes, are encouraged by Diabetes Australia [2], to have systolic blood pressure levels less than 130mmHg. Diastolic blood pressure This reflects the pressure in the arteries when the heart is at rest. People with diabetes, are encouraged by Diabetes Australia [2], to have diastolic blood pressure levels less than 85mmHg.
Community pharmacists’ role in the continuity of care of Type 2 diabetes: An evaluation of a model
8
Body Mass Index The Body Mass Index (BMI), a measure of appropriate body mass, is calculated with the following formula: Weight (kg) BMI = ----------------- Height2 (m) “The healthy BMI is 20 to 25, overweight 25-30, obese > 30” (Diabetes Australia, 2003, p. 16) [2]. People with diabetes, are encouraged by Diabetes Australia [2], to have BMI levels of 27 or less where practicable.
Community pharmacists’ role in the continuity of care of Type 2 diabetes: An evaluation of a model
9
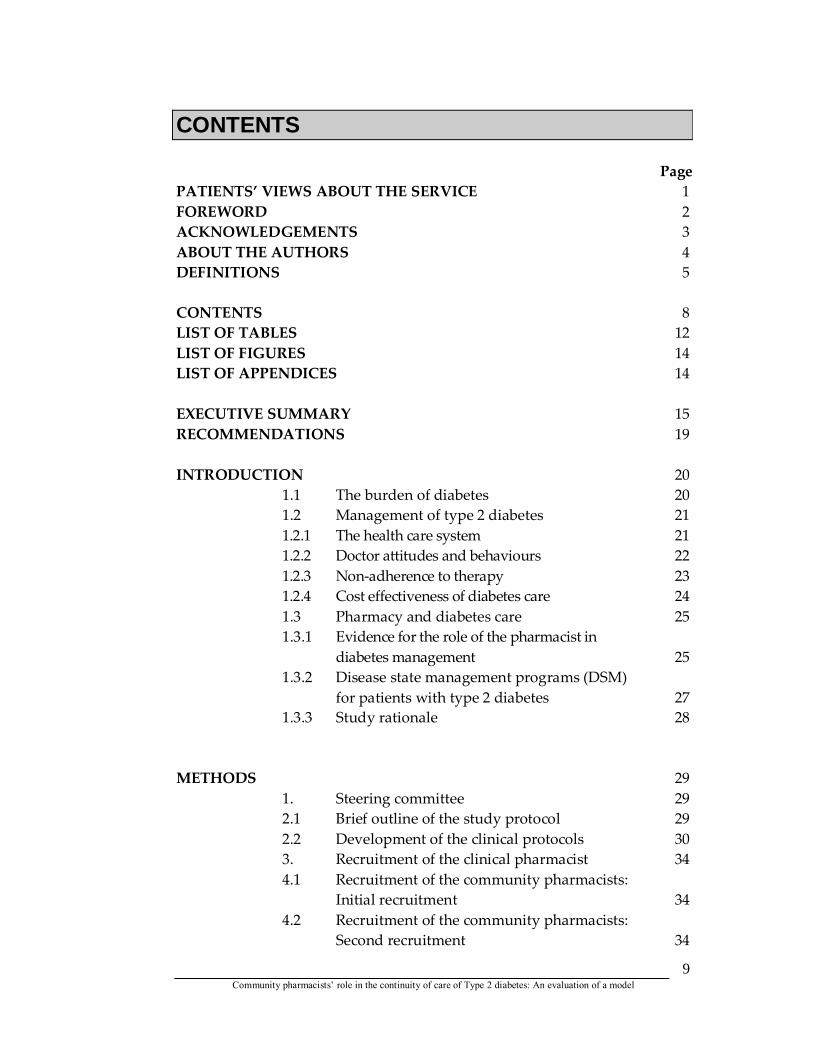
CONTENTS Page PATIENTS’ VIEWS ABOUT THE SERVICE 1 FOREWORD 2 ACKNOWLEDGEMENTS 3 ABOUT THE AUTHORS 4 DEFINITIONS 5 CONTENTS 8 LIST OF TABLES 12 LIST OF FIGURES 14 LIST OF APPENDICES 14 EXECUTIVE SUMMARY 15 RECOMMENDATIONS 19 INTRODUCTION 20 1.1 The burden of diabetes 20 1.2 Management of type 2 diabetes 21 1.2.1 The health care system 21 1.2.2 Doctor attitudes and behaviours 22 1.2.3 Non-adherence to therapy 23 1.2.4 Cost effectiveness of diabetes care 24 1.3 Pharmacy and diabetes care 25 1.3.1 Evidence for the role of the pharmacist in diabetes management 25 1.3.2 Disease state management programs (DSM) for patients with type 2 diabetes 27 1.3.3 Study rationale 28 METHODS 29 1. Steering committee 29 2.1 Brief outline of the study protocol 29 2.2 Development of the clinical protocols 30 3. Recruitment of the clinical pharmacist 34 4.1 Recruitment of the community pharmacists: Initial recruitment 34 4.2 Recruitment of the community pharmacists: Second recruitment 34
Community pharmacists’ role in the continuity of care of Type 2 diabetes: An evaluation of a model
10
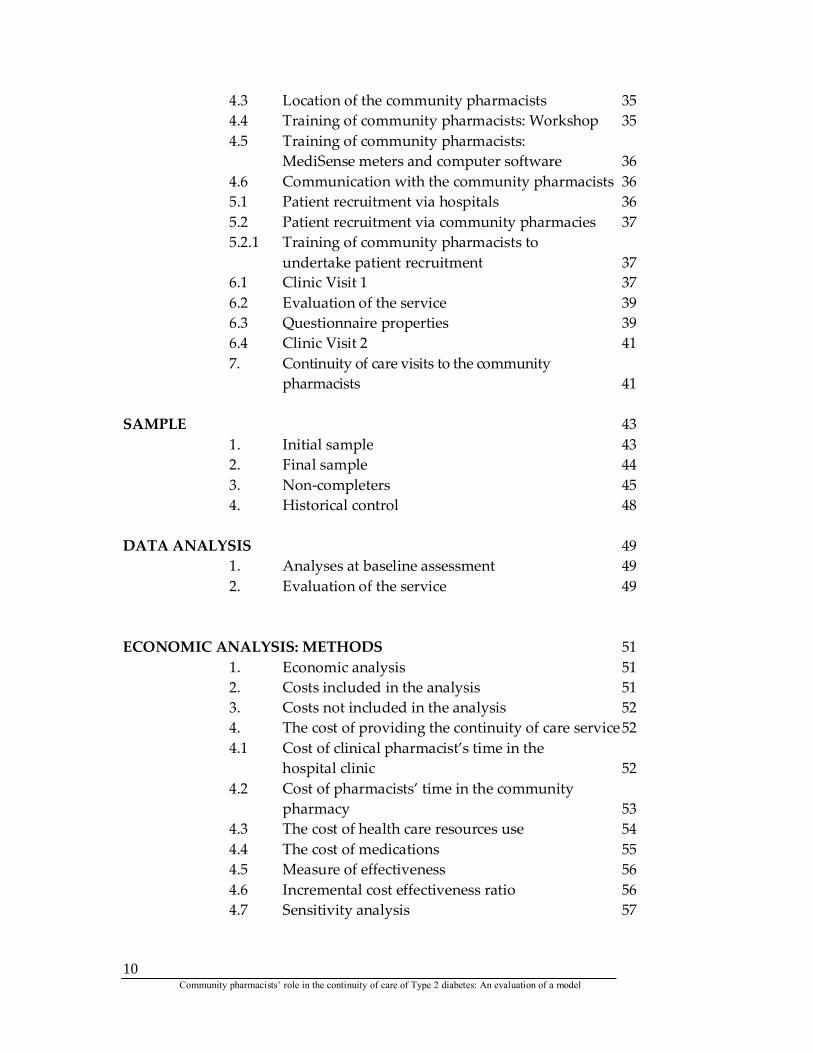
4.3 Location of the community pharmacists 35 4.4 Training of community pharmacists: Workshop 35 4.5 Training of community pharmacists: MediSense meters and computer software 36 4.6 Communication with the community pharmacists 36 5.1 Patient recruitment via hospitals 36 5.2 Patient recruitment via community pharmacies 37 5.2.1 Training of community pharmacists to undertake patient recruitment 37 6.1 Clinic Visit 1 37 6.2 Evaluation of the service 39 6.3 Questionnaire properties 39 6.4 Clinic Visit 2 41 7. Continuity of care visits to the community pharmacists 41 SAMPLE 43 1. Initial sample 43 2. Final sample 44 3. Non-completers 45 4. Historical control 48 DATA ANALYSIS 49 1. Analyses at baseline assessment 49 2. Evaluation of the service 49 ECONOMIC ANALYSIS: METHODS 51 1. Economic analysis 51 2. Costs included in the analysis 51 3. Costs not included in the analysis 52 4. The cost of providing the continuity of care service 52 4.1 Cost of clinical pharmacist’s time in the hospital clinic 52 4.2 Cost of pharmacists’ time in the community pharmacy 53 4.3 The cost of health care resources use 54 4.4 The cost of medications 55 4.5 Measure of effectiveness 56 4.6 Incremental cost effectiveness ratio 56 4.7 Sensitivity analysis 57
Community pharmacists’ role in the continuity of care of Type 2 diabetes: An evaluation of a model
11
RESULTS 58 SECTION A: INITIAL HEALTH 58 1. Current Diabetic Medication Management 58 1.1 Final sample versus non-completers 59 1.2 Clinic only versus continuity of care 60 2. Health Conditions 61 2.1 Final sample versus non-completers 61 2.2 Clinic only versus continuity of care 63 3. Diabetes Education and Blood Glucose Monitoring 64 3.1 Final sample versus non-completers 64 3.2 Clinic only versus continuity of care 66 4. Clinical Data 67 4.1 Final sample versus non-completers 67 4.2 Clinic only versus continuity of care 68 5. Health Care Resources Utilisation 71 5.1 Final sample versus non-completers 71 5.2 Clinic only versus continuity of care 72 SECTION B: PHARMACISTS’ INTERVENTIONS 73 6. Pharmacists’ Interventions 73 6.1 Interventions delivered by the pharmacists in the clinic 73 6.2 Interventions delivered by the pharmacists
in the community 78
SECTION C: SERVICE EVALUATION 80 7. Clinical Outcomes 80 7.1 Mean blood glucose levels 80 7.2 Change in glycosylated haemoglobin (HbA1c%) at follow-up 81 7.3 Distribution of elevated HbA1c 82 7.4 Changes in systolic and diastolic blood pressure and BMI at follow-up 83 8. Psychological Outcomes 84 8.1 Sense of well-being 84 8.2 Diabetes care profile 85 9. Adherence to Medication 87 9.1 Brief Medication Questionnaire 87
Community pharmacists’ role in the continuity of care of Type 2 diabetes: An evaluation of a model
12
SECTION D: COMPARISON OF MEDICATION USAGE 89 10. Changes to Medication Regimen 89 10.1 Diabetes regimen 89 10.2 Antihypertensive regimen 90 10.3 Lipid lowering regimen 91 10.4 Defined daily doses 92 10.5 Mean number of medications and monthly medication costs 93 SECTION E: ECONOMIC ANALYSIS 95 11. Economic Analysis 95 11.1 Cost of service provision 95 11.2 Cost of health care resources 96 11.3 Cost of medications 96 11.4 The total cost of providing the continuity of care service 97 11.5 Incremental cost effectiveness ratio 99 11.6 Sensitivity analysis 99 DISCUSSION 100 CONCLUSION 106 REFERENCES 107 APPENDIX 1 113 APPENDIX 2 116 APPENDIX 3 118 APPENDIX 4 122 APPENDIX 5 126 APPENDIX 6 128 APPENDIX 7 129 APPENDIX 8 135 APPENDIX 9 137
Community pharmacists’ role in the continuity of care of Type 2 diabetes: An evaluation of a model
13
LIST OF TABLES Table 1: ECHO Parameters the protocol was evaluated by 39 Table 2: Comparison of patients seen at pre-testing and post-testing in the clinic (n=118) 44 Table 3: Number of patients who completed all community pharmacy visits or the hospital clinic post-test 46 Table 4: Number of patients who completed the psycho-social questionnaire or the medication adherence interview 47 Table 5: Comparison between the final sample and the non-completers with regards to current diabetic medication management (n=114) 59 Table 6: Comparison between continuity of care and clinic only patients with regards to current diabetic medication management (n=94) 60 Table 7: Comparison between the final sample and the non-completers with regards to who have been told that they have various health conditions (n=118) 62 Table 8: Comparison between continuity of care and clinic only patients with regards to who have been told that they have various health conditions (n=95) 63 Table 9: Comparison between the final sample and the non-completers with regards to who have received diabetes education and who monitor their blood glucose at home (n=118) 65 Table 10: Comparison between continuity of care and clinic only patients with regards to who have received diabetes education and who monitor their blood glucose at home (n=95) 66 Table 11: Comparison between the final sample and the non-completers with regards to clinical data (n=118) 69 Table 12: Comparison between the continuity of care and clinic only patients with regards to clinical data (n=95) 70 Table 13: Comparison between the final sample and the non-completers with regards to general practitioner, hospitalisation and accident and emergency visits (n=114) 71 Table 14: Comparison between continuity of care and clinic only patients with regards to who have received diabetes education and who monitor their blood glucose at home (n=95) 72 Table 15: Mean blood glucose readings at follow-up for the continuity of care group (n=25) 80 Table 16: Distribution of blood glucose readings at follow-up visits 1 and 4 80 Table 17: HbA1c% at baseline and follow-up continuity of care
Community pharmacists’ role in the continuity of care of Type 2 diabetes: An evaluation of a model
14
versus clinic only group 81 Table 18: HbA1c% at baseline and follow-up continuity of care versus historical control 81 Table 19: Logistic regression analysis of likelihood of reaching target HbA1c (greater than 7%) post intervention 83 Table 20: Distribution of blood pressure and BMI pre and post Intervention 83 Table 21: Well-being scores pre and post intervention 84 Table 22: Diabetes Care Profile subscales pre and post intervention 86 Table 23: Risk of non adherence scores (BMQ) 88 Table 24: Proportions of participants with self-reported knowledge of medications pre and post intervention 88 Table 25: Antidiabetic regimen pre and post intervention 89 Table 26: Antidiabetic medication combinations pre and post intervention 90 Table 27: Antihypertensive regimens pre and post intervention: Number of medications 91 Table 28: Antihypertensive regimens pre and post intervention: Type of medications 91 Table 29: Lipid lowering regimens pre and post intervention 92 Table 30: Median defined daily doses of medications 92 Table 31: Mean number of medications per participant 93 Table 32: Cost of medications per participant per month 93 Table 33: Changes to therapy: Medication ceased 94 Table 34: Changes to therapy: Medication added 94 Table 35: Cost of health care resources used 97 Table 36: Total cost of enhanced service versus standard service during study period 98 Table 37: Summary of demographic comparisons between clinic only and
continuity of care group. 138
Community pharmacists’ role in the continuity of care of Type 2 diabetes: An evaluation of a model
15
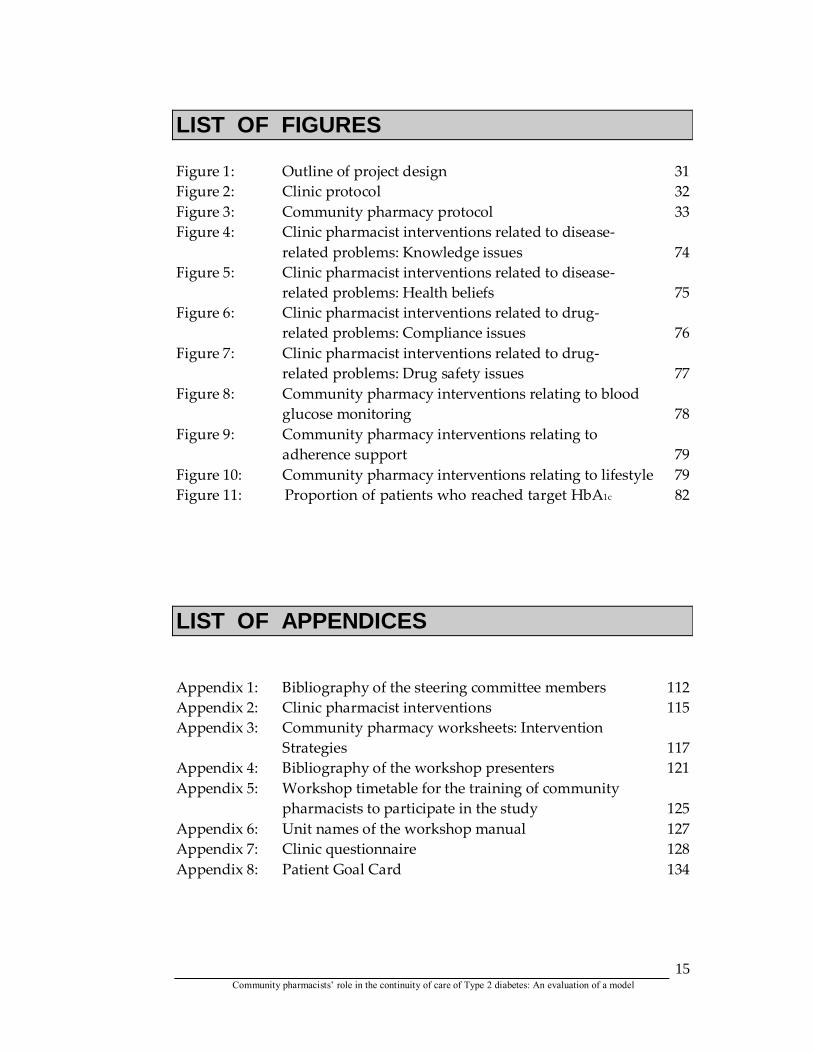
LIST OF FIGURES Figure 1: Outline of project design 31 Figure 2: Clinic protocol 32 Figure 3: Community pharmacy protocol 33 Figure 4: Clinic pharmacist interventions related to disease-
related problems: Knowledge issues 74 Figure 5: Clinic pharmacist interventions related to disease-
related problems: Health beliefs 75 Figure 6: Clinic pharmacist interventions related to drug-
related problems: Compliance issues 76 Figure 7: Clinic pharmacist interventions related to drug-
related problems: Drug safety issues 77 Figure 8: Community pharmacy interventions relating to blood
glucose monitoring 78 Figure 9: Community pharmacy interventions relating to
adherence support 79 Figure 10: Community pharmacy interventions relating to lifestyle 79 Figure 11: Proportion of patients who reached target HbA1c 82
LIST OF APPENDICES Appendix 1: Bibliography of the steering committee members 112 Appendix 2: Clinic pharmacist interventions 115 Appendix 3: Community pharmacy worksheets: Intervention Strategies 117 Appendix 4: Bibliography of the workshop presenters 121 Appendix 5: Workshop timetable for the training of community pharmacists to participate in the study 125 Appendix 6: Unit names of the workshop manual 127 Appendix 7: Clinic questionnaire 128 Appendix 8: Patient Goal Card 134
Community pharmacists’ role in the continuity of care of Type 2 diabetes: An evaluation of a model
16
EXECUTIVE SUMMARY
Aim: To evaluate the impact of a continuity of care model for disease state
management in patients with type 2 diabetes. The model comprised an
initial consultation with a specialist pharmacist in the diabetes clinic, written
communication with the patient’s community pharmacist and general
practitioner, followed by ongoing monitoring of the patient by the
community pharmacist.
Methods: A total of 28 pharmacists from 20 pharmacies in the Eastern Suburbs of
Sydney were recruited and received training in diabetes disease state
management in preparation for delivery of the continuity of care service.
One hundred and eighteen patients with type 2 diabetes were recruited from
two diabetes clinics in Eastern Sydney and assigned to a clinic only or
continuity of care group. Clinical, humanistic and economic data were
collected at the initial clinic visit and six months later at follow up. The clinic
only patients were assessed by the clinic pharmacist at the initial visit. They
received usual pharmacy care in the community until the follow up clinic
visit clinic visit six months later. The continuity of care patients were
referred to a conveniently located participating pharmacy and a report was
sent by the clinic pharmacist to the pharmacy and the patients nominated
GP. They attended the community pharmacy for five visits over a six month
period, where they received ongoing support and care. After six months
they attended a second clinic visit for final data collection. The evaluation
Community pharmacists’ role in the continuity of care of Type 2 diabetes: An evaluation of a model
17
using a repeated measures design compared clinical, humanistic and
economic outcomes for the clinic only and continuity of care groups.
Results: Complete data were obtained for 70 clinic only and 25 continuity of care
patients.
96% of the continuity of care participants completed all five community
pharmacy visits.
All patients received an assessment of the medication regimen and
targeted counselling on drug related issues by the clinic pharmacist.
All continuity of care patients received a free MediSense blood glucose
monitor and feedback on blood glucose levels at each community
pharmacy visit. Discretionary interventions delivered by the community
pharmacist included discussion of patient health beliefs, providing
adherence support, discussing potential or actual adverse drug effects,
advice on lifestyle changes, and prompting for medical checks.
In the clinic:
A total of 275 interventions were delivered and documented by the clinic
pharmacist over the duration of the study.
Approximately one third of the specified interventions were classified
under the broader category of disease related problems, and two thirds as
drug-related problems.
In the community pharmacy:
The majority of patients received education about their medicines, both
verbal and written information about nutrition, exercise, and foot care in
diabetes, hyperglycaemia and hypoglycaemia.
Community pharmacists’ role in the continuity of care of Type 2 diabetes: An evaluation of a model
18
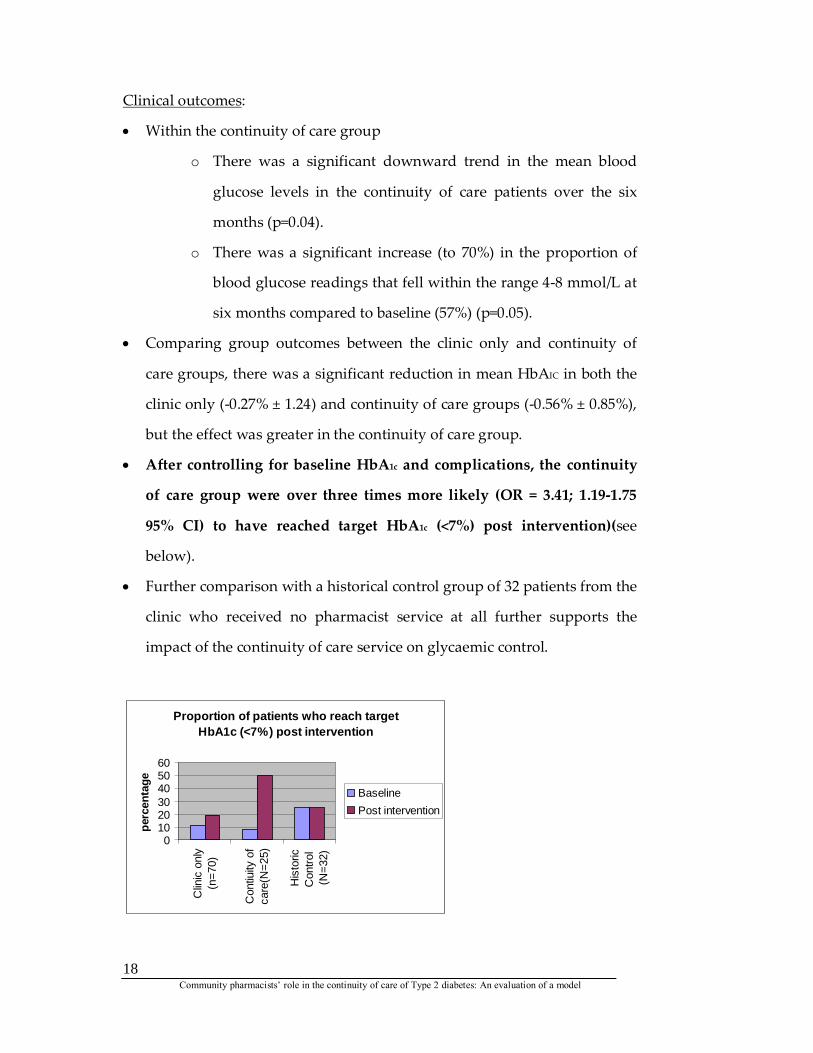
Clinical outcomes:
Within the continuity of care group
o There was a significant downward trend in the mean blood
glucose levels in the continuity of care patients over the six
months (p=0.04).
o There was a significant increase (to 70%) in the proportion of
blood glucose readings that fell within the range 4-8 mmol/L at
six months compared to baseline (57%) (p=0.05).
Comparing group outcomes between the clinic only and continuity of
care groups, there was a significant reduction in mean HbAIC in both the
clinic only (-0.27% ± 1.24) and continuity of care groups (-0.56% ± 0.85%),
but the effect was greater in the continuity of care group.
After controlling for baseline HbA1c and complications, the continuity
of care group were over three times more likely (OR = 3.41; 1.19-1.75
95% CI) to have reached target HbA1c (<7%) post intervention)(see
below).
Further comparison with a historical control group of 32 patients from the
clinic who received no pharmacist service at all further supports the
impact of the continuity of care service on glycaemic control.
Proportion of patients who reach target HbA1c (<7%) post intervention
0102030405060
Clin
ic o
nly
(n=7
0)
Con
tiuity
of
care
(N=2
5)
His
toric
Con
trol
(N=3
2)
perc
enta
ge
BaselinePost intervention
Community pharmacists’ role in the continuity of care of Type 2 diabetes: An evaluation of a model
19
In the continuity of care model at follow-up, patients had improvements
in mean negative attitude, positive attitude and care ability scale scores in
the Diabetes Care Profile and improvements in negative well-being
subscale scores of the Well-Being Questionnaire 12. In the clinic only
group improvements were seen only in negative attitude and negative
well-being scores.
Impact of the service on medication usage:
There was a reduction in the proportion of patients who reported missing
a dose in the previous week and in the proportion of patients reporting
difficulties in remembering to take their medications in the continuity of
care group (no changes were seen in the clinic only group).
There was a significant increase in mean medications per patient in the
continuity of care group, with none observed in the clinic only group.
There were substantial changes to therapy especially in antihypertensive
medications. This may have contributed to the reduction of -7mm Hg in
mean systolic blood pressure observed in the continuity of care patients ,
with no change in the clinic only group (p=0.06).
Economic outcomes:
When cost of pharmacist time, blood glucose printouts, phone calls and
health care resource use, and medications were included, the total cost of
the enhanced service (continuity of care) was $1,606.45 over six months
compared to $1,555.15 for the clinic only service; an incremental cost of
$51.30 per patient.
This $51.30 per patient achieved a 0.3% reduction in HbAIC (on average)
per patient over the six month period.
Community pharmacists’ role in the continuity of care of Type 2 diabetes: An evaluation of a model
20
RECOMMENDATIONS
A continuity of care service for diabetes disease state management is
feasible.
A pharmacist is a valuable addition to the diabetes care team in a diabetes
clinic and can serve as a critical link in achieving continuity of care for
patients with type 2 diabetes.
Ongoing monitoring of the progress of the disease in the community
appeared to be an essential element of the continuity of care process.
The service is more cost effective than the SugarCare service and other
studies performed overseas when related to diabetes specific outcomes.
We recommend that funding for disease state management services,
delivered by pharmacists, both in diabetes clinics and community
pharmacies, be considered in the future.
In any future studies of diabetes, or pilot implementation programs,
complications should be monitored over a significant time period to
assess the long term impact of the program on diabetes health care.
The sustainability of the program should be assessed over a period of at
least two years rather than the six month period studied here. The cost
per patient/year of such a program is likely to be reduced once the
program is extended beyond the initial intervention and monitoring
period.
Community pharmacists’ role in the continuity of care of Type 2 diabetes: An evaluation of a model
21
INTRODUCTION
1.1 The burden of diabetes Diabetes is a common condition that contributes significantly to premature
mortality, morbidity, disability and loss of potential years of life [4, 5]. The
incidence and prevalence of diabetes are on the rise worldwide [6-9]. Type 2
diabetes is also increasingly occurring at a younger age, even in adolescence
and childhood [9-12].
An estimated 940,000 Australians aged 25 years and over have diabetes or
impaired glucose tolerance, although around half of these people are
currently undiagnosed [13, 14]. The number of adults with diabetes has
trebled since 1981 [13]. The Australian Diabetes, Obesity and Lifestyle Study
(AusDiab), conducted in 2001 [13], was the first ever national study to
determine the prevalence of diabetes, obesity and other cardiovascular
disease risk factors including hypertension and abnormal serum lipid
profiles. This study has shown that by world standards for a Western nation,
the prevalence of diabetes and its co-morbidities is very high. Almost 1 in 4
Australians aged 25 years or more have either diabetes or impaired glucose
tolerance. The high rates of diabetes and impaired glucose metabolism,
coupled with those of obesity, dyslipidaemia and hypertension, constitute a
significant threat in terms of the socioeconomic burden of cardiovascular
disease and diabetic complications for Australia [6].
Diabetes and its associated complications, which include cardiovascular,
kidney and eye diseases, compromise the quality of life of a large number of
Community pharmacists’ role in the continuity of care of Type 2 diabetes: An evaluation of a model
22
Australians [4, 15]. They are also a sharply increasing component of health
care costs. This increase is likely to continue as the population ages further
[16]. The direct annual healthcare costs of diabetes in Australia in 1995 were
$1.4 billion [15].
Australian Health Ministers declared diabetes mellitus as the fifth National
Health Priority Area in 1996, because it met several of the criteria for priority
national attention [5]. Diabetes-related deaths accounted for 18,982 deaths,
or 7.4% of all deaths in 1997 and 1998 [17]. Diabetes-related deaths are
substantially higher among Aboriginal and Torres Strait Islander peoples
(16.4% of deaths among Indigenous Australians), people living in remote
areas of Australia (9.5% of deaths in remote areas) and people living in the
most disadvantaged areas (8.4% of deaths in the most disadvantaged area)
[17].
1.2 Management of type 2 diabetes Evidence suggests that many people with diabetes are not receiving optimal
care in a health system geared towards acute and episodic illnesses [18]. The
literature is unclear about why optimal care is not provided to patients with
type 2 diabetes. However, three main areas of concern have been identified.
These are the current health care system, attitudes and behaviours of doctors,
and patient non-adherence.
1.2.1 The health care system Diabetes is a complex and chronic disease that requires intensive treatment
to prevent or delay the associated complications that develop due to poor
Community pharmacists’ role in the continuity of care of Type 2 diabetes: An evaluation of a model
23
control of blood glucose levels. Unlike an acute illness where patients are
asked to take medication over a short period of time, the treatment for
diabetes involves a lifelong, complex regimen that varies between patients
and in different situations. Effective management of diabetes and its
complications involves consultation with professionals from a variety of
disciplines. Important health care providers that are often involved include
physicians, dietitians, diabetes educators, cardiologists, ophthalmologists,
podiatrists and pharmacists [19]. Communication between these
practitioners is very important to facilitate continuity of care. Without such
communication, the patient receives fragmentary care, instead of a well
defined management plan.
Studies focusing on the management of type 2 diabetes in the Australian
health care system are limited. The episodic nature of the current United
States health care system has been criticised for its focus on treatment of
acute diabetic complications [18, 20], although caution should be exercised in
extending this to the Australian system. It has been shown that a well
structured support system in general practice can achieve results equivalent
to hospital care [21]. The improved metabolic control of patients attending
diabetes clinics, or seeing a doctor specially trained in diabetes, supports this,
as well as the hypothesis that doctor variables will affect the level of care
provided [22].
1.2.2 Doctor attitudes and behaviours Research has demonstrated that doctors are not compliant with all diabetes
care guidelines, and that compliance is lower for type 2 diabetes than type 1
[23]. This may be due to underestimation of the severity of diabetes, the
Community pharmacists’ role in the continuity of care of Type 2 diabetes: An evaluation of a model
24
belief that complications are inevitable, and/or not understanding the
difficulties of weight loss [18, 20]. El-Kebbi et al. [24] found that doctors may
not intensify hypoglycaemic therapy to achieve recommended HbA1c if they
perceived that control was improving or patient was non-compliant with
lifestyle or medication [24]. Implementation of guidelines in Australia
varies, with research showing that 33% of the patients never had their feet
examined and only 71% had their HbA1c within recommended targets [25].
A recent initiative to improve the diabetes management in Australia is the
National Integrated Diabetes Program (NIDP) [26]. In 2001, the Government
provided $43.4 million over four years to improve prevention, provide
earlier diagnosis and improve management of people with diabetes through
general practice [26]. This package provides incentives for general
practitioners for earlier diagnosis and effective management for people with
diabetes and support for Divisions of General Practice to work with general
practitioners and other health care professionals to remove barriers to better
care for people with diabetes. One key strategy to enable structured and
systematic care with regular follow up and recall of patients is the CARDIAB
database, a centralised register and recall system. Research has already
demonstrated that general practitioners participating in the share care
registers see their patients with diabetes more regularly and order tests, such
as HbA1c and microalbuminuria, more frequently than those not using
registers [27].
1.2.3 Non-adherence to therapy Non-adherence to therapy has been identified as the most problematic aspect
of diabetes control [28]. Estimates of adherence to insulin injection regimens
Community pharmacists’ role in the continuity of care of Type 2 diabetes: An evaluation of a model
25
range from 20% to 80%; adherence to dietary recommendations converges
around 65%; adherence to glucose monitoring regimens ranges from 57% to
70%; and adherence to exercise regimens ranges from 19% to 30% [19]. It is
estimated that only 7% of patients with diabetes were adherent with all
aspects of their treatment plan [29, 30].
Limited studies have been reported on adherence to antidiabetic medication.
Reported rates vary depending on the sample used and the methods of
measuring adherence. For example, two US studies using retrospective
review of pharmacy records and claims databases have reported similar
adherence rates to diabetes medication of 70%-80% [31] and 83% [32].
Another study in Dutch patients using Medication Event Monitoring
Systems (MEMS) for measurement estimated an average adherence rate of
74% to diabetes medication [33]. More recently, a large population based
study in Scotland, using prescription records found adequate adherence (> or
= 90%) in 31% of patients prescribed sulphonylureas alone and in 34% of
those prescribed metformin alone [34].
1.2.4 Cost effectiveness of diabetes care It is interesting that two recent papers have reached opposite conclusions
regarding the cost effectiveness of implementing intensive management of
type 2 diabetes into everyday clinical practice. Gray et al. [35] estimated that
implementing the main findings of the United Kingdom Prospective
Diabetes Study (UKPDS) for all people with diagnosed type 2 diabetes in
England would cost about £100m annually, and would be cost effective.
Pekarsky and Ewald [36], however, suggested that the Australian health care
system could not afford intensive management of type 2 diabetes. One of
Community pharmacists’ role in the continuity of care of Type 2 diabetes: An evaluation of a model
26
their major concerns was that more intensive management of diabetes would
increase the workload of general practice across the country. On this basis
there is a need to explore different models of care delivery to patients with
type 2 diabetes and make better use of heath care resources in the
community.
1.3 Pharmacy and diabetes care One of Australia’s most valuable primary health care resources is the
pharmacy profession. Community pharmacists provide an established and
visible network, extending to remote areas, of easily accessible health care
professionals. Research suggests that the primary health care consultation
rate in Australian pharmacies may be as high as 43 million per year [37]. The
consumer can consult a pharmacist without an appointment and with
minimal waiting times. This is where community pharmacists can assist.
Pharmacists are nationally recognised as providers of long-term care for
people with diabetes and it is logical that they should help the Australian
health care system cope with the burgeoning issue of type 2 diabetes and its
intensive, evidence-based management. Moreover they should be identified
as part of the diabetes care team.
1.3.1 Evidence for the role of the pharmacist in diabetes management
The literature reports numerous examples of positive health outcomes when
pharmacists provide professional services for patients with diabetes [38-43].
Sczupak and Conrad [38] were able to demonstrate a reduced incidence of
hospital admissions and medical contacts resulting from the provision of a
patient-oriented pharmaceutical service for diabetes patients. Similarly,
several subsequent evaluations of diabetes care models implemented by
Community pharmacists’ role in the continuity of care of Type 2 diabetes: An evaluation of a model
27
pharmacists in the US have demonstrated statistically significant
improvements in glycaemic control (glycated haemoglobin and fasting blood
glucose) in the intervention groups compared with the control group over
periods ranging from four months to five years [38-43].
Two studies have investigated the role of the community pharmacists with
regards to type 2 diabetes in Australia. The Community Pharmacy Model
Practice Project implemented a diabetes management model in two
community pharmacies in 1996. Over the 12 month study period, 105
patients were enrolled and each received an average of four consultations.
Over a third of patients had problems directly related to their medications
and these were resolved either by the pharmacist, or by referral to a doctor.
Health outcomes were not documented in this project, however, when
surveyed, a majority of patients (87%), reported that the pharmacy diabetes
service had contributed either significantly or very significantly to their
health care [44]. More recently the SugarCare project, completed in 2002 [1],
was able to show a significant improvement in glycaemic control in patients
with type 2 diabetes, as a result of a specialised service for such individuals
delivered by community pharmacists.
The impact of pharmaceutical care provided by a clinical pharmacist, located
in a diabetes outpatient clinic in Western Australia, has recently been
reported. In the first study, no changes in mean HbA1c were detected in
either the intervention or the control group, however, the sample size was
small [45]. A follow-up study investigating this model using a randomized
controlled design showed significant improvements in glycaemic control,
lipid levels and blood pressure in the intervention group (n=101) compared
with the control group (n=100) [46].
Community pharmacists’ role in the continuity of care of Type 2 diabetes: An evaluation of a model
28
1.3.2 Disease state management programs (DSM) for patients with type 2 diabetes
The preferred model for diabetes management has been described as a
partnership between the patient and health care professionals [47]. Disease
State Management (DSM), an approach to patient care that co-ordinates
medical resources for patients across the entire health care delivery
system[48], is more likely to meet the ongoing needs of diabetic patients.
Moreover, the health care professional who has consistently been omitted
from the loop, is the pharmacist, even though the literature provides many
examples of positive health outcomes when pharmacists provide diabetes
state management services in controlled research situations [38-43]. Thus,
models which include the pharmacist in the diabetes team and emphasise
communication between health care professionals in the specialist centre and
the community need to be developed.
Specific activities that pharmacists can offer either in the clinic, or the
community, include the following:
The provision of diabetes self-management education [49-51] and
coaching to assist in empowerment of the patient.
Monitoring and promoting patient adherence with medication and other
components of self-management (e.g., prescription refills).
Monitoring and documenting easily measurable key clinical outcome
measures:
Blood glucose (e.g., MediSense meter).
Blood pressure (The UKPDS [52] clearly showed that the benefits of
intensive treatment of blood pressure are at least as great as the
benefits of intensive treatment of blood glucose).
Body weight and Body Mass Index.
Community pharmacists’ role in the continuity of care of Type 2 diabetes: An evaluation of a model
29
Reminding patients of the importance of regular examinations for the
presence of diabetic complications, e.g., eye and feet examinations [53].
Ensuring the quality and evidence-based use of medications in the
complete management of the patient’s diabetes, including the prevention
of diabetic complications (examples include the avoidance of metformin
in patients at increased risk of lactic acidosis [54, 55]; use of short-acting
oral hypoglycaemic agents in the elderly [55]; use of lipid-lowering
drugs, aspirin and angiotensin-converting enzyme [ACE] inhibitors
when appropriate; introduction of insulin therapy when appropriate to
improve glycaemic control).
1.3.3 Study rationale Given the untapped potential of the pharmacist to play a significant role in
diabetes care, both in specialist centres and the community, and the great need
to improve communication between health care providers, including specialist
staff in the diabetes clinics, general practitioners and pharmacists, a project was
designed to develop and evaluate an integrated continuity of care model for
type 2 diabetes. In this model a specialist pharmacist would deliver medication
management services in the clinic setting, while the community pharmacy
would focus on on-going monitoring, education and support of the patient with
type 2 diabetes.
Community pharmacists’ role in the continuity of care of Type 2 diabetes: An evaluation of a model
30
METHODS
1. Steering committee Once the Community Pharmacy Practice Research grant entitled “An
integrated model for disease state management (DSM) in diabetes:
Collaboration of the community pharmacist and GP in continuity of care”
had been secured and the appropriate research ethics clearances had been
obtained, a Steering Committee was established. This consisted of ten
members (see Appendix 1 for a bibliography of the Steering Committee
members). After the Steering Committee had approved the commencement
of the study, and their suggestions to improve the study protocol had been
considered, recruitment of the clinical pharmacists, community pharmacists,
and patients with type 2 diabetes commenced immediately.
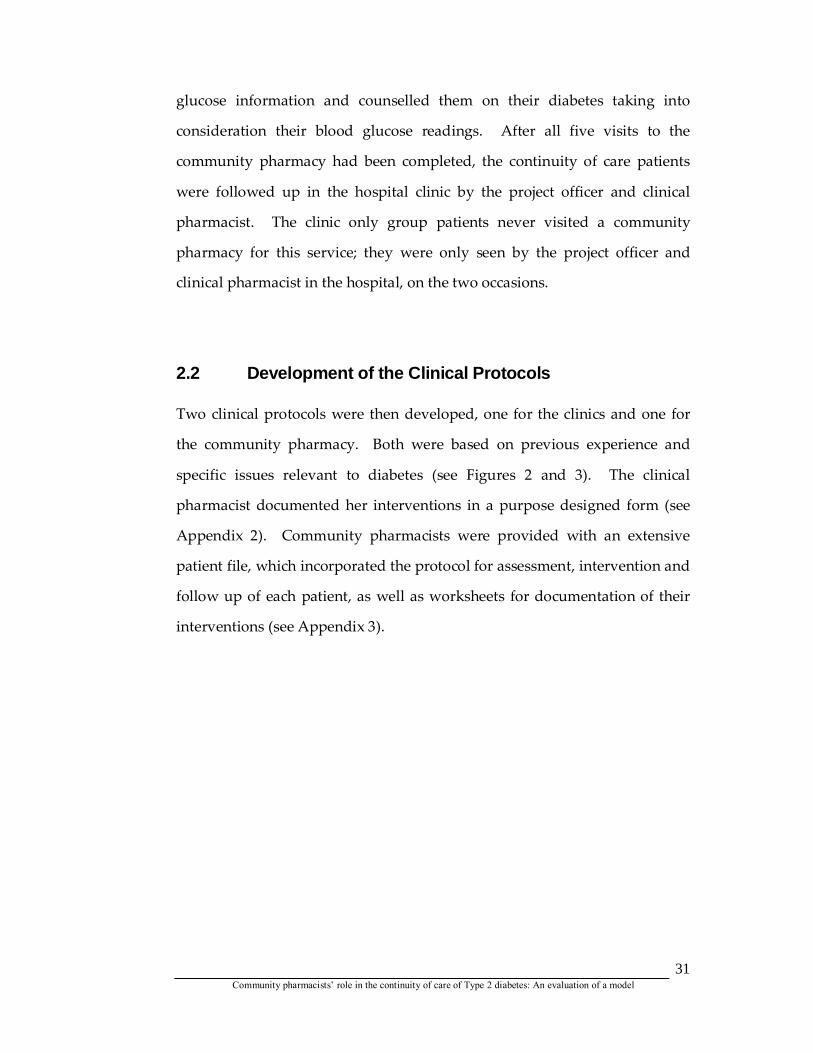
2.1 Brief outline of the study protocol As can be seen in Figure 1, the study utilised a repeated measures design.
Patients had parameters measured in a hospital clinic before and after the
research intervention (Clinic Visit 1, Clinic Visit 2). Some of the patients
became part of a “continuity of care” group, whereas others joined the “clinic
only” group. The continuity of care group patients, after seeing the Project
Officer and the clinical pharmacist in the Hospital, visited a community
pharmacist five times. There they were given a MediSense blood glucose
meter, shown how to use it, and then at home they took blood glucose
measurements. The patients returned to the pharmacy on four further
occasions. While there, the community pharmacist downloaded their blood
Community pharmacists’ role in the continuity of care of Type 2 diabetes: An evaluation of a model
31
glucose information and counselled them on their diabetes taking into
consideration their blood glucose readings. After all five visits to the
community pharmacy had been completed, the continuity of care patients
were followed up in the hospital clinic by the project officer and clinical
pharmacist. The clinic only group patients never visited a community
pharmacy for this service; they were only seen by the project officer and
clinical pharmacist in the hospital, on the two occasions.
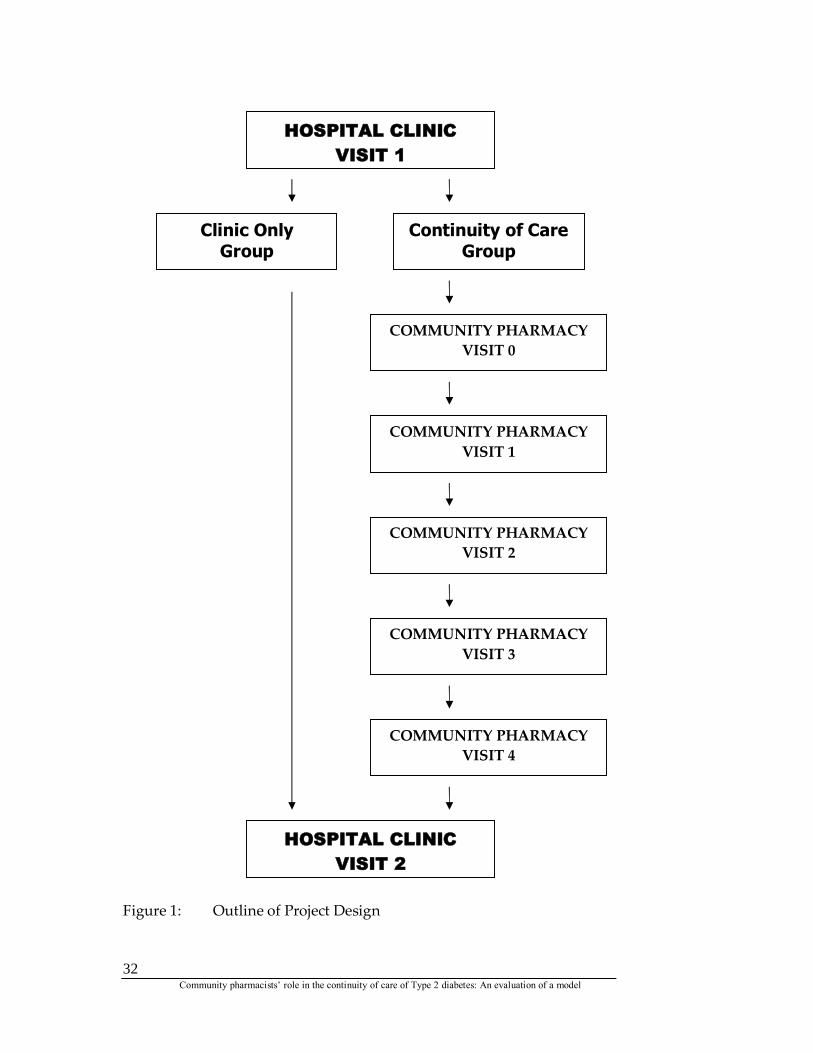
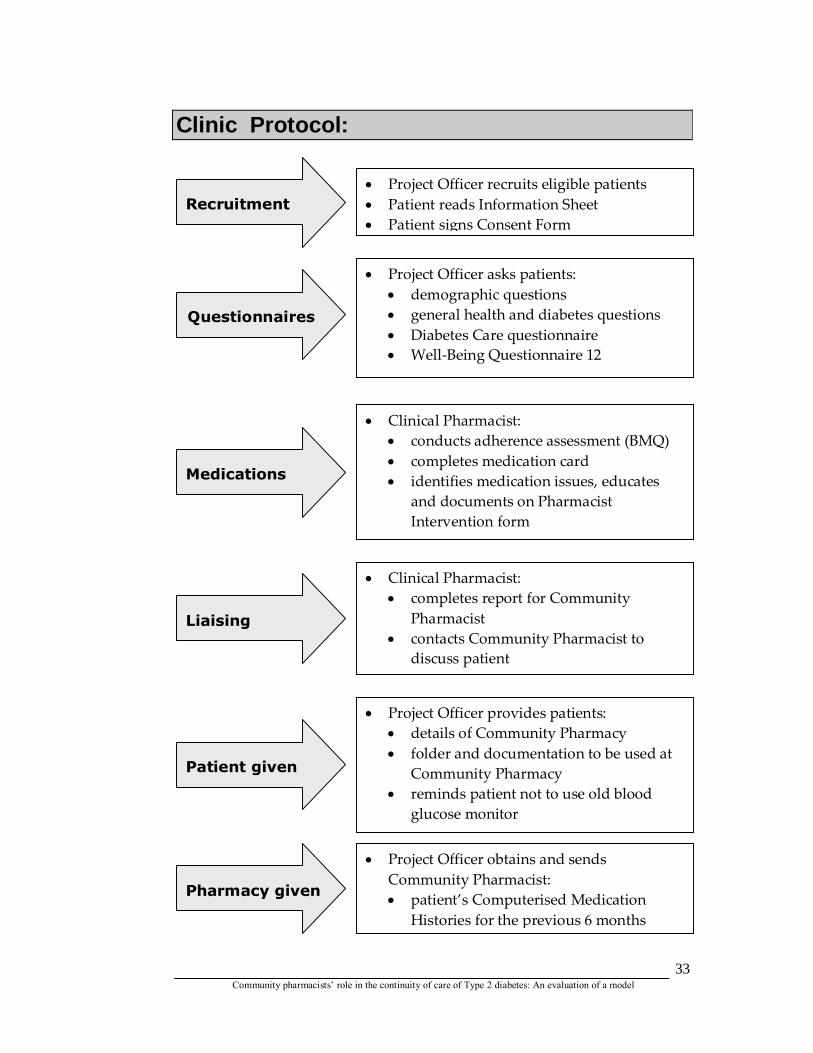
2.2 Development of the Clinical Protocols Two clinical protocols were then developed, one for the clinics and one for
the community pharmacy. Both were based on previous experience and
specific issues relevant to diabetes (see Figures 2 and 3). The clinical
pharmacist documented her interventions in a purpose designed form (see
Appendix 2). Community pharmacists were provided with an extensive
patient file, which incorporated the protocol for assessment, intervention and
follow up of each patient, as well as worksheets for documentation of their
interventions (see Appendix 3).
Community pharmacists’ role in the continuity of care of Type 2 diabetes: An evaluation of a model
32
Figure 1: Outline of Project Design
HOSPITAL CLINIC VISIT 1
HOSPITAL CLINIC VISIT 2
COMMUNITY PHARMACY VISIT 0
COMMUNITY PHARMACY VISIT 1
COMMUNITY PHARMACY VISIT 2
COMMUNITY PHARMACY VISIT 3
COMMUNITY PHARMACY VISIT 4
Continuity of Care Group
Clinic Only Group
Community pharmacists’ role in the continuity of care of Type 2 diabetes: An evaluation of a model
33
Clinic Protocol:
Project Officer recruits eligible patients Patient reads Information Sheet Patient signs Consent Form
Project Officer asks patients: demographic questions general health and diabetes questions Diabetes Care questionnaire Well-Being Questionnaire 12
Clinical Pharmacist: conducts adherence assessment (BMQ) completes medication card identifies medication issues, educates
and documents on Pharmacist Intervention form
Clinical Pharmacist: completes report for Community
Pharmacist contacts Community Pharmacist to
discuss patient
Medications
Project Officer provides patients: details of Community Pharmacy folder and documentation to be used at
Community Pharmacy reminds patient not to use old blood
glucose monitor
Patient given
Recruitment
Questionnaires
Liaising
Project Officer obtains and sends Community Pharmacist: patient’s Computerised Medication
Histories for the previous 6 months
Pharmacy given
Community pharmacists’ role in the continuity of care of Type 2 diabetes: An evaluation of a model
34
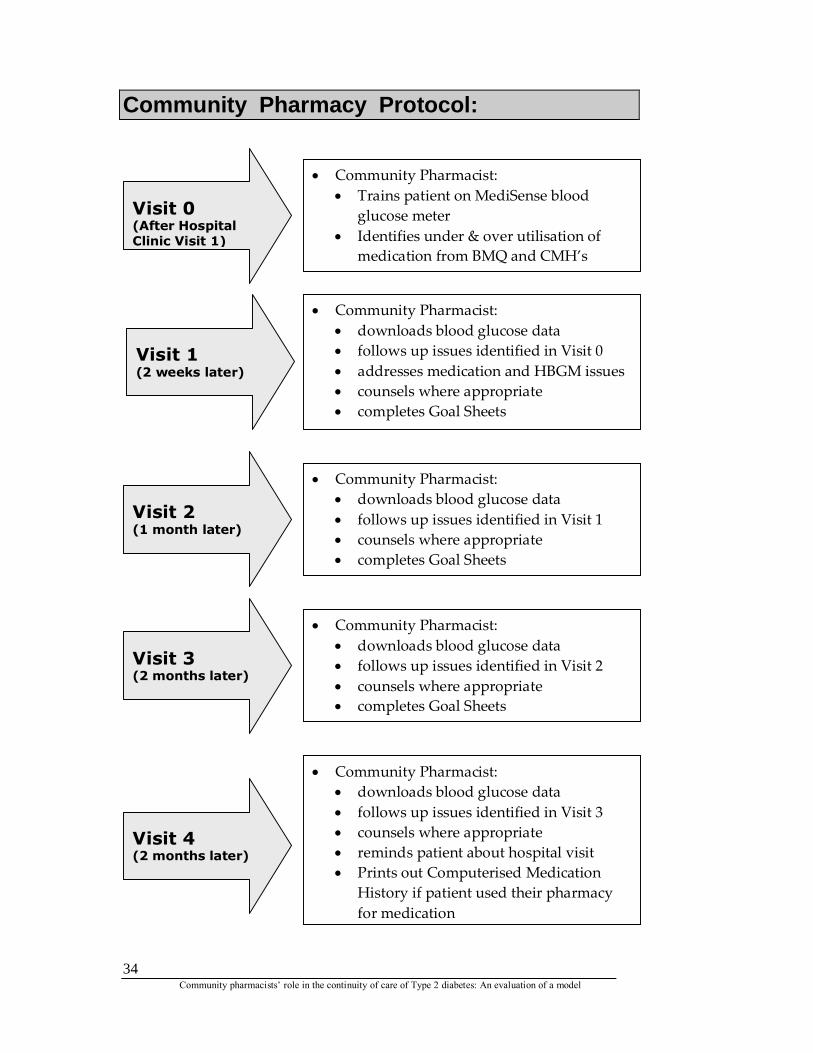
Community Pharmacy Protocol:
Community Pharmacist: Trains patient on MediSense blood
glucose meter Identifies under & over utilisation of
medication from BMQ and CMH’s
Community Pharmacist: downloads blood glucose data follows up issues identified in Visit 0 addresses medication and HBGM issues counsels where appropriate completes Goal Sheets
Community Pharmacist: downloads blood glucose data follows up issues identified in Visit 1 counsels where appropriate completes Goal Sheets
Community Pharmacist: downloads blood glucose data follows up issues identified in Visit 2 counsels where appropriate completes Goal Sheets
Community Pharmacist: downloads blood glucose data follows up issues identified in Visit 3 counsels where appropriate reminds patient about hospital visit Prints out Computerised Medication
History if patient used their pharmacy for medication
Visit 4 (2 months later)
Visit 3 (2 months later)
Visit 2 (1 month later)
Visit 1 (2 weeks later)
Visit 0 (After Hospital Clinic Visit 1)
Community pharmacists’ role in the continuity of care of Type 2 diabetes: An evaluation of a model
35
3. Recruitment of the clinical pharmacist The Clinical Pharmacist working in the Diabetes Outpatient’s section of St.
Vincent’s Hospital, half a day a week, agreed to participate in this study. She
also agreed to work in the Diabetes Centre at the Prince of Wales Hospital for
another half day a week.
4.1 Recruitment of the community pharmacists: Initial recruitment
Community pharmacists in the catchment areas for both St. Vincent’s
Hospital and Prince of Wales Hospital (East Sydney) were written to offering
them the opportunity to attend an information evening concerning
participating in the diabetes study. Of all the community pharmacists who
attended, 20 pharmacists from 14 pharmacies eventually agreed to
participate.
4.2 Recruitment of the community pharmacists: Second recruitment
Once recruitment of the patients with type 2 diabetes had commenced, a
second recruitment drive was made for additional community pharmacists
to be involved in the study. Emphasis was placed on obtaining community
pharmacists in geographical locations that were not already covered by the
initial 14 pharmacies. An additional six pharmacies agreed to participate in
the study. Thus in total, 20 community pharmacies were recruited for the
study.
Community pharmacists’ role in the continuity of care of Type 2 diabetes: An evaluation of a model
36
4.3 Location of the community pharmacists The community pharmacies were located in 20 suburbs: Bellevue Hill, Bondi,
Bondi Junction, Botany, Coogee, Darlinghurst, Kingsford, Malabar,
Maroubra, Matraville, North Bondi, Redfern, Rosebery, South Maroubra,
Surry Hills, Vaucluse, Waterloo, Waverley, Woollahra, and Woolloomooloo.
For a number of these pharmacies, more than one pharmacist was involved
in the study. All up, 29 community pharmacists participated in the study.
4.4 Training of community pharmacists: Workshop All the community pharmacists who were initially recruited and who agreed
to participate in the study attended a two-day workshop. The aim of the
workshop was two-fold: to provide the community pharmacists with the
most up to date information on the various aspects of diabetes, and to train
the community pharmacists so that they could perform their role in the study
accurately and appropriately. The names of the presenters in the workshop
can be seen in Appendix 4 and an outline of the workshop timetable can be
seen in Appendix 5. A second workshop was held approximately three
months later for the second group of community pharmacists recruited. The
training for the second group of community pharmacists was essentially the
same.
As part of the workshop, an education manual was provided for each of the
community pharmacists. This manual was a substantially revised version of
an initial manual used by the researchers in an early research study [1]. The
manual consisted of 12 units, divided into 2 modules. Appendix 6 lists the
names of the units presented in the manual. During the workshop, case
material was reviewed, role plays undertaken, and group discussions held.
Community pharmacists’ role in the continuity of care of Type 2 diabetes: An evaluation of a model
37
4.5 Training of community pharmacists: MediSense meters and computer software
As one of the tasks that the community pharmacists had to perform, was to
teach patients involved in the study how to use a MediSense blood glucose
meter, the community pharmacists were therefore trained to a proficient
level. This training was conducted during the workshop by the MediSense
Products representative. On subsequent dates the representative travelled to
each individual pharmacy, downloaded the computer software onto the
pharmacists’ computers and trained them how to use it. Unfortunately, the
computers being used by three of the community pharmacies were either too
old, too modern, or did not have sufficient ports. Thus, these community
pharmacies were not able to take any further part in the study.
4.6 Communication with the community pharmacists To ensure that the community pharmacists were kept informed of the latest
developments of the study, a newsletter was sent out periodically. Three such
newsletters were created in total. Similarly, the Project Officer visited all the
community pharmacies on a regular basis.
5.1 Patient recruitment via hospitals Patients with type 2 diabetes and using an antidiabetic medication, who were
waiting to see a registrar, endocrinologist, podiatrist, dietitian, or nurse
educator at the Diabetes Centre of Prince of Wales Hospital, were
approached individually by the Project Officer. Aspects of the study were
discussed and then the patients were asked if they would like to participate.
The same procedure was used in the diabetes outpatients section of St.
Vincent’s Hospital, with patients waiting to see a doctor, or nurse educator.
Community pharmacists’ role in the continuity of care of Type 2 diabetes: An evaluation of a model
38
5.2 Patient recruitment via community pharmacies As a way of obtaining additional numbers of patients, some of the
community pharmacists already involved in the study were approached and
asked if they would be interested to recruit patients into the study and
complete the tasks that normally would be completed by the clinical
pharmacist and Project Officer (at both pre and post hospital visits). Several
community pharmacists said that they were interested. Some even had
patients lined up to begin the program.
5.2.1 Training of Community Pharmacists to undertake patient recruitment
The pharmacists from four community pharmacies who decide that they
were interested in participating in this aspect of the study completed a two-
hour workshop held by two of the researchers. They were taught all the
tasks that were completed by the Project Officer and Clinical Pharmacist, to
ensure that the service would be as similar as possible to that delivered in the
hospital. Biological and pathological data was obtained with the help of the
patients own general practitioners, whose support was sought by both the
Project Officer and the Community Pharmacist.
6.1 Clinic Visit 1 Patients agreeing to participate in the study were initially randomly assigned
to either the continuity of care or clinic only groups by the Project Officer.
However, it quickly became clear that a large percentage of patients were not
willing to visit a community pharmacy that was not their own. Other
reasons given why the patients were willing to be in the clinic only group,
but not the continuity of care group included: five visits in a six month
period were seen as too much to ask, transportation difficulties, current
Community pharmacists’ role in the continuity of care of Type 2 diabetes: An evaluation of a model
39
medical problems, going overseas, family difficulties, and time issues. Some
patients were deemed incapable of being in the continuity of care group, as
they required an interpreter or relative/friend to accompany them. Hence,
after the initial two months of patient recruitment, a different strategy was
employed. Patients were given the opportunity to go in either group.
During the first clinic visit, patients agreeing to participate in the study were
asked to sign a consent form. Having completed this, they were asked to
respond to a clinic questionnaire (see Appendix 7), the Diabetes Care Profile
(DCP) [56], and the Well-Being Questionnaire 12 (W-BQ 12) [57]. The
properties of these questionnaires are presented below (see Section 6.3:
Questionnaire properties).
During their visit to the hospital, the patients had their height, weight, blood
pressure and HbA1c assessed. This was usually conducted before the patient
saw the health professional they had originally come to see, the clinical
pharmacist, and the project officer. Hospital patient notes and hospital
computer databases were utilised to locate recent triglyceride, total
cholesterol and HDL cholesterol values.
After the Project Officer had completed asking all the demographic and
psychological questions, the Clinical Pharmacist completed a thorough
medication review. Answers regarding medication adherence were filled out
using the Brief Medication Questionnaire (BMQ) [58].
Community pharmacists’ role in the continuity of care of Type 2 diabetes: An evaluation of a model
40
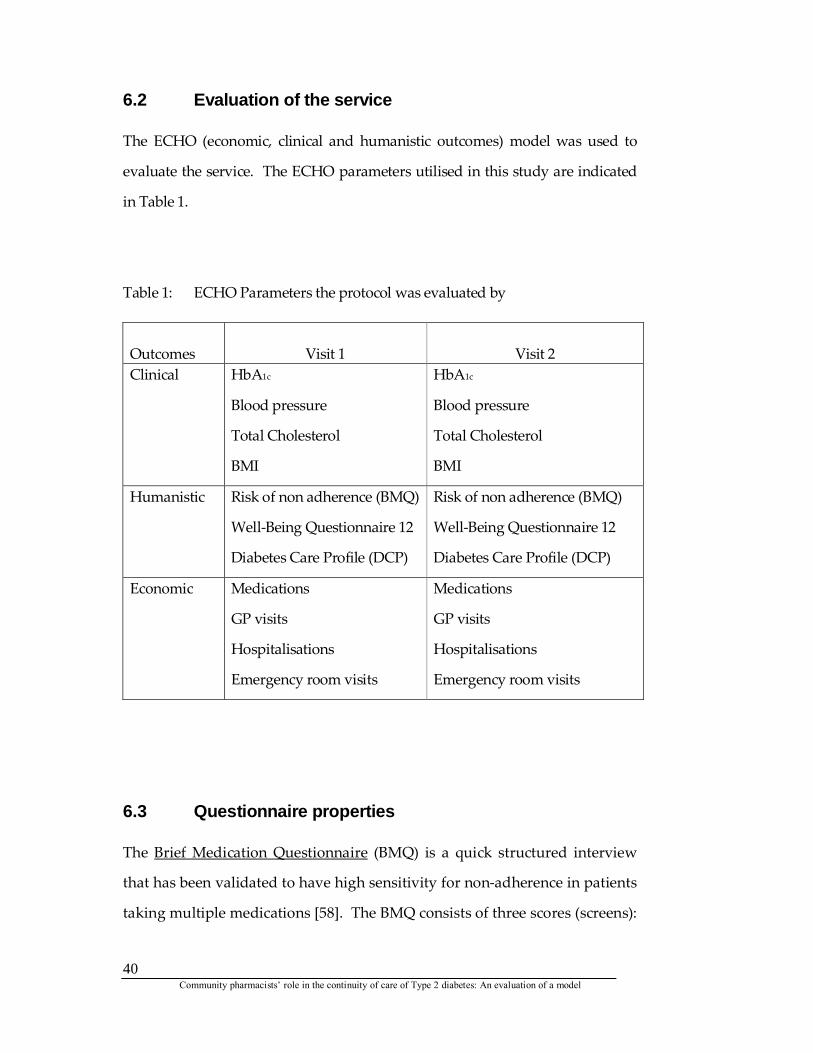
6.2 Evaluation of the service The ECHO (economic, clinical and humanistic outcomes) model was used to
evaluate the service. The ECHO parameters utilised in this study are indicated
in Table 1.
Table 1: ECHO Parameters the protocol was evaluated by
Outcomes
Visit 1
Visit 2
Clinical HbA1c
Blood pressure
Total Cholesterol
BMI
HbA1c
Blood pressure
Total Cholesterol
BMI
Humanistic Risk of non adherence (BMQ)
Well-Being Questionnaire 12
Diabetes Care Profile (DCP)
Risk of non adherence (BMQ)
Well-Being Questionnaire 12
Diabetes Care Profile (DCP)
Economic Medications
GP visits
Hospitalisations
Emergency room visits
Medications
GP visits
Hospitalisations
Emergency room visits
6.3 Questionnaire properties The Brief Medication Questionnaire (BMQ) is a quick structured interview
that has been validated to have high sensitivity for non-adherence in patients
taking multiple medications [58]. The BMQ consists of three scores (screens):
Community pharmacists’ role in the continuity of care of Type 2 diabetes: An evaluation of a model
41
a regimen screen, belief screen, and recall screen. In all screens, a higher
score indicates poorer adherence.
The Well-Being Questionnaire 12 (W-BQ 12), is a validated 12-item
instrument [57]. It consists of three four-item subscales: Negative Well-
Being, Energy, and Positive Well-being. Each item is scored on a scale from 0
(“not at all’) to 3 (“all the time”). Following recoding of the negatively
worded items, a Total Well-Being score may also be computed by summing
the individual item scores, yielding a total score ranging between 0 to 36.
The higher the score, the greater the individual’s well being.
The Diabetes Care Profile (DCP) is a validated instrument which assesses the
social and psychological factors related to diabetes and its treatment [56]. It
comprises 14 subscales. Seven selected scales which represent important
facets of patient adjustment to diabetes used in this study were included:
control problems (5 items), positive attitude (5 items), negative attitude (6
items), self care ability (4 items), diet adherence (4 items), exercise barriers (5
items) and understanding long term management (12 items). Each item is
scored from “1” to “5”. Scale score are computed by summing the individual
item scores. Higher scores indicate a greater presence of the characteristic.
Community pharmacists’ role in the continuity of care of Type 2 diabetes: An evaluation of a model
42
6.4 Clinic Visit 2 Patients were seen in the hospital clinics as close to six months after the
initial visit, where at all possible. Often patients had bookings to see the
various health care professionals more than six months apart. In this case,
the Project Officer encouraged patients to make a booking just to see the
clinical pharmacist and himself. Most patients were willing to do this.
The patients were asked most of the demographic questions as in Hospital
Clinic Visit 1. They were also asked the WBQ-12 and most of the questions
of the sections used in the DCP. The clinical pharmacist completed the BMQ
again.
Any questions the patients had were answered and they were thanked for
their participation.
7. Continuity of care visits to the community pharmacists The continuity of care group patients, after seeing the project officer and the
clinical pharmacist in the hospital, were referred to a community pharmacist.
The clinical pharmacist wrote a patient report summarising her findings and
recommendations following assessment of the patient in the clinic and sent a
copy to the community pharmacist and the patient’s GP. Whilst it was
initially envisaged that case conferencing would be used to achieve
continuity of care, in practice this proved too difficult to implement. Thus
the written report was used to communicate issues requiring the attention of
the pharmacist and GP.
Community pharmacists’ role in the continuity of care of Type 2 diabetes: An evaluation of a model
43
The patient subsequently completed five visits in the community pharmacy.
On the first visit (Visit 0), they were given a MediSense blood glucose meter1,
shown how to use it, and then asked to take measurements at least daily,
preferably at different times. They handed over their own blood glucose
meters to the community pharmacists until the end of the study, so that they
were not tempted to use a machine other than the MediSense blood glucose
meter. It was crucial that the patients used the MediSense meter, as at the
subsequent four visits, the patients’ blood glucose measurements were
downloaded onto the community pharmacists’ computers.
During the final four visits (Visit 1, Visit 2, Visit 3, Visit 4) to the community
pharmacists, the patients received counselling regarding their diabetes,
taking into consideration their blood glucose readings. Typical topics
discussed included exercise, diet, stress management, and issues relating to
their medication. The pharmacists also provided adherence support,
discussed potential or actual adverse drug effects, and prompted for medical
checks. Goals were also set between visits and documented on a worksheet
(see Appendix 8).
Where possible, the duration between Visit 0 and Visit 1 was 2 weeks,
between Visit 1 and Visit 2 it was 1 month, between Visit 2 and Visit 3 it was
2 months, and between Visit 3 and Visit 4 it was 2 months. So ideally the five
visits to the community pharmacists could be completed in slightly less than
six months.
1 Due to the generosity of Abbott Diagnostics, the patients were able to keep the MediSense blood glucose meters following the completion of the study.
Community pharmacists’ role in the continuity of care of Type 2 diabetes: An evaluation of a model
44
SAMPLE
1. Initial sample 118 patients were recruited from the outpatient service at St. Vincent’s Public
Hospital (n=66), the Diabetes Centre at Prince of Wales Public Hospital
(n=48) and one community pharmacy in East Sydney (n=4). This group
consisted of 79 ‘clinic only’ patients and 39 ‘continuity of care’ patients (clinic
and community pharmacy interactions).2 These 74 males and 44 females had
a mean age of 64.17 + 10.02. The patients were born in a total of 39 different
countries. The most common origin was Australia (44.1%), followed by
Egypt (5.9%), England (4.2%), Hungary (4.2%), and Greece (3.4%). The
number of years that they had been diagnosed with having diabetes varied
substantially; the mean number of years was 11.5 + 7.81 (minimum = less
than 1 year; maximum = 34 years). The majority were retired (54.2%), while
an additional 11.0% were unable to work due to illness; only 15.3% of the
patients worked full-time. The majority were on pensions (61.0%), of which
most were on age (39.8%), invalid (6.8%), or disability (5.1%) pensions.
Likewise, the majority had concession cards (69.5%). A large proportion
lived alone (37.3%), while an equally large proportion lived with either a
spouse/partner and/or a daughter/son (54.2%).
2 The usual terminology of control and intervention groups has not been employed in this study, as there was no true control group since randomisation was not possible. Instead, the terms ‘clinic only’ patients and ‘continuity of care’ patients has been employed.
Community pharmacists’ role in the continuity of care of Type 2 diabetes: An evaluation of a model
45
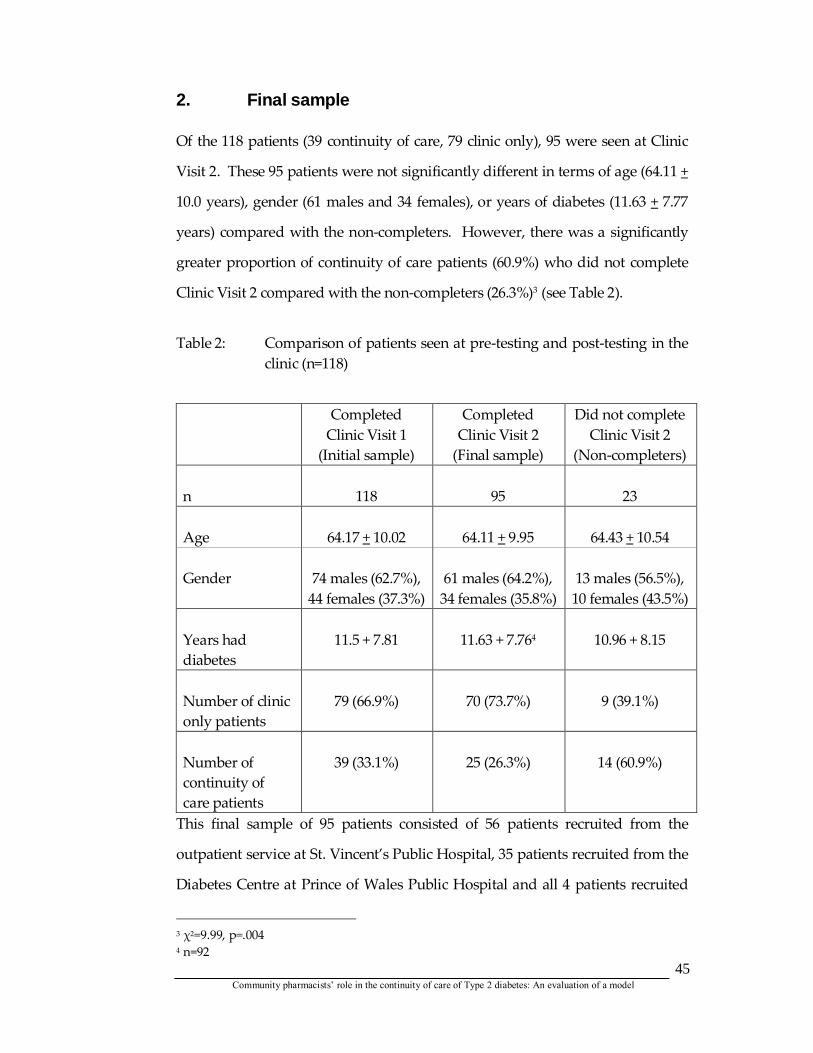
2. Final sample Of the 118 patients (39 continuity of care, 79 clinic only), 95 were seen at Clinic
Visit 2. These 95 patients were not significantly different in terms of age (64.11 +
10.0 years), gender (61 males and 34 females), or years of diabetes (11.63 + 7.77
years) compared with the non-completers. However, there was a significantly
greater proportion of continuity of care patients (60.9%) who did not complete
Clinic Visit 2 compared with the non-completers (26.3%)3 (see Table 2).
Table 2: Comparison of patients seen at pre-testing and post-testing in the
clinic (n=118)
Completed Clinic Visit 1
(Initial sample)
Completed Clinic Visit 2
(Final sample)
Did not complete Clinic Visit 2
(Non-completers) n
118
95
23
Age
64.17 + 10.02
64.11 + 9.95
64.43 + 10.54
Gender
74 males (62.7%),
44 females (37.3%)
61 males (64.2%),
34 females (35.8%)
13 males (56.5%),
10 females (43.5%) Years had diabetes
11.5 + 7.81
11.63 + 7.764
10.96 + 8.15
Number of clinic only patients
79 (66.9%)
70 (73.7%)
9 (39.1%)
Number of continuity of care patients
39 (33.1%)
25 (26.3%)
14 (60.9%)
This final sample of 95 patients consisted of 56 patients recruited from the
outpatient service at St. Vincent’s Public Hospital, 35 patients recruited from the
Diabetes Centre at Prince of Wales Public Hospital and all 4 patients recruited
3 χ2=9.99, p=.004 4 n=92
Community pharmacists’ role in the continuity of care of Type 2 diabetes: An evaluation of a model
46
from one community pharmacy in East Sydney. The 61 males and 34 females
(mean age of 64.11 + 9.95), were born in 33 countries; the most common origin
was Australia (47.4%), followed by Egypt (5.3%) and England (5.3%). The
number of years that they had been diagnosed with having diabetes varied
substantially; the mean number of years was 11.63 + 7.76 (minimum = less than 1
year; maximum = 30 years). The majority were retired (53.7%), while an
additional 11.6% were unable to work due to illness; only 13.7% of the patients
worked full-time. The majority were on pensions (62.1%), of which most were
on age (38.9%), invalid (7.4%), or disability (6.3%) pensions. Likewise, the
majority had concession cards (71.6%). A large proportion lived alone (41.1%),
while an equally large proportion lived with either a spouse/partner and/or a
daughter/son (54.8%).
3. Non-completers With regard to the 39 continuity of care patients seen at Visit 1 (and who had
a community pharmacist organised to see them), 13 did not complete all the
counselling sessions at their community pharmacy. An additional one
continuity of care patient, although he did complete all the community
pharmacy visits, was not seen in the hospital at Visit 25. His community
pharmacy data is thus not presented in this study. Hence, the results of 25
intervention patients are examined in this study (see Table 3).
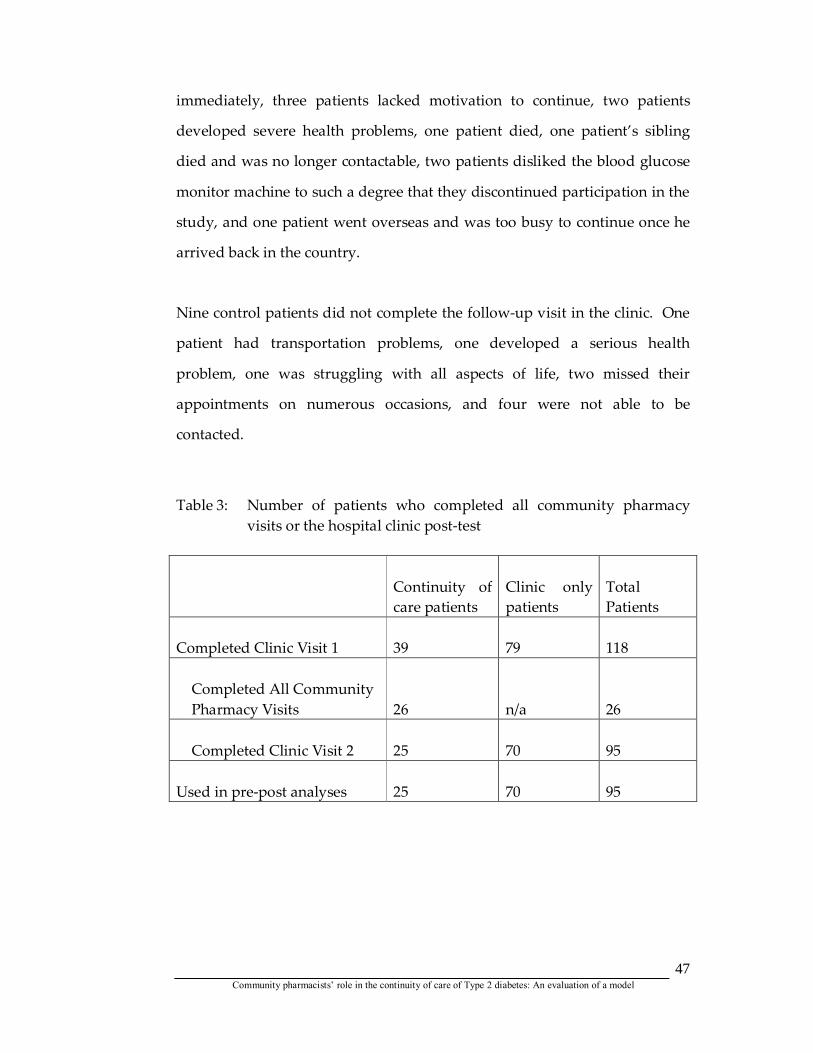
There was a multitude of reasons why the 13 intervention patients pulled out
of the study. One community pharmacist lacked the motivation to continue,
one community pharmacist had severe health problems and had to
discontinue, one patient changed his mind about participating in the study
5 This patient was not contactable as he moved house (it is believed inter-state). He left no forwarding address with the real estate company and his details were not present on the hospital records or databases.
Community pharmacists’ role in the continuity of care of Type 2 diabetes: An evaluation of a model
47
immediately, three patients lacked motivation to continue, two patients
developed severe health problems, one patient died, one patient’s sibling
died and was no longer contactable, two patients disliked the blood glucose
monitor machine to such a degree that they discontinued participation in the
study, and one patient went overseas and was too busy to continue once he
arrived back in the country.
Nine control patients did not complete the follow-up visit in the clinic. One
patient had transportation problems, one developed a serious health
problem, one was struggling with all aspects of life, two missed their
appointments on numerous occasions, and four were not able to be
contacted.
Table 3: Number of patients who completed all community pharmacy
visits or the hospital clinic post-test
Continuity of care patients
Clinic only patients
Total Patients
Completed Clinic Visit 1
39
79
118
Completed All Community Pharmacy Visits
26
n/a
26
Completed Clinic Visit 2
25
70
95
Used in pre-post analyses
25
70
95
Community pharmacists’ role in the continuity of care of Type 2 diabetes: An evaluation of a model
48
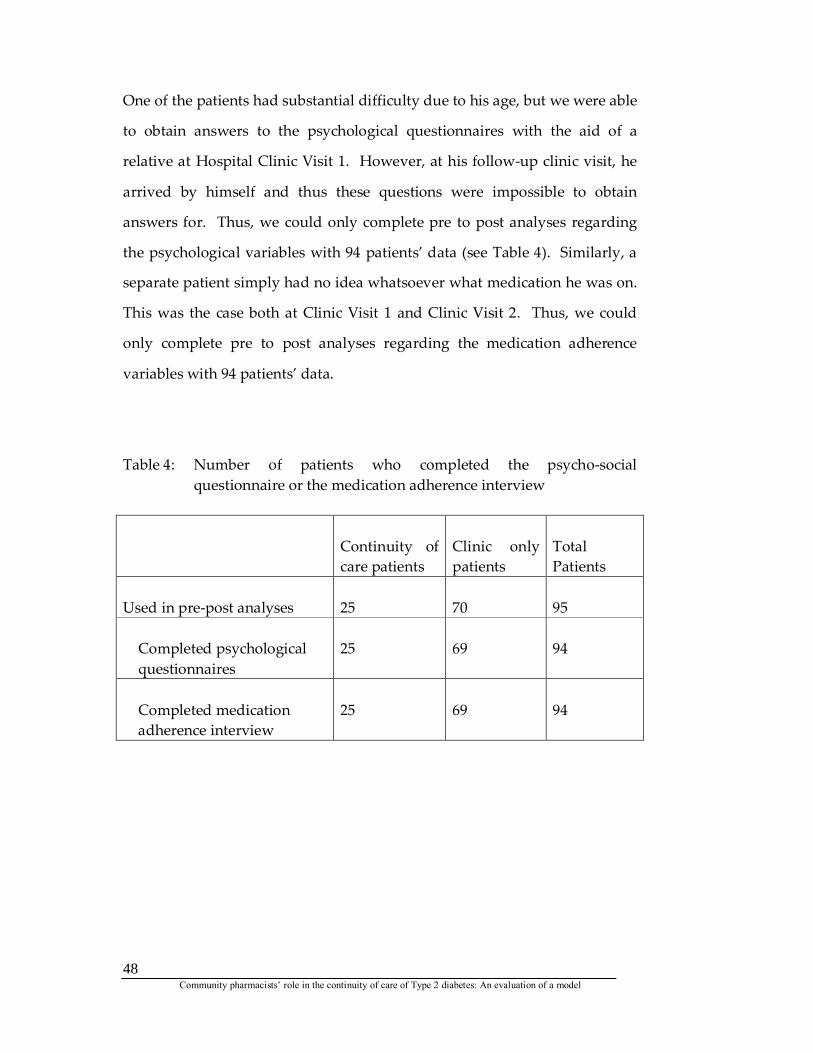
One of the patients had substantial difficulty due to his age, but we were able
to obtain answers to the psychological questionnaires with the aid of a
relative at Hospital Clinic Visit 1. However, at his follow-up clinic visit, he
arrived by himself and thus these questions were impossible to obtain
answers for. Thus, we could only complete pre to post analyses regarding
the psychological variables with 94 patients’ data (see Table 4). Similarly, a
separate patient simply had no idea whatsoever what medication he was on.
This was the case both at Clinic Visit 1 and Clinic Visit 2. Thus, we could
only complete pre to post analyses regarding the medication adherence
variables with 94 patients’ data.
Table 4: Number of patients who completed the psycho-social questionnaire or the medication adherence interview
Continuity of care patients
Clinic only patients
Total Patients
Used in pre-post analyses
25
70
95
Completed psychological questionnaires
25
69
94
Completed medication adherence interview
25
69
94
Community pharmacists’ role in the continuity of care of Type 2 diabetes: An evaluation of a model
49
4. Historical control The St. Vincent’s hospital diabetes outpatient clinic served as a control site in
a previous research study (Sugar Care project) [1]. At this site, there was no
pharmacy service delivered to patients. Following consultation with the
director, one of the research team members attended the clinic once a week
between December 2000 and February 2001 and recruited 45 patients for the
study directly. Clinical, humanistic and economic data were collected at
baseline and 9 months later (between August and October, 2001). At follow-
up, data was available for 32 of these patients. Thus, this cohort of patients
was used in this study, as a historical control for comparing management of
diabetes (i.e., comparisons of mean HbA1c; proportion reaching target HbA1c)
in the absence of a pharmacist’s service.
Community pharmacists’ role in the continuity of care of Type 2 diabetes: An evaluation of a model
50
DATA ANALYSIS
1. Analysis at baseline assessment General demographic and diabetes-related data were firstly compared
between final sample (after dropouts) and the non-completers. Then a
comparison was made between the continuity of care and clinic only groups.
The aim of these analyses was to establish baseline comparability of subjects
in each group.
Frequency tabulations were conducted to examine the distribution of
demographics including diabetes history and medication use at baseline.
The Pearson chi-square test was used to compare the difference in
proportions of specific characteristics, such as type of diabetes management
between the final sample and non-completers, and between continuity of
care and clinic only groups. For normally distributed variables, the Students
t-test for independent samples was used for between group comparisons.
For non-normally distributed variables we used the Mann Whitney U test to
test for differences in medians between groups.
2. Evaluation of the service The analysis considered only the evaluable group ie patients who completed
the study. General linear model repeated measures (MANOVA) was used to
test for a linear trend in mean blood glucose over four follow-up visits.
Analysis of Co-Variance (ANCOVA) was used to test for differences in
effects of the two clinic recruitment sites on HbA1c, systolic and diastolic
blood pressure, BMI and total well-being scores at Clinic Visit 2 after
Community pharmacists’ role in the continuity of care of Type 2 diabetes: An evaluation of a model
51
controlling for baseline levels. No significant differences were found, hence
data were then pooled for the two clinics. A Student’s t-test for paired
samples was used to compare mean values at baseline and follow-up in
continuity of care and clinic only groups and repeated measures MANOVA
tested for differences between the two groups. The Wilcoxon Signed Ranks
test compared median values at baseline and follow-up in continuity of care
and clinic only groups and the magnitude of the difference was then
compared between the 2 groups using the Mann-Whitney U test for
independent samples.
McNemar’s test was used to examine the change in proportions of those with
elevated HbA1c at baseline and follow-up in the continuity of care and clinic
only groups and a historical control group. The level of significance for all
tests was set at p < 0.05.
Logistic regression was used to examine the impact of the continuity of care
service versus clinic only service on the likelihood of reaching target HbA1c
levels at Clinic Visit 2. This allowed for the control of baseline HbA1c and
other potential confounders, such as severity of diabetes using the number of
complications as an indicator and hence a more accurate evaluation of the
impact of the continuity of care model.
Community pharmacists’ role in the continuity of care of Type 2 diabetes: An evaluation of a model
52
ECONOMIC ANALYSIS: METHODS 1. Economic analysis This economic evaluation was conducted from the perspective of the health
care sector generally and as such, it took into account costs to both the
Commonwealth Government and the State Government. Outcomes
measured included General Practitioner and specialist visits and medication
usage (Commonwealth Government), as well as hospitalisations (State
Government).
A cost effectiveness study was conducted. This was thought to be the most
appropriate method because a difference in outcome between the continuity
of care and clinic only groups was expected and a measure of effectiveness in
terms of a change in HbA1c was possible. Although HbA1c is considered to be
an intermediate outcome, rather than a final outcome, enhanced control of
blood glucose via reduction in HbA1c has been correlated with a reduction in
complications due to diabetes and diabetes related death [35].
2. Costs included in the analysis Only direct medical costs, which would be incurred by either the
Commonwealth or State Governments, were considered. The cost of
providing the service, the health care resources used in relation to the
patients’ diabetes, such as GP visits, hospitalisations and emergency
department visits and the cost of all medications were considered. In
addition, the cost of training the pharmacists to deliver the specialised
service was included, because it represented time that could otherwise have
been used by them. All costs were expressed in 2003 Australian dollars.
Community pharmacists’ role in the continuity of care of Type 2 diabetes: An evaluation of a model
53
3. Costs not included in the analysis Direct non-medical costs, such as transport costs for the patient, were not
included and indirect costs such as lost productivity, were also not taken into
account. This is because of the perspective chosen for the study [59].
Blood glucose meters and associated software were provided free by the
manufacturer for the project and even if this arrangement did not extend to
all patients in the future, patients would be expected by the government to
purchase their own meter. Other costs, relating to the service, which were
considered, but not included, were those relating to the initial setting up of
the service in terms of space and furniture etc. These were excluded because
the government would expect the pharmacist to cover these costs.
4. The cost of providing the continuity of care service The following sections detail the actual costs incurred for delivering the
service.
4.1 Cost of clinical pharmacist’s time in the hospital clinic The time spent by the pharmacist with each patient in the clinic was
recorded, totalled and averaged over all patients to give an average time in
hours per patient per service. This was multiplied by $40, the hourly rate
paid to the pharmacist, to obtain the cost of the service provided by the
pharmacist per patient.
Community pharmacists’ role in the continuity of care of Type 2 diabetes: An evaluation of a model
54
4.2 Cost of pharmacists’ time in the community pharmacy The costs associated with the provision of the service included only those for
which the government would be expected to pay if pharmacists were to be
reimbursed by the government for the service. These included:
Total time the pharmacist spent in providing the service. This value
included initial and follow up visits.
Cost of print outs of blood sugar levels given to patients at each visit.
Cost and time taken with telephone calls.
In order to arrive at these values, each of the pharmacists were asked to
estimate the average time, in minutes, that they spent on the first visit in the
community pharmacy and for the follow up visits. These average times were
then added together and divided by 60 to give an average time in hours
spent, then multiplied by $40 (the average award rate of an experienced
practicing community pharmacist – Pharmacy Guild of Australia) to give the
cost of pharmacist time spent providing the service per patient.
Each patient received three printouts relating to blood sugar level per visit.
It was assumed that each print out would cost $0.25. Telephone calls were
made by the pharmacists to set up visits with patients and to call GPs about
particular patients. Each call was priced at $0.16 per local call (Business
LineTM Plus, www.telstra.com6) [60]. The average cost of the phone calls
made by a pharmacist per patient per intervention was calculated on the
basis of the data for the community pharmacists. The average cost of phone
calls made by each pharmacist was calculated by dividing the total cost of all
phone calls by the number of patients.
Community pharmacists’ role in the continuity of care of Type 2 diabetes: An evaluation of a model
55
4.3 The cost of health care resources use Health care resource cost included visits to the GP, visits to the emergency
department and hospitalisations. The unit price of GP visits was based on
the Australian Medicare Benefit Schedule fees, Item Number 23, ($30.20 per
visit). The cost of a hospitalisation was based on the Casemix Standards for
NSW (Department of Health) AR-DRG Version 4 [61]. Only hospitalisations
believed to be because of diabetes, or cardiovascular problems, were
included in the analysis. The cost of each admission was calculated on the
average cost of a hospital stay ($2,400) multiplied by a cost weight for each
relevant DRG. Where possible, the DRG assigned by the hospital for the
admission was used. Where this was not possible, because the patient
attended a hospital for which ethics approval was not obtained, an estimate
was made based on the patients’ description of the event. If that description
was incomplete the average cost of a hospitalisation was used ($2,400).
The cost of an emergency department visit was set at $330 and was based on
the average cost per case weighted attendance in NSW Hospitals (NSW
Funding Guidelines for Emergency Department Services, 2002-2003). Where
an emergency department visit led to a hospital admission, the cost was
included in the cost of hospitalization.
The total number of doctor visits, emergency department visits and hospital
stays was calculated for the continuity of care group and the clinic only
group over six months. These were then converted into costs for each group
and divided by the number of patients in each group to give the average cost
per patient.
Community pharmacists’ role in the continuity of care of Type 2 diabetes: An evaluation of a model
56
4.4 The cost of medications The cost of medications was calculated from the computerised dispensed
medication histories for six months preceding the first visit in the clinic and
six months preceding the final visit in the clinic for all patients. The cost of
medications was calculated in Australian dollars as a cost per patient per
month ($PPPM) to the Commonwealth Government of Australia. The cost of
medication used was the Dispensed Price for Maximum Quantity listed in
the Schedule of Pharmaceutical Benefits (PBS) 1 August 2003. Some of the
cost of the medication was contributed by the patient themselves, as either
the general price ($23.10 per item), or as concession and pension card holders
($3.70 per item). Patients’ contributions changed during the year. Once the
general patients reached a certain threshold per year, they were entitled to a
Safety Net Entitlement Card and then only paid $3.70 for each item, unless a
therapeutic or brand premium was involved. Once the concession and
pension card holders received 52 prescriptions for that year, they paid
nothing for subsequent medications.
The median cost of medications per patient per month was then calculated at
baseline and at six months for the 2 groups of patients. The median was
used because the data were not normally distributed. The average of these
two figures was used to calculate the median cost per patient for each
service. This was done by multiplying the monthly cost per patient by six,
since six months was the time period for both continuity of care and clinic
only groups.
Community pharmacists’ role in the continuity of care of Type 2 diabetes: An evaluation of a model
57
4.5 Measure of effectiveness Enhanced control of blood glucose, via a reduction in HbA1c, has been
correlated with a reduction in complications due to diabetes and diabetes
related death. HbA1c gives an index of average diabetic control over the
preceding 2-3 months. The mean change in HbA1c was chosen as the
measure of effectiveness in this study.
Those patients for whom an HbA1c measurement was made in the six months
prior to the start of the study and at least two months after the program
commenced were included in the economic analysis. The mean change in
HbA1c from baseline to at least two months after the study commenced was
calculated for both intervention and control groups.
4.6 Incremental cost effectiveness ratio Following the calculation of costs and effectiveness, an incremental cost
effectiveness ratio was calculated, which provided an estimation of the extra
cost required to deliver the continuity of care service associated with the
project compared with the standard service provided to the clinic only
group. This was calculated by subtracting the cost of the standard service
(C2) from the cost of the enhanced service (C1) and dividing this figure by
that obtained when the mean change in HbA1c (measure of effectiveness of
the standard service, E2) was subtracted from the mean change in HbA1c of
the intervention group E1).
C1 – C2 Incremental cost effectiveness ratio = ---------- E1 – E2 C1 = cost of the continuity of care service C2 = cost of the clinic only service E1 = mean change in HbA1c for continuity of care service E2 = mean change in HbA1c for clinic only service
Community pharmacists’ role in the continuity of care of Type 2 diabetes: An evaluation of a model
58
A fundamental assumption made was that the patients in the continuity of
care and clinic only groups would be equal in the severity of their diabetes.
In addition, it was assumed that AR-DRG codes could be accurately allocated
for any hospitalisations which occurred. It was also assumed that patients
told the community pharmacists all the pharmacies from which they
obtained their medications in the study period.
4.7 Sensitivity analysis Because many of the parameter values in this study could have varied within
a range, some uncertainties and assumptions were tested in a sensitivity
analysis. The approach chosen was a scenario analysis with a “Best Case”
scenario and a “Worst Case” scenario, both being described from the
perspective of the health care sector [62].
The cost of hospitalisations was considered to be the least certain parameter
value, because of the inequality of the severity of diabetes between the two
groups and the uncertainty in the allocation of some DRGs. As a
consequence, in the Worst Case Scenario, the cost of hospitalisations was
considered to be equal in the two groups.
The cost of medications was calculated assuming that all medications were
included. This was not always the case if patients visited other pharmacies
and did not inform the researchers. Thus, in the Best Case Scenario the cost
of medications in each group was assumed to be the same and cancelled out.
Community pharmacists’ role in the continuity of care of Type 2 diabetes: An evaluation of a model
59
RESULTS
Section A: Initial Health Section A assesses the participants’ overall health. For instance, participants’
overall medication regimen is presented. Data is presented about whether they
had been told that they had certain specific health conditions. They were also
canvassed whether they had received any formal education about such issues
and whether they monitored their blood glucose. Finally, clinical data is
presented. Section A only presents information concerning the patients at Clinic
Visit 1. The aim of this section is to provide the reader with a snap-shot of the
patients’ health at the start of this study.
This section consists of four sub-sections. Each follows the same design.
Information is presented about the initial sample. This is followed by
information concerning the final sample (after dropouts). A comparison is then
made between the final sample and the non-completers (individuals who
completed Visit 1, but did not attend the clinic at Visit 2). Finally, a comparison
is made between the clinic only and the continuity of care groups.
1. Current diabetic medication management The antidiabetic medications, reported by the patients in the hospital clinic at
pre-testing, were pooled into three groupings (insulin only, insulin and
antidiabetic tablets, antidiabetic tablets only). The results of a comparison
between the final sample and the non-completers, and a comparison between
the continuity of care and clinic only patients are presented below.
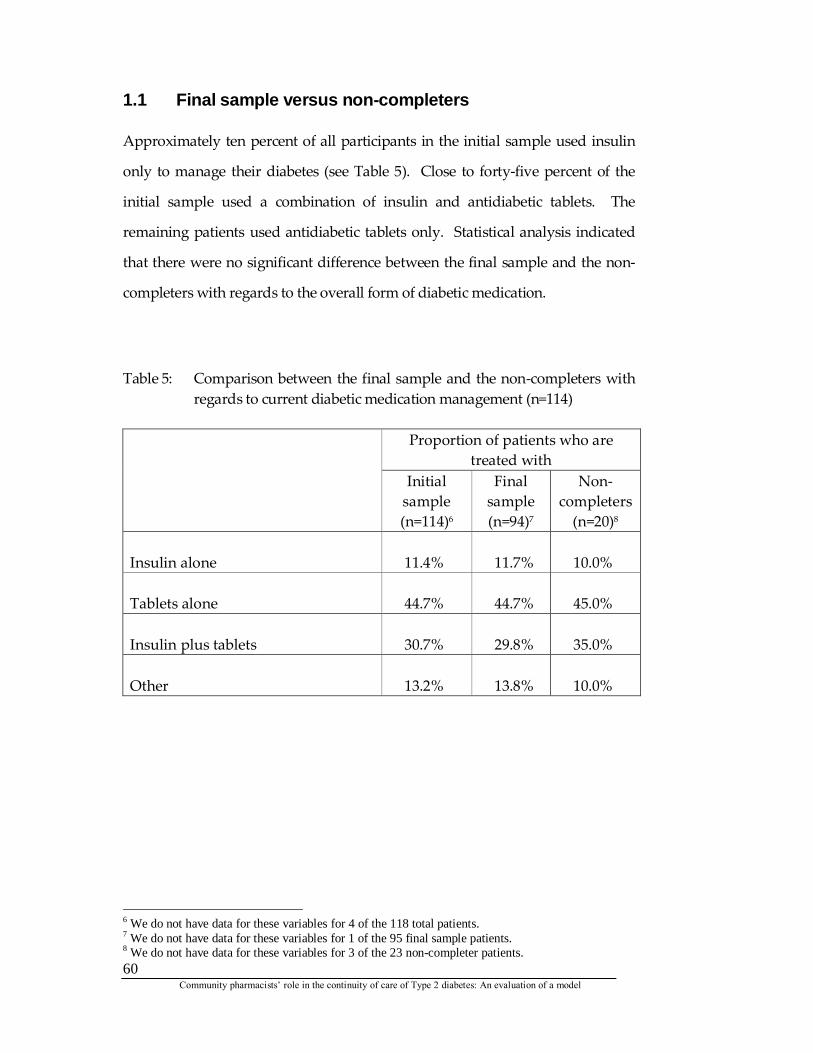
Community pharmacists’ role in the continuity of care of Type 2 diabetes: An evaluation of a model
60
1.1 Final sample versus non-completers Approximately ten percent of all participants in the initial sample used insulin
only to manage their diabetes (see Table 5). Close to forty-five percent of the
initial sample used a combination of insulin and antidiabetic tablets. The
remaining patients used antidiabetic tablets only. Statistical analysis indicated
that there were no significant difference between the final sample and the non-
completers with regards to the overall form of diabetic medication.
Table 5: Comparison between the final sample and the non-completers with
regards to current diabetic medication management (n=114)
Proportion of patients who are treated with
Initial sample (n=114)6
Final sample (n=94)7
Non- completers
(n=20)8 Insulin alone
11.4%
11.7%
10.0%
Tablets alone
44.7%
44.7%
45.0%
Insulin plus tablets
30.7%
29.8%
35.0%
Other
13.2%
13.8%
10.0%
6 We do not have data for these variables for 4 of the 118 total patients. 7 We do not have data for these variables for 1 of the 95 final sample patients. 8 We do not have data for these variables for 3 of the 23 non-completer patients.
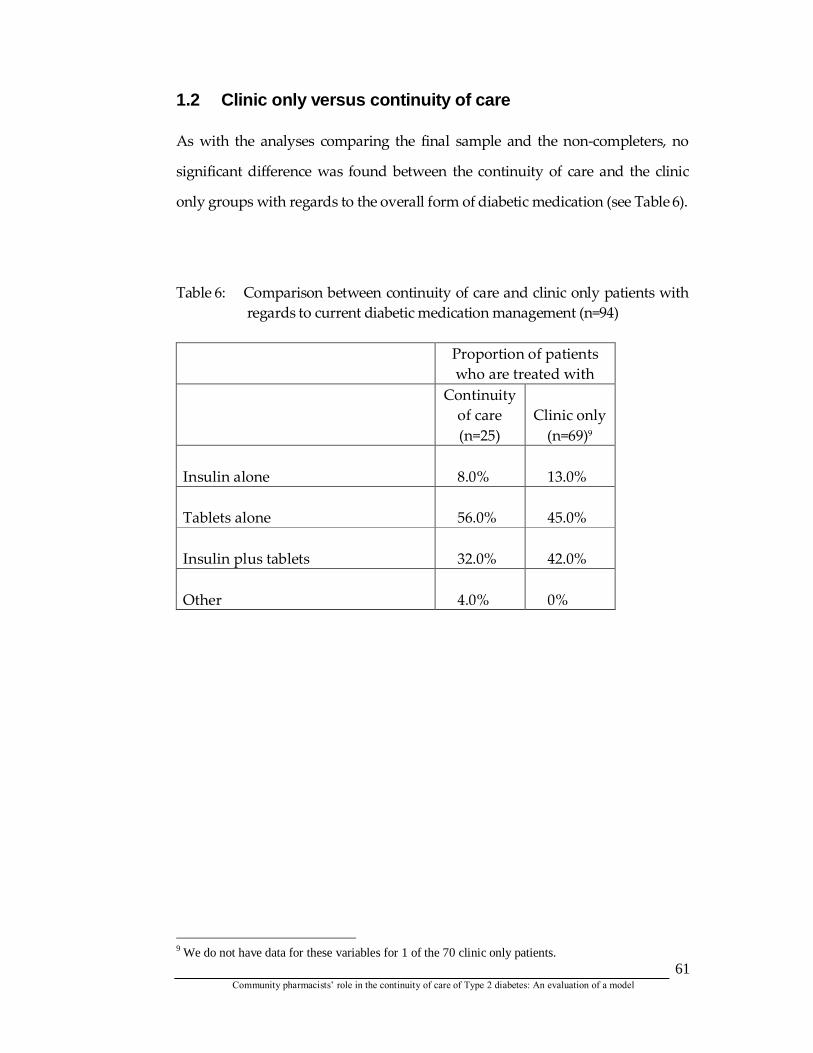
Community pharmacists’ role in the continuity of care of Type 2 diabetes: An evaluation of a model
61
1.2 Clinic only versus continuity of care As with the analyses comparing the final sample and the non-completers, no
significant difference was found between the continuity of care and the clinic
only groups with regards to the overall form of diabetic medication (see Table 6).
Table 6: Comparison between continuity of care and clinic only patients with regards to current diabetic medication management (n=94)
Proportion of patients
who are treated with Continuity
of care (n=25)
Clinic only
(n=69)9 Insulin alone
8.0%
13.0%
Tablets alone
56.0%
45.0%
Insulin plus tablets
32.0%
42.0%
Other
4.0%
0%
9 We do not have data for these variables for 1 of the 70 clinic only patients.
Community pharmacists’ role in the continuity of care of Type 2 diabetes: An evaluation of a model
62
2. Health conditions All participants were asked the following question about five health complaints
(high blood pressure, stroke, angina, heart attack, high cholesterol): “Have you
ever been told that you have any of the following?” An additional three similar
questions were asked about health conditions caused directly by diabetes (eye
problems caused by your diabetes, kidney problems caused by your diabetes,
foot problems caused by your diabetes). The results of the initial sample, final
sample, a comparison between the final sample and the non-completers, and a
comparison between the continuity of care and clinic only patients are presented
below.
2.1 Final sample versus non-completers Almost half of the initial sample (n=118) had been told at one time in their
life by a doctor, nurse, or other health care professional, that they had high
cholesterol and approaching two-thirds of the initial sample had been told
that they high blood pressure (see Table 7). Furthermore, more than a third
had had been told that they had eye problems caused by diabetes, and nearly
a third had been told that they had angina. Thus, a high co-morbidity of
disease was prevalent in this sample.
Like the initial sample, almost half of the final sample (n=95) had been told
that they had high cholesterol and approaching two-thirds of the initial
sample had been told that they had high blood pressure (see Table 7). In
addition, more than a third had had been told that they had eye problems
caused by diabetes, and nearly a third had been told that they had angina.
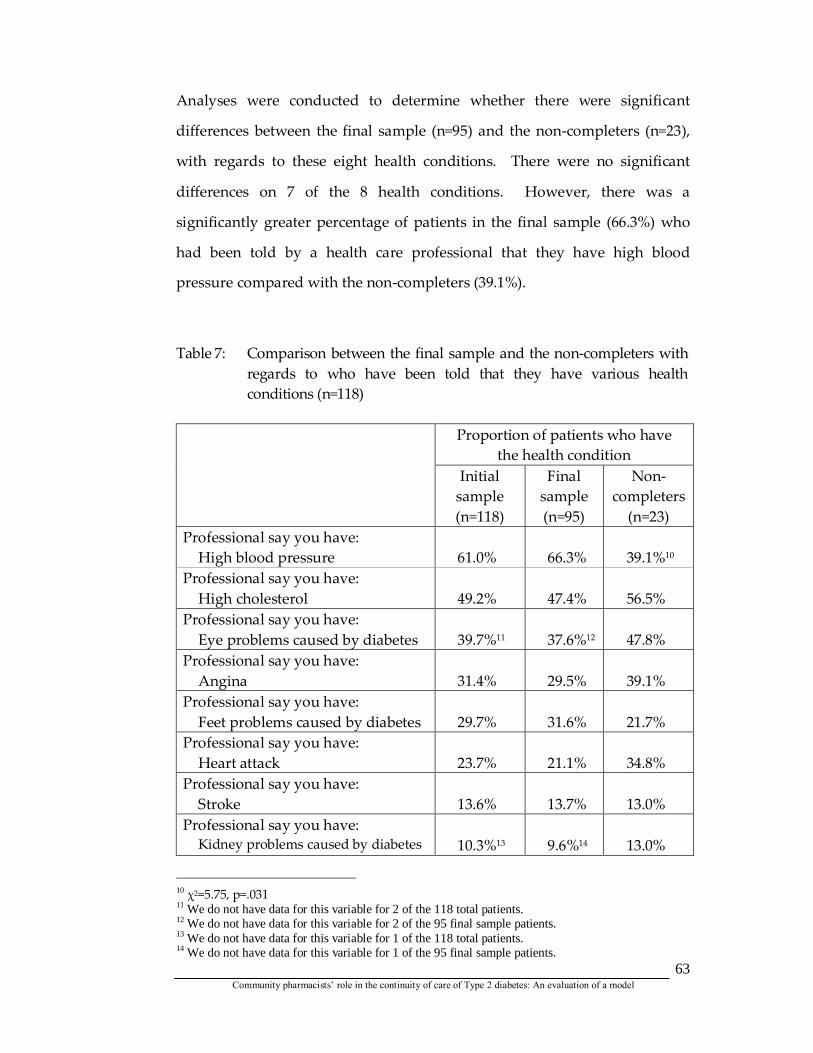
Community pharmacists’ role in the continuity of care of Type 2 diabetes: An evaluation of a model
63
Analyses were conducted to determine whether there were significant
differences between the final sample (n=95) and the non-completers (n=23),
with regards to these eight health conditions. There were no significant
differences on 7 of the 8 health conditions. However, there was a
significantly greater percentage of patients in the final sample (66.3%) who
had been told by a health care professional that they have high blood
pressure compared with the non-completers (39.1%).
Table 7: Comparison between the final sample and the non-completers with
regards to who have been told that they have various health conditions (n=118)
Proportion of patients who have
the health condition
Initial sample (n=118)
Final sample (n=95)
Non- completers
(n=23) Professional say you have: High blood pressure
61.0%
66.3%
39.1%10
Professional say you have: High cholesterol
49.2%
47.4%
56.5%
Professional say you have: Eye problems caused by diabetes
39.7%11
37.6%12
47.8%
Professional say you have: Angina
31.4%
29.5%
39.1%
Professional say you have: Feet problems caused by diabetes
29.7%
31.6%
21.7%
Professional say you have: Heart attack
23.7%
21.1%
34.8%
Professional say you have: Stroke
13.6%
13.7%
13.0%
Professional say you have: Kidney problems caused by diabetes
10.3%13
9.6%14
13.0%
10 χ2=5.75, p=.031 11 We do not have data for this variable for 2 of the 118 total patients. 12 We do not have data for this variable for 2 of the 95 final sample patients. 13 We do not have data for this variable for 1 of the 118 total patients. 14 We do not have data for this variable for 1 of the 95 final sample patients.
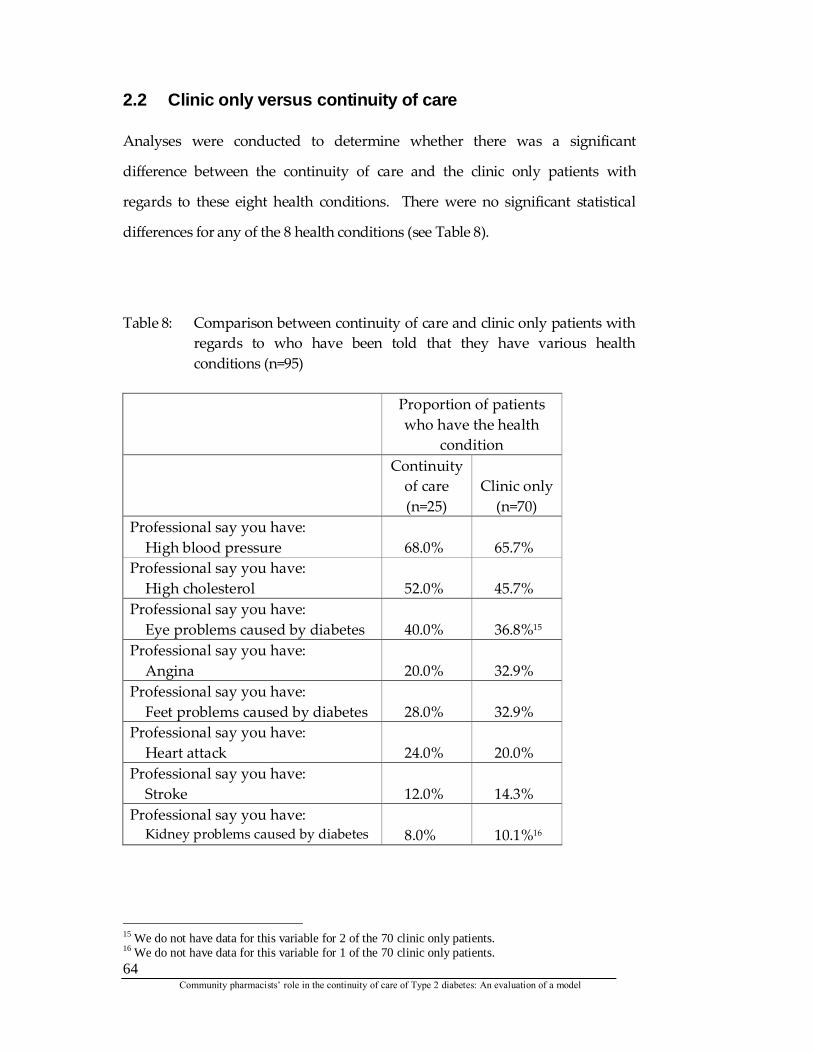
Community pharmacists’ role in the continuity of care of Type 2 diabetes: An evaluation of a model
64
2.2 Clinic only versus continuity of care Analyses were conducted to determine whether there was a significant
difference between the continuity of care and the clinic only patients with
regards to these eight health conditions. There were no significant statistical
differences for any of the 8 health conditions (see Table 8).
Table 8: Comparison between continuity of care and clinic only patients with regards to who have been told that they have various health conditions (n=95)
Proportion of patients
who have the health condition
Continuity of care (n=25)
Clinic only
(n=70) Professional say you have: High blood pressure
68.0%
65.7%
Professional say you have: High cholesterol
52.0%
45.7%
Professional say you have: Eye problems caused by diabetes
40.0%
36.8%15
Professional say you have: Angina
20.0%
32.9%
Professional say you have: Feet problems caused by diabetes
28.0%
32.9%
Professional say you have: Heart attack
24.0%
20.0%
Professional say you have: Stroke
12.0%
14.3%
Professional say you have: Kidney problems caused by diabetes
8.0%
10.1%16
15 We do not have data for this variable for 2 of the 70 clinic only patients. 16 We do not have data for this variable for 1 of the 70 clinic only patients.
Community pharmacists’ role in the continuity of care of Type 2 diabetes: An evaluation of a model
65
3. Diabetes education and blood glucose monitoring This subsection assesses whether the participants have received any diabetes
education, such as attended a series of classes, or series of meetings, with a
diabetes educator. More specifically, they were asked whether a “doctor, nurse,
or other health care professional you see for your diabetes, ever told you to a)
take special care of your feet?; b) follow an exercise program?; and/or c) follow a
meal plan or diet?” Their application of such education was indirectly gauged
by asking: “Do you monitor your blood glucose at home? The results of the
initial sample, final sample, a comparison between the final sample and the non-
completers, and a comparison between the continuity of care and clinic only
patients are presented below.
3.1 Final sample versus non-completers A substantial, one-sixth of all the type 2 diabetic patients who agreed to
participate in the study had not received diabetes education (see Table 9).
Even more disconcerting is the fact that more than one quarter (27.1%) had
not been told to follow an exercise program. A positive finding was that
only 9 of the 118 patients did not monitor their blood glucose at home.
Unfortunately, 3 of these 9 patients were being treated with insulin at the
time.
Similar to the initial sample, 13 of the 9417 final sample participants had not
received diabetes education (see Table 9). Likewise, more than one quarter
(26.3%) had not been told to follow an exercise program and nearly one in five
(18.1%) had not been told to take special care of their feet. If these results are
indeed correct, then this finding is a concern and these patients should promptly
17 Data for this question was not obtainable for one participant.
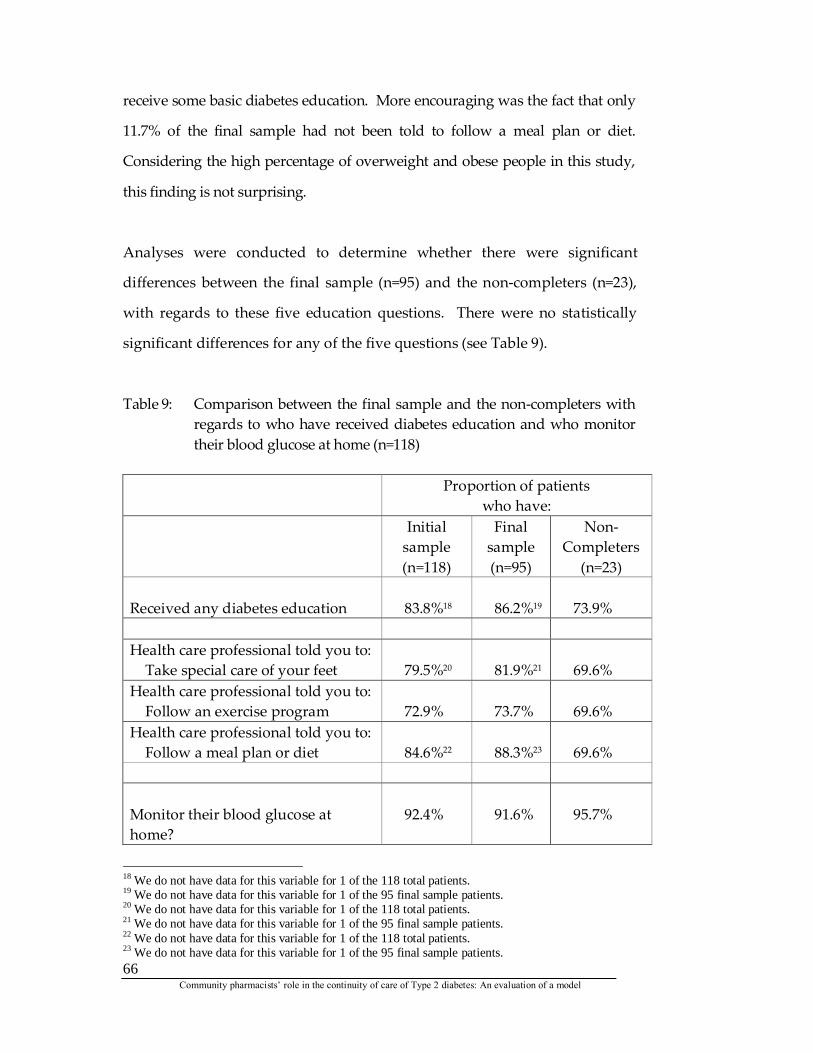
Community pharmacists’ role in the continuity of care of Type 2 diabetes: An evaluation of a model
66
receive some basic diabetes education. More encouraging was the fact that only
11.7% of the final sample had not been told to follow a meal plan or diet.
Considering the high percentage of overweight and obese people in this study,
this finding is not surprising.
Analyses were conducted to determine whether there were significant
differences between the final sample (n=95) and the non-completers (n=23),
with regards to these five education questions. There were no statistically
significant differences for any of the five questions (see Table 9).
Table 9: Comparison between the final sample and the non-completers with regards to who have received diabetes education and who monitor their blood glucose at home (n=118)
Proportion of patients
who have: Initial
sample (n=118)
Final sample (n=95)
Non- Completers
(n=23) Received any diabetes education
83.8%18
86.2%19
73.9%
Health care professional told you to: Take special care of your feet
79.5%20
81.9%21
69.6%
Health care professional told you to: Follow an exercise program
72.9%
73.7%
69.6%
Health care professional told you to: Follow a meal plan or diet
84.6%22
88.3%23
69.6%
Monitor their blood glucose at home?
92.4%
91.6%
95.7%
18 We do not have data for this variable for 1 of the 118 total patients. 19 We do not have data for this variable for 1 of the 95 final sample patients. 20 We do not have data for this variable for 1 of the 118 total patients. 21 We do not have data for this variable for 1 of the 95 final sample patients. 22 We do not have data for this variable for 1 of the 118 total patients. 23 We do not have data for this variable for 1 of the 95 final sample patients.
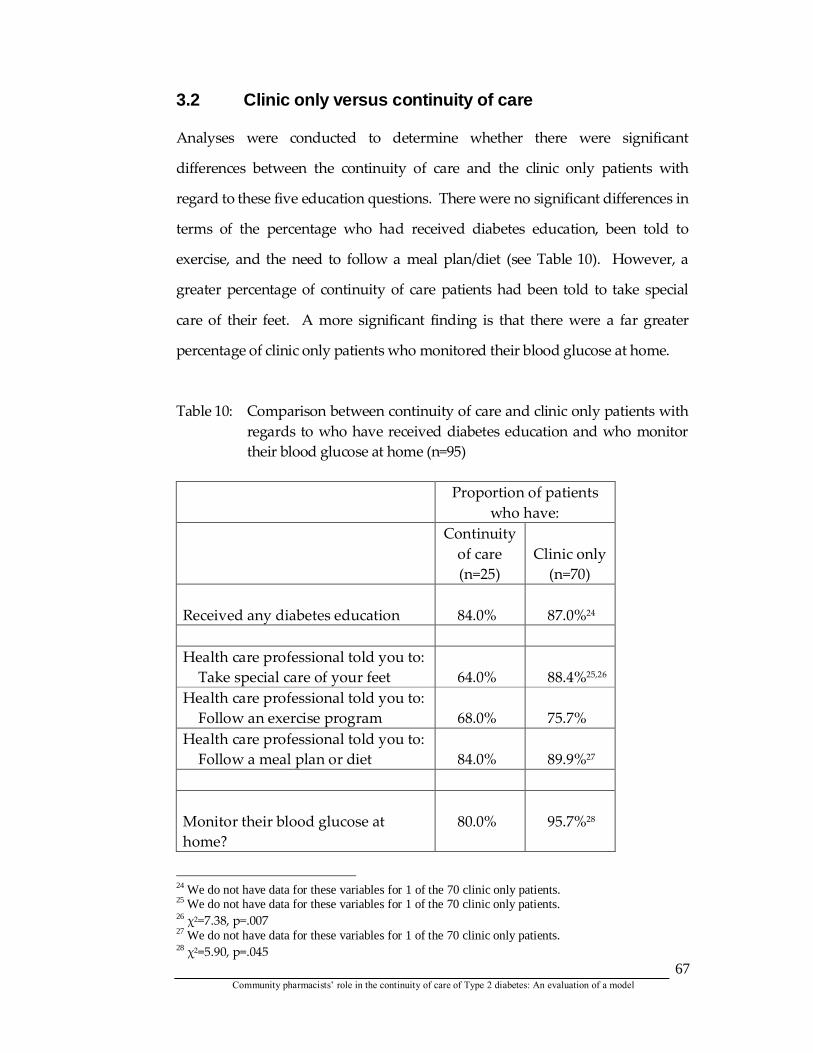
Community pharmacists’ role in the continuity of care of Type 2 diabetes: An evaluation of a model
67
3.2 Clinic only versus continuity of care Analyses were conducted to determine whether there were significant
differences between the continuity of care and the clinic only patients with
regard to these five education questions. There were no significant differences in
terms of the percentage who had received diabetes education, been told to
exercise, and the need to follow a meal plan/diet (see Table 10). However, a
greater percentage of continuity of care patients had been told to take special
care of their feet. A more significant finding is that there were a far greater
percentage of clinic only patients who monitored their blood glucose at home.
Table 10: Comparison between continuity of care and clinic only patients with regards to who have received diabetes education and who monitor their blood glucose at home (n=95)
Proportion of patients
who have: Continuity
of care (n=25)
Clinic only
(n=70) Received any diabetes education
84.0%
87.0%24
Health care professional told you to: Take special care of your feet
64.0%
88.4%25,26
Health care professional told you to: Follow an exercise program
68.0%
75.7%
Health care professional told you to: Follow a meal plan or diet
84.0%
89.9%27
Monitor their blood glucose at home?
80.0%
95.7%28
24 We do not have data for these variables for 1 of the 70 clinic only patients. 25 We do not have data for these variables for 1 of the 70 clinic only patients. 26 χ2=7.38, p=.007 27 We do not have data for these variables for 1 of the 70 clinic only patients. 28 χ2=5.90, p=.045
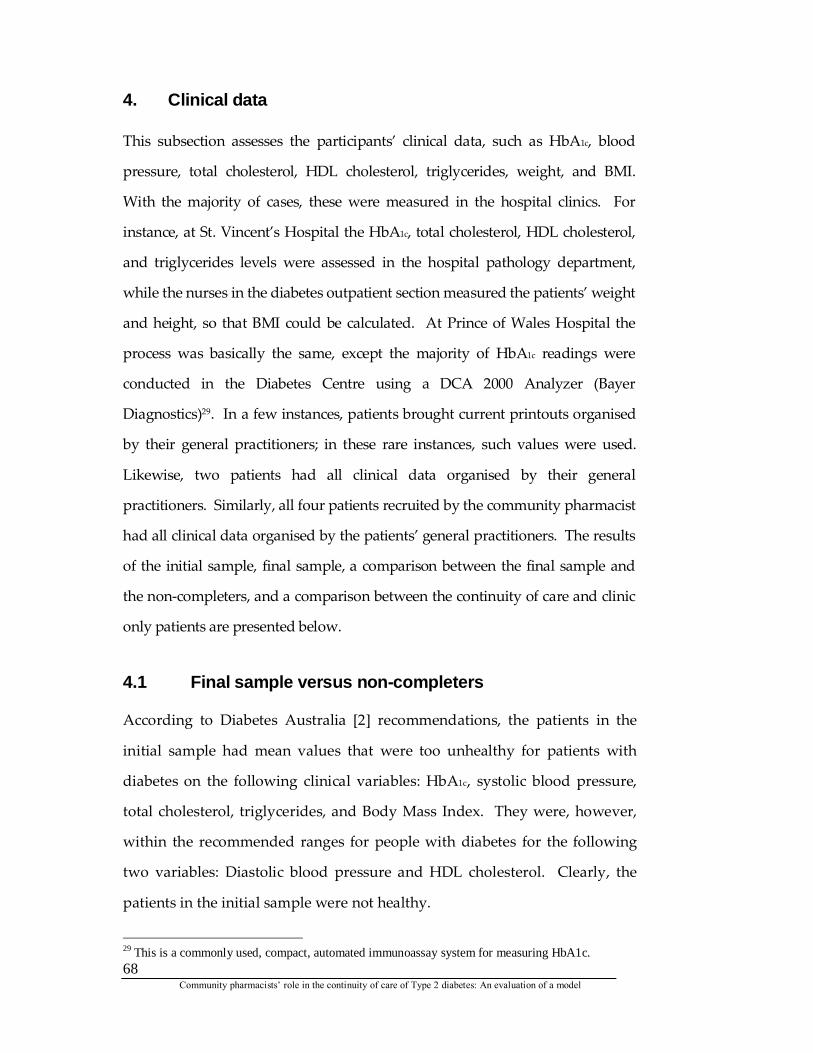
Community pharmacists’ role in the continuity of care of Type 2 diabetes: An evaluation of a model
68
4. Clinical data This subsection assesses the participants’ clinical data, such as HbA1c, blood
pressure, total cholesterol, HDL cholesterol, triglycerides, weight, and BMI.
With the majority of cases, these were measured in the hospital clinics. For
instance, at St. Vincent’s Hospital the HbA1c, total cholesterol, HDL cholesterol,
and triglycerides levels were assessed in the hospital pathology department,
while the nurses in the diabetes outpatient section measured the patients’ weight
and height, so that BMI could be calculated. At Prince of Wales Hospital the
process was basically the same, except the majority of HbA1c readings were
conducted in the Diabetes Centre using a DCA 2000 Analyzer (Bayer
Diagnostics)29. In a few instances, patients brought current printouts organised
by their general practitioners; in these rare instances, such values were used.
Likewise, two patients had all clinical data organised by their general
practitioners. Similarly, all four patients recruited by the community pharmacist
had all clinical data organised by the patients’ general practitioners. The results
of the initial sample, final sample, a comparison between the final sample and
the non-completers, and a comparison between the continuity of care and clinic
only patients are presented below.
4.1 Final sample versus non-completers According to Diabetes Australia [2] recommendations, the patients in the
initial sample had mean values that were too unhealthy for patients with
diabetes on the following clinical variables: HbA1c, systolic blood pressure,
total cholesterol, triglycerides, and Body Mass Index. They were, however,
within the recommended ranges for people with diabetes for the following
two variables: Diastolic blood pressure and HDL cholesterol. Clearly, the
patients in the initial sample were not healthy.
29 This is a commonly used, compact, automated immunoassay system for measuring HbA1c.
Community pharmacists’ role in the continuity of care of Type 2 diabetes: An evaluation of a model
69
Using the Diabetes Australia [2] recommendations, the patients in the final
sample had mean values that were too unhealthy for patients with diabetes
on the following clinical variables: HbA1c, systolic blood pressure, total
cholesterol, triglycerides, and Body Mass Index. They were, however, within
the recommended ranges for people with diabetes for the following two
variables: Diastolic blood pressure and HDL cholesterol.
Similarly, using the Diabetes Australia [2] recommendations, the non-
completers had mean values that were too unhealthy for patients with
diabetes on the following clinical variables: HbA1c, systolic blood pressure,
total cholesterol, and Body Mass Index. They were, however, within the
recommended ranges for people with diabetes for the following three
variables: Diastolic blood pressure, HDL cholesterol, and triglycerides.
Analyses were conducted to determine whether there were significant
differences between the final sample and the non-completers, with regards to
these 10 clinical variables. There was substantial similarity between the two
groups; all 10 variables were not statistically different (see Table 11).
4.2 Clinic only versus continuity of care Analyses were conducted to determine whether there were significant
differences between the clinic only and the continuity of care participants,
with regards to these 10 clinical variables. There was substantial similarity
between the two groups; 8 of the 10 variables were not statistically different
(see Table 12). However, there were two very important differences. The
clinic only participants had a higher HbA1c and a lower diastolic blood
pressure.
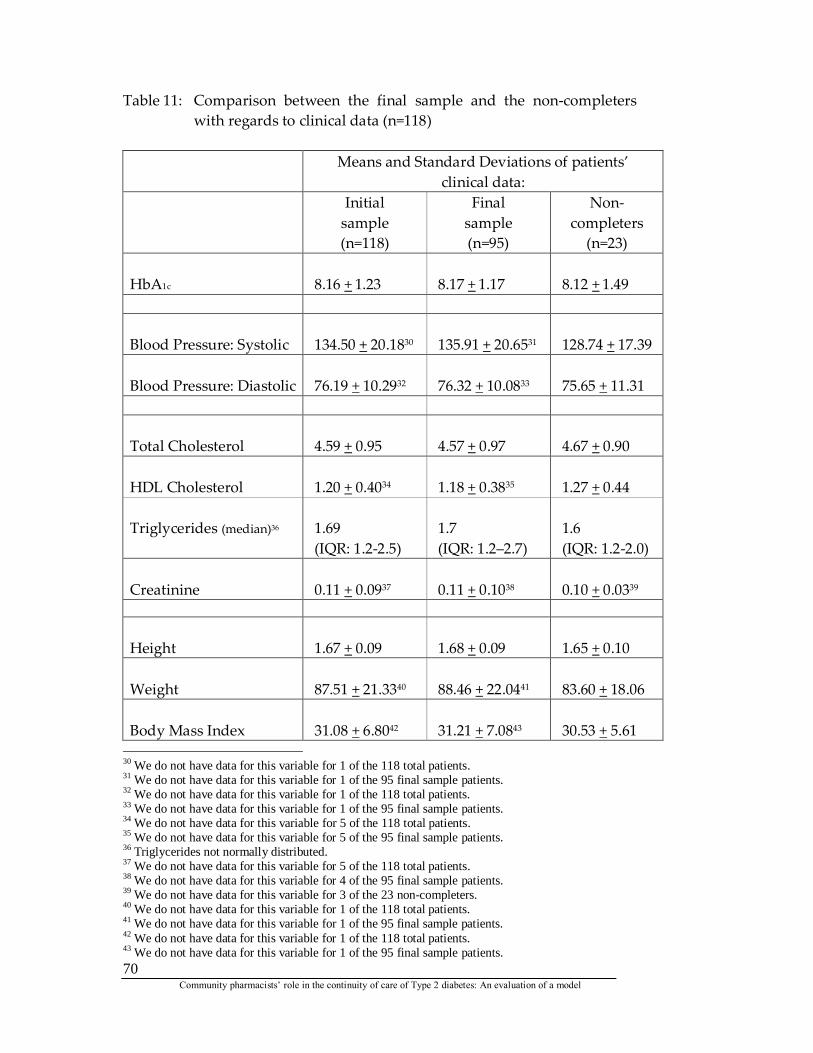
Community pharmacists’ role in the continuity of care of Type 2 diabetes: An evaluation of a model
70
Table 11: Comparison between the final sample and the non-completers with regards to clinical data (n=118)
Means and Standard Deviations of patients’
clinical data: Initial
sample (n=118)
Final sample (n=95)
Non- completers
(n=23) HbA1c
8.16 + 1.23
8.17 + 1.17
8.12 + 1.49
Blood Pressure: Systolic
134.50 + 20.1830
135.91 + 20.6531
128.74 + 17.39
Blood Pressure: Diastolic
76.19 + 10.2932
76.32 + 10.0833
75.65 + 11.31
Total Cholesterol
4.59 + 0.95
4.57 + 0.97
4.67 + 0.90
HDL Cholesterol
1.20 + 0.4034
1.18 + 0.3835
1.27 + 0.44
Triglycerides (median)36
1.69 (IQR: 1.2-2.5)
1.7 (IQR: 1.2–2.7)
1.6 (IQR: 1.2-2.0)
Creatinine
0.11 + 0.0937
0.11 + 0.1038
0.10 + 0.0339
Height
1.67 + 0.09
1.68 + 0.09
1.65 + 0.10
Weight
87.51 + 21.3340
88.46 + 22.0441
83.60 + 18.06
Body Mass Index
31.08 + 6.8042
31.21 + 7.0843
30.53 + 5.61
30 We do not have data for this variable for 1 of the 118 total patients. 31 We do not have data for this variable for 1 of the 95 final sample patients. 32 We do not have data for this variable for 1 of the 118 total patients. 33 We do not have data for this variable for 1 of the 95 final sample patients. 34 We do not have data for this variable for 5 of the 118 total patients. 35 We do not have data for this variable for 5 of the 95 final sample patients. 36 Triglycerides not normally distributed. 37 We do not have data for this variable for 5 of the 118 total patients. 38 We do not have data for this variable for 4 of the 95 final sample patients. 39 We do not have data for this variable for 3 of the 23 non-completers. 40 We do not have data for this variable for 1 of the 118 total patients. 41 We do not have data for this variable for 1 of the 95 final sample patients. 42 We do not have data for this variable for 1 of the 118 total patients. 43 We do not have data for this variable for 1 of the 95 final sample patients.
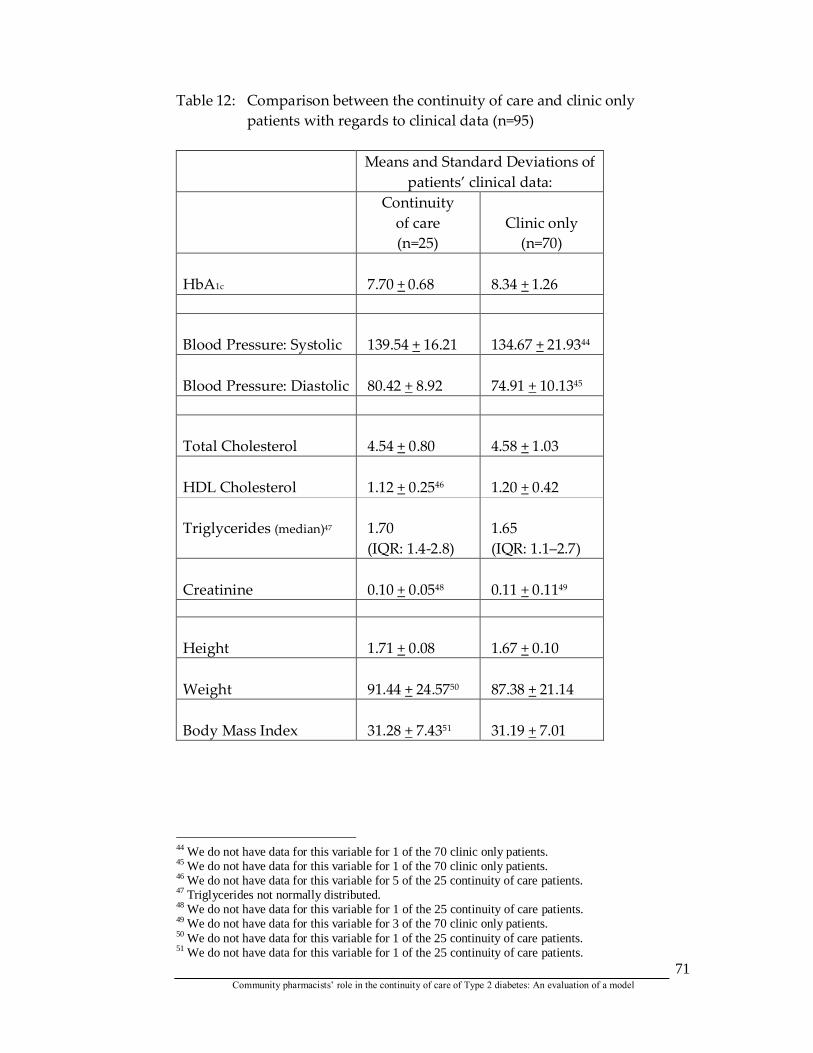
Community pharmacists’ role in the continuity of care of Type 2 diabetes: An evaluation of a model
71
Table 12: Comparison between the continuity of care and clinic only patients with regards to clinical data (n=95)
Means and Standard Deviations of
patients’ clinical data: Continuity
of care (n=25)
Clinic only
(n=70) HbA1c
7.70 + 0.68
8.34 + 1.26
Blood Pressure: Systolic
139.54 + 16.21
134.67 + 21.9344
Blood Pressure: Diastolic
80.42 + 8.92
74.91 + 10.1345
Total Cholesterol
4.54 + 0.80
4.58 + 1.03
HDL Cholesterol
1.12 + 0.2546
1.20 + 0.42
Triglycerides (median)47
1.70 (IQR: 1.4-2.8)
1.65 (IQR: 1.1–2.7)
Creatinine
0.10 + 0.0548
0.11 + 0.1149
Height
1.71 + 0.08
1.67 + 0.10
Weight
91.44 + 24.5750
87.38 + 21.14
Body Mass Index
31.28 + 7.4351
31.19 + 7.01
44 We do not have data for this variable for 1 of the 70 clinic only patients. 45 We do not have data for this variable for 1 of the 70 clinic only patients. 46 We do not have data for this variable for 5 of the 25 continuity of care patients. 47 Triglycerides not normally distributed. 48 We do not have data for this variable for 1 of the 25 continuity of care patients. 49 We do not have data for this variable for 3 of the 70 clinic only patients. 50 We do not have data for this variable for 1 of the 25 continuity of care patients. 51 We do not have data for this variable for 1 of the 25 continuity of care patients.
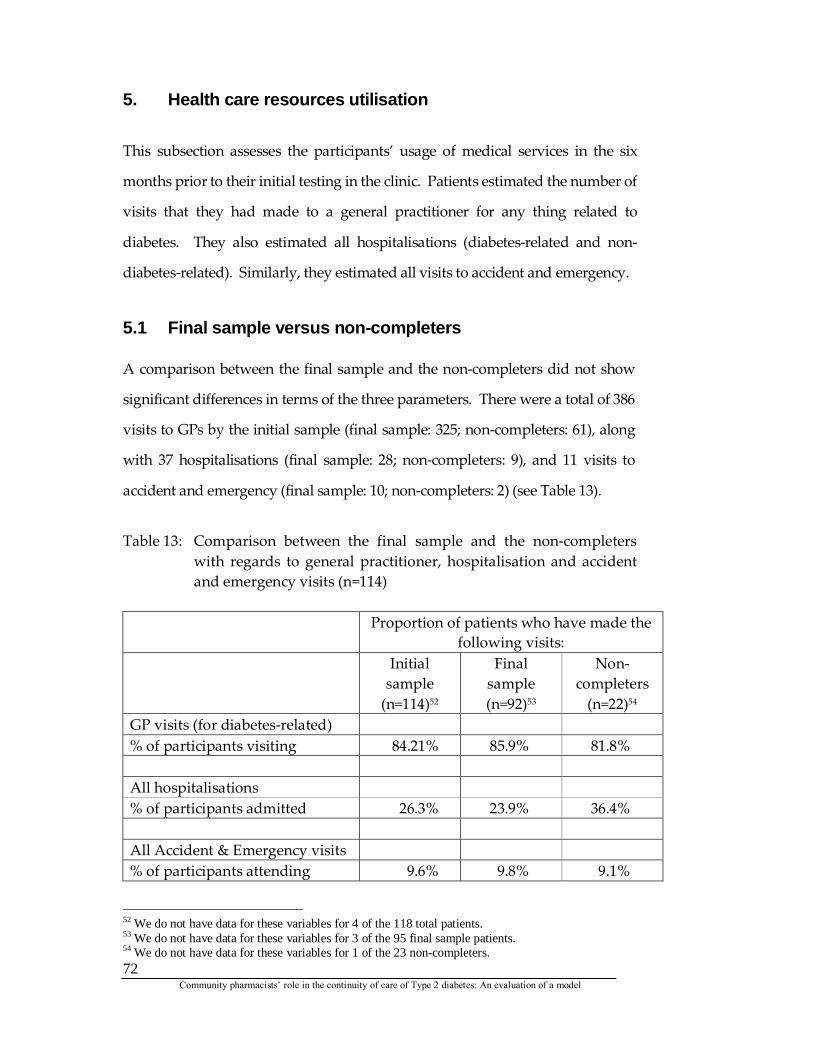
Community pharmacists’ role in the continuity of care of Type 2 diabetes: An evaluation of a model
72
5. Health care resources utilisation
This subsection assesses the participants’ usage of medical services in the six
months prior to their initial testing in the clinic. Patients estimated the number of
visits that they had made to a general practitioner for any thing related to
diabetes. They also estimated all hospitalisations (diabetes-related and non-
diabetes-related). Similarly, they estimated all visits to accident and emergency.
5.1 Final sample versus non-completers A comparison between the final sample and the non-completers did not show
significant differences in terms of the three parameters. There were a total of 386
visits to GPs by the initial sample (final sample: 325; non-completers: 61), along
with 37 hospitalisations (final sample: 28; non-completers: 9), and 11 visits to
accident and emergency (final sample: 10; non-completers: 2) (see Table 13).
Table 13: Comparison between the final sample and the non-completers
with regards to general practitioner, hospitalisation and accident and emergency visits (n=114)
Proportion of patients who have made the
following visits: Initial
sample (n=114)52
Final sample (n=92)53
Non- completers
(n=22)54 GP visits (for diabetes-related) % of participants visiting 84.21% 85.9% 81.8% All hospitalisations % of participants admitted 26.3% 23.9% 36.4% All Accident & Emergency visits % of participants attending 9.6% 9.8% 9.1%
52 We do not have data for these variables for 4 of the 118 total patients. 53 We do not have data for these variables for 3 of the 95 final sample patients. 54 We do not have data for these variables for 1 of the 23 non-completers.
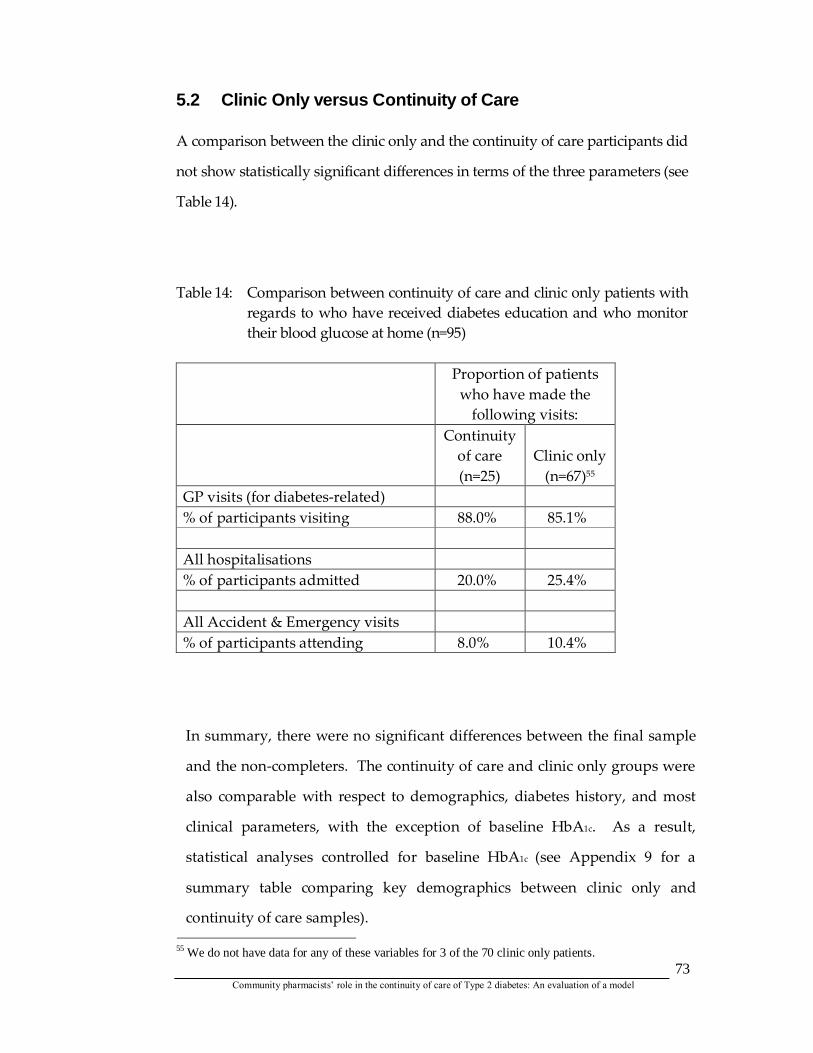
Community pharmacists’ role in the continuity of care of Type 2 diabetes: An evaluation of a model
73
5.2 Clinic Only versus Continuity of Care A comparison between the clinic only and the continuity of care participants did
not show statistically significant differences in terms of the three parameters (see
Table 14).
Table 14: Comparison between continuity of care and clinic only patients with regards to who have received diabetes education and who monitor their blood glucose at home (n=95)
Proportion of patients
who have made the following visits:
Continuity of care (n=25)
Clinic only
(n=67)55 GP visits (for diabetes-related) % of participants visiting 88.0% 85.1% All hospitalisations % of participants admitted 20.0% 25.4% All Accident & Emergency visits % of participants attending 8.0% 10.4%
55 We do not have data for any of these variables for 3 of the 70 clinic only patients.
In summary, there were no significant differences between the final sample
and the non-completers. The continuity of care and clinic only groups were
also comparable with respect to demographics, diabetes history, and most
clinical parameters, with the exception of baseline HbA1c. As a result,
statistical analyses controlled for baseline HbA1c (see Appendix 9 for a
summary table comparing key demographics between clinic only and
continuity of care samples).
Community pharmacists’ role in the continuity of care of Type 2 diabetes: An evaluation of a model
74
Section B: Pharmacists’ Interventions
6. Pharmacists’ interventions This section describes the evaluation of the impact of the diabetes service. The
data presented compare outcomes between continuity of care and clinic only
participants. The median duration from baseline clinic visit to the last
completed follow-up visit at the clinic was 7.2 (IQR: 6.1 – 9.0) months. The
continuity of care participants completed one baseline and four follow up visits
in the pharmacy. There was one exception to this; one continuity of care
participant completed the baseline and three follow up visits in the pharmacy.
6.1 Interventions delivered by the pharmacists in the clinic A total of 275 interventions were delivered and documented by the clinic
pharmacist over the duration of the study. Approximately 36% of the
specified interventions were classified under the broader category of disease
related problems, including patient education and motivation. The
remaining 64% concerned drug related problems, such as compliance (23%)
and drug safety (11%). The distribution of interventions, delivered and
documented by the pharmacist in each of the broader categories, is shown in
Figures 4 to 7.
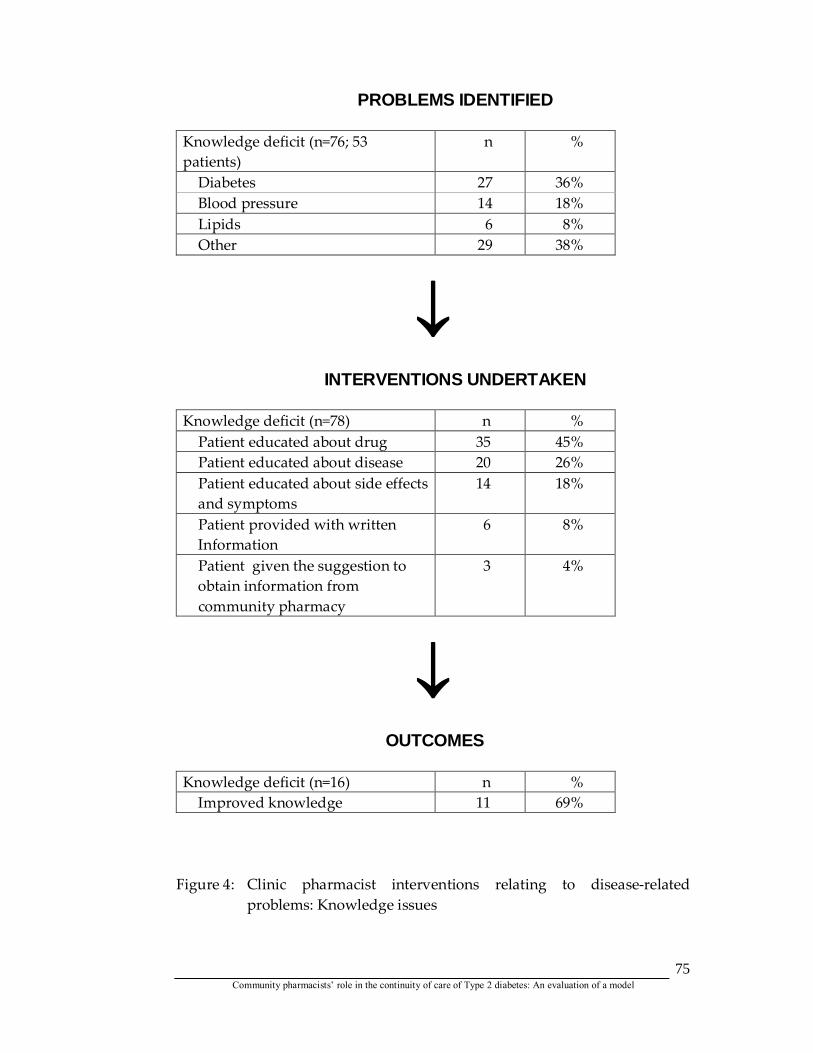
Community pharmacists’ role in the continuity of care of Type 2 diabetes: An evaluation of a model
75
PROBLEMS IDENTIFIED Knowledge deficit (n=76; 53 patients)
n %
Diabetes 27 36% Blood pressure 14 18% Lipids 6 8% Other 29 38%
INTERVENTIONS UNDERTAKEN Knowledge deficit (n=78) n % Patient educated about drug 35 45% Patient educated about disease 20 26% Patient educated about side effects and symptoms
14 18%
Patient provided with written Information
6 8%
Patient given the suggestion to obtain information from community pharmacy
3 4%
OUTCOMES Knowledge deficit (n=16) n % Improved knowledge 11 69%
Figure 4: Clinic pharmacist interventions relating to disease-related
problems: Knowledge issues
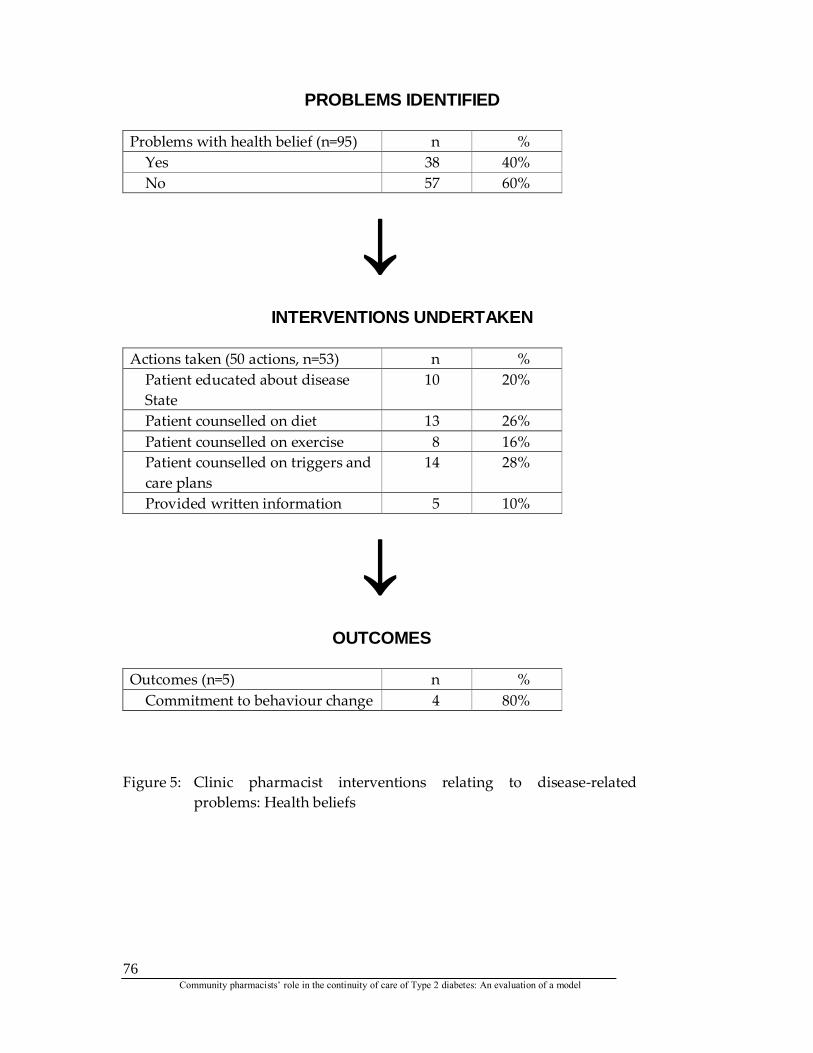
Community pharmacists’ role in the continuity of care of Type 2 diabetes: An evaluation of a model
76
PROBLEMS IDENTIFIED Problems with health belief (n=95) n % Yes 38 40% No 57 60%
INTERVENTIONS UNDERTAKEN Actions taken (50 actions, n=53) n % Patient educated about disease State
10 20%
Patient counselled on diet 13 26% Patient counselled on exercise 8 16% Patient counselled on triggers and care plans
14 28%
Provided written information 5 10%
OUTCOMES Outcomes (n=5) n % Commitment to behaviour change 4 80%
Figure 5: Clinic pharmacist interventions relating to disease-related
problems: Health beliefs
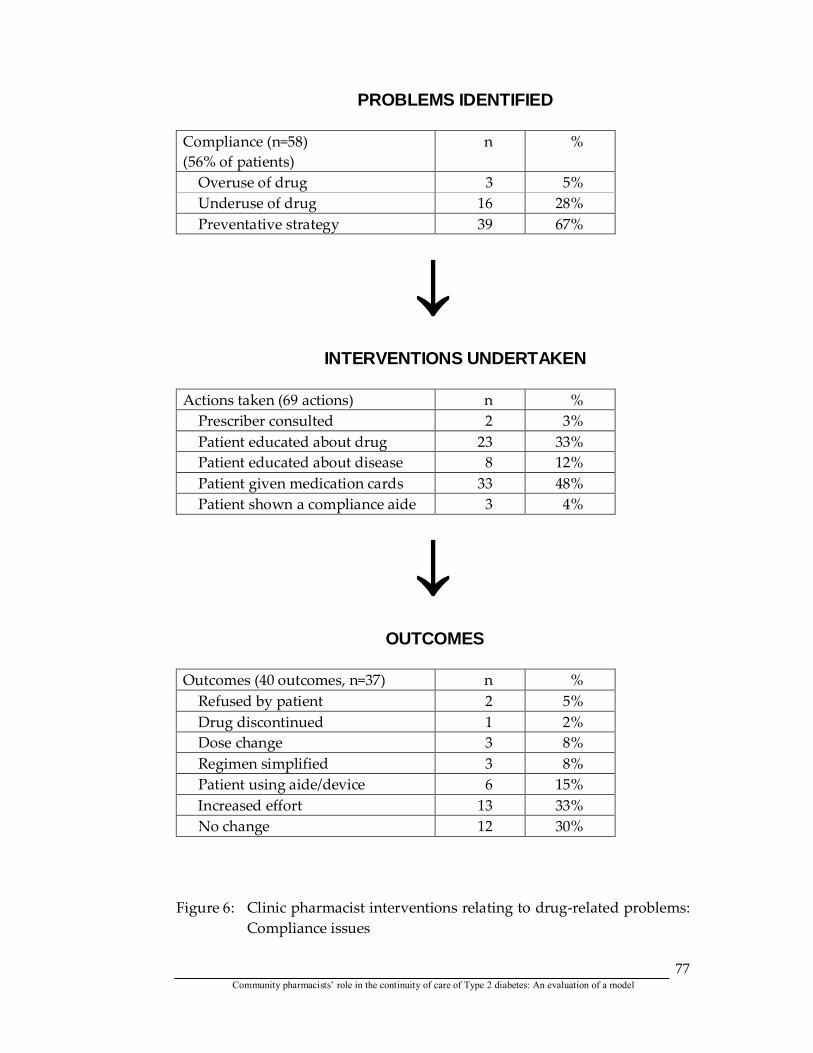
Community pharmacists’ role in the continuity of care of Type 2 diabetes: An evaluation of a model
77
PROBLEMS IDENTIFIED Compliance (n=58) (56% of patients)
n %
Overuse of drug 3 5% Underuse of drug 16 28% Preventative strategy 39 67%
INTERVENTIONS UNDERTAKEN Actions taken (69 actions) n % Prescriber consulted 2 3% Patient educated about drug 23 33% Patient educated about disease 8 12% Patient given medication cards 33 48% Patient shown a compliance aide 3 4%
OUTCOMES Outcomes (40 outcomes, n=37) n % Refused by patient 2 5% Drug discontinued 1 2% Dose change 3 8% Regimen simplified 3 8% Patient using aide/device 6 15% Increased effort 13 33% No change 12 30%
Figure 6: Clinic pharmacist interventions relating to drug-related problems:
Compliance issues
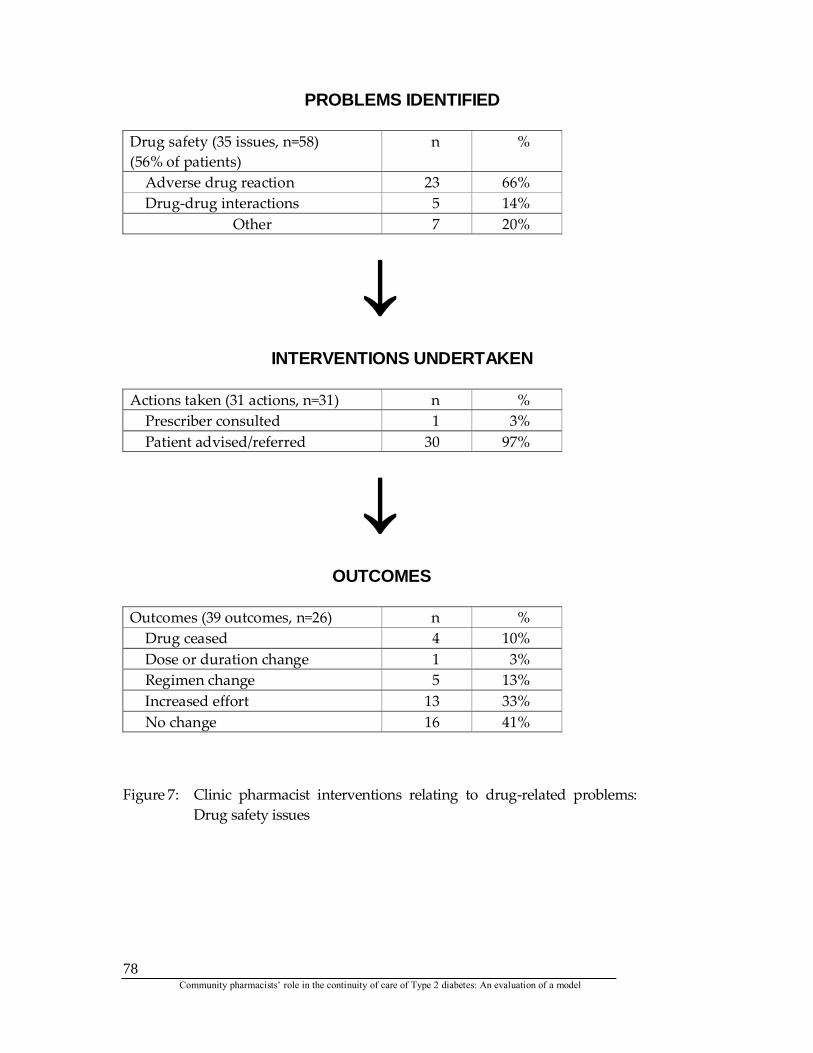
Community pharmacists’ role in the continuity of care of Type 2 diabetes: An evaluation of a model
78
PROBLEMS IDENTIFIED Drug safety (35 issues, n=58) (56% of patients)
n %
Adverse drug reaction 23 66% Drug-drug interactions 5 14%
Other 7 20%
INTERVENTIONS UNDERTAKEN Actions taken (31 actions, n=31) n % Prescriber consulted 1 3% Patient advised/referred 30 97%
OUTCOMES Outcomes (39 outcomes, n=26) n % Drug ceased 4 10% Dose or duration change 1 3% Regimen change 5 13% Increased effort 13 33% No change 16 41%
Figure 7: Clinic pharmacist interventions relating to drug-related problems:
Drug safety issues
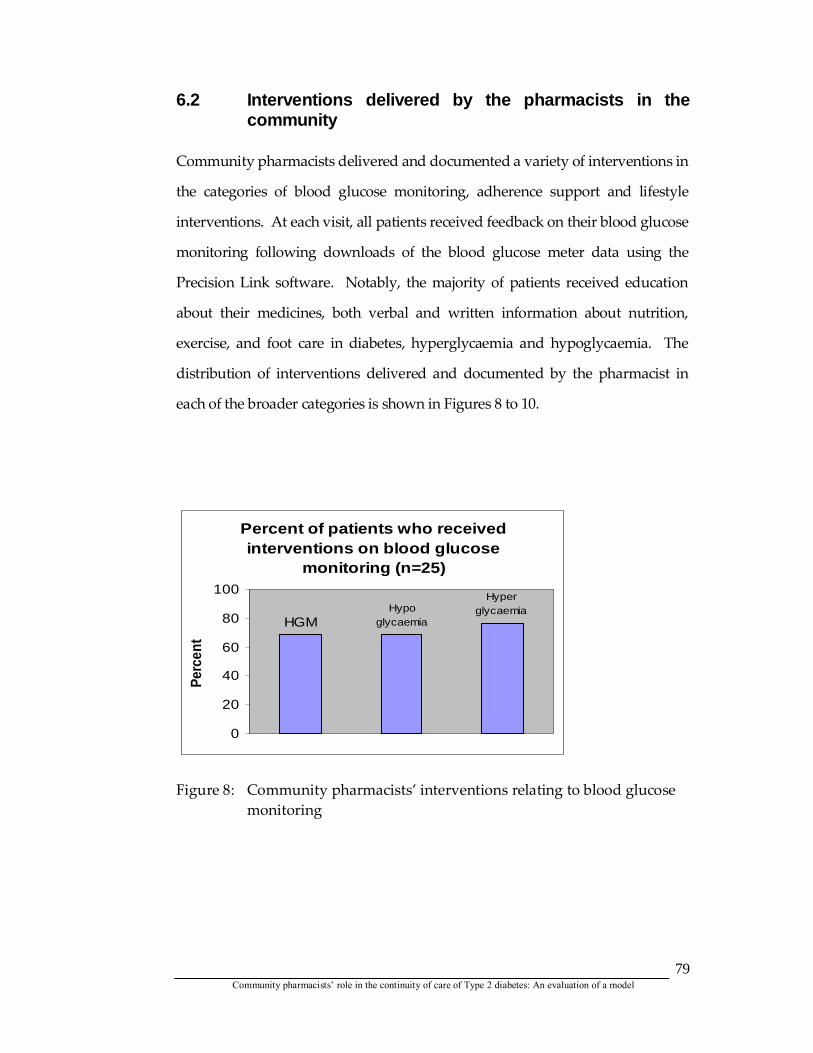
Community pharmacists’ role in the continuity of care of Type 2 diabetes: An evaluation of a model
79
6.2 Interventions delivered by the pharmacists in the community
Community pharmacists delivered and documented a variety of interventions in
the categories of blood glucose monitoring, adherence support and lifestyle
interventions. At each visit, all patients received feedback on their blood glucose
monitoring following downloads of the blood glucose meter data using the
Precision Link software. Notably, the majority of patients received education
about their medicines, both verbal and written information about nutrition,
exercise, and foot care in diabetes, hyperglycaemia and hypoglycaemia. The
distribution of interventions delivered and documented by the pharmacist in
each of the broader categories is shown in Figures 8 to 10.
Percent of patients who received interventions on blood glucose
monitoring (n=25)
HyperglycaemiaHypo
glycaemiaHGM
0
20
40
60
80
100
Perc
ent
Figure 8: Community pharmacists’ interventions relating to blood glucose
monitoring
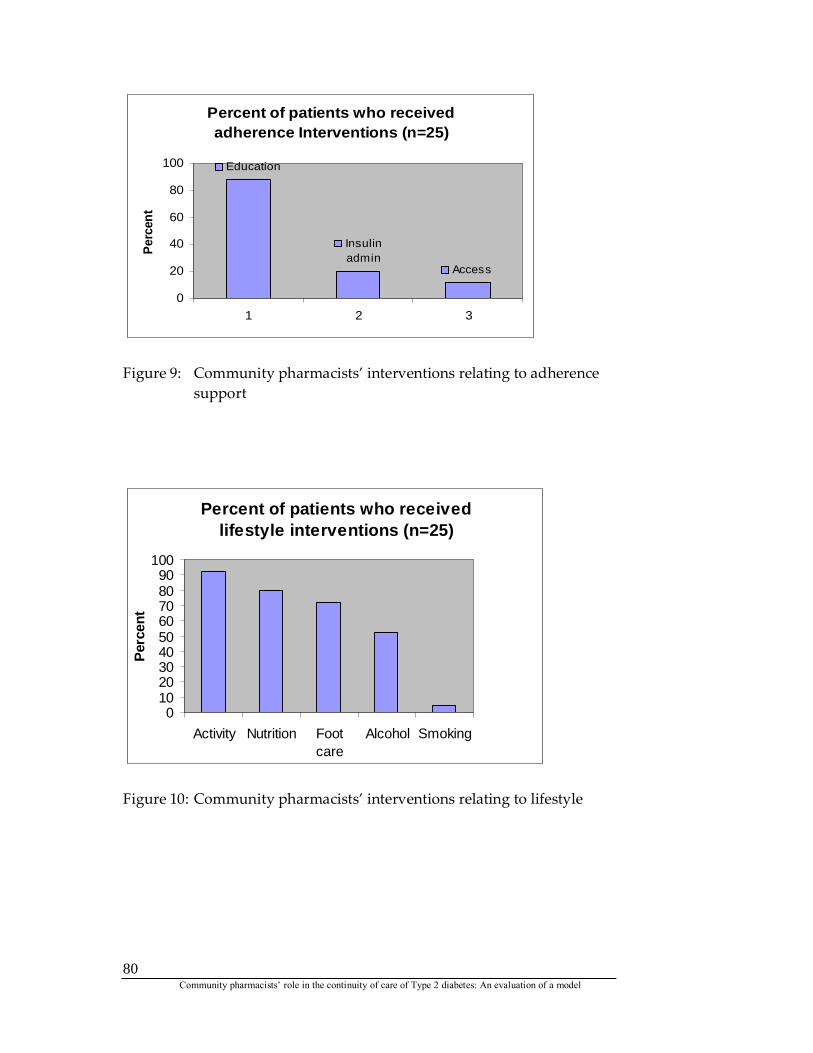
Community pharmacists’ role in the continuity of care of Type 2 diabetes: An evaluation of a model
80
Percent of patients who received adherence Interventions (n=25)
Insulin admin
Education
Access
0
20
40
60
80
100
1 2 3
Perc
ent
Figure 9: Community pharmacists’ interventions relating to adherence
support
Percent of patients who received lifestyle interventions (n=25)
0102030405060708090
100
Activity Nutrition Footcare
Alcohol Smoking
Perc
ent
Figure 10: Community pharmacists’ interventions relating to lifestyle
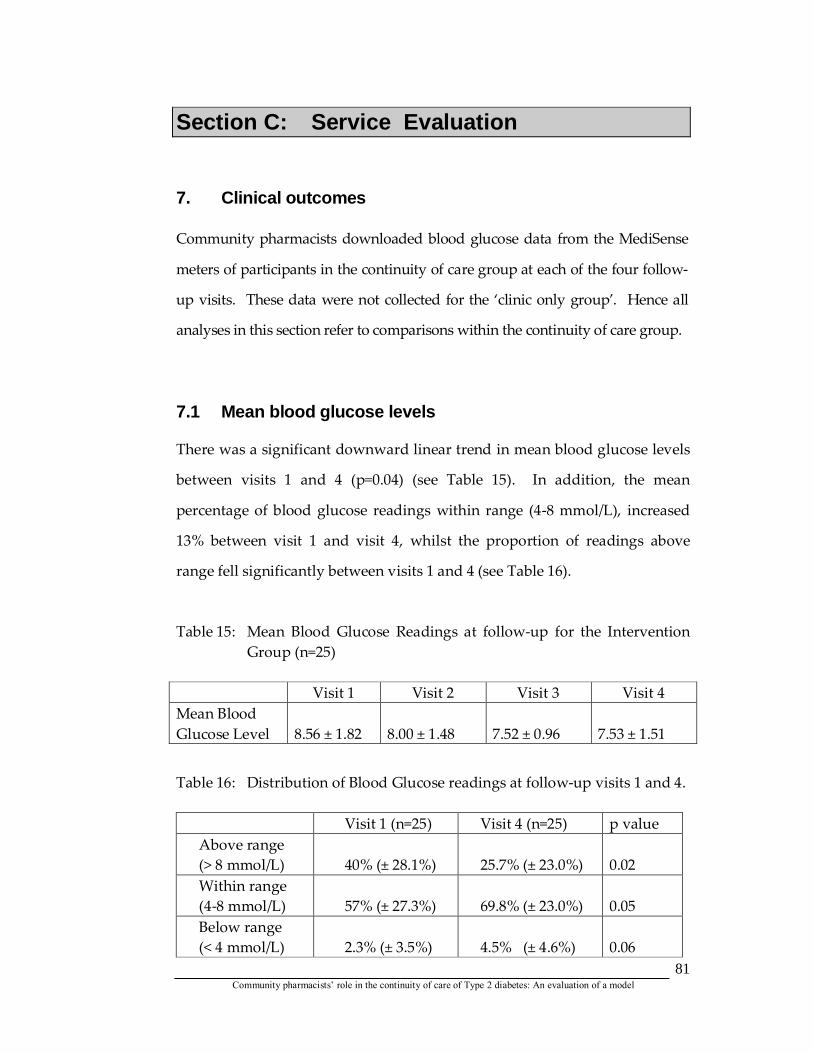
Community pharmacists’ role in the continuity of care of Type 2 diabetes: An evaluation of a model
81
Section C: Service Evaluation
7. Clinical outcomes Community pharmacists downloaded blood glucose data from the MediSense
meters of participants in the continuity of care group at each of the four follow-
up visits. These data were not collected for the ‘clinic only group’. Hence all
analyses in this section refer to comparisons within the continuity of care group.
7.1 Mean blood glucose levels There was a significant downward linear trend in mean blood glucose levels
between visits 1 and 4 (p=0.04) (see Table 15). In addition, the mean
percentage of blood glucose readings within range (4-8 mmol/L), increased
13% between visit 1 and visit 4, whilst the proportion of readings above
range fell significantly between visits 1 and 4 (see Table 16).
Table 15: Mean Blood Glucose Readings at follow-up for the Intervention Group (n=25)
Visit 1 Visit 2 Visit 3 Visit 4 Mean Blood Glucose Level
8.56 ± 1.82
8.00 ± 1.48
7.52 ± 0.96
7.53 ± 1.51
Table 16: Distribution of Blood Glucose readings at follow-up visits 1 and 4.
Visit 1 (n=25) Visit 4 (n=25) p value Above range (> 8 mmol/L)
40% (± 28.1%)
25.7% (± 23.0%)
0.02
Within range (4-8 mmol/L)
57% (± 27.3%)
69.8% (± 23.0%)
0.05
Below range (< 4 mmol/L)
2.3% (± 3.5%)
4.5% (± 4.6%)
0.06
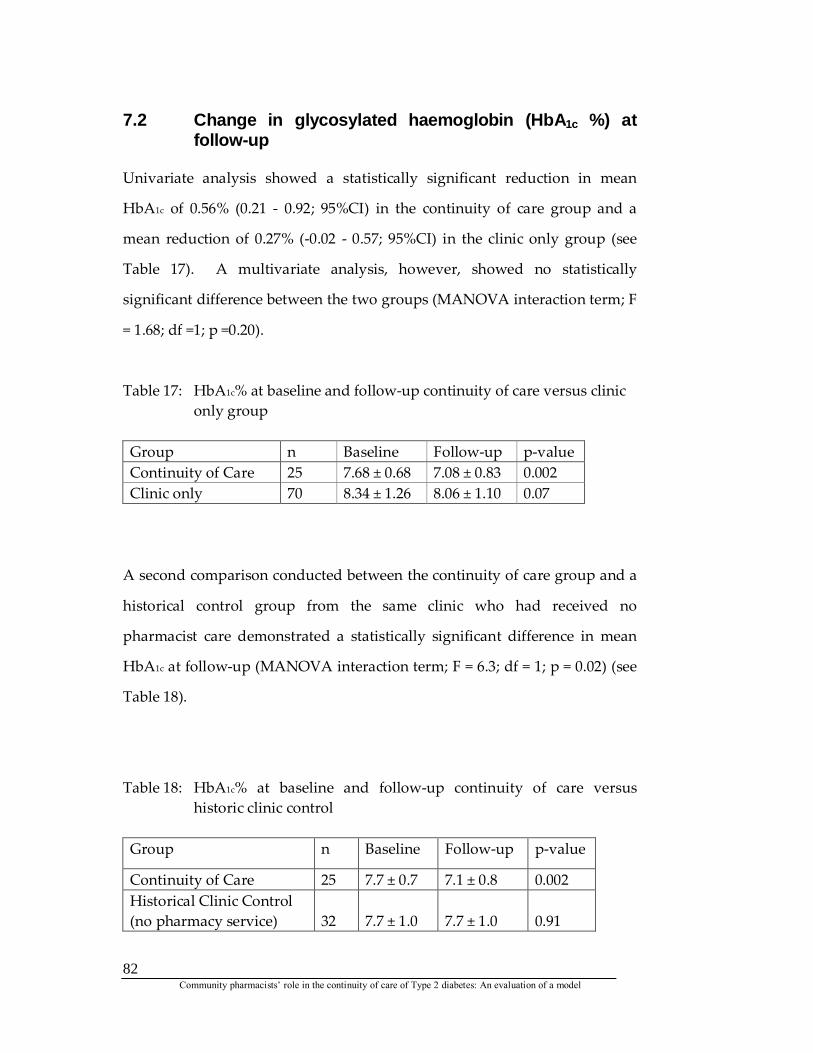
Community pharmacists’ role in the continuity of care of Type 2 diabetes: An evaluation of a model
82
7.2 Change in glycosylated haemoglobin (HbA1c %) at
follow-up Univariate analysis showed a statistically significant reduction in mean
HbA1c of 0.56% (0.21 - 0.92; 95%CI) in the continuity of care group and a
mean reduction of 0.27% (-0.02 - 0.57; 95%CI) in the clinic only group (see
Table 17). A multivariate analysis, however, showed no statistically
significant difference between the two groups (MANOVA interaction term; F
= 1.68; df =1; p =0.20).
Table 17: HbA1c% at baseline and follow-up continuity of care versus clinic only group
Group n Baseline Follow-up p-value Continuity of Care 25 7.68 ± 0.68 7.08 ± 0.83 0.002 Clinic only 70 8.34 ± 1.26 8.06 ± 1.10 0.07
A second comparison conducted between the continuity of care group and a
historical control group from the same clinic who had received no
pharmacist care demonstrated a statistically significant difference in mean
HbA1c at follow-up (MANOVA interaction term; F = 6.3; df = 1; p = 0.02) (see
Table 18).
Table 18: HbA1c% at baseline and follow-up continuity of care versus historic clinic control
Group n Baseline Follow-up p-value
Continuity of Care 25 7.7 ± 0.7 7.1 ± 0.8 0.002 Historical Clinic Control (no pharmacy service)
32
7.7 ± 1.0
7.7 ± 1.0
0.91
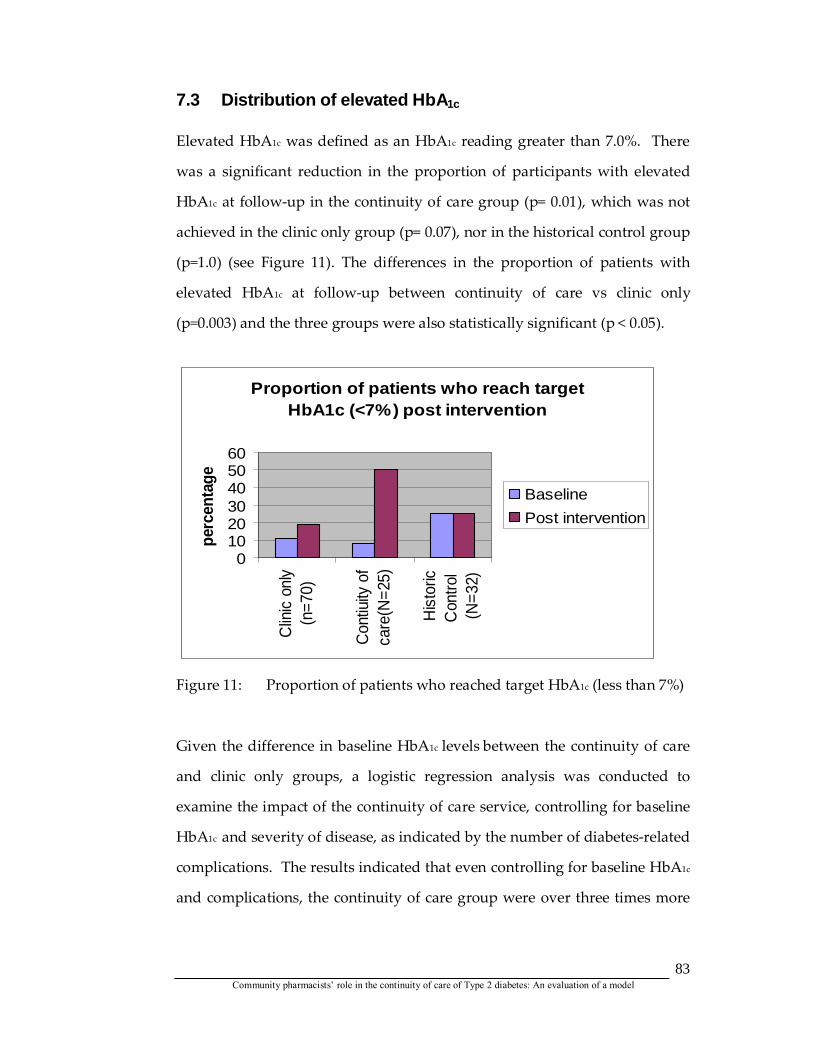
Community pharmacists’ role in the continuity of care of Type 2 diabetes: An evaluation of a model
83
7.3 Distribution of elevated HbA1c Elevated HbA1c was defined as an HbA1c reading greater than 7.0%. There
was a significant reduction in the proportion of participants with elevated
HbA1c at follow-up in the continuity of care group (p= 0.01), which was not
achieved in the clinic only group (p= 0.07), nor in the historical control group
(p=1.0) (see Figure 11). The differences in the proportion of patients with
elevated HbA1c at follow-up between continuity of care vs clinic only
(p=0.003) and the three groups were also statistically significant (p < 0.05).
Proportion of patients who reach target HbA1c (<7%) post intervention
0102030405060
Clin
ic o
nly
(n=7
0)
Con
tiuity
of
care
(N=2
5)
His
toric
Con
trol
(N=3
2)
perc
enta
ge
BaselinePost intervention
Figure 11: Proportion of patients who reached target HbA1c (less than 7%)
Given the difference in baseline HbA1c levels between the continuity of care
and clinic only groups, a logistic regression analysis was conducted to
examine the impact of the continuity of care service, controlling for baseline
HbA1c and severity of disease, as indicated by the number of diabetes-related
complications. The results indicated that even controlling for baseline HbA1c
and complications, the continuity of care group were over three times more
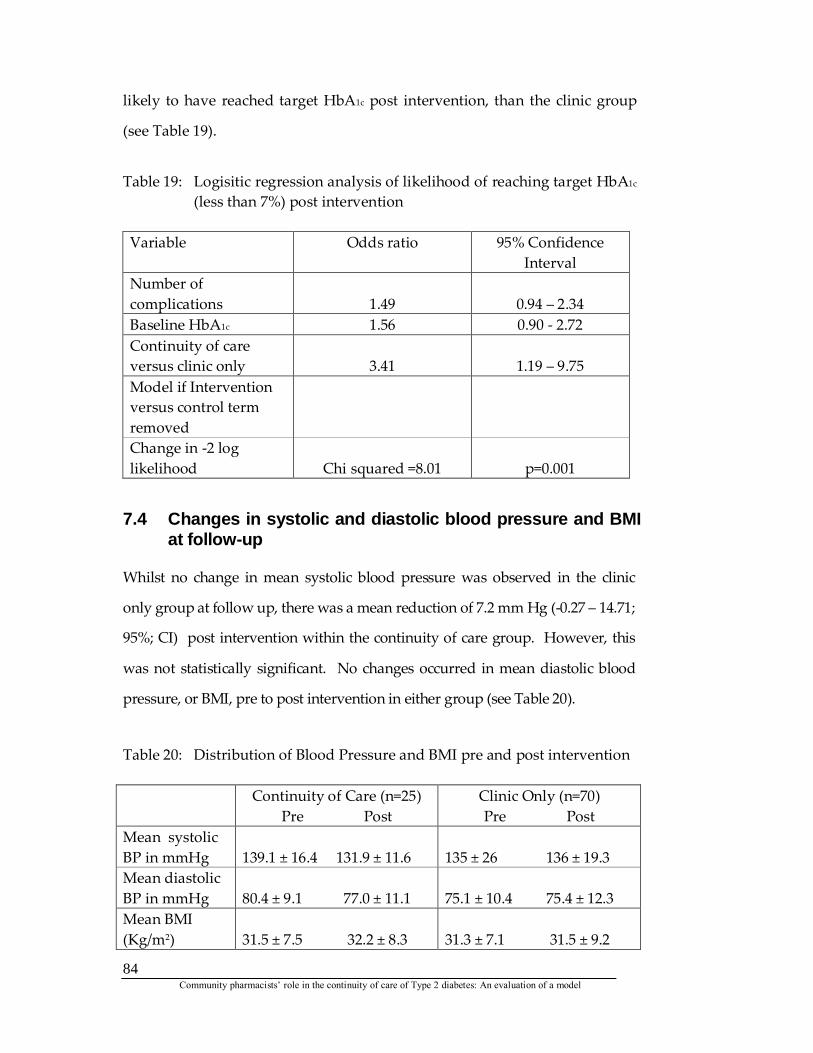
Community pharmacists’ role in the continuity of care of Type 2 diabetes: An evaluation of a model
84
likely to have reached target HbA1c post intervention, than the clinic group
(see Table 19).
Table 19: Logisitic regression analysis of likelihood of reaching target HbA1c
(less than 7%) post intervention Variable Odds ratio 95% Confidence
Interval Number of complications
1.49
0.94 – 2.34
Baseline HbA1c 1.56 0.90 - 2.72 Continuity of care versus clinic only
3.41
1.19 – 9.75
Model if Intervention versus control term removed
Change in -2 log likelihood
Chi squared =8.01
p=0.001
7.4 Changes in systolic and diastolic blood pressure and BMI at follow-up
Whilst no change in mean systolic blood pressure was observed in the clinic
only group at follow up, there was a mean reduction of 7.2 mm Hg (-0.27 – 14.71;
95%; CI) post intervention within the continuity of care group. However, this
was not statistically significant. No changes occurred in mean diastolic blood
pressure, or BMI, pre to post intervention in either group (see Table 20).
Table 20: Distribution of Blood Pressure and BMI pre and post intervention Continuity of Care (n=25)
Pre Post Clinic Only (n=70) Pre Post
Mean systolic BP in mmHg
139.1 ± 16.4 131.9 ± 11.6
135 ± 26 136 ± 19.3
Mean diastolic BP in mmHg
80.4 ± 9.1 77.0 ± 11.1
75.1 ± 10.4 75.4 ± 12.3
Mean BMI (Kg/m2)
31.5 ± 7.5 32.2 ± 8.3
31.3 ± 7.1 31.5 ± 9.2
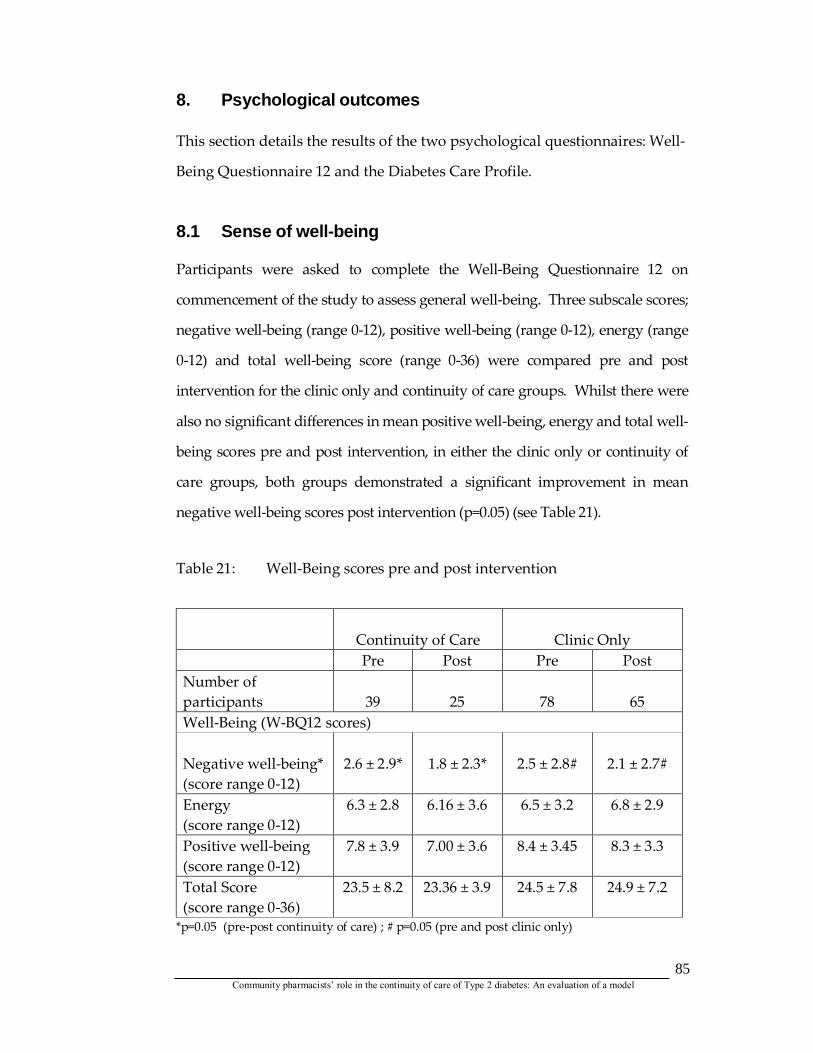
Community pharmacists’ role in the continuity of care of Type 2 diabetes: An evaluation of a model
85
8. Psychological outcomes This section details the results of the two psychological questionnaires: Well-
Being Questionnaire 12 and the Diabetes Care Profile.
8.1 Sense of well-being Participants were asked to complete the Well-Being Questionnaire 12 on
commencement of the study to assess general well-being. Three subscale scores;
negative well-being (range 0-12), positive well-being (range 0-12), energy (range
0-12) and total well-being score (range 0-36) were compared pre and post
intervention for the clinic only and continuity of care groups. Whilst there were
also no significant differences in mean positive well-being, energy and total well-
being scores pre and post intervention, in either the clinic only or continuity of
care groups, both groups demonstrated a significant improvement in mean
negative well-being scores post intervention (p=0.05) (see Table 21).
Table 21: Well-Being scores pre and post intervention
Continuity of Care
Clinic Only Pre Post Pre Post Number of participants
39
25
78
65
Well-Being (W-BQ12 scores) Negative well-being* (score range 0-12)
2.6 ± 2.9*
1.8 ± 2.3*
2.5 ± 2.8#
2.1 ± 2.7#
Energy (score range 0-12)
6.3 ± 2.8 6.16 ± 3.6 6.5 ± 3.2 6.8 ± 2.9
Positive well-being (score range 0-12)
7.8 ± 3.9 7.00 ± 3.6 8.4 ± 3.45 8.3 ± 3.3
Total Score (score range 0-36)
23.5 ± 8.2 23.36 ± 3.9 24.5 ± 7.8 24.9 ± 7.2
*p=0.05 (pre-post continuity of care) ; # p=0.05 (pre and post clinic only)
Community pharmacists’ role in the continuity of care of Type 2 diabetes: An evaluation of a model
86
8.2 Diabetes Care Profile The impact of the intervention on various aspects of diabetes care was
assessed using the selected scales from the Diabetes Care Profile [56]. Scale
scores were computed for each scale and compared at baseline and follow-up
for the clinic only and continuity of care groups.
Negative attitude scores decreased significantly in both the continuity of care
and clinic only groups, indicating less negatives attitudes to diabetes post
intervention (see Table 22). However, mean positive attitude scores improved
significantly in the continuity of care group, with no change in the clinic only
group (MANOVA; interaction term F = 4.3; df = 1; p = 0.04) (see Table 22). There
was a trend to improved self-reported care ability as demonstrated by the higher
mean scores at follow-up in the continuity of care group (p=0.06), with no
change seen in care ability scores in the clinic only group. Mean self reported
understanding of diabetes management scores also improved in both groups pre
and post intervention, but no differences were seen between groups (MANOVA;
interaction term F = 0.3; df = 1; p = 0.9). There were no differences between
groups pre and post intervention in diet adherence, exercise barriers, or control
problems (see Table 22).
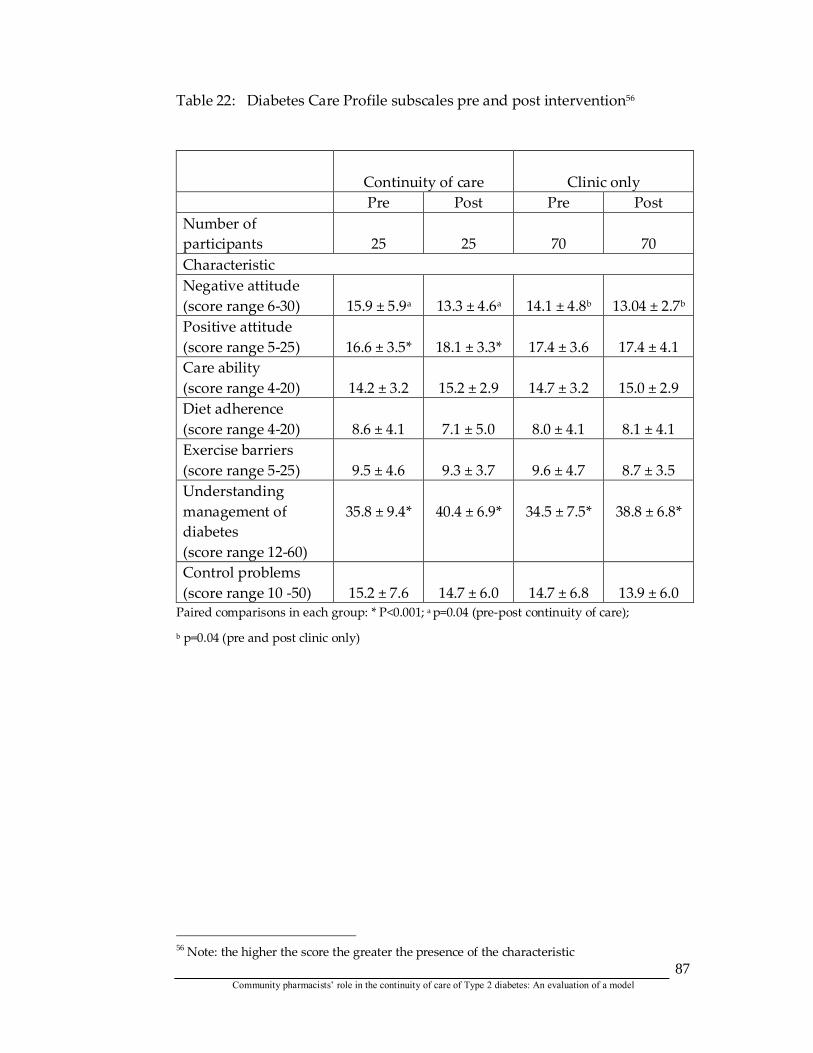
Community pharmacists’ role in the continuity of care of Type 2 diabetes: An evaluation of a model
87
Table 22: Diabetes Care Profile subscales pre and post intervention56
Continuity of care
Clinic only
Pre Post Pre Post Number of participants
25
25
70
70
Characteristic Negative attitude (score range 6-30)
15.9 ± 5.9a
13.3 ± 4.6a
14.1 ± 4.8b
13.04 ± 2.7b
Positive attitude (score range 5-25)
16.6 ± 3.5*
18.1 ± 3.3*
17.4 ± 3.6
17.4 ± 4.1
Care ability (score range 4-20)
14.2 ± 3.2
15.2 ± 2.9
14.7 ± 3.2
15.0 ± 2.9
Diet adherence (score range 4-20)
8.6 ± 4.1
7.1 ± 5.0
8.0 ± 4.1
8.1 ± 4.1
Exercise barriers (score range 5-25)
9.5 ± 4.6
9.3 ± 3.7
9.6 ± 4.7
8.7 ± 3.5
Understanding management of diabetes (score range 12-60)
35.8 ± 9.4*
40.4 ± 6.9*
34.5 ± 7.5*
38.8 ± 6.8*
Control problems (score range 10 -50)
15.2 ± 7.6
14.7 ± 6.0
14.7 ± 6.8
13.9 ± 6.0
Paired comparisons in each group: * P<0.001; a p=0.04 (pre-post continuity of care);
b p=0.04 (pre and post clinic only)
56 Note: the higher the score the greater the presence of the characteristic
Community pharmacists’ role in the continuity of care of Type 2 diabetes: An evaluation of a model
88
9. Adherence to medication Adherence was assessed by the Brief Medication Questionnaire (BMQ) scores.
9.1 Brief Medication Questionnaire Overall, there were no statistically significant differences between the three
mean screen scores and total BMQ scores for participants in the continuity of
care group compared with the clinic only group, either at baseline, or at follow-
up (see Table 23).
With respect to self-reported medication taking behaviour in the past week,
there was a reduction in the proportion of patients reporting having missed a
dose (24% versus 20%) and in the proportion of patients reporting difficulties in
remembering to take medication (16% versus 12%) in the continuity of care
group at follow up but these were not statistically significant (see Table 24).
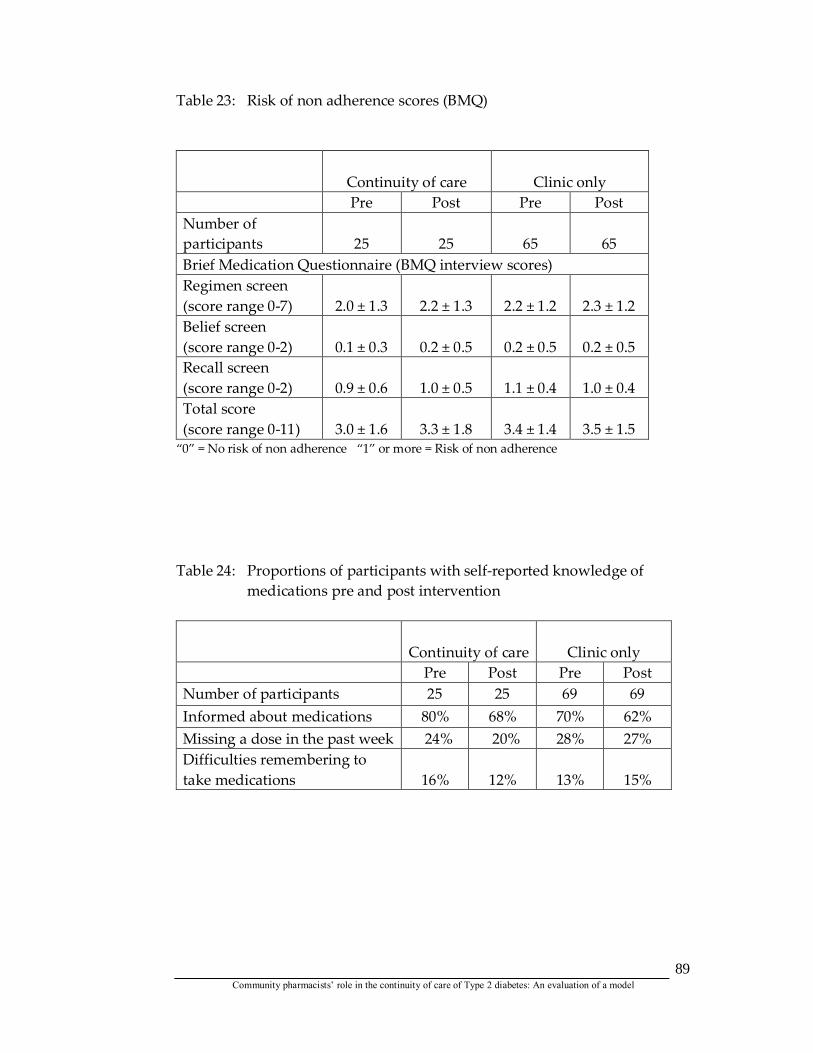
Community pharmacists’ role in the continuity of care of Type 2 diabetes: An evaluation of a model
89
Table 23: Risk of non adherence scores (BMQ)
Continuity of care
Clinic only Pre Post Pre Post Number of participants
25
25
65
65
Brief Medication Questionnaire (BMQ interview scores) Regimen screen (score range 0-7)
2.0 ± 1.3
2.2 ± 1.3
2.2 ± 1.2
2.3 ± 1.2
Belief screen (score range 0-2)
0.1 ± 0.3
0.2 ± 0.5
0.2 ± 0.5
0.2 ± 0.5
Recall screen (score range 0-2)
0.9 ± 0.6
1.0 ± 0.5
1.1 ± 0.4
1.0 ± 0.4
Total score (score range 0-11)
3.0 ± 1.6
3.3 ± 1.8
3.4 ± 1.4
3.5 ± 1.5
“0” = No risk of non adherence “1” or more = Risk of non adherence
Table 24: Proportions of participants with self-reported knowledge of medications pre and post intervention
Continuity of care
Clinic only Pre Post Pre Post Number of participants 25 25 69 69 Informed about medications 80% 68% 70% 62% Missing a dose in the past week 24% 20% 28% 27% Difficulties remembering to take medications
16%
12%
13%
15%
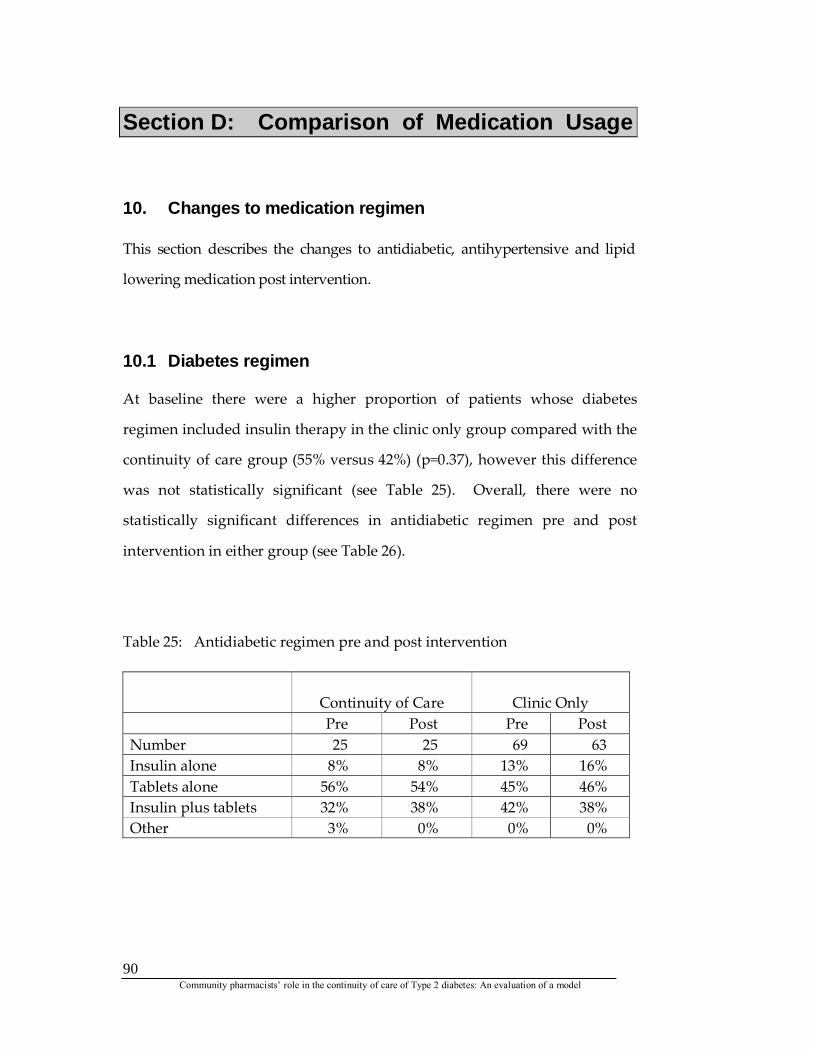
Community pharmacists’ role in the continuity of care of Type 2 diabetes: An evaluation of a model
90
Section D: Comparison of Medication Usage
10. Changes to medication regimen This section describes the changes to antidiabetic, antihypertensive and lipid
lowering medication post intervention.
10.1 Diabetes regimen At baseline there were a higher proportion of patients whose diabetes
regimen included insulin therapy in the clinic only group compared with the
continuity of care group (55% versus 42%) (p=0.37), however this difference
was not statistically significant (see Table 25). Overall, there were no
statistically significant differences in antidiabetic regimen pre and post
intervention in either group (see Table 26).
Table 25: Antidiabetic regimen pre and post intervention
Continuity of Care
Clinic Only Pre Post Pre Post Number 25 25 69 63 Insulin alone 8% 8% 13% 16% Tablets alone 56% 54% 45% 46% Insulin plus tablets 32% 38% 42% 38% Other 3% 0% 0% 0%
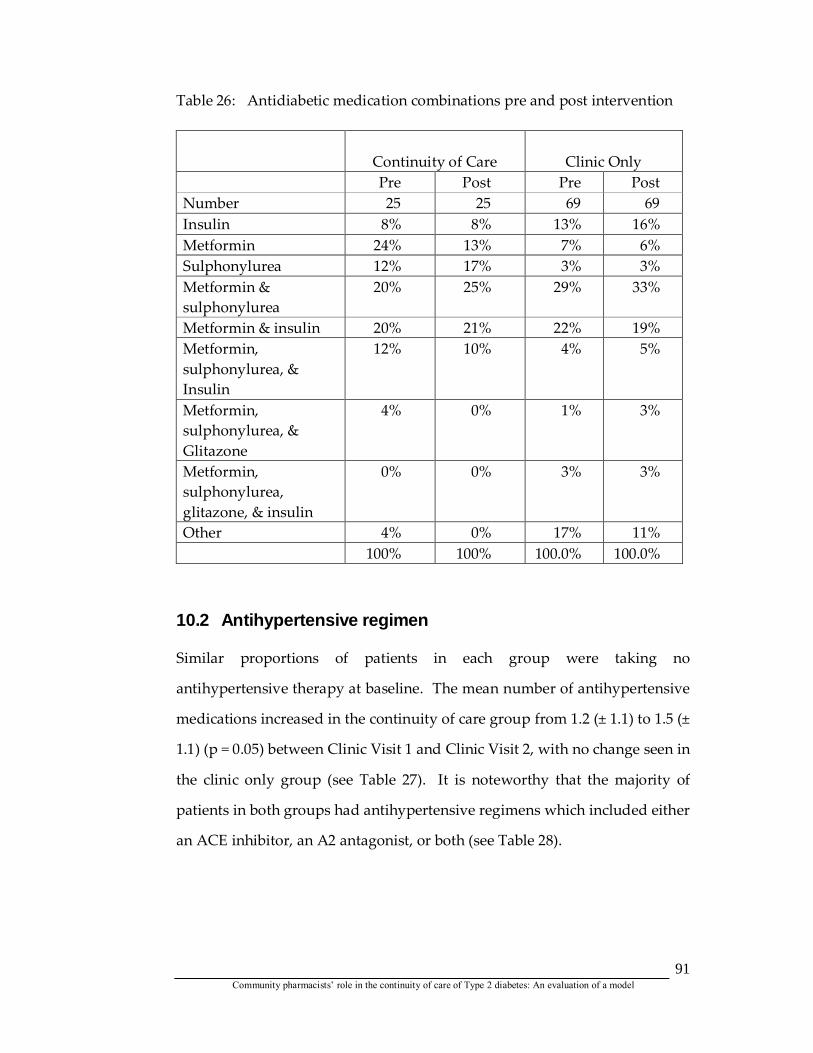
Community pharmacists’ role in the continuity of care of Type 2 diabetes: An evaluation of a model
91
Table 26: Antidiabetic medication combinations pre and post intervention
Continuity of Care
Clinic Only Pre Post Pre Post Number 25 25 69 69 Insulin 8% 8% 13% 16% Metformin 24% 13% 7% 6% Sulphonylurea 12% 17% 3% 3% Metformin & sulphonylurea
20% 25% 29% 33%
Metformin & insulin 20% 21% 22% 19% Metformin, sulphonylurea, & Insulin
12% 10% 4% 5%
Metformin, sulphonylurea, & Glitazone
4% 0% 1% 3%
Metformin, sulphonylurea, glitazone, & insulin
0% 0% 3% 3%
Other 4% 0% 17% 11% 100% 100% 100.0% 100.0%
10.2 Antihypertensive regimen Similar proportions of patients in each group were taking no
antihypertensive therapy at baseline. The mean number of antihypertensive
medications increased in the continuity of care group from 1.2 (± 1.1) to 1.5 (±
1.1) (p = 0.05) between Clinic Visit 1 and Clinic Visit 2, with no change seen in
the clinic only group (see Table 27). It is noteworthy that the majority of
patients in both groups had antihypertensive regimens which included either
an ACE inhibitor, an A2 antagonist, or both (see Table 28).

Community pharmacists’ role in the continuity of care of Type 2 diabetes: An evaluation of a model
92
Table 27: Antihypertensive regimens pre and post intervention: Number of medications
Continuity of care
Clinic only Pre Post Pre Post Number of participants 25 25 70 70 1 medication only 32% 28% 32% 28% 2 medications 32% 40% 22% 25% 3 or more medications 8% 12% 22% 20% No antihypertensive 28% 20% 25% 27% Mean number of medications
1.2 ± 1.1*
1.5 ± 1.1*
1.5 ± 1.3
1.5 ± 1.3
*p=0.05
Table 28: Antihypertensive regimens pre and post intervention: Type of medications
Continuity of care
Clinic only Pre Post Pre Post Number of participants 25 25 70 70 ACE inhibitor 52% 48% 39% 44% A2 antagonist 12% 24% 20% 16% ACE plus A2 antagonist 4% 4% 9% 7% Other 4% 4% 7% 4% No antihypertensive 28% 20% 26% 29%
10.3 Lipid lowering regimen Similar proportions of patients in each group were taking a lipid lowering
therapy pre and post intervention, with the majority of those on a statin (80%
versus 88%). Whilst there was an increase in the proportion of patients in the
continuity of care post intervention (60% to 68%), this difference was not
statistically significant (see Table 29).
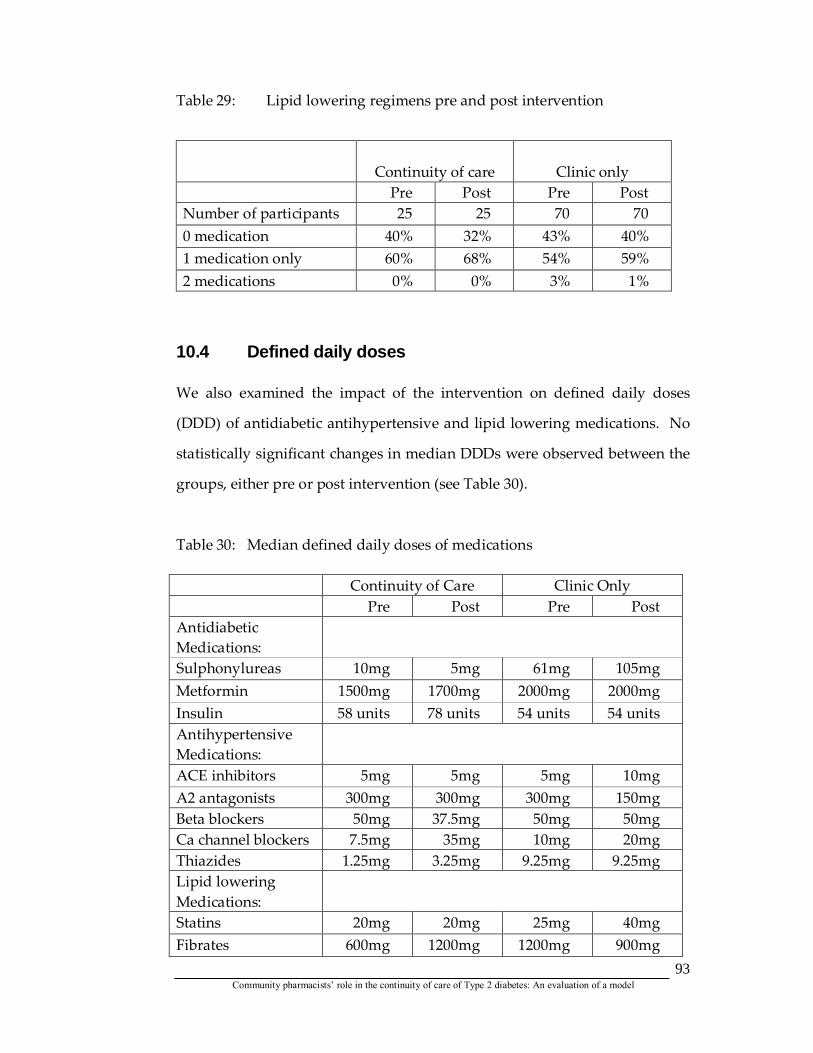
Community pharmacists’ role in the continuity of care of Type 2 diabetes: An evaluation of a model
93
Table 29: Lipid lowering regimens pre and post intervention
Continuity of care
Clinic only Pre Post Pre Post Number of participants 25 25 70 70 0 medication 40% 32% 43% 40% 1 medication only 60% 68% 54% 59% 2 medications 0% 0% 3% 1%
10.4 Defined daily doses We also examined the impact of the intervention on defined daily doses
(DDD) of antidiabetic antihypertensive and lipid lowering medications. No
statistically significant changes in median DDDs were observed between the
groups, either pre or post intervention (see Table 30).
Table 30: Median defined daily doses of medications
Continuity of Care Clinic Only Pre Post Pre Post
Antidiabetic Medications:
Sulphonylureas 10mg 5mg 61mg 105mg Metformin 1500mg 1700mg 2000mg 2000mg Insulin 58 units 78 units 54 units 54 units Antihypertensive Medications:
ACE inhibitors 5mg 5mg 5mg 10mg A2 antagonists 300mg 300mg 300mg 150mg Beta blockers 50mg 37.5mg 50mg 50mg Ca channel blockers 7.5mg 35mg 10mg 20mg Thiazides 1.25mg 3.25mg 9.25mg 9.25mg Lipid lowering Medications:
Statins 20mg 20mg 25mg 40mg Fibrates 600mg 1200mg 1200mg 900mg
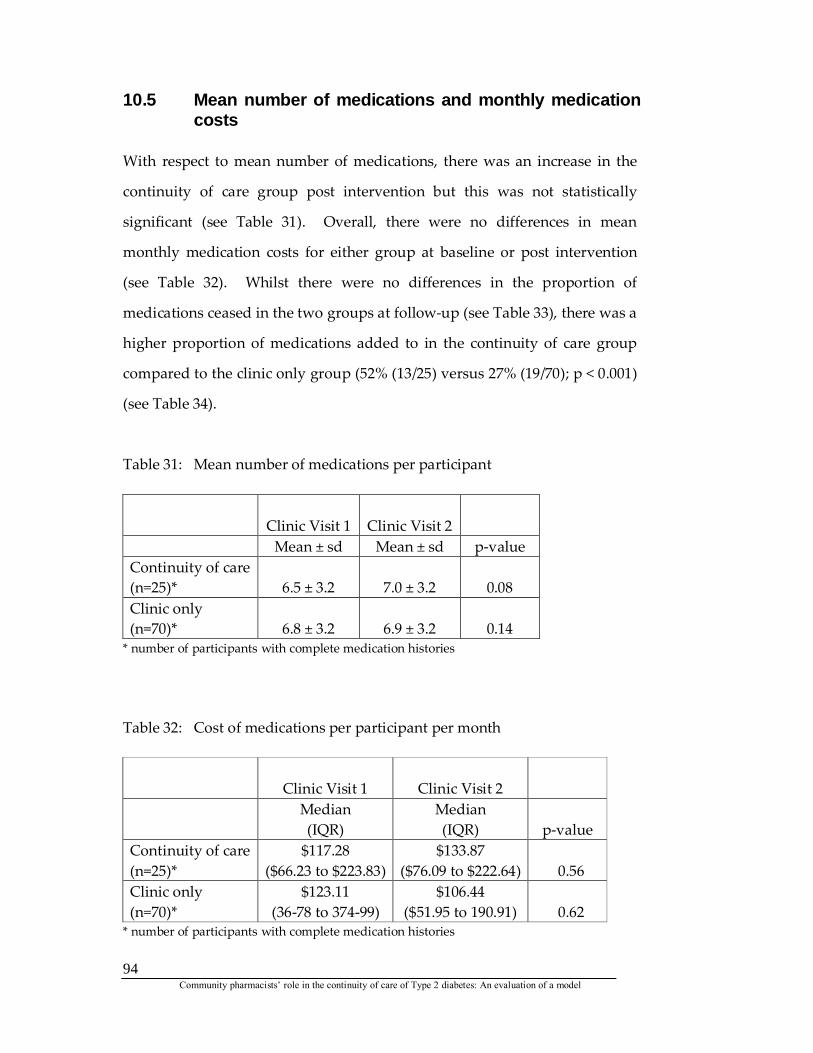
Community pharmacists’ role in the continuity of care of Type 2 diabetes: An evaluation of a model
94
10.5 Mean number of medications and monthly medication costs
With respect to mean number of medications, there was an increase in the
continuity of care group post intervention but this was not statistically
significant (see Table 31). Overall, there were no differences in mean
monthly medication costs for either group at baseline or post intervention
(see Table 32). Whilst there were no differences in the proportion of
medications ceased in the two groups at follow-up (see Table 33), there was a
higher proportion of medications added to in the continuity of care group
compared to the clinic only group (52% (13/25) versus 27% (19/70); p < 0.001)
(see Table 34).
Table 31: Mean number of medications per participant
Clinic Visit 1
Clinic Visit 2
Mean ± sd Mean ± sd p-value Continuity of care (n=25)*
6.5 ± 3.2
7.0 ± 3.2
0.08
Clinic only (n=70)*
6.8 ± 3.2
6.9 ± 3.2
0.14
* number of participants with complete medication histories
Table 32: Cost of medications per participant per month
Clinic Visit 1
Clinic Visit 2
Median (IQR)
Median (IQR)
p-value
Continuity of care (n=25)*
$117.28 ($66.23 to $223.83)
$133.87 ($76.09 to $222.64)
0.56
Clinic only (n=70)*
$123.11 (36-78 to 374-99)
$106.44 ($51.95 to 190.91)
0.62
* number of participants with complete medication histories
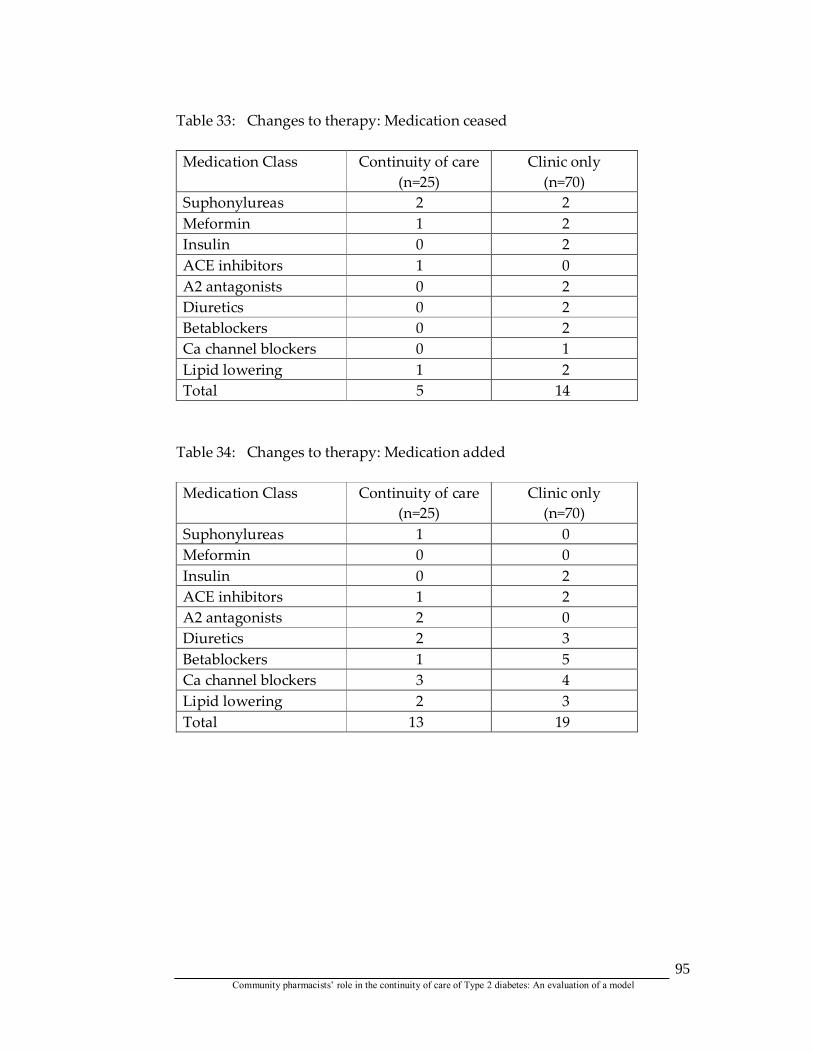
Community pharmacists’ role in the continuity of care of Type 2 diabetes: An evaluation of a model
95
Table 33: Changes to therapy: Medication ceased Medication Class Continuity of care
(n=25) Clinic only
(n=70) Suphonylureas 2 2 Meformin 1 2 Insulin 0 2 ACE inhibitors 1 0 A2 antagonists 0 2 Diuretics 0 2 Betablockers 0 2 Ca channel blockers 0 1 Lipid lowering 1 2 Total 5 14
Table 34: Changes to therapy: Medication added Medication Class Continuity of care
(n=25) Clinic only
(n=70) Suphonylureas 1 0 Meformin 0 0 Insulin 0 2 ACE inhibitors 1 2 A2 antagonists 2 0 Diuretics 2 3 Betablockers 1 5 Ca channel blockers 3 4 Lipid lowering 2 3 Total 13 19
Community pharmacists’ role in the continuity of care of Type 2 diabetes: An evaluation of a model
96
Section E: Economic Analysis
11. Economic analysis This section, which focuses on the economic analyses relating to the service,
consists of seven subsections. These focus on the cost of service provision,
cost of health care resources, cost of medications, the total cost of providing
the enhanced service, effectiveness, incremental cost effectiveness ratio, and a
sensitivity analysis.
11.1 Cost of service provision The average time spent by the pharmacist in the clinic to deliver the service
was approximately 20 minutes at baseline and 20 minutes at the final visit;
making a total of 40 minutes per patient. Thus, the average cost for the clinic
visits was $26.67 (at $40 per hour). The average time spent by the
community pharmacist in providing the service to each patient over the
study period in the continuity of care group was 2.35 hours. Thus, the cost
of the service per patient was $94 (at $40 per hour).
The average cost for printouts per patient for the study period (four follow-
up visits) was $3. The average cost of the phone calls made by a community
pharmacist per patient per intervention equalled $0.16. Thus, the total cost
for service provision in the continuity of care group was $123.83 per patient.
The cost of training pharmacists for two days was $2,050. This was divided
over 24 patients, which yielded a cost of training per continuity of care
patient $85.41.
Community pharmacists’ role in the continuity of care of Type 2 diabetes: An evaluation of a model
97
11.2 Cost of health care resources For the continuity of care group, there was only one emergency department
visit which did not lead to admission to hospital (see Table 35). Thus, the
average cost of emergency department visits was $13.75, since there were 24
patients in this group. There were 86 GP visits in this time period and thus
the average cost of GP visits was $108.22. There was only one hospitalisation
in this time period for the continuity of care group, at a cost of $13,248 (AR-
DRG K01Z). Thus, the average cost of hospitalizations was $552 (see Table
35). The total cost of health care resources used in the continuity of care
group was $673.97 per patient.
For the clinic only group, there were three emergency department visits.
However, two of these resulted in subsequent hospitalisation. Thus, the total
cost of these was $4.71 per patient ($330 X 1 divided by 70). There was a total
of 218 GP visits by the clinic only patients. Therefore, the average cost of GP
visits was $94.05 (see Table 36). There were 9 hospitalisations in the clinic
only group at an average cost of $745 per patient. Thus, the total cost of
health care resources used by the clinic only group was $843.76 per patient.
11.3 Cost of medications For the continuity of care group, the median cost of medications per patient
at Clinic Visit 1 was $114.44 and at Clinic Visit 2 was $126.63. Thus, the
median cost per patient per month was $120.54 and per six months (per
service) was $723.24. For the clinic only group, the median cost per patient at
Clinic Visit 1 was $123.11 and at Clinic Visit 2 was $106.45. The average was
thus $114.12 for one month and $684.72 after six months.
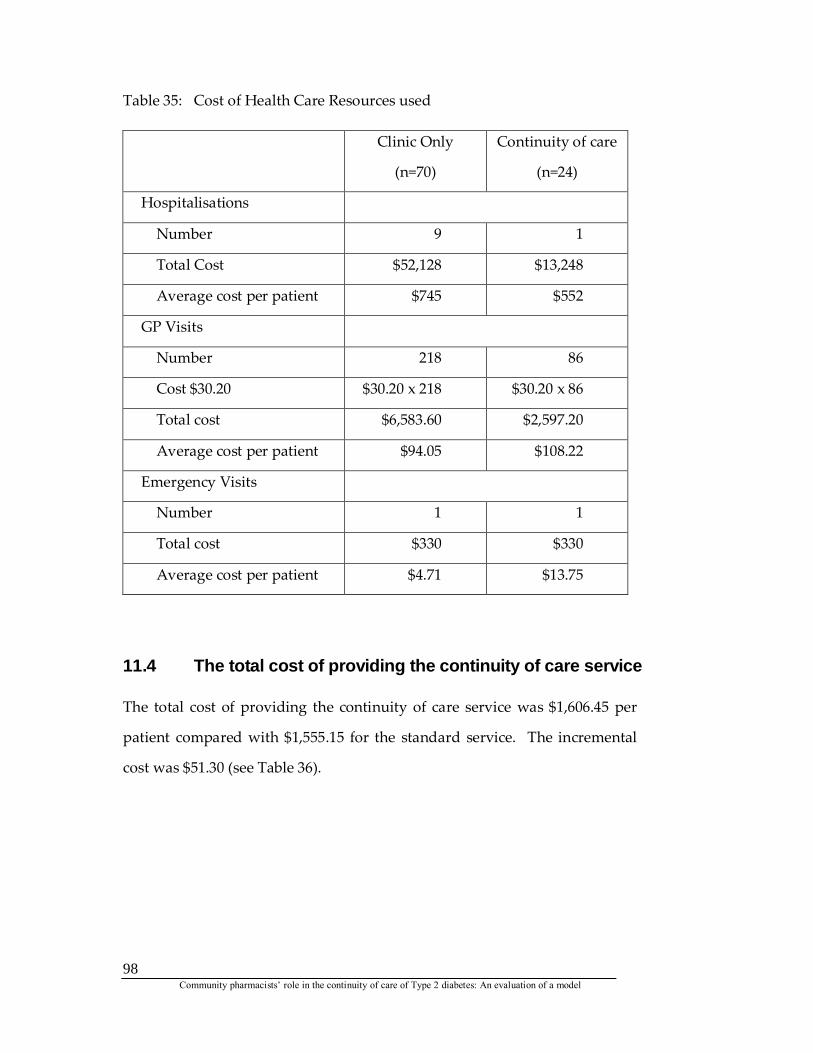
Community pharmacists’ role in the continuity of care of Type 2 diabetes: An evaluation of a model
98
Table 35: Cost of Health Care Resources used Clinic Only
(n=70)
Continuity of care
(n=24)
Hospitalisations
Number 9 1
Total Cost $52,128 $13,248
Average cost per patient $745 $552
GP Visits
Number 218 86
Cost $30.20 $30.20 x 218 $30.20 x 86
Total cost $6,583.60 $2,597.20
Average cost per patient $94.05 $108.22
Emergency Visits
Number 1 1
Total cost $330 $330
Average cost per patient $4.71 $13.75
11.4 The total cost of providing the continuity of care service The total cost of providing the continuity of care service was $1,606.45 per
patient compared with $1,555.15 for the standard service. The incremental
cost was $51.30 (see Table 36).
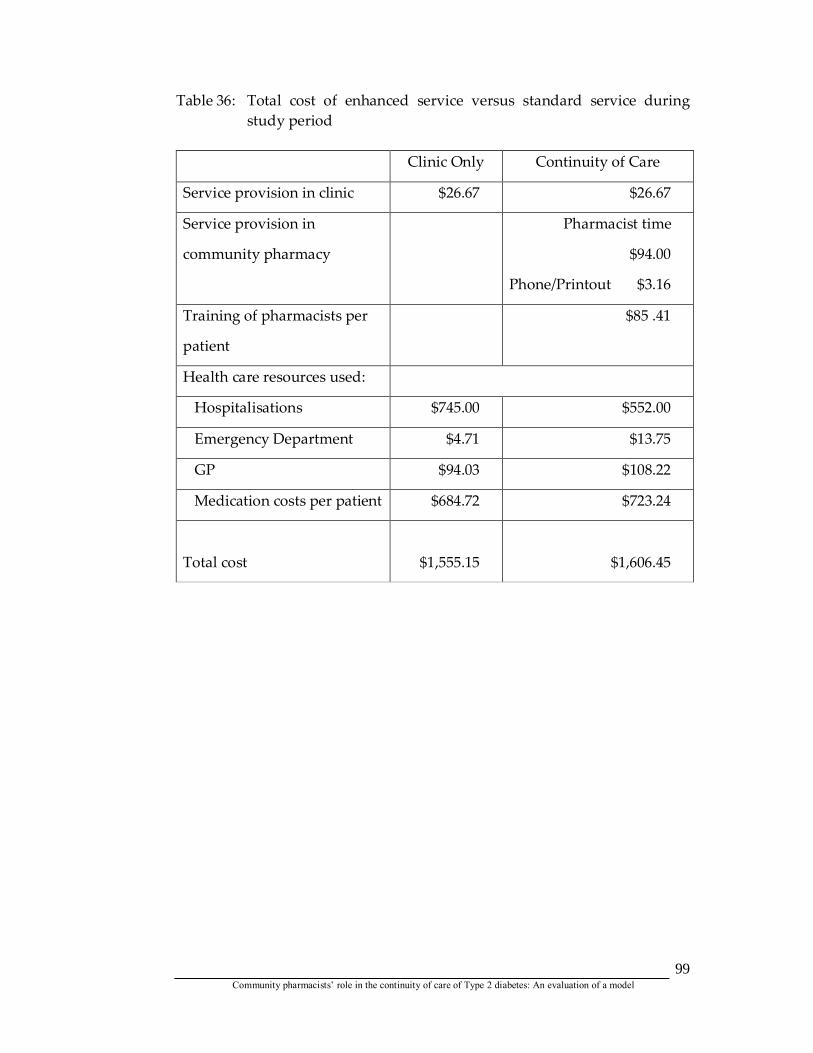
Community pharmacists’ role in the continuity of care of Type 2 diabetes: An evaluation of a model
99
Table 36: Total cost of enhanced service versus standard service during study period
Clinic Only Continuity of Care
Service provision in clinic $26.67 $26.67
Service provision in
community pharmacy
Pharmacist time
$94.00
Phone/Printout $3.16
Training of pharmacists per
patient
$85 .41
Health care resources used:
Hospitalisations $745.00 $552.00
Emergency Department $4.71 $13.75
GP $94.03 $108.22
Medication costs per patient $684.72 $723.24
Total cost
$1,555.15
$1,606.45
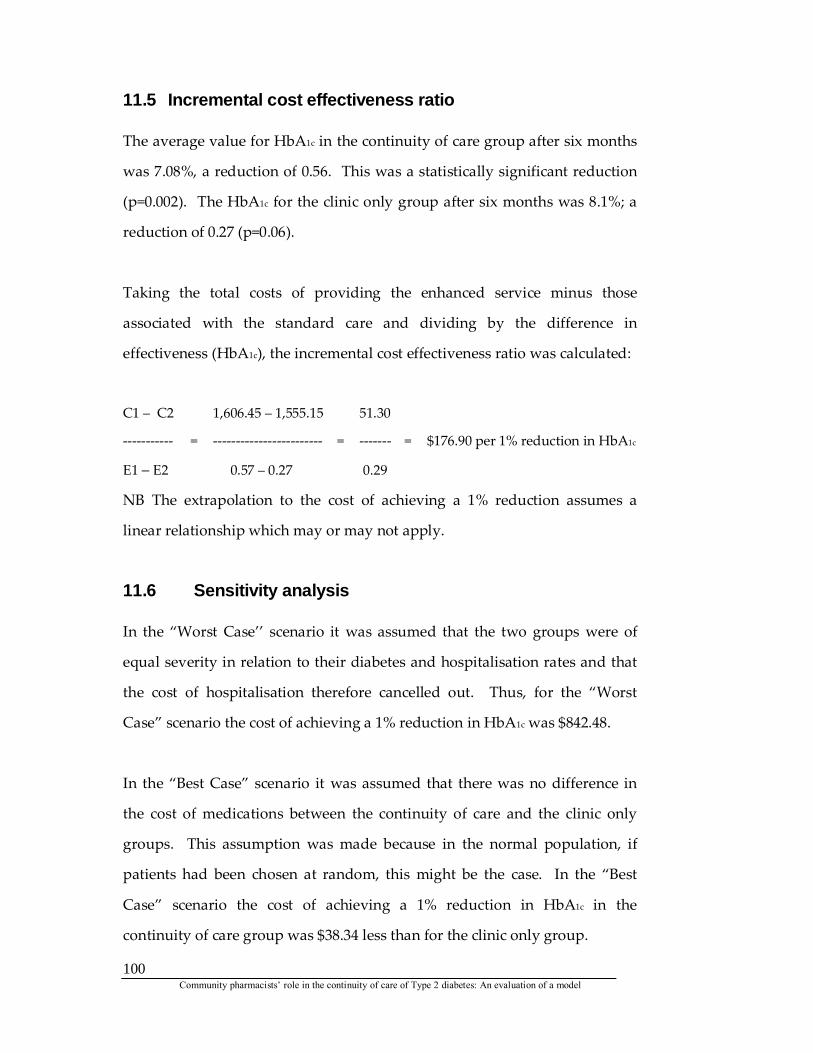
Community pharmacists’ role in the continuity of care of Type 2 diabetes: An evaluation of a model
100
11.5 Incremental cost effectiveness ratio The average value for HbA1c in the continuity of care group after six months
was 7.08%, a reduction of 0.56. This was a statistically significant reduction
(p=0.002). The HbA1c for the clinic only group after six months was 8.1%; a
reduction of 0.27 (p=0.06).
Taking the total costs of providing the enhanced service minus those
associated with the standard care and dividing by the difference in
effectiveness (HbA1c), the incremental cost effectiveness ratio was calculated:
C1 – C2 1,606.45 – 1,555.15 51.30
----------- = ------------------------ = ------- = $176.90 per 1% reduction in HbA1c
E1 – E2 0.57 – 0.27 0.29
NB The extrapolation to the cost of achieving a 1% reduction assumes a
linear relationship which may or may not apply.
11.6 Sensitivity analysis In the “Worst Case’’ scenario it was assumed that the two groups were of
equal severity in relation to their diabetes and hospitalisation rates and that
the cost of hospitalisation therefore cancelled out. Thus, for the “Worst
Case” scenario the cost of achieving a 1% reduction in HbA1c was $842.48.
In the “Best Case” scenario it was assumed that there was no difference in
the cost of medications between the continuity of care and the clinic only
groups. This assumption was made because in the normal population, if
patients had been chosen at random, this might be the case. In the “Best
Case” scenario the cost of achieving a 1% reduction in HbA1c in the
continuity of care group was $38.34 less than for the clinic only group.
Community pharmacists’ role in the continuity of care of Type 2 diabetes: An evaluation of a model
101
DISCUSSION The results of this study suggest that the continuity of care model for patients
with type 2 diabetes, which comprised an initial consultation with a
specialist pharmacist in the hospital, written communication to the patient’s
community pharmacist and general practitioner, followed by ongoing
monitoring of the patient with type 2 diabetes by the community pharmacist
at no more than two monthly intervals, resulted in improvements in
glycaemic control based on improvements in mean blood glucose levels and
reduction in glycosylated haemoglobin. Improvements in patient attitudes
towards their diabetes and understanding of their diabetes management
were observed. It was also shown to be cost effective for the health care
system. The clinic only service, which only comprised of an initial
consultation with a specialist pharmacist in the hospital and served as the
main comparator in this study, also demonstrated improvements in
glycaemic control and other humanistic outcomes for patients, however, the
effects were much smaller than observed in the continuity of care model.
The positive impact of the continuity of care model, with regards to
glycaemic control, is further highlighted by a comparison of a historical
control group, comprising a cohort of patients with type 2 diabetes attending
the same clinic prior to the advent of the clinic pharmacist. In the historical
control group, glycaemic control remained unchanged over a 9 month period
compared to the significant improvement seen in the patients who received
the continuity of care service in this study.
The success of the continuity of care model supports findings in other
pharmacist-delivered diabetes programs, where similar changes in clinical
Community pharmacists’ role in the continuity of care of Type 2 diabetes: An evaluation of a model
102
outcomes have been reported [1, 39-43, 46]. It is noteworthy that the impact
of the continuity of care model on glycaemic control (change in mean HbA1c
-0.6 (± 1.1) versus -0.5 (± 0.8), was of similar magnitude to that achieved in the
SugarCare study, especially considering the follow-ups in the community
pharmacies in this study were less frequent, and took place every two
months on average, compared with monthly follow ups in the SugarCare
study [1].
The cohort of recruited patients clearly comprised a group whose clinical
targets (i.e., HbA1c , blood pressure) and self management behaviours were
suboptimal. Not withstanding their attendance at a diabetes clinic, a
substantial one-sixth of all the type 2 diabetic patients who agreed to
participate in the study had not received diabetes education. Even more
disconcerting is the fact that more than one quarter (27.1%) had not been told
to follow an exercise program. Over a third could not identify the indication
of many of their medications and had only moderate understanding of their
diabetes management.
The continuity of care model implemented in this study represents a unique
partnership between clinic and community pharmacist in the care of patients
with type 2 diabetes. The rationale for this model resides in the
implementation of processes designed to address some previously identified
barriers to care [18] namely the lack of communication between health care
practitioners involved in the care of patients with type 2 diabetes. Another
purpose was to provide more intensive support to improve patients’ self-
management skills, which has previously been shown to improve glycaemic
control, patient satisfaction and quality of life [63].
Community pharmacists’ role in the continuity of care of Type 2 diabetes: An evaluation of a model
103
In the clinic, the pharmacist focused on assessment of patient’s knowledge of
and adherence to diabetes regimen and drug-related problems, such as
adverse effects, or sub optimal treatment. Once an issue had been identified,
such as a lack of understanding of how the medications work, the pharmacist
used this opportunity to educate the patient. If a drug-related problem
required action by the endocrinologist, this was annotated in the clinic
medical notes. Alternatively, if a drug-related problem required action by
the community pharmacist (e.g., a Webster pack), or by the general
practitioner, this was communicated in the written report prepared and sent
to the general practitioner and community pharmacist for each of the
continuity of care patients.
In the community pharmacy, all patients were given a MediSense meter and
instructed on its use. Subsequently, the pharmacist downloaded the blood
glucose readings and gave feedback to the patient at each of the four visits.
Other aspects of the service were tailored to the individual patient’s needs.
These included providing adherence support, advice about medication issues
and instruction on lifestyle issues. From the pharmacists’ documentation, it
is clear that they delivered a range of interventions targeting these various
aspects of the management of diabetes.
A key finding of this study was that those patients with type 2 diabetes who
received the services of the pharmacist, both in the clinic and the community,
were more than three times as likely to achieve target HbA1c levels (less than
7%), than those who received the services of the pharmacist in the clinic only,
or those who never received a pharmacists service (historical control). Strict
control of diabetes can result in significant risk reduction in terms of the
onset of complications [64, 65]. Intensive blood glucose and blood pressure
Community pharmacists’ role in the continuity of care of Type 2 diabetes: An evaluation of a model
104
control in patients with Type 2 diabetes also has been shown to be cost
effective in terms of managing these complications [35]. The fact that the
mean blood glucose values fell steadily in the continuity of care patients,
suggests they also achieved better blood glucose control; as do the figures for
the proportion of readings outside the normal range, which also decreased in
this group of patients.
Good diabetes control depends on a variety of factors, the most important of
which is achieving the right balance between medication, energy expenditure
(physical activity) and energy inputs (diet). Much of this also depends on
appropriate self-care behaviours being undertaken by the patient.
Psychological factors such as depression, negative attitudes and poor self-
efficacy can also impact on diabetes care and critically influence adherence to
the required self care behaviours [63]. The results showed that patients in
the continuity of care model at follow-up had more positive and less
negative attitudes towards their diabetes and greater confidence in their care
ability, as demonstrated by improvements in mean negative attitude,
positive attitude and care ability scale score in the Diabetes Care Profile and
improvements in negative well being subscale scores of the WBQ-12. The
clinic only group improved in negative attitude and negative well being
scores and both groups demonstrated improvements in understanding of the
management of diabetes, which may be attributable to the education and
support delivered by the clinic pharmacist.
No changes in the risk of non-adherence to taking medication in either group
were detected using the mean total BMQ scores at baseline and follow-up.
However, there was a reduction in the proportion of patients who reported
missing a dose in the previous week and in the proportion of patients
Community pharmacists’ role in the continuity of care of Type 2 diabetes: An evaluation of a model
105
reporting difficulties in remembering to take their medications in the
continuity of care group (no changes were seen in the clinic only group).
Again this suggests that the community pharmacist component of the
continuity of care service was able to positively influence adherence to
medication behaviour.
Overall, there was a significant increase in mean medications per patient in
the continuity of care group, with none observed in the clinic only group.
There were substantial changes to therapy especially in antihypertensive
medications reflecting an emphasis on achieving better blood pressure
control and thus contributing to the significant clinical improvements that
were observed. It also suggests that the communication between clinic
pharmacist, GP and community pharmacist may have contributed to this
outcome. It is noteworthy that this was achieved without a significant
increase in medication costs.
The continuity of care service was able to achieve a mean 0.6% reduction in
HbA1c in patients who received the enhanced service after 6 months while
the HbA1c of patients in the clinic only group reduced by only 0.3%. The
incremental cost of providing the service and achieving this gain was $51.30
per patient. The incremental cost effectiveness ratio of $153.90 per 1%
reduction in HbA1c achieved in this study compares very favourably with the
incremental cost effectiveness ratio of $910.20 per 1% reduction in HbA1c
achieved in the SugarCare study. Even the worst case scenario in this study
compared favourably.
This cost in the short term could translate into a huge monetary cost saving
to the health care sector and personal cost saving to the patient in the longer
Community pharmacists’ role in the continuity of care of Type 2 diabetes: An evaluation of a model
106
term. In Australia, the total cost of diabetes exceeds $1 billion annually,
approximately $2,800 per diagnosed case [66]. In the United States, the cost
of complications such as acute myocardial infarction has been estimated to
be US$27,630 (1996) per event and $2,185 for annual patient maintenance,
while the cost of end stage renal failure has been estimated to be US$53,659
(1996) per patient per year [67].
One study conducted in the United States has predicted that comprehensive
treatment which maintains an HbA1c value of 7.2% reduces the cumulative
incidence of blindness, end-stage renal disease, and lower extremity
amputation by 72, 87 and 67% respectively [68]. Wagner et al. [69] have
shown that a sustained reduction in HbA1c in adults with diabetes is
associated with significant cost savings within one to two years. While these
cost savings may not be demonstrated in terms of a reduction in medication
cost or pharmaceutical services they can be demonstrated in a reduction in
morbidity and use of other health care resources.
It should be noted that there were certain limitations associated with this
study. In the first place, difficulties were experienced in recruiting
community pharmacists in strategic geographic locations. A number of
pharmacists who were willing to participate could not because of difficulties,
such as computing hardware incompatibilities. Other pharmacists, after
completing the training cited that they could commit themselves to continue
in the project.
The patients originally recruited into the study were well matched on most
demographic and diabetes related characteristics. The higher dropout rate in
the continuity of care group (14/39) compared with the clinic only group
Community pharmacists’ role in the continuity of care of Type 2 diabetes: An evaluation of a model
107
(9/79) resulted in some significant differences in the clinic versus continuity
of care samples, especially baseline HbA1c, which was higher at baseline in
the clinic only group (8.3% versus 7.7%). This was controlled for statistically
in the regression analysis.
It was also not possible to randomly assign patients to the two groups since
participation in the continuity of care group depended on the patient being
willing to visit a participating pharmacy for the ensuing six months.
Although a large number of pharmacies throughout the geographic region
surrounding the clinics were recruited and trained, it was still difficult to
match patient with pharmacies. This also contributed to the dropout rate for
the continuity of care group. Hence the continuity of care group represented
a “willing” group. This limits the generalisability of the conclusions.
However, in the real world, community pharmacists will only ever be able to
provide services to patients willing to engage with them. In choosing to
analyse the data on the basis of the evaluable group due to lack of available
data on dropout subjects, we may have overestimated the effect of the
continuity of care intervention and not taken account of non-compliance in
the real world .
CONCLUSION In conclusion, the continuity of care service implemented in this study has
the potential to contribute to improved management of patients with type 2
diabetes. Equally, it has the capacity to enhance the contribution of a
pharmacist, both within community and clinic settings to the care of patients
with type 2 diabetes.
Community pharmacists’ role in the continuity of care of Type 2 diabetes: An evaluation of a model
108
REFERENCES
1. Armour C, Krass I, Taylor S, Smith C, Hourihan F. SugarCare: Development Implementation and Evaluation of a Best Practice Guidelines for a Disease Management Program and Professional Remuneration Strategy for Diabetes in Community Pharmacy: Final report. The University of Sydney, April, 2002.
2. Harris P, Joyner B, Phillips P, Webster C. Diabetes management in general practice. Diabetes Australia Publication NP 1005, Sydney, 2003/4.
3. New South Wales Department of Health. Consensus guidelines for the clinical management of diabetes mellitus in adults. New South Wales State Health Publication, 1998.
4. Commonwealth Department of Health and Aged Care and Australian Institute of Health and Welfare. 1999. National Health Priority Areas Report: Diabetes Mellitus 1998. Canberra: AIHW Cat. No. PHE 10. HEALTH and AIHW.
5. Australian Institute of Health and Welfare (AIHW). 1996. First Report on National Health Priority Areas (1996). Canberra: AIHW, ISBN No: 0 642 24716 1.
6. Zimmet P. Globalization, coca-colonization and the chronic disease epidemic: Can the Doomsday scenario be averted? J Intern Med; 2001; 249: 301-310.
7. Mann JI. Diet and risk of coronary heart disease and type 2 diabetes. Lancet 2002; 360: 783-789.
8. Mann J. Stemming the tide of diabetes mellitus. Lancet 2000; 356: 1454-1455.
9. Silink M. Childhood diabetes: A global perspective. Hormone Research 2002; 57: 1-5.
10. Amschler DH. The alarming increase of type 2 diabetes in children. J School Health 2002; 72: 39-41.
11. Fagot-Campagna A, Narayan KM, Imperatore G. Type 2 diabetes in children. BMJ 2001; 322: 377-378.
12. Brosnan CA, Upchurch S, Schreiner B. Type 2 diabetes in children and adolescents: An emerging disease. J Ped Health Care 2001; 15: 187-193.
13. International Diabetes Institute. 2001. Diabesity and Associated Disorders in Australia 2000. The final report of the Australian Diabetes, Obesity and Lifestyle Study (AusDiab).
14. Gan SK, Chisholm DJ. The type 2 diabetes epidemic: A hidden menace. MJA 2001; 175: 65-66.
Community pharmacists’ role in the continuity of care of Type 2 diabetes: An evaluation of a model
109
15. National Diabetes Strategy 2000-2004. Canberra: Commonwealth Department of Health and Aged Care; 1999.
16. Gregg EW, Engelgau MM, Narayan V. Complications of diabetes in elderly people. BMJ 2002; 325: 916-917.
17. Australian Institute of Health and Welfare (AIHW). 2000. Diabetes as a cause of death, Australia, 1997 and 1998. Canberra: AIHW, ISBN No: 1 74024 088.
18. Hiss RG. Barriers to care in non-insulin dependent diabetes mellitus. The Michigan experience. Ann Int Med 1996; 124: 146-151.
19. Lutfey KE, Wishner W. Beyond "compliance" is "adherence": Improving the prospects of diabetes care. Diabetes Care 1999; 22(4): 635-639.
20. Larme AC, Pugh JA. Attitudes of primary care providers toward diabetes. Diabetes Care 1998; 21(9): 1391-1396.
21. Griffin S. Diabetes care in general practice: Meta-analysis of randomised control trials. BMJ 1998; 317: 390-395.
22. Pringle M, Stewart-Evans C, Coupland C, Williams I, Allison S, Sterland J. Influences on control in diabetes mellitus: Patient, doctor, practice or delivery of care? BMJ 1993; 306(6878): 630-634.
23. Kenny S, Smith PJ, Goldschmid MG, Newman JM, Herman WH. Survey of physician practice behaviours related to diabetes mellitus in the United States. Diabetes Care 1993; 16: 1507-1510.
24. El-Kebbi IM, Ziemer DC, Gallina DL, Dunbar V, Phillips LS. Diabetes in urban African Americans. XV. Identification of barriers to provider adherence to management protocols. Diabetes Care 1999; 22(10): 1617-1620.
25. Colagiuri R, McLennan M. Implementing clinical management guidelines for diabetes: A practical approach. In: International Health Outcomes Conference; 21-22 July 1999; Canberra: National Association of Diabetes Centres; 1999.
26. National Health Priorities and Quality. Diabetes initiatives. National Integrated Diabetes Program. Available at: www.health.gov.au/pq/diabetes/nidp.htm (accessed Dec 2003).
27. Harris MF, Priddin D, Ruscoe W, Infante FA, O’Toole BI. Quality of care provided by general practitioners using or not using division-based diabetes registers. MJA 2002; 177(5): 250-252.
28. Drass J, Kell S, Osborn M, Bausell B, Corcoran J, Moskowitz A, et al. Diabetes care for medicare beneficiaries. Diabetes Care 1998; 21(8): 1282-1287.
29. McNabb WL, Adherence in diabetes: Can we define it and can we measure it? Diabetes Care 1997; 20(2): 215-218.
30. Cerkoney KA, Hart LK. The relationship between the health belief model and compliance of persons with diabetes mellitus. Diabetes Care 1980; 3(5): 594-598.
Community pharmacists’ role in the continuity of care of Type 2 diabetes: An evaluation of a model
110
31. Boccuzzi SJ, Wogen J, Fox J, Sung JC, Shah AB, Kim J. Utilization of oral hypoglycemic agents in a drug-insured U.S. population. Diabetes Care 2001; 24(8): 1411-1415.
32. Venturini F, Nichol MB, Sun JCY, Bailey KL, Cody M, McCombs JS. Compliance with sulphonylureas in a Health Maintenance Organization: A Pharmacy Record – Base Study. Ann Pharmacother 1999; 33: 281-288.
33. Paes AHP, Bakker A, Soe Agnie CJ. Impact of Dosage Frequency on Patient Compliance. Diabetes Care 1997; 20(10): 1512-1517.
34. Donnan PT, MacDonald TM, Morris AD. Adherence to oral hypoglycaemic medication in a population of patients with diabetes: A retrospective study. Diabet Med 2002; 19(4): 279-284.
35. Gray A, Raikou M, McGuire A, Fenn P, Stevens R, Cull C, et al. on behalf of the United Kingdom Prospective Diabetes Study Group. Cost effectiveness of an intensive blood glucose control policy in patients with type 2 diabetes: Economic analysis alongside randomised controlled trial (UKPDS 41). BMJ 2000; 320: 1373-1378.
36. Pekarsky B, Ewald B. Can we afford intensive management of diabetes? Aust Prescr 2002; 25: 102-103.
37. Pharmaceutical Society of Australia. Australian Pharmacy - Primary Health Care’s forgotten resource. A submission to the Review of the Role of Primary Health Care in Health Promotion in Australia. Canberra: Pharmaceutical Society of Australia, July 1991.
38. Sczupak CA, Conrad WF. Relationship between patient-oriented pharmaceutical services and therapeutic outcomes of ambulatory patients with diabetes mellitus. Am J Hosp Pharm 1977; 34: 1238-1242.
39. Jaber LA, Halapy H, Fernet M, Tummalapalli S, Diwakaran H. Evaluation of a pharmaceutical care model on diabetes management. Ann Pharmacother 1996; 30: 238-243.
40. Berringer R, Shibley MC, Cary CC, Pugh CB, Rafi JA. Outcomes of a community pharmacy-based diabetes monitoring program. J Am Pharm Assoc 1999; 39(6): 791-797.
41. Davidson MB, Karlan VJ, Hair TL. Effect of a pharmacist managed diabetes-care program in a free clinic. Am J Med Qual 2000; 15: 137-142.
42. Cranor CW, Bunting BA, Christensen DB. The Asheville Project: Long-term clinical and economic outcomes of a community pharmacy diabetes care program. J Am Pharm Assoc 2003; 43: 173-184.
43. Cranor CW, Christensen DB. The Asheville Project: Short-term outcomes of a community pharmacy diabetes care program. J Am Pharm Assoc, 2003; 43: 149-159.
44. Pharmacy Practice Research Group. Final Report of the Community Pharmacy Model Practices Project. School of Pharmacy and Medical Sciences, University of South Australia. October 1997.
Community pharmacists’ role in the continuity of care of Type 2 diabetes: An evaluation of a model
111
45. Clifford RM, Batty KT, Davis TME, Davis W, Stein G, Stewart G, et al. A randomized controlled trial of a pharmaceutical care programme for high–risk diabetic patients in an outpatient clinic. Int J Pharm Pract 2002; 10: 85-89.
46. Clifford RM, Batty KT, Davis WA, Davis TME. Effect of a pharmaceutical care program on vascular risk in type 2 diabetes. APSA conference, Sydney, December 3-5, 2003. Abstract 1038C.
47. Phillips P, Popplewell P. Diabetes: What’s new in type 2. Mod Med Aust 1996; 7: 66-75.
48. Ellrodt G, Cook DJ, Cho M, Hunt D. Evidence based disease management. JAMA 1997; 278(20): 1687-1692.
49. Basina M, Kraemer FB. Effectiveness of diabetes management: Is improvement feasible? A J Med 2002; 112: 670-672.
50. Norris SL, Lau J, Smith SJ, Schmid CH, Engelgau MM. Self-management education for adults with type 2 diabetes: A meta-analysis of the effect on glycemic control. Diabetes Care 2002; 25: 1159-1171.
51. Raji A, Gomes H, Beard JO, MacDonald P, Conlin PR. A randomized trial comparing intensive and passive education in patients with diabetes mellitus. Arch Intern Med 2002; 162: 1301-1304.
52. UK Prospective Diabetes Study Group. Intensive blood-glucose control with sulphonylureas or insulin compared with conventional treatment and risk of complications in patients with type 2 diabetes (UKPDS 33). Lancet 1998; 352: 837-853.
53. Boyd AF, Hartzema AG. Computerized monitoring protocols as a pharmaceutical care practice enhancement: A conceptual illustration using diabetes mellitus. Ann Pharmacother 1993; 27: 963-966.
54. Calabrese AT, Coley KC, DaPos SV, Swanson D, Rao RH. Evaluation of prescribing practices: Risk of lactic acidosis with metformin therapy. Arch Intern Med 2002; 162: 434-437.
55. Yap WS, Peterson GM, Vial JH, Randall CT, Greenaway TM. Review of management of type 2 diabetes mellitus. J Clin Pharm Ther 1998; 23: 457-465.
56. Fitzgerald JT. Development and validation of the Diabetes Care Profile. Eval Health Prof 1996; 19: 208-230.
57. Bradley, C. W-BQ12 (6/96) Diabetes Research Group, Department of Psychology, Royal Holloway, University of London, Egham, Surrey, TW20 0EX.
58. Svarstad B, Chewning B, Sleath B, Claesson C. The brief medication questionnaire: A tool for screening patient adherence and barriers to adherence. Patient Educ Couns 1999; 37: 113-124.
59. Goold S.D, Vijan S. Normative issues in cost effectiveness analysis. J Lab Clin Med 1998; 132: 376-382.
Community pharmacists’ role in the continuity of care of Type 2 diabetes: An evaluation of a model
112
60. Business LineTM Plus. Available at: www.telstra.com (last sighted December 2003).
61. Casemix Standards of NSW Policy Unit, NSW Department of Health. 1999-2001.
62. Drummond MF. Methods for the Economic Evaluation of Health Care Programmes. Oxford University Press. 1998.
63. Delamater A, Jabobsen AM, Anderson B, Cox D, Fisher L, Lustman P, et al. Psychosocial therapies in diabetes: Report of the Psychosocial Therapies Working Group. Diabetes Care 2001; 24(7): 1286-1292.
64. Stearne MR, Palmer SL, Hammersley MS, Franklin SL, Spivey RS, Levy JC, et al. Efficacy of atenolol and captopril in reducing risk of macrovascular and microvascular complications in Type 2 diabetes - UKPDS 39. BMJ 1998; 317(7160): 713-720.
65. Tearne MR, Palmer SL, Hammersley MS, Franklin SL, Spivey RS, Levy JC, et al. Tight blood pressure control and risk of macrovascular and microvascular complications in Type 2 diabetes - UKPDS 38. BMJ 1998; 317(7160): 703-713.
66. Diabetes Australia. Available at: www.multilingualdaibetes.org (last sighted December 2003).
67. O’Brien J, Shomphe L, Kavanagh P, Raggio G, Caro J. Direct medical costs of complications resulting from type 2 diabetes in the US. Diabetes Care 1998; 21: 1122-1128.
68. Eastman R, Javitt J, Herman, W, Dashbach E., Copley-Merriman C, Maier W, et al. Model of complications of NIDDM: II Analysis of the health benefits and cost-effectiveness of treating NIDDM with the goal of normoglycaemia. Diabetes Care 1997; 20: 735-744.
69. Wagner E, Sandhu N, Newton K, McCulloch D, Ramsey S, Grothaus L. Effect of improved glycemic control on health care costs and utilization. JAMA 2001; 285: 182-189.

Community pharmacists’ role in the continuity of care of Type 2 diabetes: An evaluation of a model
113
Community pharmacists’ role in the continuity of care of Type 2 diabetes: An evaluation of a model
114
APPENDIX 1 Appendix 1: Bibliography of the Steering Committee members Jan Alford Nurse Unit Manager, Diabetes Education Centre, St. Vincents Hospital
Jan is the Nurse Unit Manager of the Diabetes Centre at St. Vincent's Hospital. As part of this role she is responsible for the management of patient services and associated activities provided by the Diabetes Centre. The Centre also provides key clinical expertise to students undertaking the Graduate Certificate in Diabetes Education and Management offered in partnership with UTS. She has held, and still holds, several management positions within her professional organisation, with particular emphasis on the training and credentialing of diabetes educators.
Prof. Carol Armour Professor, Faculty of Pharmacy, University of Sydney
After completing a PhD in Pharmacology, Carol pursued postdoctoral study in Canada. She has worked for the NH and MRC as a Senior Research Officer for 7 years. In 1989 she joined the Faculty of Pharmacy at the University of Sydney as a lecturer. She has extensive research experience, especially in diabetes care, cost effectiveness, asthma, airway smooth muscle, inflammation, cytokines, corticosteroids, drug utilisation, and antibiotics.
A/Prof. Steven Colagiuri Director, Department of Endocrinology, Diabetes Centre, Prince of Wales Hospital Mr. Brian Conway Chief Executive Officer, Diabetes Australia National
Brian is the Executive Director of Diabetes Australia Ltd, which is a federation of consumer, health professional and research organisations. Brian has been with Diabetes Australia since February 2000. Prior to this appointment he had an extensive career in the Commonwealth Department of Health and Ageing working in the diabetes and aged care areas. Previous to moving to Canberra, he practiced as a social worker in two Sydney hospitals and in the Department of Social Security. Brian holds a Bachelor of Social Work and Masters of Health Administration.
Community pharmacists’ role in the continuity of care of Type 2 diabetes: An evaluation of a model
115
Mr. Lance Emerson Director of Professional Services and Research, Pharmacy Guild of Australia
Graduating with a Degree in Genetics/Physiology from the Australian National University in 1989, and a Master of Science from Flinders Medical School in 1998, Lance has a background in primary health care, and has worked for both ACT and NSW Health in health service development and implementation. He has been with the Pharmacy Guild for the past 6 years, and his area of responsibility is overseeing all matters relating to rural pharmacy, research and development and new professional services. He was instrumental in lobbying for, securing and overseeing initiatives such as Domiciliary Medication Management Reviews, the MMR facilitator scheme, the Rural Pharmacy Maintenance Allowance and all new rural initiatives, and the Guild Research and Developments Grants Program. Lance is currently undertaking a PhD (part time) with the Faculty of Pharmacy at the University of Sydney.
Dr. Naomi Liskowski G.P. Advisor for the Health Promotion Program, South Eastern Sydney Division of General Practice
Naomi graduated from Sydney University in 1980. She then worked as an intern and resident at St Hospital before transferring to the Sydney Children's Hospital where she worked as a paediatric resident and registrar for four years. She has now been working in general practice for 17 years, the last 11 years at Coogee Medical Centre. From 1993 she joined the South Eastern Sydney Division of General Practice, working as GP coordinator for the diabetes share care program. From 2000 the program has expanded to include cardiovascular disease and asthma. She now works as GP advisor for this health promotion program. For the last two years she has also worked as a GP tutor at the University of NSW teaching second year medical students.
Dr. Ines Krass Senior Lecturer, Faculty of Pharmacy, University of Sydney
Ines completed her PhD in1991, and joined the Faculty of Pharmacy in 1993. She has a special interest in the pharmacotherapy of cardiovascular disease and diabetes and has lectured over the past decade to both undergraduates and community practitioners on these topics. Her main research focus centres on the development and evaluation of extended professional pharmacy services (provision of medicine information, counselling on medication use, screening and primary prevention in cardiovascular disease, and disease state management programs in asthma and diabetes), with a particular focus on community practice. Recently, the members of the research team, Carol, Ines and Sue completed a project investigating the role of the community pharmacist in disease state management in type 2 diabetes. The results of this first study showed a very positive impact of the care delivered by the community pharmacist on the blood glucose control of study participants.
Community pharmacists’ role in the continuity of care of Type 2 diabetes: An evaluation of a model
116
Mr. Adrian McInman Project Officer, Faculty of Pharmacy, University of Sydney
Adrian McInman has two undergraduate degrees in sociology and physical education, a master’s degree specialising in sport and exercise psychology, an Honours degree majoring in psychology, and a teaching diploma. Since graduating, he has worked for the last 12 years as a researcher in a number of universities and hospitals. He has undertaken research in a variety of topics including: smoking, diabetes, gastroenterology, psychiatric illness, public health care, education, and sport/exercise psychology. Since 1998, he has had his own research business (McInman Research Centre), which focuses on quantitative health research. In 2004 he will begin a Masters of Clinical Psychology degree at James Cook University in Townsville and plans to work with patients with diabetes upon completion of the degree.
Mr. Matthew Ryan National Health Priorities Project Officer, Pharmaceutical Society of Australia
Matt has a BAppSc in Health Education with a background in community health program management. He joined the PSA 5 years ago as part of the Practice Division and has been responsible for the development of the Society's Disease State Management initiatives including Diabetes, Asthma, Smoking Cessation and Illicit Drugs. He is currently working on a range of PSA health priority projects such the Medication Assistance Service (MAS) and Consumer Medicine Information (CMI).
Dr. Susan Taylor Lecturer, Faculty of Pharmacy, University of Sydney
Sue has extensive hospital pharmacy experience and also has worked as a community pharmacist. She also has 15 years teacher/academic experience. Her main research focus has been in the areas of pharmacoeconomics, health economics, economic evaluation of and willingness to pay for pharmacy services.

Community pharmacists’ role in the continuity of care of Type 2 diabetes: An evaluation of a model
117
APPENDIX 2
Community pharmacists’ role in the continuity of care of Type 2 diabetes: An evaluation of a model
118
Note this page is NOT meant to be printed. This is where the Clinical Pharmacist Intervention page goes.

Community pharmacists’ role in the continuity of care of Type 2 diabetes: An evaluation of a model
119
APPENDIX 3

Community pharmacists’ role in the continuity of care of Type 2 diabetes: An evaluation of a model
120
Note this page is NOT meant to be printed. This is where the 1st of 3 Intervention Strategies pages go.

Community pharmacists’ role in the continuity of care of Type 2 diabetes: An evaluation of a model
121
Note this page is NOT meant to be printed. This is where the 2nd of 3 Intervention Strategies pages go.
Community pharmacists’ role in the continuity of care of Type 2 diabetes: An evaluation of a model
122
Note this page is NOT meant to be printed. This is where the 3rd of 3 Intervention Strategies pages go.
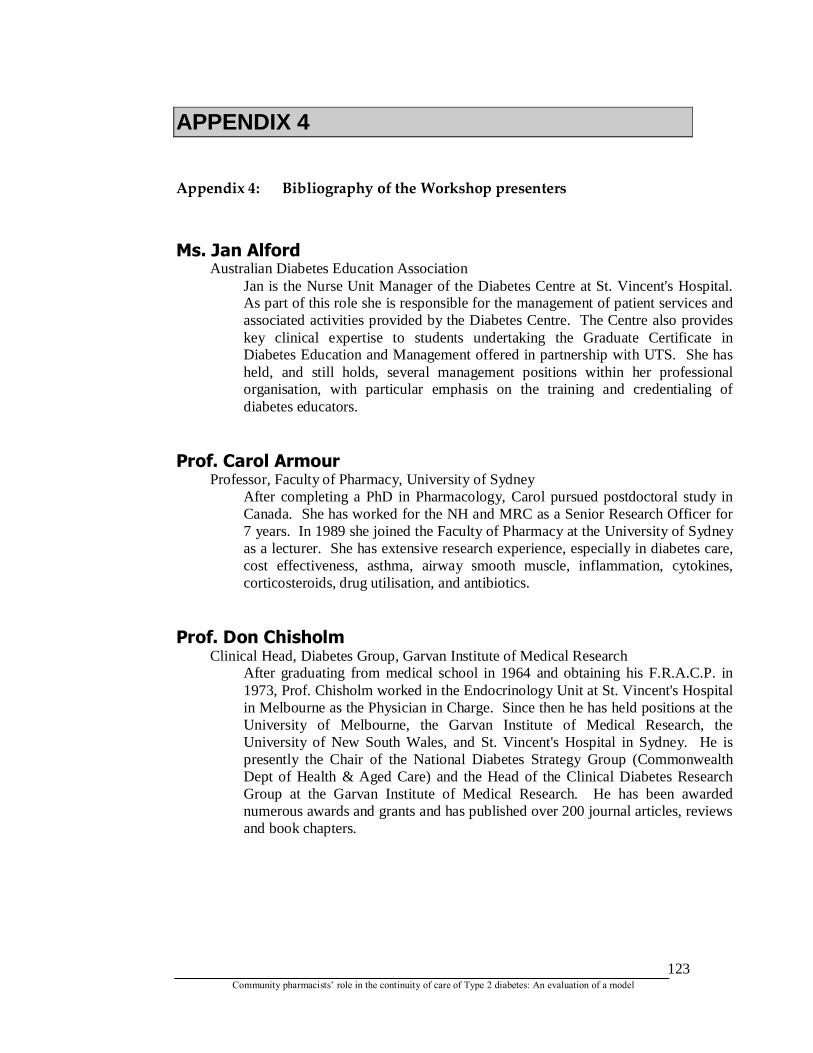
Community pharmacists’ role in the continuity of care of Type 2 diabetes: An evaluation of a model
123
APPENDIX 4 Appendix 4: Bibliography of the Workshop presenters Ms. Jan Alford
Australian Diabetes Education Association Jan is the Nurse Unit Manager of the Diabetes Centre at St. Vincent's Hospital. As part of this role she is responsible for the management of patient services and associated activities provided by the Diabetes Centre. The Centre also provides key clinical expertise to students undertaking the Graduate Certificate in Diabetes Education and Management offered in partnership with UTS. She has held, and still holds, several management positions within her professional organisation, with particular emphasis on the training and credentialing of diabetes educators.
Prof. Carol Armour
Professor, Faculty of Pharmacy, University of Sydney After completing a PhD in Pharmacology, Carol pursued postdoctoral study in Canada. She has worked for the NH and MRC as a Senior Research Officer for 7 years. In 1989 she joined the Faculty of Pharmacy at the University of Sydney as a lecturer. She has extensive research experience, especially in diabetes care, cost effectiveness, asthma, airway smooth muscle, inflammation, cytokines, corticosteroids, drug utilisation, and antibiotics.
Prof. Don Chisholm
Clinical Head, Diabetes Group, Garvan Institute of Medical Research After graduating from medical school in 1964 and obtaining his F.R.A.C.P. in 1973, Prof. Chisholm worked in the Endocrinology Unit at St. Vincent's Hospital in Melbourne as the Physician in Charge. Since then he has held positions at the University of Melbourne, the Garvan Institute of Medical Research, the University of New South Wales, and St. Vincent's Hospital in Sydney. He is presently the Chair of the National Diabetes Strategy Group (Commonwealth Dept of Health & Aged Care) and the Head of the Clinical Diabetes Research Group at the Garvan Institute of Medical Research. He has been awarded numerous awards and grants and has published over 200 journal articles, reviews and book chapters.
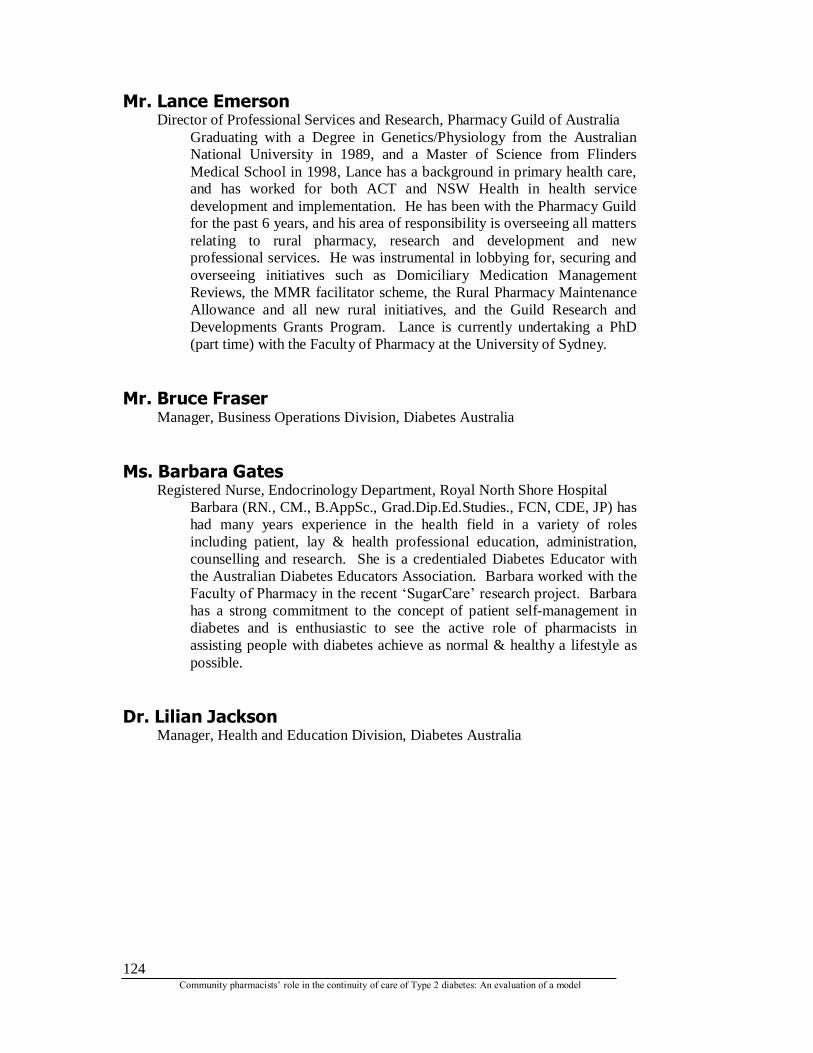
Community pharmacists’ role in the continuity of care of Type 2 diabetes: An evaluation of a model
124
Mr. Lance Emerson Director of Professional Services and Research, Pharmacy Guild of Australia
Graduating with a Degree in Genetics/Physiology from the Australian National University in 1989, and a Master of Science from Flinders Medical School in 1998, Lance has a background in primary health care, and has worked for both ACT and NSW Health in health service development and implementation. He has been with the Pharmacy Guild for the past 6 years, and his area of responsibility is overseeing all matters relating to rural pharmacy, research and development and new professional services. He was instrumental in lobbying for, securing and overseeing initiatives such as Domiciliary Medication Management Reviews, the MMR facilitator scheme, the Rural Pharmacy Maintenance Allowance and all new rural initiatives, and the Guild Research and Developments Grants Program. Lance is currently undertaking a PhD (part time) with the Faculty of Pharmacy at the University of Sydney.
Mr. Bruce Fraser Manager, Business Operations Division, Diabetes Australia
Ms. Barbara Gates
Registered Nurse, Endocrinology Department, Royal North Shore Hospital Barbara (RN., CM., B.AppSc., Grad.Dip.Ed.Studies., FCN, CDE, JP) has had many years experience in the health field in a variety of roles including patient, lay & health professional education, administration, counselling and research. She is a credentialed Diabetes Educator with the Australian Diabetes Educators Association. Barbara worked with the Faculty of Pharmacy in the recent ‘SugarCare’ research project. Barbara has a strong commitment to the concept of patient self-management in diabetes and is enthusiastic to see the active role of pharmacists in assisting people with diabetes achieve as normal & healthy a lifestyle as possible.
Dr. Lilian Jackson
Manager, Health and Education Division, Diabetes Australia
Community pharmacists’ role in the continuity of care of Type 2 diabetes: An evaluation of a model
125
Dr. Ines Krass Senior Lecturer, Faculty of Pharmacy, University of Sydney
Ines completed her PhD in1991, and joined the Faculty of Pharmacy in 1993. She has a special interest in the pharmacotherapy of cardiovascular disease and diabetes and has lectured over the past decade to both undergraduates and community practitioners on these topics. Her main research focus centres on the development and evaluation of extended professional pharmacy services (provision of medicine information, counselling on medication use, screening and primary prevention in cardiovascular disease, and disease state management programs in asthma and diabetes), with a particular focus on community practice. Recently, the members of the research team, Carol, Ines and Sue completed a project investigating the role of the community pharmacist in disease state management in type 2 diabetes. The results of this first study showed a very positive impact of the care delivered by the community pharmacist on the blood glucose control of study participants.
Ms. Jane Ludington
Diabetes Specialist Practitioner Teacher, St. Vincents Upon graduating with a B.Pharm and DHP, Jane has worked in hospital pharmacy, primarily at Westmead Hospital, where she was the Clinical Specialist in nutrition support and intensive care for six years. After completing her MHPEd and accreditation with AACP and CCGP, she conducted medication reviews in aged care facilities. She is currently the Specialist Diabetes Practitioner Teacher in the Faculty of Pharmacy, based at the St Vincents Diabetes Outpatient Clinic."
Ms. Renee Mallon
Accredited Practicing Dietitian, Diabetes Centre, Westmead Hospital Renee graduated from the University of Wollongong with a Bachelor of Science in Nutrition and a Master of Science in Nutrition and Dietetics. She is currently working as a Dietitian in the Diabetes and Endocrinology Ambulatory Care Centre at Westmead Hospital. As part of this role she is responsible for the clinical management of patients with diabetes and other metabolic diseases (e.g., Phenylketonuria). She has trained as a Sports Dietitian at the Austalian Institute of Sport and is a full member of Sports Dietitians Australia. She also runs a private practice covering a variety of health areas including weight control and sports nutrition.
Community pharmacists’ role in the continuity of care of Type 2 diabetes: An evaluation of a model
126
Mr. Adrian McInman Project Officer, Faculty of Pharmacy, University of Sydney
Adrian McInman has two undergraduate degrees in sociology and physical education, a master’s degree specialising in sport and exercise psychology, an Honours degree majoring in psychology, and a teaching diploma. Since graduating, he has worked for the last 12 years as a researcher in a number of universities and hospitals. He has undertaken research in a variety of topics including: smoking, diabetes, gastroenterology, psychiatric illness, public health care, education, and sport/exercise psychology. Since 1998, he has had his own research business (McInman Research Centre), which focuses on quantitative health research. In 2004 he will begin a Masters of Clinical Psychology degree at James Cook University in Townsville and plans to work with patients with diabetes upon completion of the degree.
Dr. Abilio de Almeida Neto
Faculty of Pharmacy, University of Sydney Abilio is a registered psychologist (B.Sc. Psychology, Hons, UNSW) with a Ph.D. from the University of Sydney in the area of behaviour modification in the pharmacy setting. His work has been used to change consumer behaviour in relation to self-medication and to implement change in practice behaviour of community pharmacists in relation to non-prescription medicines. In 2001 he was awarded a University Medallion for his work in the pharmacy area. Abilio has published extensively in pharmacy and medical journals.
Mr. Albert Regoli
Community pharmacist in Marayong After graduating at Sydney University in 1981, Albert pursued a career in retail pharmacy, working with highly regarded operators: Peter Reuben in Blacktown and Tony Ferguson in Penrith. In 1986 he purchased his own pharmacy in Marayong, which he continues to operate to this date. He has received several management awards and assists PDL on a local advisory group. Albert has a strong focus on patient counselling and a special interest in diabetes management. In 2001 he was selected to be involved in the "SugarCare" project.
Dr. Sue Taylor
Lecturer, Faculty of Pharmacy, University of Sydney Sue has extensive hospital pharmacy experience and also has worked as a community pharmacist. She also has 15 years teacher/academic experience. Her main research focus has been in the areas of pharmacoeconomics, health economics, economic evaluation of and willingness to pay for pharmacy services.
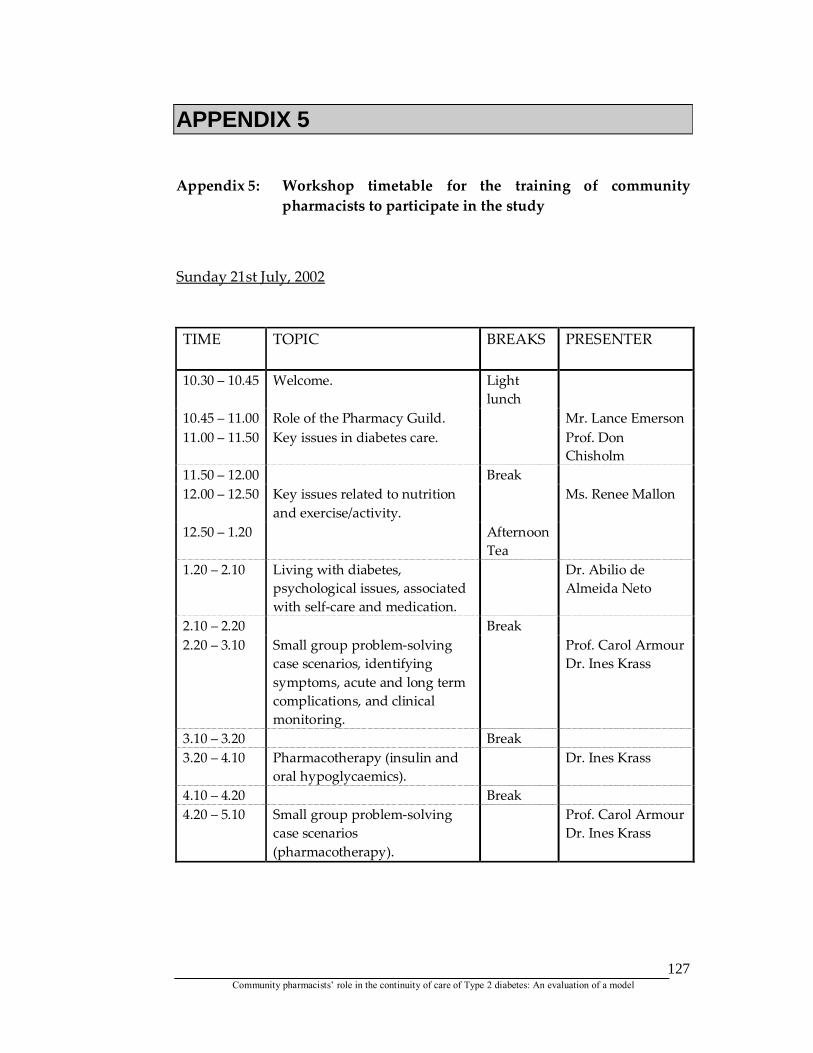
Community pharmacists’ role in the continuity of care of Type 2 diabetes: An evaluation of a model
127
APPENDIX 5 Appendix 5: Workshop timetable for the training of community
pharmacists to participate in the study
Sunday 21st July, 2002 TIME TOPIC BREAKS PRESENTER
10.30 – 10.45 Welcome. Light
lunch
10.45 – 11.00 Role of the Pharmacy Guild. Mr. Lance Emerson 11.00 – 11.50 Key issues in diabetes care. Prof. Don
Chisholm 11.50 – 12.00 Break 12.00 – 12.50 Key issues related to nutrition
and exercise/activity. Ms. Renee Mallon
12.50 – 1.20 Afternoon Tea
1.20 – 2.10 Living with diabetes, psychological issues, associated with self-care and medication.
Dr. Abilio de Almeida Neto
2.10 – 2.20 Break 2.20 – 3.10 Small group problem-solving
case scenarios, identifying symptoms, acute and long term complications, and clinical monitoring.
Prof. Carol Armour Dr. Ines Krass
3.10 – 3.20 Break 3.20 – 4.10 Pharmacotherapy (insulin and
oral hypoglycaemics). Dr. Ines Krass
4.10 – 4.20 Break 4.20 – 5.10 Small group problem-solving
case scenarios (pharmacotherapy).
Prof. Carol Armour Dr. Ines Krass
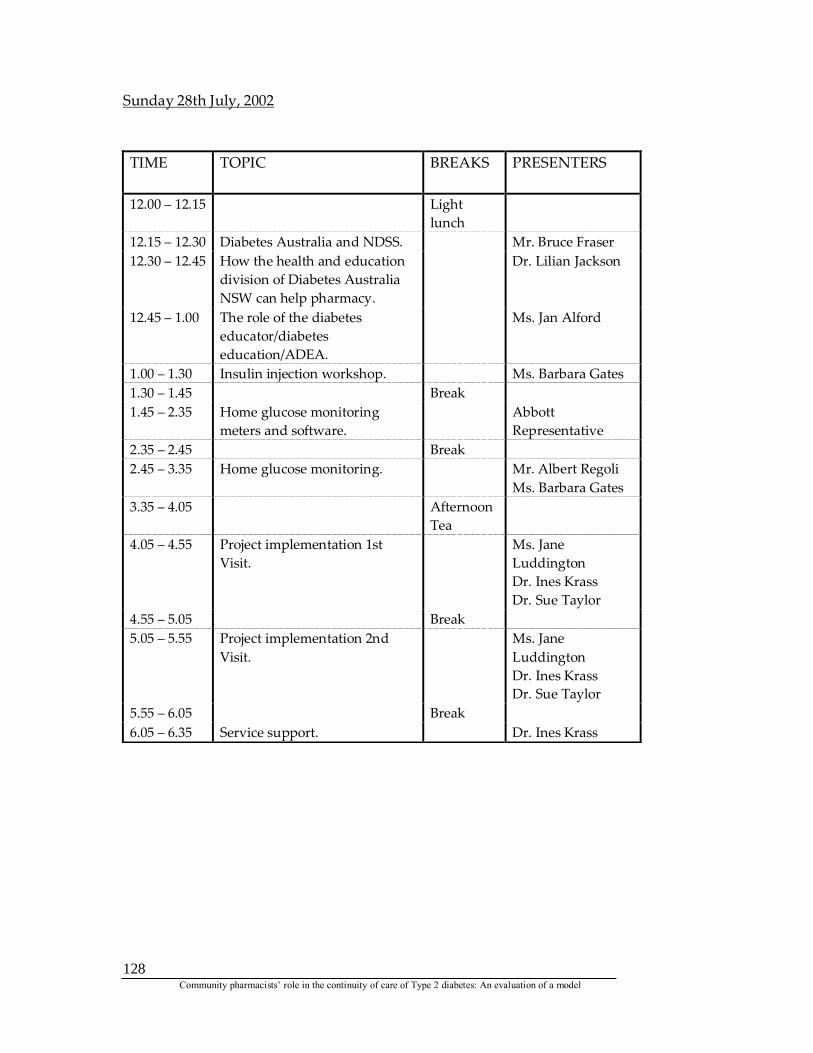
Community pharmacists’ role in the continuity of care of Type 2 diabetes: An evaluation of a model
128
Sunday 28th July, 2002 TIME TOPIC BREAKS PRESENTERS
12.00 – 12.15 Light
lunch
12.15 – 12.30 Diabetes Australia and NDSS. Mr. Bruce Fraser 12.30 – 12.45 How the health and education
division of Diabetes Australia NSW can help pharmacy.
Dr. Lilian Jackson
12.45 – 1.00 The role of the diabetes educator/diabetes education/ADEA.
Ms. Jan Alford
1.00 – 1.30 Insulin injection workshop. Ms. Barbara Gates 1.30 – 1.45 Break 1.45 – 2.35 Home glucose monitoring
meters and software. Abbott
Representative 2.35 – 2.45 Break 2.45 – 3.35 Home glucose monitoring. Mr. Albert Regoli
Ms. Barbara Gates 3.35 – 4.05 Afternoon
Tea
4.05 – 4.55 Project implementation 1st Visit.
Ms. Jane Luddington Dr. Ines Krass Dr. Sue Taylor
4.55 – 5.05 Break 5.05 – 5.55 Project implementation 2nd
Visit. Ms. Jane
Luddington Dr. Ines Krass Dr. Sue Taylor
5.55 – 6.05 Break 6.05 – 6.35 Service support. Dr. Ines Krass
Community pharmacists’ role in the continuity of care of Type 2 diabetes: An evaluation of a model
129
APPENDIX 6 Appendix 6: Unit names of the workshop manual
Module 1, Unit 1: Scope of the problem and evidence of the value of good
control of diabetes. Module 1, Unit 2: Screening and diagnosis of diabetes. Module 1, Unit 3: Definition and classification of diabetes. Module 1, Unit 4: Pathophysiology of diabetes. Module 1, Unit 5: Long term complications in diabetes. Module 1, Part 6: Aspects of diabetes self-management: Nutrition,
exercise and monitoring. Module 1, Unit 7: Acute complications of diabetes Module 1, Unit 8: Diabetes management: Pharmacotherapy. Module 2, Unit 1: Disease management. Module 2, Unit 2: Disease management. Module 1, Unit 3: Definition and classification of diabetes. Module 1, Unit 4: Pathophysiology of diabetes.

Community pharmacists’ role in the continuity of care of Type 2 diabetes: An evaluation of a model
130
APPENDIX 7

Community pharmacists’ role in the continuity of care of Type 2 diabetes: An evaluation of a model
131
Note this page is NOT meant to be printed. This is where the 1st of 5 Clinic Questionnaire pages go.

Community pharmacists’ role in the continuity of care of Type 2 diabetes: An evaluation of a model
132
Note this page is NOT meant to be printed. This is where the 2nd of 5 Clinic Questionnaire pages go.

Community pharmacists’ role in the continuity of care of Type 2 diabetes: An evaluation of a model
133
Note this page is NOT meant to be printed. This is where the 3rd of 5 Clinic Questionnaire pages go.

Community pharmacists’ role in the continuity of care of Type 2 diabetes: An evaluation of a model
134
Note this page is NOT meant to be printed. This is where the 4th of 5 Clinic Questionnaire pages go.

Community pharmacists’ role in the continuity of care of Type 2 diabetes: An evaluation of a model
135
Note this page is NOT meant to be printed. This is where the 5th of 5 Clinic Questionnaire pages go.

Community pharmacists’ role in the continuity of care of Type 2 diabetes: An evaluation of a model
136
APPENDIX 8

Community pharmacists’ role in the continuity of care of Type 2 diabetes: An evaluation of a model
137
Note this page is NOT meant to be printed. This is where the Patient Goal Card page goes.

Community pharmacists’ role in the continuity of care of Type 2 diabetes: An evaluation of a model
138
APPENDIX 9
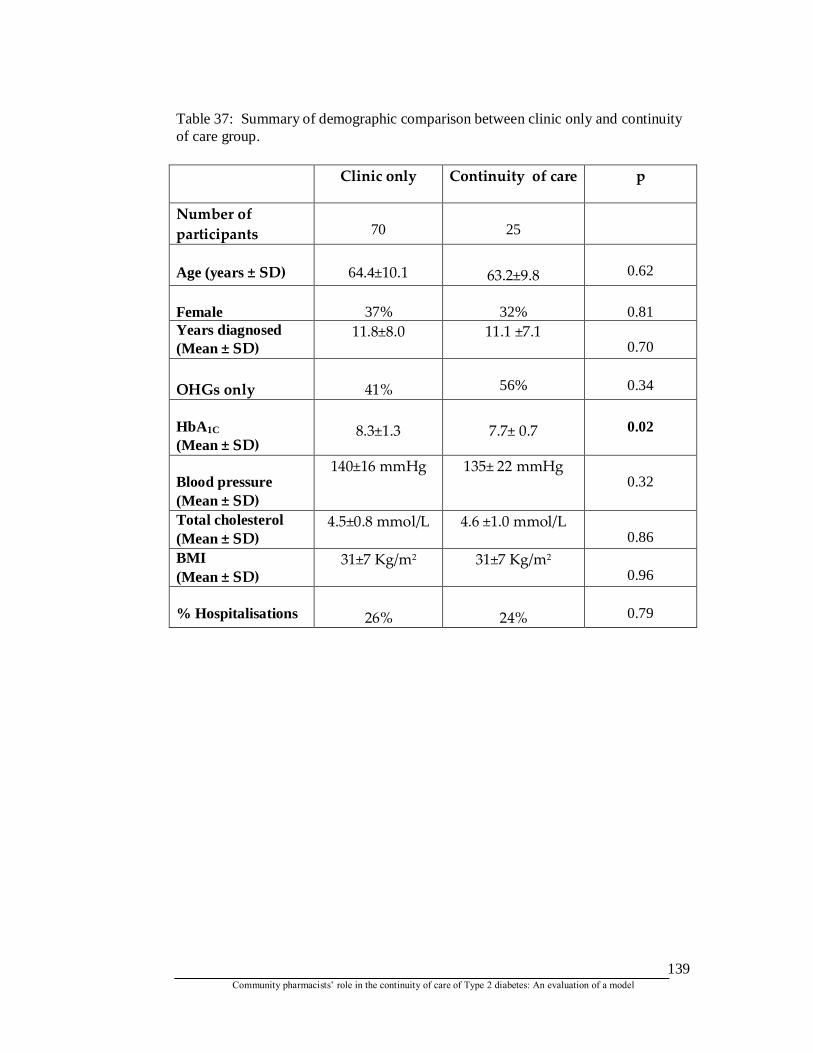
Community pharmacists’ role in the continuity of care of Type 2 diabetes: An evaluation of a model
139
Table 37: Summary of demographic comparison between clinic only and continuity of care group. Clinic only
Continuity of care
p
Number of participants
70
25
Age (years ± SD)
64.4±10.1
63.2±9.8
0.62
Female
37%
32%
0.81
Years diagnosed (Mean ± SD)
11.8±8.0 11.1 ±7.1 0.70
OHGs only
41%
56%
0.34
HbA1C
(Mean ± SD)
8.3±1.3
7.7± 0.7
0.02
Blood pressure (Mean ± SD)
140±16 mmHg
135± 22 mmHg 0.32
Total cholesterol (Mean ± SD)
4.5±0.8 mmol/L 4.6 ±1.0 mmol/L 0.86
BMI (Mean ± SD)
31±7 Kg/m2 31±7 Kg/m2 0.96
% Hospitalisations
26%
24%
0.79