Embed Size (px)
Citation preview
IChemE SYMPOSIUM SERIES NO. 153 # 2007 IChemE
COMMUNITY RISK PROFILE: A TOOL TO ASSESS A VARIETY OF HAZARDSON A TERRITORY
Bruno Debray, Bastien Affeltranger, Gautier Vincent and Ruth Coutto
INERIS, Direction des risques accidentels, Parc Alata, BP2, 60550 Verneuil-en-Halatte; e-mail: [email protected]
UNEP APELL, 39-43 quai Andre Citroen, 75739 Paris Cedex 15
Communities are facing a large variety of risks that community leaders have the responsibility to
manage and reduce in relation with numerous stakeholders and partners. Risk assessment is the first
step of the risk management process and serves as a base for the risk reduction decisions that can
have a strong impact on the territory. A detailed risk assessment is not an easy task and the decision
to undertake such assessments should be based on a first simple estimate of the risk level. From a
community point of view, it is also essential to be able to consider all the types of hazards to take
coherent decisions and to characterise the relative contribution of each type of hazard to the global
risk on the community.
It is to answer to these needs that the APELL program of UNEP has asked to INERIS to develop
the community risk profile tool described in the present paper. The tool is based on a multidimen-
sional definition of risk. Nine dimensions are considered and assessed for each of the hazard types.
Risk is considered as a combination of the presence of a hazard source, the probability of the
hazardous phenomena it can produce, and its intensity, the presence of vulnerable elements in
the surroundings, their vulnerability, the existence of prevention and protection measures, the
emergency preparedness and the resilience of the community.
The hazards considered are industrial accidents, transport of dangerous goods, flooding, volca-
noes, earthquake, tsunami, landslide, forest fire, tornadoes and cyclones. For each of these hazar-
dous phenomena, a questionnaire allows for the assessment of the nine dimensions of risk. For most
of the dimensions, the assessment is based on a multicriteria approach with results expressed in a
common scale ranging from 1 to 5, 1 being the most favourable situation and 5 the most unfavour-
able one. For some of the dimensions, namely intensity and probability, a quantitative scale can be
used. The attempt was made to propose common scales, the definition of which is commented in
this paper.
Examples of assessment criteria are given together with examples of the methodological difficul-
ties encountered during this project. Some have been solved and the solutions proposed are
described. Other difficulties remain open to contributions from the scientific communities but
also from the stakeholders of the risk management process. The Community Risk Profile is
currently under revision by UNEP experts for an expected publication in mid 2007.
INTRODUCTIONCommunities are facing various types of risks, which theyhave to assess and manage properly. These risks may be ofa human origin: industrial risks or risks related to the trans-port of hazardous materials. They can also be of naturalorigin: floods, earthquakes, volcanoes, ground movements.Many decisions should take the risk into account. Those con-cerning the risk management itself, of course, but alsodecisions such as land use planning or industrial investment.
Assessing risk is not an easy task. It requires toperform in depth studies which are only justified if therisk level is expected to be high for this reason, there is aneed for a risk assessment tool that would provide the userwith an information about the necessity to further assessthe risk by characterising an expectable risk level on thebase of a mostly qualitative approach. Such a tool, a riskcommunity profile, was developed by INERIS for andtogether with the UNEP APELL program.
1
RISK ASSESSMENT DIMENSIONSThe aim of the tool is to provide means for communitiesto assess roughly various types of risks and take appropri-ate decisions, notably to undertake further investigations,from this initial risk assessment. For this purpose, the defi-nition of risk was voluntarily extended from the classicalcombination of probability and severity to a broader defi-nition that includes reference to the vulnerability of thearea, or emergency preparedness. The community riskprofile can be used to assess the initial level of risk indepen-dently of existing mitigation measures. It can also be used toassess whether the existing measures are sufficient to coverthe initial risk. In any case, a high risk level should inducein depth risk assessment. The risk assessment dimensionsare divided into
– hazard related dimensions: presence of hazard sources,frequency, intensity of hazardous phenomena;
IChemE SYMPOSIUM SERIES NO. 153 # 2007 IChemE
– vulnerability related dimensions: presence of vulnerableelements within the effect area of the hazardousphenomena, vulnerability of the exposed elements andof the area, resilience of the area,
– risk control related dimensions: knowledge of risk(pre-existing risk assessment studies), prevention,protection, emergency preparedness.
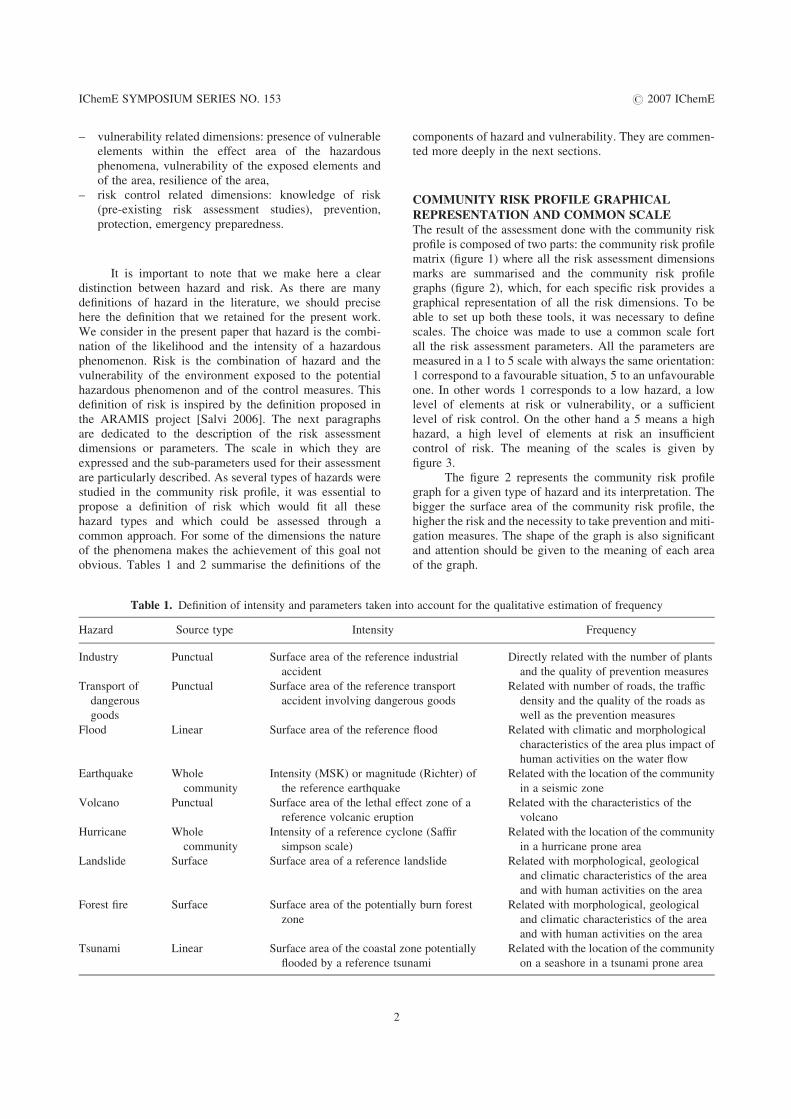
It is important to note that we make here a cleardistinction between hazard and risk. As there are manydefinitions of hazard in the literature, we should precisehere the definition that we retained for the present work.We consider in the present paper that hazard is the combi-nation of the likelihood and the intensity of a hazardousphenomenon. Risk is the combination of hazard and thevulnerability of the environment exposed to the potentialhazardous phenomenon and of the control measures. Thisdefinition of risk is inspired by the definition proposed inthe ARAMIS project [Salvi 2006]. The next paragraphsare dedicated to the description of the risk assessmentdimensions or parameters. The scale in which they areexpressed and the sub-parameters used for their assessmentare particularly described. As several types of hazards werestudied in the community risk profile, it was essential topropose a definition of risk which would fit all thesehazard types and which could be assessed through acommon approach. For some of the dimensions the natureof the phenomena makes the achievement of this goal notobvious. Tables 1 and 2 summarise the definitions of the
Table 1. Definition of intensity and parameters taken i
Hazard Source type Intensity
Industry Punctual Surface area of the referen
accident
Transport of
dangerous
goods
Punctual Surface area of the referen
accident involving dange
Flood Linear Surface area of the referen
Earthquake Whole
community
Intensity (MSK) or magnit
the reference earthquake
Volcano Punctual Surface area of the lethal e
reference volcanic erupt
Hurricane Whole
community
Intensity of a reference cyc
simpson scale)
Landslide Surface Surface area of a reference
Forest fire Surface Surface area of the potenti
zone
Tsunami Linear Surface area of the coastal
flooded by a reference ts
2
components of hazard and vulnerability. They are commen-ted more deeply in the next sections.
COMMUNITY RISK PROFILE GRAPHICAL
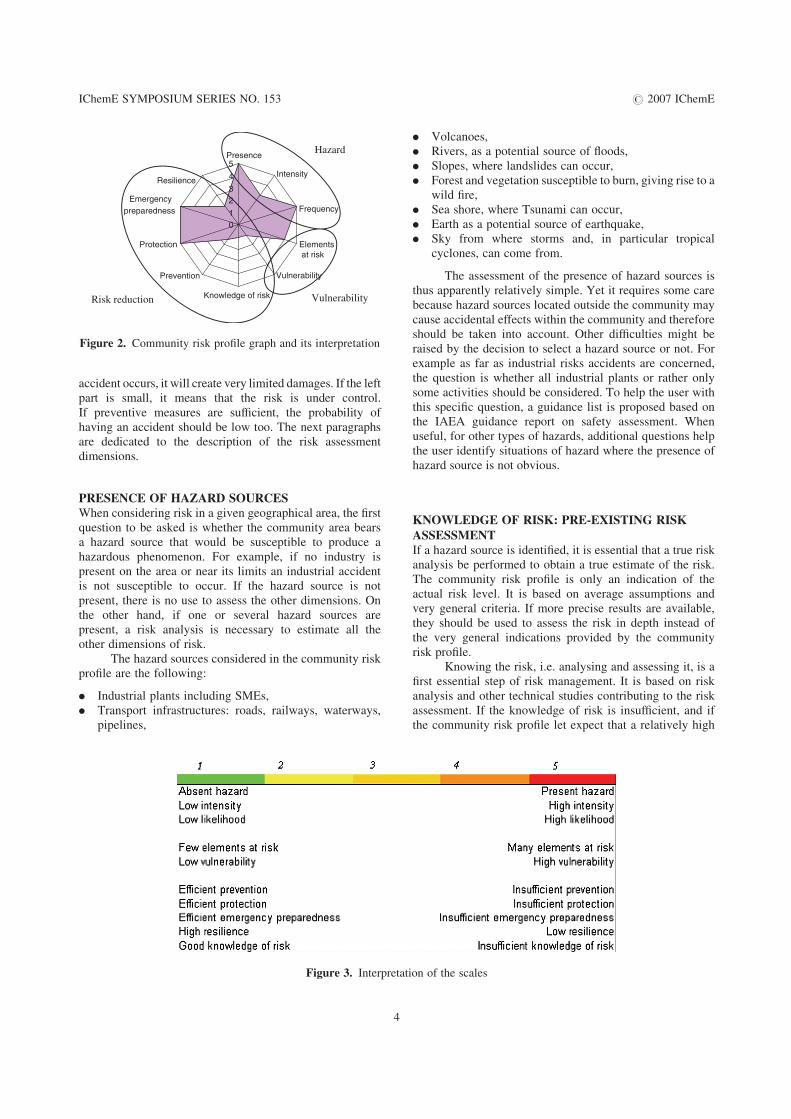
REPRESENTATION AND COMMON SCALEThe result of the assessment done with the community riskprofile is composed of two parts: the community risk profilematrix (figure 1) where all the risk assessment dimensionsmarks are summarised and the community risk profilegraphs (figure 2), which, for each specific risk provides agraphical representation of all the risk dimensions. To beable to set up both these tools, it was necessary to definescales. The choice was made to use a common scale fortall the risk assessment parameters. All the parameters aremeasured in a 1 to 5 scale with always the same orientation:1 correspond to a favourable situation, 5 to an unfavourableone. In other words 1 corresponds to a low hazard, a lowlevel of elements at risk or vulnerability, or a sufficientlevel of risk control. On the other hand a 5 means a highhazard, a high level of elements at risk an insufficientcontrol of risk. The meaning of the scales is given byfigure 3.
The figure 2 represents the community risk profilegraph for a given type of hazard and its interpretation. Thebigger the surface area of the community risk profile, thehigher the risk and the necessity to take prevention and miti-gation measures. The shape of the graph is also significantand attention should be given to the meaning of each areaof the graph.
nto account for the qualitative estimation of frequency
Frequency
ce industrial Directly related with the number of plants
and the quality of prevention measures
ce transport
rous goods
Related with number of roads, the traffic
density and the quality of the roads as
well as the prevention measures
ce flood Related with climatic and morphological
characteristics of the area plus impact of
human activities on the water flow
ude (Richter) of Related with the location of the community
in a seismic zone
ffect zone of a
ion
Related with the characteristics of the
volcano
lone (Saffir Related with the location of the community
in a hurricane prone area
landslide Related with morphological, geological
and climatic characteristics of the area
and with human activities on the area
ally burn forest Related with morphological, geological
and climatic characteristics of the area
and with human activities on the area
zone potentially
unami
Related with the location of the community
on a seashore in a tsunami prone area
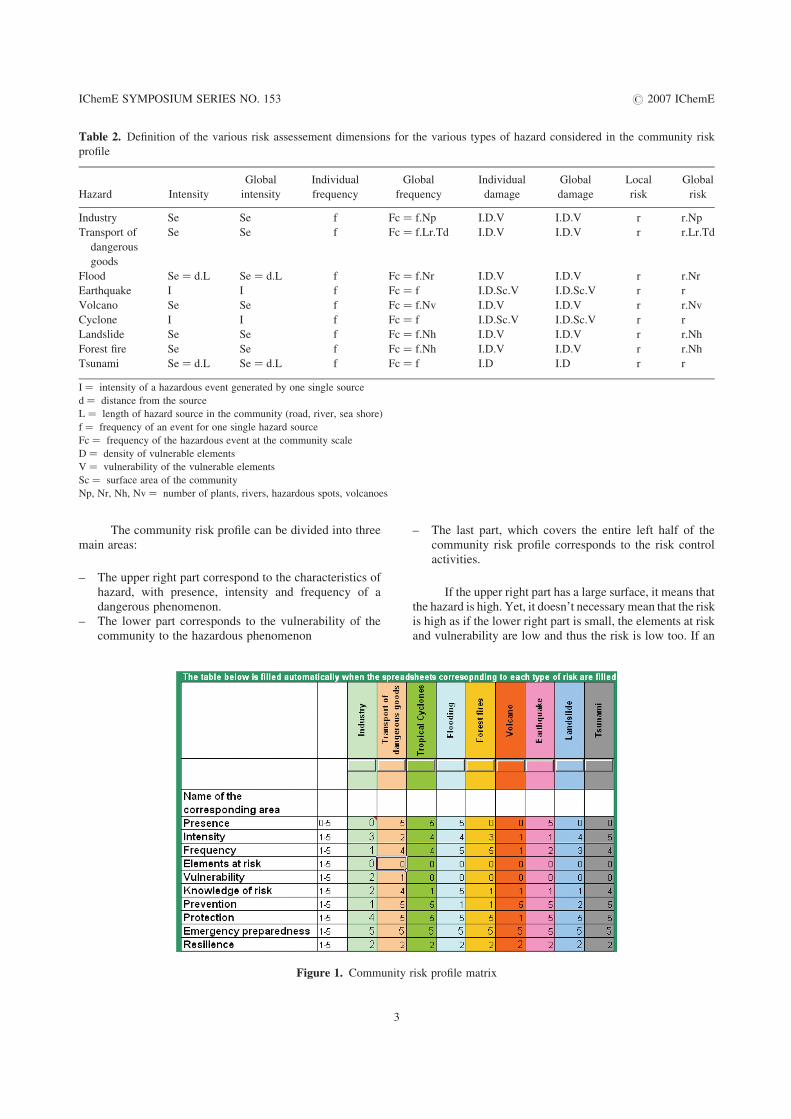
Table 2. Definition of the various risk assessement dimensions for the various types of hazard considered in the community risk
profile
Hazard Intensity
Global
intensity
Individual
frequency
Global
frequency
Individual
damage
Global
damage
Local
risk
Global
risk
Industry Se Se f Fc ¼ f.Np I.D.V I.D.V r r.Np
Transport of
dangerous
goods
Se Se f Fc ¼ f.Lr.Td I.D.V I.D.V r r.Lr.Td
Flood Se ¼ d.L Se ¼ d.L f Fc ¼ f.Nr I.D.V I.D.V r r.Nr
Earthquake I I f Fc ¼ f I.D.Sc.V I.D.Sc.V r r
Volcano Se Se f Fc ¼ f.Nv I.D.V I.D.V r r.Nv
Cyclone I I f Fc ¼ f I.D.Sc.V I.D.Sc.V r r
Landslide Se Se f Fc ¼ f.Nh I.D.V I.D.V r r.Nh
Forest fire Se Se f Fc ¼ f.Nh I.D.V I.D.V r r.Nh
Tsunami Se ¼ d.L Se ¼ d.L f Fc ¼ f I.D I.D r r
I ¼ intensity of a hazardous event generated by one single source
d ¼ distance from the source
L ¼ length of hazard source in the community (road, river, sea shore)
f ¼ frequency of an event for one single hazard source
Fc ¼ frequency of the hazardous event at the community scale
D ¼ density of vulnerable elements
V ¼ vulnerability of the vulnerable elements
Sc ¼ surface area of the community
Np, Nr, Nh, Nv ¼ number of plants, rivers, hazardous spots, volcanoes
IChemE SYMPOSIUM SERIES NO. 153 # 2007 IChemE
The community risk profile can be divided into threemain areas:
– The upper right part correspond to the characteristics ofhazard, with presence, intensity and frequency of adangerous phenomenon.
– The lower part corresponds to the vulnerability of thecommunity to the hazardous phenomenon
Figure 1. Community
3
– The last part, which covers the entire left half of thecommunity risk profile corresponds to the risk controlactivities.
If the upper right part has a large surface, it means thatthe hazard is high. Yet, it doesn’t necessary mean that the riskis high as if the lower right part is small, the elements at riskand vulnerability are low and thus the risk is low too. If an
risk profile matrix
01
23
4
5Presence
Intensity
Frequency
Elements at risk
Vulnerability
Knowledge of risk
Prevention
Protection
Emergencypreparedness
Resilience
Hazard
VulnerabilityRisk reduction
Figure 2. Community risk profile graph and its interpretation
IChemE SYMPOSIUM SERIES NO. 153 # 2007 IChemE
accident occurs, it will create very limited damages. If the leftpart is small, it means that the risk is under control.If preventive measures are sufficient, the probability ofhaving an accident should be low too. The next paragraphsare dedicated to the description of the risk assessmentdimensions.
PRESENCE OF HAZARD SOURCESWhen considering risk in a given geographical area, the firstquestion to be asked is whether the community area bearsa hazard source that would be susceptible to produce ahazardous phenomenon. For example, if no industry ispresent on the area or near its limits an industrial accidentis not susceptible to occur. If the hazard source is notpresent, there is no use to assess the other dimensions. Onthe other hand, if one or several hazard sources arepresent, a risk analysis is necessary to estimate all theother dimensions of risk.
The hazard sources considered in the community riskprofile are the following:
. Industrial plants including SMEs,
. Transport infrastructures: roads, railways, waterways,pipelines,
Figure 3. Interpret
4
. Volcanoes,
. Rivers, as a potential source of floods,
. Slopes, where landslides can occur,
. Forest and vegetation susceptible to burn, giving rise to awild fire,
. Sea shore, where Tsunami can occur,
. Earth as a potential source of earthquake,
. Sky from where storms and, in particular tropicalcyclones, can come from.
The assessment of the presence of hazard sources isthus apparently relatively simple. Yet it requires some carebecause hazard sources located outside the community maycause accidental effects within the community and thereforeshould be taken into account. Other difficulties might beraised by the decision to select a hazard source or not. Forexample as far as industrial risks accidents are concerned,the question is whether all industrial plants or rather onlysome activities should be considered. To help the user withthis specific question, a guidance list is proposed based onthe IAEA guidance report on safety assessment. Whenuseful, for other types of hazards, additional questions helpthe user identify situations of hazard where the presence ofhazard source is not obvious.
KNOWLEDGE OF RISK: PRE-EXISTING RISK
ASSESSMENTIf a hazard source is identified, it is essential that a true riskanalysis be performed to obtain a true estimate of the risk.The community risk profile is only an indication of theactual risk level. It is based on average assumptions andvery general criteria. If more precise results are available,they should be used to assess the risk in depth instead ofthe very general indications provided by the communityrisk profile.
Knowing the risk, i.e. analysing and assessing it, is afirst essential step of risk management. It is based on riskanalysis and other technical studies contributing to the riskassessment. If the knowledge of risk is insufficient, and ifthe community risk profile let expect that a relatively high
ation of the scales
IChemE SYMPOSIUM SERIES NO. 153 # 2007 IChemE
risk level is present, further studies should be undertaken toreach a satisfactory knowledge level. Knowledge of risk isthus a first dimension of risk control.
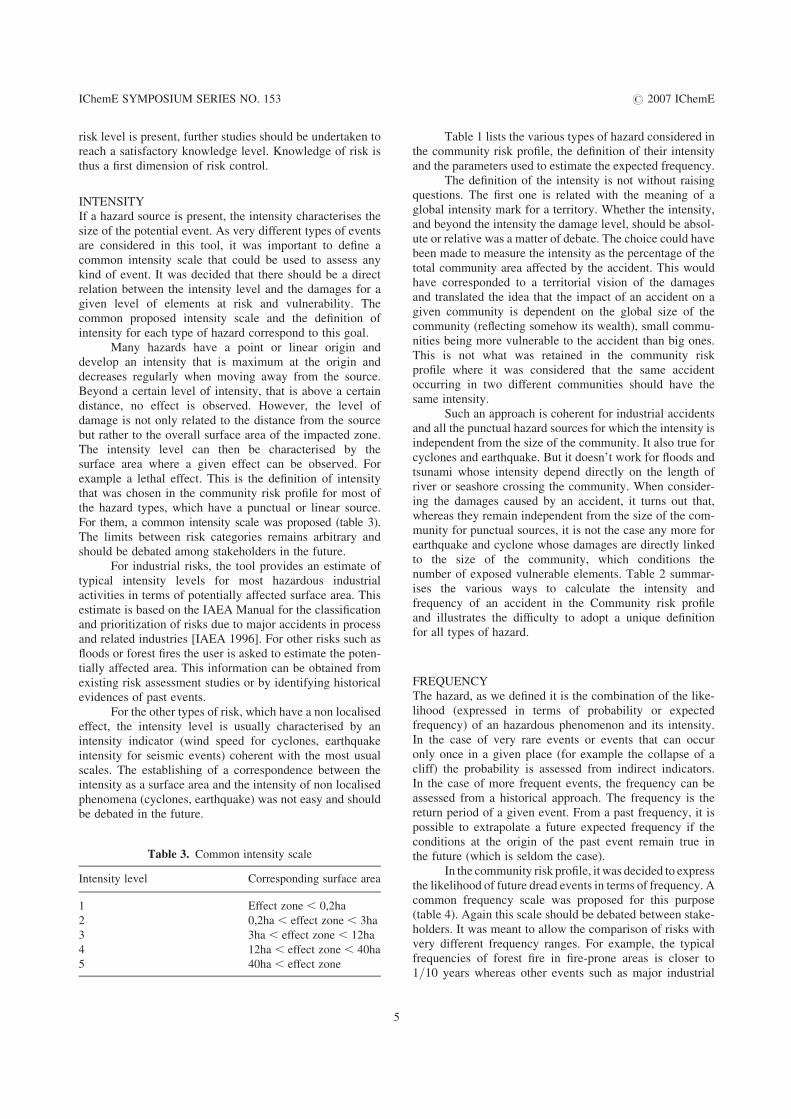
INTENSITYIf a hazard source is present, the intensity characterises thesize of the potential event. As very different types of eventsare considered in this tool, it was important to define acommon intensity scale that could be used to assess anykind of event. It was decided that there should be a directrelation between the intensity level and the damages for agiven level of elements at risk and vulnerability. Thecommon proposed intensity scale and the definition ofintensity for each type of hazard correspond to this goal.
Many hazards have a point or linear origin anddevelop an intensity that is maximum at the origin anddecreases regularly when moving away from the source.Beyond a certain level of intensity, that is above a certaindistance, no effect is observed. However, the level ofdamage is not only related to the distance from the sourcebut rather to the overall surface area of the impacted zone.The intensity level can then be characterised by thesurface area where a given effect can be observed. Forexample a lethal effect. This is the definition of intensitythat was chosen in the community risk profile for most ofthe hazard types, which have a punctual or linear source.For them, a common intensity scale was proposed (table 3).The limits between risk categories remains arbitrary andshould be debated among stakeholders in the future.
For industrial risks, the tool provides an estimate oftypical intensity levels for most hazardous industrialactivities in terms of potentially affected surface area. Thisestimate is based on the IAEA Manual for the classificationand prioritization of risks due to major accidents in processand related industries [IAEA 1996]. For other risks such asfloods or forest fires the user is asked to estimate the poten-tially affected area. This information can be obtained fromexisting risk assessment studies or by identifying historicalevidences of past events.
For the other types of risk, which have a non localisedeffect, the intensity level is usually characterised by anintensity indicator (wind speed for cyclones, earthquakeintensity for seismic events) coherent with the most usualscales. The establishing of a correspondence between theintensity as a surface area and the intensity of non localisedphenomena (cyclones, earthquake) was not easy and shouldbe debated in the future.
Table 3. Common intensity scale
Intensity level Corresponding surface area
1 Effect zone , 0,2ha
2 0,2ha , effect zone , 3ha
3 3ha , effect zone , 12ha
4 12ha , effect zone , 40ha
5 40ha , effect zone
5
Table 1 lists the various types of hazard considered inthe community risk profile, the definition of their intensityand the parameters used to estimate the expected frequency.
The definition of the intensity is not without raisingquestions. The first one is related with the meaning of aglobal intensity mark for a territory. Whether the intensity,and beyond the intensity the damage level, should be absol-ute or relative was a matter of debate. The choice could havebeen made to measure the intensity as the percentage of thetotal community area affected by the accident. This wouldhave corresponded to a territorial vision of the damagesand translated the idea that the impact of an accident on agiven community is dependent on the global size of thecommunity (reflecting somehow its wealth), small commu-nities being more vulnerable to the accident than big ones.This is not what was retained in the community riskprofile where it was considered that the same accidentoccurring in two different communities should have thesame intensity.
Such an approach is coherent for industrial accidentsand all the punctual hazard sources for which the intensity isindependent from the size of the community. It also true forcyclones and earthquake. But it doesn’t work for floods andtsunami whose intensity depend directly on the length ofriver or seashore crossing the community. When consider-ing the damages caused by an accident, it turns out that,whereas they remain independent from the size of the com-munity for punctual sources, it is not the case any more forearthquake and cyclone whose damages are directly linkedto the size of the community, which conditions thenumber of exposed vulnerable elements. Table 2 summar-ises the various ways to calculate the intensity andfrequency of an accident in the Community risk profileand illustrates the difficulty to adopt a unique definitionfor all types of hazard.
FREQUENCYThe hazard, as we defined it is the combination of the like-lihood (expressed in terms of probability or expectedfrequency) of an hazardous phenomenon and its intensity.In the case of very rare events or events that can occuronly once in a given place (for example the collapse of acliff) the probability is assessed from indirect indicators.In the case of more frequent events, the frequency can beassessed from a historical approach. The frequency is thereturn period of a given event. From a past frequency, it ispossible to extrapolate a future expected frequency if theconditions at the origin of the past event remain true inthe future (which is seldom the case).
In the community risk profile, it was decided to expressthe likelihood of future dread events in terms of frequency. Acommon frequency scale was proposed for this purpose(table 4). Again this scale should be debated between stake-holders. It was meant to allow the comparison of risks withvery different frequency ranges. For example, the typicalfrequencies of forest fire in fire-prone areas is closer to1/10 years whereas other events such as major industrial
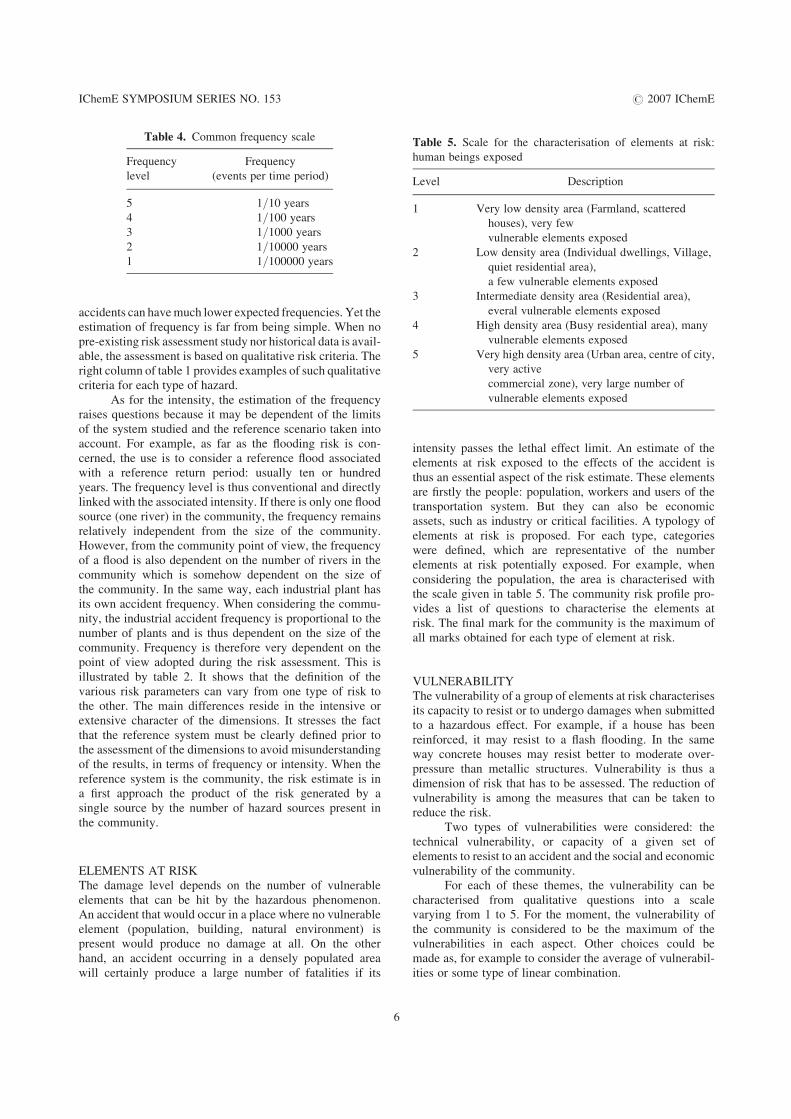
Table 4. Common frequency scale
Frequency
level
Frequency
(events per time period)
5 1/10 years
4 1/100 years
3 1/1000 years
2 1/10000 years
1 1/100000 years
Table 5. Scale for the characterisation of elements at risk:
human beings exposed
Level Description
1 Very low density area (Farmland, scattered
houses), very few
vulnerable elements exposed
2 Low density area (Individual dwellings, Village,
quiet residential area),
a few vulnerable elements exposed
3 Intermediate density area (Residential area),
everal vulnerable elements exposed
4 High density area (Busy residential area), many
vulnerable elements exposed
5 Very high density area (Urban area, centre of city,
very active
commercial zone), very large number of
vulnerable elements exposed
IChemE SYMPOSIUM SERIES NO. 153 # 2007 IChemE
accidents can have much lower expected frequencies. Yet theestimation of frequency is far from being simple. When nopre-existing risk assessment study nor historical data is avail-able, the assessment is based on qualitative risk criteria. Theright column of table 1 provides examples of such qualitativecriteria for each type of hazard.
As for the intensity, the estimation of the frequencyraises questions because it may be dependent of the limitsof the system studied and the reference scenario taken intoaccount. For example, as far as the flooding risk is con-cerned, the use is to consider a reference flood associatedwith a reference return period: usually ten or hundredyears. The frequency level is thus conventional and directlylinked with the associated intensity. If there is only one floodsource (one river) in the community, the frequency remainsrelatively independent from the size of the community.However, from the community point of view, the frequencyof a flood is also dependent on the number of rivers in thecommunity which is somehow dependent on the size ofthe community. In the same way, each industrial plant hasits own accident frequency. When considering the commu-nity, the industrial accident frequency is proportional to thenumber of plants and is thus dependent on the size of thecommunity. Frequency is therefore very dependent on thepoint of view adopted during the risk assessment. This isillustrated by table 2. It shows that the definition of thevarious risk parameters can vary from one type of risk tothe other. The main differences reside in the intensive orextensive character of the dimensions. It stresses the factthat the reference system must be clearly defined prior tothe assessment of the dimensions to avoid misunderstandingof the results, in terms of frequency or intensity. When thereference system is the community, the risk estimate is ina first approach the product of the risk generated by asingle source by the number of hazard sources present inthe community.
ELEMENTS AT RISKThe damage level depends on the number of vulnerableelements that can be hit by the hazardous phenomenon.An accident that would occur in a place where no vulnerableelement (population, building, natural environment) ispresent would produce no damage at all. On the otherhand, an accident occurring in a densely populated areawill certainly produce a large number of fatalities if its
6
intensity passes the lethal effect limit. An estimate of theelements at risk exposed to the effects of the accident isthus an essential aspect of the risk estimate. These elementsare firstly the people: population, workers and users of thetransportation system. But they can also be economicassets, such as industry or critical facilities. A typology ofelements at risk is proposed. For each type, categorieswere defined, which are representative of the numberelements at risk potentially exposed. For example, whenconsidering the population, the area is characterised withthe scale given in table 5. The community risk profile pro-vides a list of questions to characterise the elements atrisk. The final mark for the community is the maximum ofall marks obtained for each type of element at risk.
VULNERABILITYThe vulnerability of a group of elements at risk characterisesits capacity to resist or to undergo damages when submittedto a hazardous effect. For example, if a house has beenreinforced, it may resist to a flash flooding. In the sameway concrete houses may resist better to moderate over-pressure than metallic structures. Vulnerability is thus adimension of risk that has to be assessed. The reduction ofvulnerability is among the measures that can be taken toreduce the risk.
Two types of vulnerabilities were considered: thetechnical vulnerability, or capacity of a given set ofelements to resist to an accident and the social and economicvulnerability of the community.
For each of these themes, the vulnerability can becharacterised from qualitative questions into a scalevarying from 1 to 5. For the moment, the vulnerability ofthe community is considered to be the maximum of thevulnerabilities in each aspect. Other choices could bemade as, for example to consider the average of vulnerabil-ities or some type of linear combination.
IChemE SYMPOSIUM SERIES NO. 153 # 2007 IChemE
PREVENTION (OF THE HAZARDOUS
PHENOMENON)For some of the hazardous phenomena, it is possible toapply a prevention strategy aiming at reducing the prob-ability of the phenomenon. The preventive measures are,for example, possible in the industry where specificsafety devices or organisational measures can prevent theoccurrence of failures susceptible to lead to an accident.In the risk community profile, it is generally not possibleto assess the actual specific preventive measures butrather to consider if general prevention strategies areapplied. These refer, for example, to the existence of alegislation and its enforcement or to the existence oflocal monitoring and alert systems dedicated to the earlywarning and intervention before a major accident occurs.
In some risk assessment methods, safety barriers areassessed in terms of level of confidence and reliabilitywhich has a direct quantitative impact on the probabilityof the accidental scenario. In the case of the communityrisk profile, it was impossible to establish such a quantitativelink. Thus the level of prevention is calculated on a verysimple basis: 1 if all prevention measures identified as poss-ible are in place, 5 if none. No connection is made betweenthe prevention level and the frequency level even if it isobvious that both are strongly dependent.
PROTECTION, MITIGATIONProtection and mitigation have the effect of reducing theintensity of the hazardous phenomenon that reaches the vul-nerable element exposed. For example a mitigation devicecan be a protection dike against flooding or a reinforcedwall to resist a potential blast effect from an explosion.
Specific intervention plans are also covered in themitigation theme as well as measures aiming at reducingthe vulnerability or preventing that it increases. Forexample, measures such as land use restriction or construc-tion rules and standards are among the mitigation measures.
As for prevention, it is not possible to establish aquantitative scale for protection measures. The assessmentis cumulative, from 5 when no protection measure is inplace to 1 when all the possible protection measures arepresent.
EMERGENCY PREPAREDNESSThe emergency preparedness covers all the technical andorganisational measures that contribute to the efficient inter-vention in case of an emergency. The emergency prepared-ness is the core of the APELL program. The assessment ofthis dimension in the community risk profile tool is donethrough a questionnaire that was developed in the frame-work of the APELL program [APELL 1988].
The emergency preparedness is assessed globally forall the community and all the hazards. The assumption wasthat the same organisation should be involved in the emer-
7
gency response to any of the hazards and that if its globalorganisation is good, it should benefit all the situations.However, in each specific risk assessment sheet, questionsare asked in the protection section to assess the specificityof the emergency response for one given hazard type.
RESILIENCEThe resilience characterises the capacity of a person or acommunity to recover after an accident. This capacity isrelated with various characteristics of the community,which are not discussed in the present paper. Among themare the existence of a disaster recovery planning, theaccess to knowledge, the economic capacity of the commu-nity, the health system, the learning capacity of the system,the local cohesion and the technical capacity of thecommunity.
CONCLUSIONS AND PERSPECTIVESThe community risk profile is an attempt to build a guidedpreliminary risk assessment tool for a large variety ofnatural and technological risks using a common set ofdimensions expressed in common scales. It provides theuser with the list of questions to ease the assessment ofeach of these dimensions.
This paper has stressed the difficulties associated withthe setting of common definitions and scales for the ninedimensions of risk and the solutions proposed in the Com-munity Risk Profile. These difficulties should not hinderthe fact that the community risk profile should be a veryuseful tool for reflection and risk awareness raising amongrisk managers, decision makers and stakeholders.
A first version of the tool was experimented for train-ing of community risk managers in Moroco and Sri-Lankaand proved to be at first an efficient teaching support. It isnow under revision by the experts of the UNEP APELLprogram to assess its capacity to be used by risk managersall around the world. The goal is to publish the tool bymid 2007.
REFERENCES[Salvi 2006] Salvi, O. & Debray, B., 2006, A global view on
ARAMIS, a risk assessment methodology for industries in
the framework of the SEVESO II directive, Journal of
Hazardous Materials, Vol. 130, Issue 3: 187–199.
[IAEA 1996] Manual for the Classification and Prioritization of
Risks Due to Major Accidents in Process and Related Indus-
tries, International Atomic Energy Agency (IAEA) Techni-
cal Document IAEA-TECDOC-727 (Rev.1). 1996, 73 p.,
English, ISSN 1011–4289.
[APELL 1988] Awareness and Preparedness for Emergencies
at Local Level: a Process for Responding to Technological
Accidents, 1988, 63 pages, English, French, and Spanish,
ISBN 92-807-1183-0.