Embed Size (px)
Citation preview
1
October 2012
by Chris Laws and David Colon
Comorbidities in Workers Compensation
INTRODUCTION While the average medical cost for a workers compensation claim is approximately $6,000, the medical cost of an individual claim can be a few hundred dollars or millions of dollars. In 2010, an NCCI study found that claims with an obesity comorbidity diagnosis incurred significantly higher medical costs than comparable claims without such a comorbidity diagnosis [1]. Relative to that study, this study expands the number of comorbidities examined and provides additional information on both the types of claimants receiving comorbidity diagnoses and the types of providers submitting comorbidity diagnoses.
KEY FINDINGS The share of workers compensation claims with a comorbidity diagnosis nearly tripled from Accident Year1 2000 to
Accident Year 2009, growing from a share of 2.4% to 6.6%
Claims with a comorbidity diagnosis have about twice the medical costs of otherwise comparable claims
Comorbidity diagnoses for hypertension are the most prevalent of those investigated
The initial comorbidity diagnosis tends to occur early in the life of a claim
Hospital and physician visits account for a majority of visits resulting in a recorded comorbidity diagnosis
Only a small portion of visits result in the recording of a comorbidity diagnosis
STUDY DESIGN
Data
The data set used in this study is from a nationwide2 sample of transactions provided by carriers. The data set includes medical services provided between 1996 and 2010 on both lost-time and medical-only claims that occurred between 1994 and 2010. The data set is evaluated as of July 1, 2011.
Identification of Comorbidities
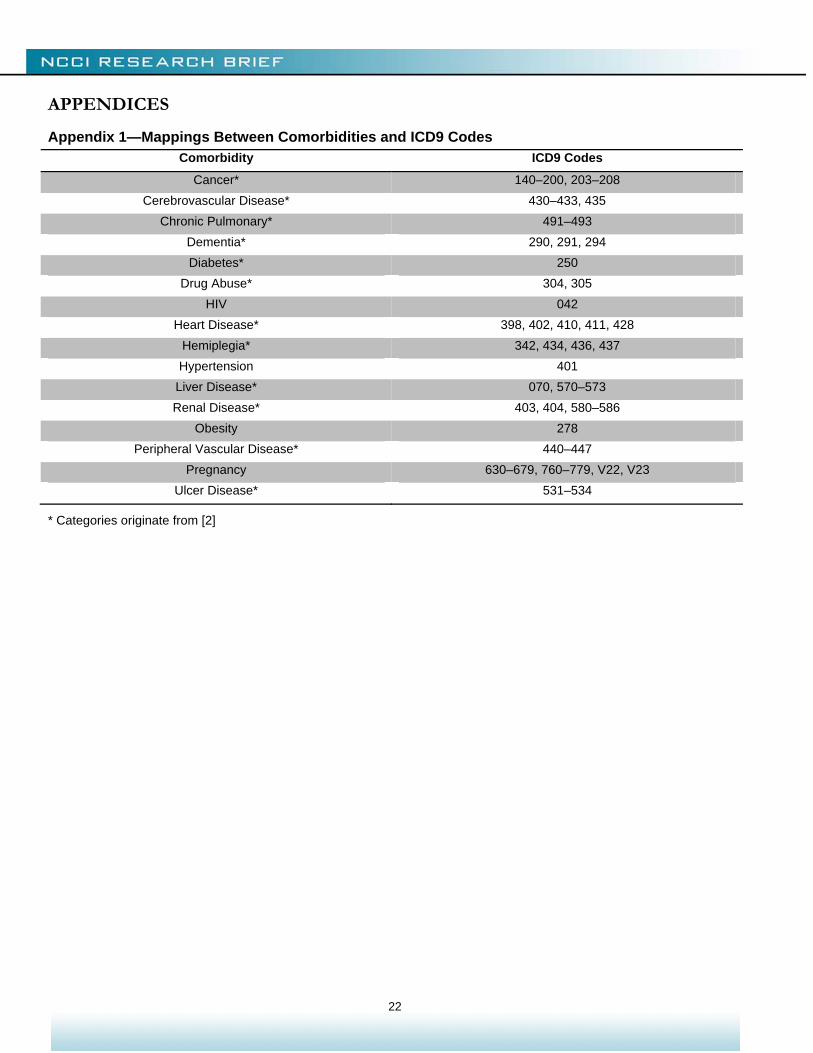
This study identifies comorbidities by matching the International Classification of Diseases, 9th Revision, or ICD9, diagnostic codes on individual claim transactions against the table of Comorbidity and ICD9 code mappings in Appendix 1. The D’Hoore, Sicotte, and Tilquin [2] adaptation of the Charlson Comorbidity Index [3] serves as the main basis for both (1) the comorbidities included in this study and (2) the table of Comorbidity and ICD9 code mappings.
1 The accident year for a claim is the year during which the injury occurred. We look at costs by accident year (used interchangeably with injury year) because workers compensation insurance coverage continues (potentially for many years) following the date of injury. This “long-tail” feature of workers compensation subjects the line to substantial long-term cost pressures. 2 All US states (including DC) except ND, OH, WA, WV, and WY.
2
For this study, a comorbidity diagnosis is defined as any medical transaction3 with a recorded ICD9 code indicating a specified comorbidity. Such transactions may or may not represent treatments for the comorbid condition. Comorbidity diagnoses indicate the presence of the condition. They do not indicate whether care was provided for the condition directly or indirectly. We have not filtered transactions based on Current Procedural Terminology (CPT) codes, which indicate the procedure performed.
Inclusion of Medical-Only Claims
This study includes both medical-only and lost-time claims for two reasons:
1. While lost-time status can serve as a proxy for the degree to which a claimant is injured, using it as such introduces an abrupt dividing line. As lost-time status is defined in relation to the waiting period, which can be as long as seven days, a lost-time claim might have only one more day away from work than a similar medical-only claim.
2. Complications resulting from a comorbidity could transform an otherwise medical-only claim into a lost-time claim. Limiting the analysis to only lost-time claims or matching by lost-time status would disregard costs associated with such crossovers.
DISCUSSION OF FINDINGS
Who Receives Comorbidity Diagnoses?
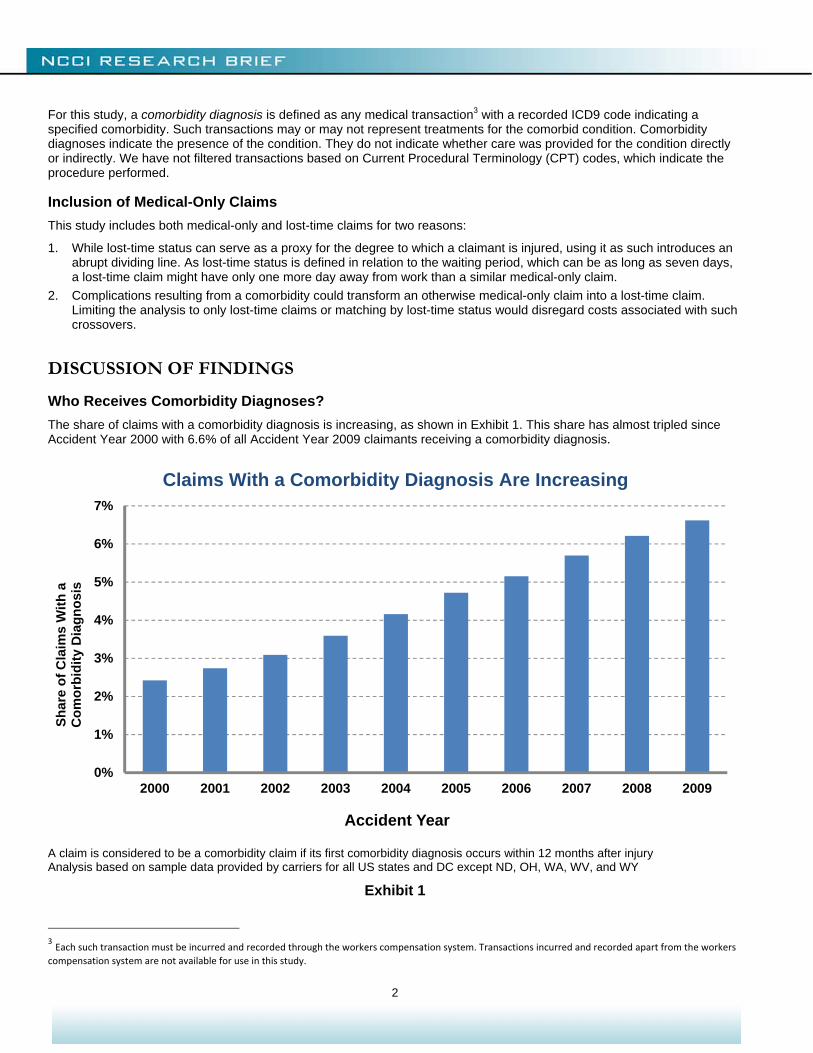
The share of claims with a comorbidity diagnosis is increasing, as shown in Exhibit 1. This share has almost tripled since Accident Year 2000 with 6.6% of all Accident Year 2009 claimants receiving a comorbidity diagnosis.
A claim is considered to be a comorbidity claim if its first comorbidity diagnosis occurs within 12 months after injury Analysis based on sample data provided by carriers for all US states and DC except ND, OH, WA, WV, and WY
Exhibit 1
3 Each such transaction must be incurred and recorded through the workers compensation system. Transactions incurred and recorded apart from the workers compensation system are not available for use in this study.
0%
1%
2%
3%
4%
5%
6%
7%
2000 2001 2002 2003 2004 2005 2006 2007 2008 2009
Sh
are
of
Cla
ims
Wit
h a
C
om
orb
idit
y D
iag
no
sis
Accident Year
Claims With a Comorbidity Diagnosis Are Increasing

3
Exhibit 2 shows the share of claims with comorbidity diagnoses for specific comorbidities. Claims with diagnoses for multiple comorbidities are included in the statistics for each such comorbidity. Over a nine-year span, the share of claims with drug-abuse diagnoses (inclusive of alcohol and tobacco) more than quadrupled, and the shares for diabetes, hypertension, and obesity diagnoses have tripled.
Many states have statutes in place that presume that some conditions (e.g., heart attack, cancer) are work related for firefighters or police officers. These statutes shift the burden of proof from the employee, who must typically prove that the condition is work related in order to receive compensation under the workers compensation system, to the employer, who must then prove that the condition is not work related in order to be released from this obligation [4]. Future research may investigate the degree to which such statutes impact Exhibits 1 and 2.
A claim is considered to be a comorbidity claim if its first comorbidity diagnosis occurs within 12 months after injury Analysis based on sample data provided by carriers for all US states and DC except ND, OH, WA, WV, and WY
Exhibit 2
0%
1%
2%
3%
Sh
are
of
Cla
ims
Wit
h a
C
om
orb
idit
y D
iag
no
sis
Comorbidity
AY 2000 AY 2001 AY 2002 AY 2003 AY 2004
AY 2005 AY 2006 AY 2007 AY 2008 AY 2009
Claims With a Comorbidity Diagnosis Are Increasing
4
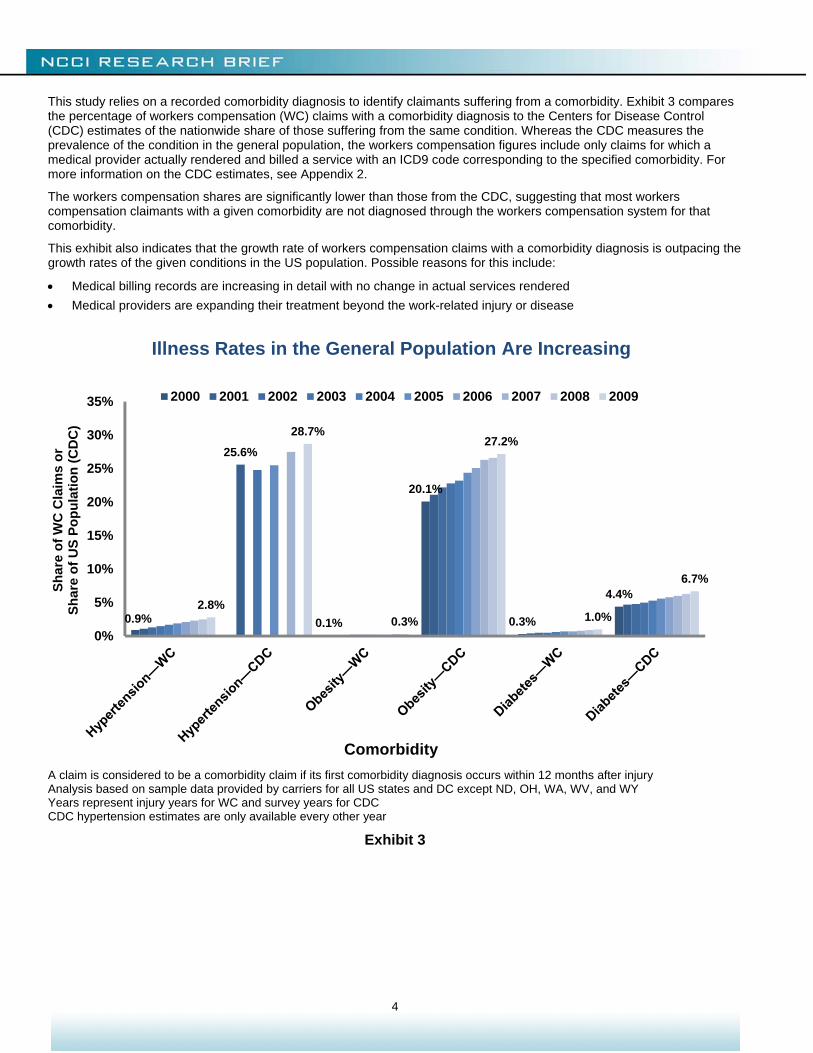
This study relies on a recorded comorbidity diagnosis to identify claimants suffering from a comorbidity. Exhibit 3 compares the percentage of workers compensation (WC) claims with a comorbidity diagnosis to the Centers for Disease Control (CDC) estimates of the nationwide share of those suffering from the same condition. Whereas the CDC measures the prevalence of the condition in the general population, the workers compensation figures include only claims for which a medical provider actually rendered and billed a service with an ICD9 code corresponding to the specified comorbidity. For more information on the CDC estimates, see Appendix 2.
The workers compensation shares are significantly lower than those from the CDC, suggesting that most workers compensation claimants with a given comorbidity are not diagnosed through the workers compensation system for that comorbidity.
This exhibit also indicates that the growth rate of workers compensation claims with a comorbidity diagnosis is outpacing the growth rates of the given conditions in the US population. Possible reasons for this include:
Medical billing records are increasing in detail with no change in actual services rendered
Medical providers are expanding their treatment beyond the work-related injury or disease
A claim is considered to be a comorbidity claim if its first comorbidity diagnosis occurs within 12 months after injury Analysis based on sample data provided by carriers for all US states and DC except ND, OH, WA, WV, and WY Years represent injury years for WC and survey years for CDC CDC hypertension estimates are only available every other year
Exhibit 3
0.9% 0.1%
20.1%
0.3%
4.4%
25.6%
2.8%
28.7%
0.3%
27.2%
1.0%
6.7%
0%
5%
10%
15%
20%
25%
30%
35%
Sh
are
of
WC
Cla
ims
or
Sh
are
of
US
Po
pu
lati
on
(C
DC
)
Comorbidity
2000 2001 2002 2003 2004 2005 2006 2007 2008 2009
Illness Rates in the General Population Are Increasing
5
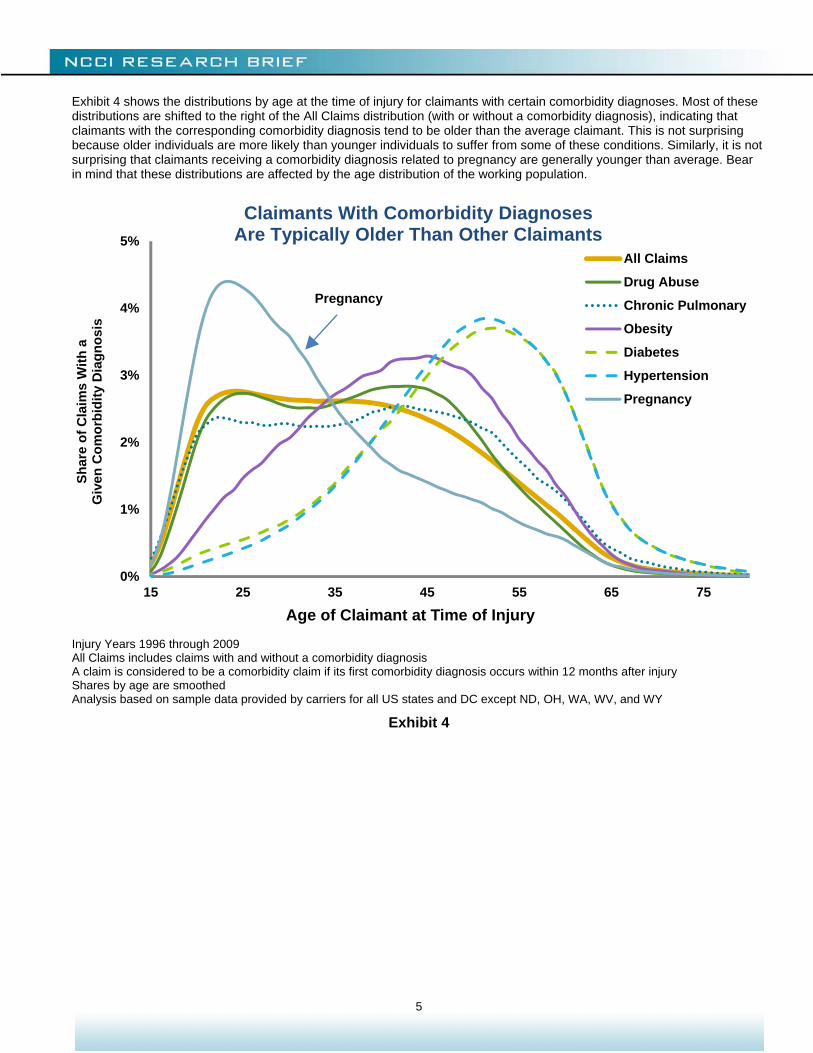
Exhibit 4 shows the distributions by age at the time of injury for claimants with certain comorbidity diagnoses. Most of these distributions are shifted to the right of the All Claims distribution (with or without a comorbidity diagnosis), indicating that claimants with the corresponding comorbidity diagnosis tend to be older than the average claimant. This is not surprising because older individuals are more likely than younger individuals to suffer from some of these conditions. Similarly, it is not surprising that claimants receiving a comorbidity diagnosis related to pregnancy are generally younger than average. Bear in mind that these distributions are affected by the age distribution of the working population.
Injury Years 1996 through 2009 All Claims includes claims with and without a comorbidity diagnosis A claim is considered to be a comorbidity claim if its first comorbidity diagnosis occurs within 12 months after injury Shares by age are smoothed Analysis based on sample data provided by carriers for all US states and DC except ND, OH, WA, WV, and WY
Exhibit 4
0%
1%
2%
3%
4%
5%
15 25 35 45 55 65 75
Sh
are
of
Cla
ims
Wit
h a
Giv
en C
om
orb
idit
y D
iag
no
sis
Age of Claimant at Time of Injury
All Claims
Drug Abuse
Chronic Pulmonary
Obesity
Diabetes
Hypertension
Pregnancy
Claimants With Comorbidity Diagnoses Are Typically Older Than Other Claimants
Pregnancy
6
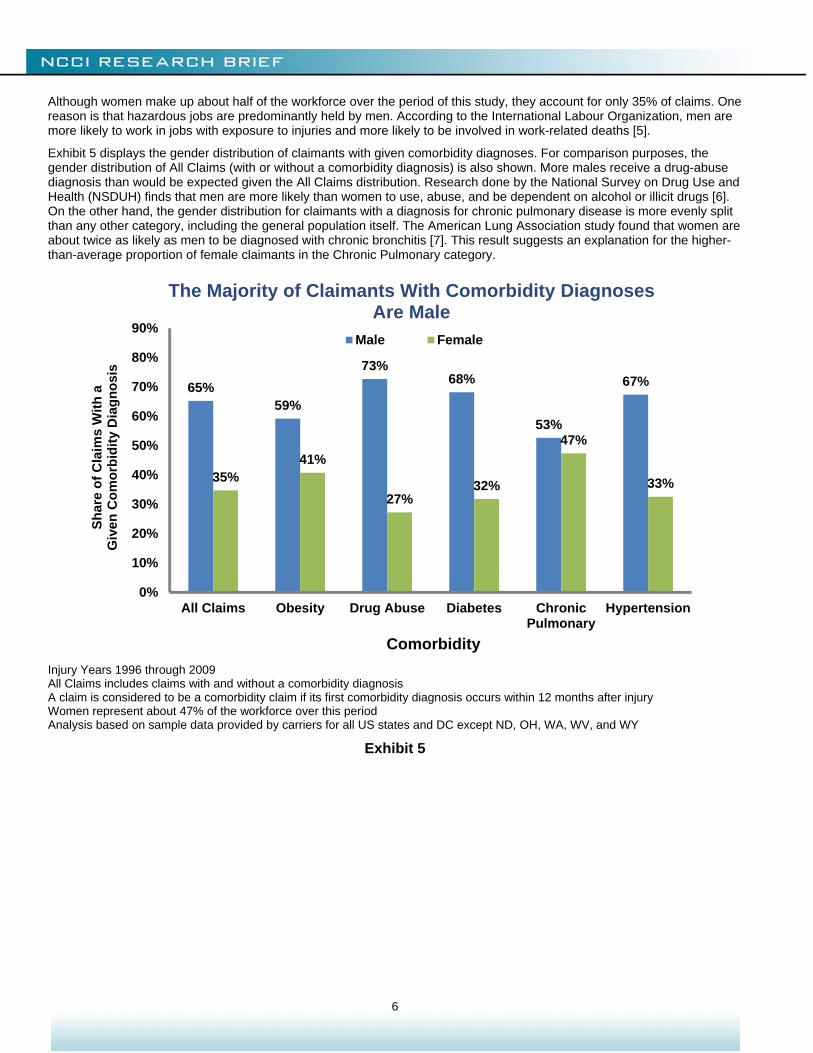
Although women make up about half of the workforce over the period of this study, they account for only 35% of claims. One reason is that hazardous jobs are predominantly held by men. According to the International Labour Organization, men are more likely to work in jobs with exposure to injuries and more likely to be involved in work-related deaths [5].
Exhibit 5 displays the gender distribution of claimants with given comorbidity diagnoses. For comparison purposes, the gender distribution of All Claims (with or without a comorbidity diagnosis) is also shown. More males receive a drug-abuse diagnosis than would be expected given the All Claims distribution. Research done by the National Survey on Drug Use and Health (NSDUH) finds that men are more likely than women to use, abuse, and be dependent on alcohol or illicit drugs [6]. On the other hand, the gender distribution for claimants with a diagnosis for chronic pulmonary disease is more evenly split than any other category, including the general population itself. The American Lung Association study found that women are about twice as likely as men to be diagnosed with chronic bronchitis [7]. This result suggests an explanation for the higher-than-average proportion of female claimants in the Chronic Pulmonary category.
Injury Years 1996 through 2009 All Claims includes claims with and without a comorbidity diagnosis A claim is considered to be a comorbidity claim if its first comorbidity diagnosis occurs within 12 months after injury Women represent about 47% of the workforce over this period Analysis based on sample data provided by carriers for all US states and DC except ND, OH, WA, WV, and WY
Exhibit 5
65%59%
73%68%
53%
67%
35%41%
27%32%
47%
33%
0%
10%
20%
30%
40%
50%
60%
70%
80%
90%
All Claims Obesity Drug Abuse Diabetes ChronicPulmonary
Hypertension
Sh
are
of
Cla
ims
Wit
h a
G
iven
Co
mo
rbid
ity
Dia
gn
osi
s
Comorbidity
Male Female
The Majority of Claimants With Comorbidity Diagnoses Are Male
7
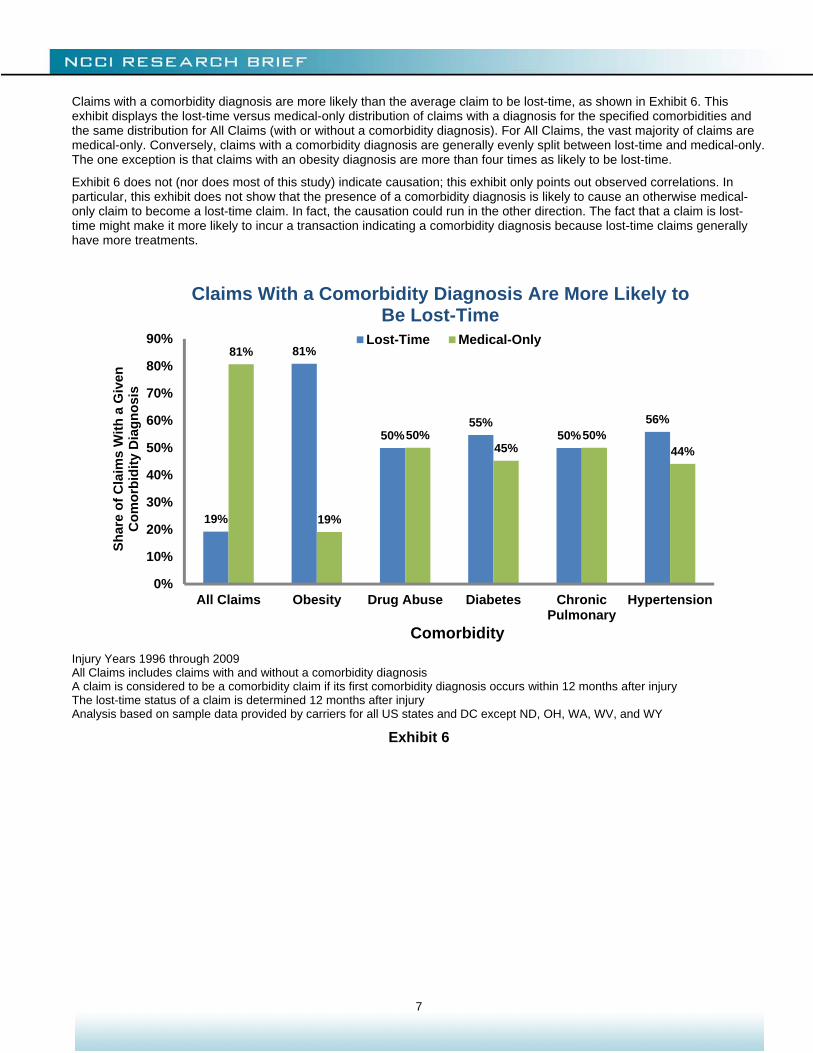
Claims with a comorbidity diagnosis are more likely than the average claim to be lost-time, as shown in Exhibit 6. This exhibit displays the lost-time versus medical-only distribution of claims with a diagnosis for the specified comorbidities and the same distribution for All Claims (with or without a comorbidity diagnosis). For All Claims, the vast majority of claims are medical-only. Conversely, claims with a comorbidity diagnosis are generally evenly split between lost-time and medical-only. The one exception is that claims with an obesity diagnosis are more than four times as likely to be lost-time.
Exhibit 6 does not (nor does most of this study) indicate causation; this exhibit only points out observed correlations. In particular, this exhibit does not show that the presence of a comorbidity diagnosis is likely to cause an otherwise medical-only claim to become a lost-time claim. In fact, the causation could run in the other direction. The fact that a claim is lost-time might make it more likely to incur a transaction indicating a comorbidity diagnosis because lost-time claims generally have more treatments.
Injury Years 1996 through 2009 All Claims includes claims with and without a comorbidity diagnosis A claim is considered to be a comorbidity claim if its first comorbidity diagnosis occurs within 12 months after injury The lost-time status of a claim is determined 12 months after injury Analysis based on sample data provided by carriers for all US states and DC except ND, OH, WA, WV, and WY
Exhibit 6
19%
81%
50%55%
50%56%
81%
19%
50%45%
50%44%
0%
10%
20%
30%
40%
50%
60%
70%
80%
90%
All Claims Obesity Drug Abuse Diabetes ChronicPulmonary
Hypertension
Sh
are
of
Cla
ims
Wit
h a
Giv
en
Co
mo
rbid
ity
Dia
gn
osi
s
Comorbidity
Lost-Time Medical-Only
Claims With a Comorbidity Diagnosis Are More Likely to Be Lost-Time
8
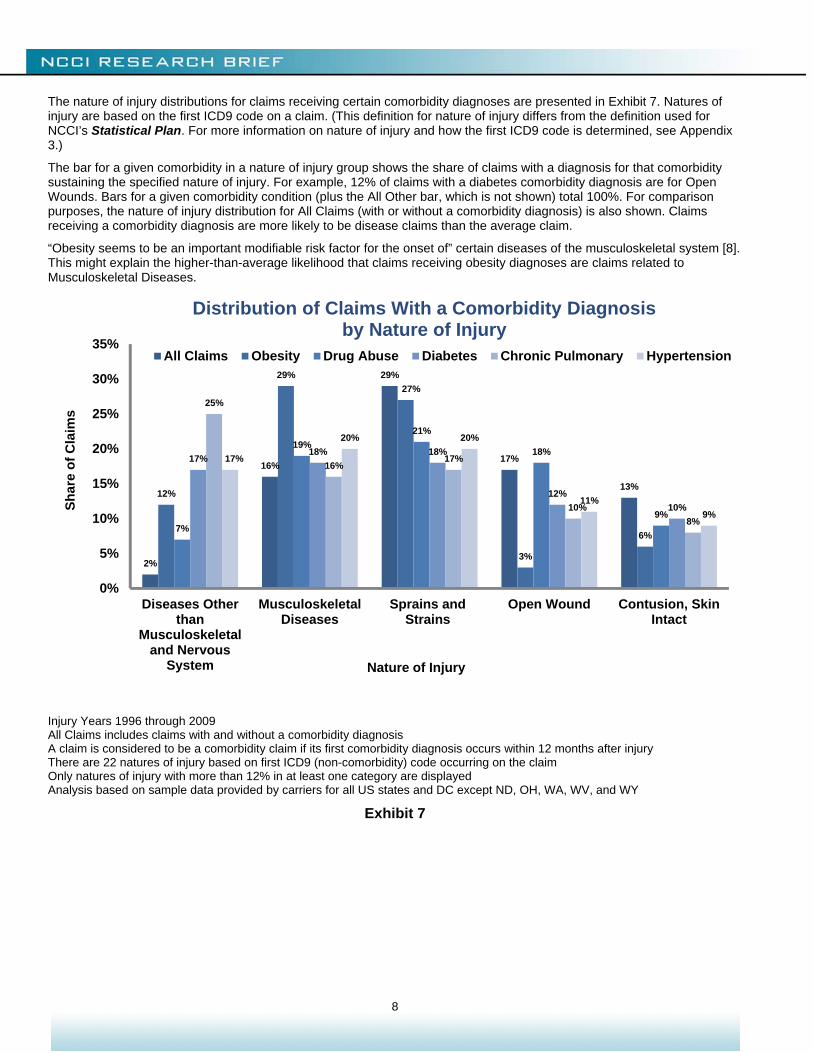
The nature of injury distributions for claims receiving certain comorbidity diagnoses are presented in Exhibit 7. Natures of injury are based on the first ICD9 code on a claim. (This definition for nature of injury differs from the definition used for NCCI’s Statistical Plan. For more information on nature of injury and how the first ICD9 code is determined, see Appendix 3.)
The bar for a given comorbidity in a nature of injury group shows the share of claims with a diagnosis for that comorbidity sustaining the specified nature of injury. For example, 12% of claims with a diabetes comorbidity diagnosis are for Open Wounds. Bars for a given comorbidity condition (plus the All Other bar, which is not shown) total 100%. For comparison purposes, the nature of injury distribution for All Claims (with or without a comorbidity diagnosis) is also shown. Claims receiving a comorbidity diagnosis are more likely to be disease claims than the average claim.
“Obesity seems to be an important modifiable risk factor for the onset of” certain diseases of the musculoskeletal system [8]. This might explain the higher-than-average likelihood that claims receiving obesity diagnoses are claims related to Musculoskeletal Diseases.
Injury Years 1996 through 2009 All Claims includes claims with and without a comorbidity diagnosis A claim is considered to be a comorbidity claim if its first comorbidity diagnosis occurs within 12 months after injury There are 22 natures of injury based on first ICD9 (non-comorbidity) code occurring on the claim Only natures of injury with more than 12% in at least one category are displayed Analysis based on sample data provided by carriers for all US states and DC except ND, OH, WA, WV, and WY
Exhibit 7
2%
16%
29%
17%
13%12%
29%
27%
3%
6%7%
19%
21%
18%
9%
17%18% 18%
12%
10%
25%
16%17%
10%
8%
17%
20% 20%
11%
9%
0%
5%
10%
15%
20%
25%
30%
35%
Diseases Otherthan
Musculoskeletaland Nervous
System
MusculoskeletalDiseases
Sprains andStrains
Open Wound Contusion, SkinIntact
Sh
are
of
Cla
ims
Nature of Injury
All Claims Obesity Drug Abuse Diabetes Chronic Pulmonary Hypertension
Distribution of Claims With a Comorbidity Diagnosis by Nature of Injury

9
When Does the Initial Comorbidity Diagnosis Occur?
The initial comorbidity diagnosis tends to occur early in the life of a claim. For claims with at least one workers compensation comorbidity diagnosis within five years of the date of injury, Exhibit 8 shows the cumulative shares of claims receiving their first comorbidity diagnosis within the given periods. For most comorbidity diagnoses, more than 85% of claims that will have a comorbidity diagnosis within five years had their first comorbidity diagnosis within a year after injury. In fact, other than claims with an obesity diagnosis, more than half of the claimants receiving a comorbidity diagnosis within five years of the date of injury are first diagnosed within one month after injury.
Injury Years 1996 through 2005 A claim is considered to be a comorbidity claim if its first comorbidity diagnosis occurs within 60 months after injury Analysis based on sample data provided by carriers for all US states and DC except ND, OH, WA, WV, and WY
Exhibit 8
0%
10%
20%
30%
40%
50%
60%
70%
80%
90%
100%
0 12 24 36 48
Sh
are
of
Cla
ims
Wit
h a
C
om
orb
idit
y D
iag
no
sis
by
Sp
ecif
ied
Tim
e
Months After Injury
Obesity
Drug Abuse
Diabetes
Chronic Pulmonary
Hypertension
For other than obesity, a comorbidity diagnosis takes place within a month after injury on more than half of claims.
A Claim’s First Comorbidity Diagnosis May Occur Many Months After Injury
Within four months after injury, more than 50% of the obese claims receive a diagnosis for obesity.
10
Who Submits Comorbidity Diagnoses?
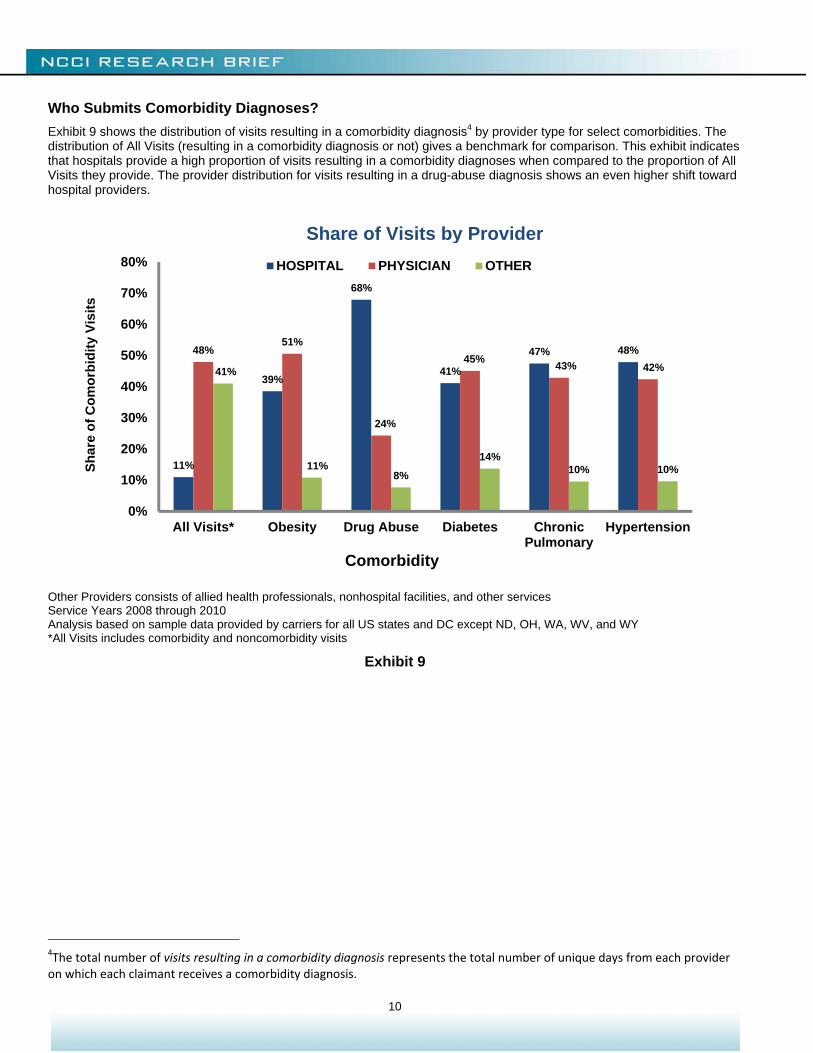
Exhibit 9 shows the distribution of visits resulting in a comorbidity diagnosis4 by provider type for select comorbidities. The distribution of All Visits (resulting in a comorbidity diagnosis or not) gives a benchmark for comparison. This exhibit indicates that hospitals provide a high proportion of visits resulting in a comorbidity diagnoses when compared to the proportion of All Visits they provide. The provider distribution for visits resulting in a drug-abuse diagnosis shows an even higher shift toward hospital providers.
Other Providers consists of allied health professionals, nonhospital facilities, and other services Service Years 2008 through 2010 Analysis based on sample data provided by carriers for all US states and DC except ND, OH, WA, WV, and WY *All Visits includes comorbidity and noncomorbidity visits
Exhibit 9
4The total number of visits resulting in a comorbidity diagnosis represents the total number of unique days from each provider on which each claimant receives a comorbidity diagnosis.
11%
39%
68%
41%
47% 48%48%51%
24%
45%43% 42%41%
11%8%
14%10% 10%
0%
10%
20%
30%
40%
50%
60%
70%
80%
All Visits* Obesity Drug Abuse Diabetes ChronicPulmonary
Hypertension
Sh
are
of
Co
mo
rbid
ity
Vis
its
Comorbidity
HOSPITAL PHYSICIAN OTHER
Share of Visits by Provider
11
What Are the Cost Implications?
This section looks at the impact of comorbidity diagnoses on workers compensation claim costs. We begin by looking at the portion of transactions and the related costs that are associated with a comorbidity diagnosis. We then measure the mix-adjusted cost relativity of claims with a comorbidity diagnosis to otherwise comparable claims. Finally, we present findings from a Bayesian multilevel model that measures the correlation of claim characteristics with the differences in the cost relativities of claims with a comorbidity diagnosis to otherwise comparable claims. The details of the model are presented in Appendix 4.
Claim Costs Associated with Transactions Involving a Comorbidity Diagnosis
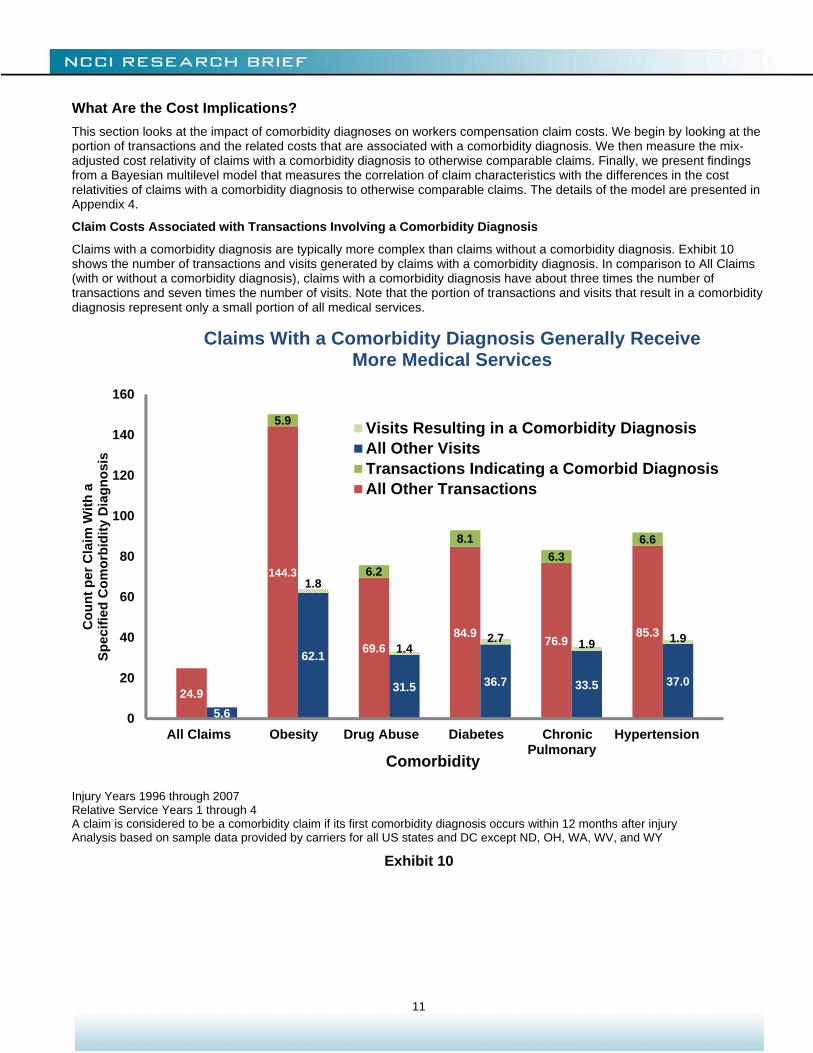
Claims with a comorbidity diagnosis are typically more complex than claims without a comorbidity diagnosis. Exhibit 10 shows the number of transactions and visits generated by claims with a comorbidity diagnosis. In comparison to All Claims (with or without a comorbidity diagnosis), claims with a comorbidity diagnosis have about three times the number of transactions and seven times the number of visits. Note that the portion of transactions and visits that result in a comorbidity diagnosis represent only a small portion of all medical services.
Injury Years 1996 through 2007 Relative Service Years 1 through 4 A claim is considered to be a comorbidity claim if its first comorbidity diagnosis occurs within 12 months after injury Analysis based on sample data provided by carriers for all US states and DC except ND, OH, WA, WV, and WY
Exhibit 10
24.9
144.3
69.684.9
76.985.3
5.9
6.2
8.1
6.3
6.6
5.6
62.1
31.5 36.7 33.5 37.0
1.8
1.42.7 1.9 1.9
0
20
40
60
80
100
120
140
160
All Claims Obesity Drug Abuse Diabetes Chronic Pulmonary
Hypertension
Co
un
t p
er C
laim
Wit
h a
Sp
ecif
ied
Co
mo
rbid
ity
Dia
gn
osi
s
Comorbidity
Visits Resulting in a Comorbidity DiagnosisAll Other VisitsTransactions Indicating a Comorbid DiagnosisAll Other Transactions
Claims With a Comorbidity Diagnosis Generally Receive More Medical Services
12
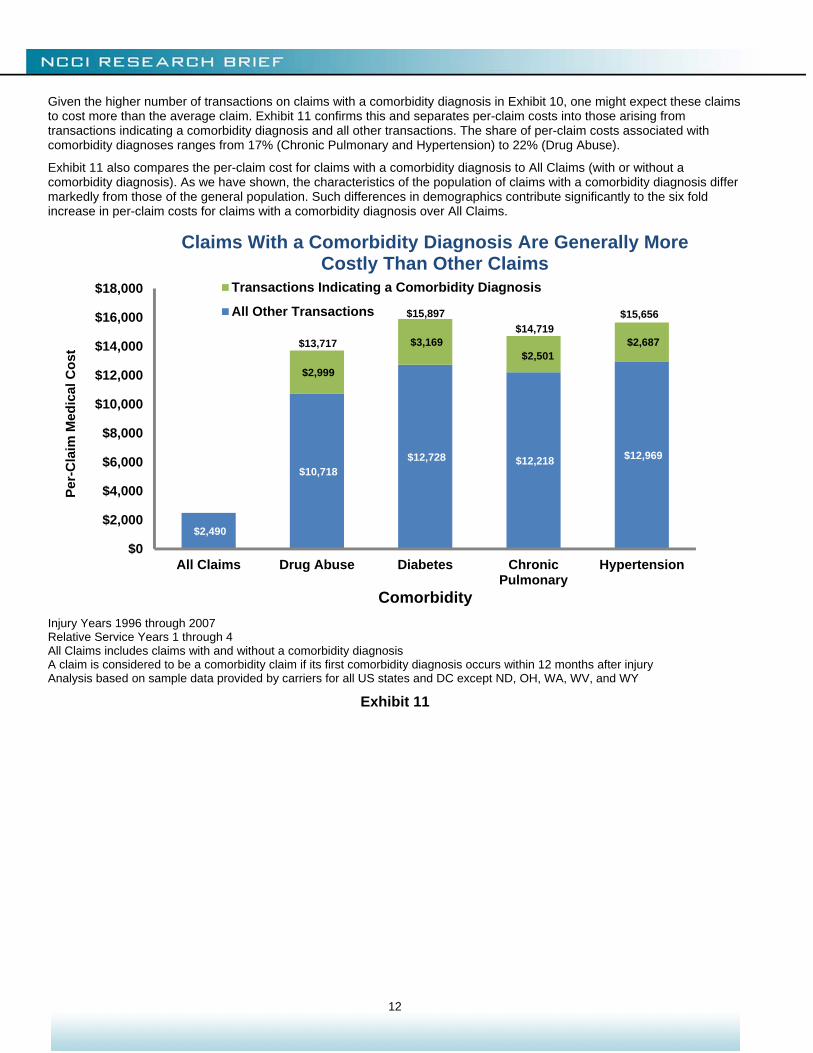
Given the higher number of transactions on claims with a comorbidity diagnosis in Exhibit 10, one might expect these claims to cost more than the average claim. Exhibit 11 confirms this and separates per-claim costs into those arising from transactions indicating a comorbidity diagnosis and all other transactions. The share of per-claim costs associated with comorbidity diagnoses ranges from 17% (Chronic Pulmonary and Hypertension) to 22% (Drug Abuse).
Exhibit 11 also compares the per-claim cost for claims with a comorbidity diagnosis to All Claims (with or without a comorbidity diagnosis). As we have shown, the characteristics of the population of claims with a comorbidity diagnosis differ markedly from those of the general population. Such differences in demographics contribute significantly to the six fold increase in per-claim costs for claims with a comorbidity diagnosis over All Claims.
Injury Years 1996 through 2007 Relative Service Years 1 through 4 All Claims includes claims with and without a comorbidity diagnosis A claim is considered to be a comorbidity claim if its first comorbidity diagnosis occurs within 12 months after injury Analysis based on sample data provided by carriers for all US states and DC except ND, OH, WA, WV, and WY
Exhibit 11
$2,490
$10,718 $12,728 $12,218 $12,969
$2,999
$3,169 $2,501
$2,687
$0
$2,000
$4,000
$6,000
$8,000
$10,000
$12,000
$14,000
$16,000
$18,000
All Claims Drug Abuse Diabetes ChronicPulmonary
Hypertension
Per
-Cla
im M
edic
al C
ost
Comorbidity
Transactions Indicating a Comorbidity Diagnosis
All Other Transactions
Claims With a Comorbidity Diagnosis Are Generally More Costly Than Other Claims
$13,717
$15,897
$14,719$15,656
13
Mix-Adjusted Cost Relativities
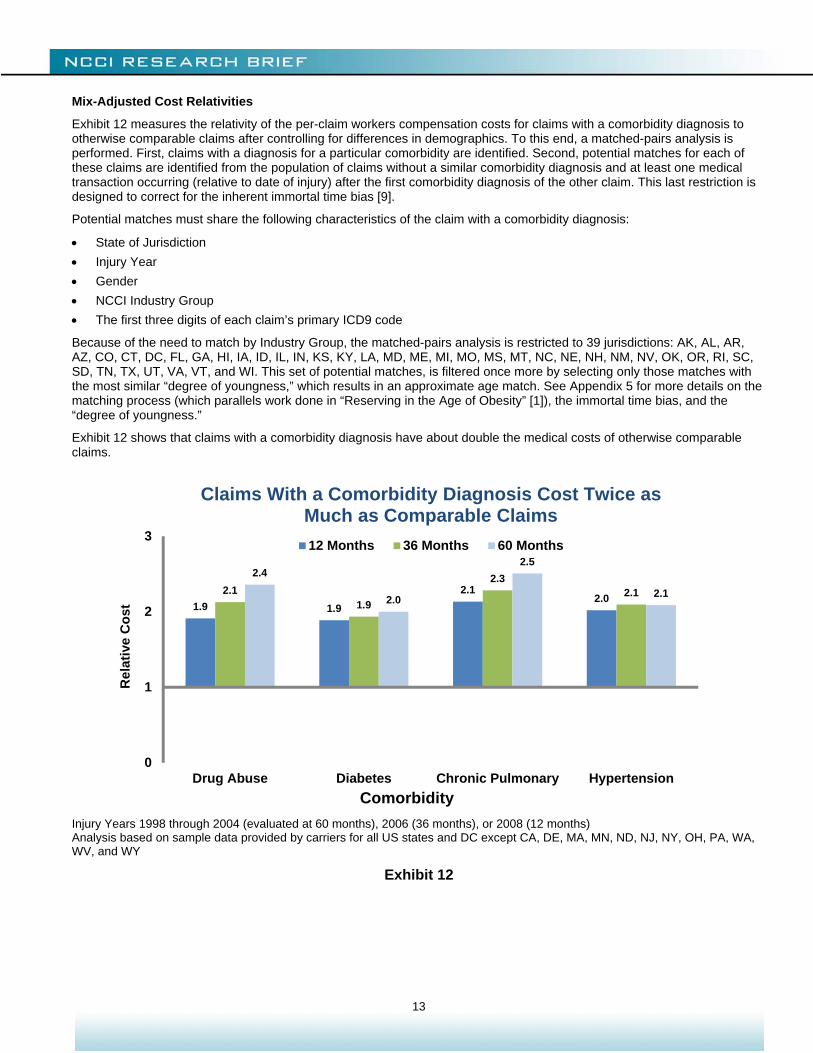
Exhibit 12 measures the relativity of the per-claim workers compensation costs for claims with a comorbidity diagnosis to otherwise comparable claims after controlling for differences in demographics. To this end, a matched-pairs analysis is performed. First, claims with a diagnosis for a particular comorbidity are identified. Second, potential matches for each of these claims are identified from the population of claims without a similar comorbidity diagnosis and at least one medical transaction occurring (relative to date of injury) after the first comorbidity diagnosis of the other claim. This last restriction is designed to correct for the inherent immortal time bias [9].
Potential matches must share the following characteristics of the claim with a comorbidity diagnosis:
State of Jurisdiction
Injury Year
Gender
NCCI Industry Group
The first three digits of each claim’s primary ICD9 code
Because of the need to match by Industry Group, the matched-pairs analysis is restricted to 39 jurisdictions: AK, AL, AR, AZ, CO, CT, DC, FL, GA, HI, IA, ID, IL, IN, KS, KY, LA, MD, ME, MI, MO, MS, MT, NC, NE, NH, NM, NV, OK, OR, RI, SC, SD, TN, TX, UT, VA, VT, and WI. This set of potential matches, is filtered once more by selecting only those matches with the most similar “degree of youngness,” which results in an approximate age match. See Appendix 5 for more details on the matching process (which parallels work done in “Reserving in the Age of Obesity” [1]), the immortal time bias, and the “degree of youngness.”
Exhibit 12 shows that claims with a comorbidity diagnosis have about double the medical costs of otherwise comparable claims.
Injury Years 1998 through 2004 (evaluated at 60 months), 2006 (36 months), or 2008 (12 months) Analysis based on sample data provided by carriers for all US states and DC except CA, DE, MA, MN, ND, NJ, NY, OH, PA, WA, WV, and WY
Exhibit 12
1.9 1.9
2.12.0
2.11.9
2.32.1
2.4
2.0
2.5
2.1
0
1
2
3
Drug Abuse Diabetes Chronic Pulmonary Hypertension
Rel
ativ
e C
ost
Comorbidity
12 Months 36 Months 60 Months
Claims With a Comorbidity Diagnosis Cost Twice as Much as Comparable Claims
14
Differences in Mix-Adjusted Cost Relativities
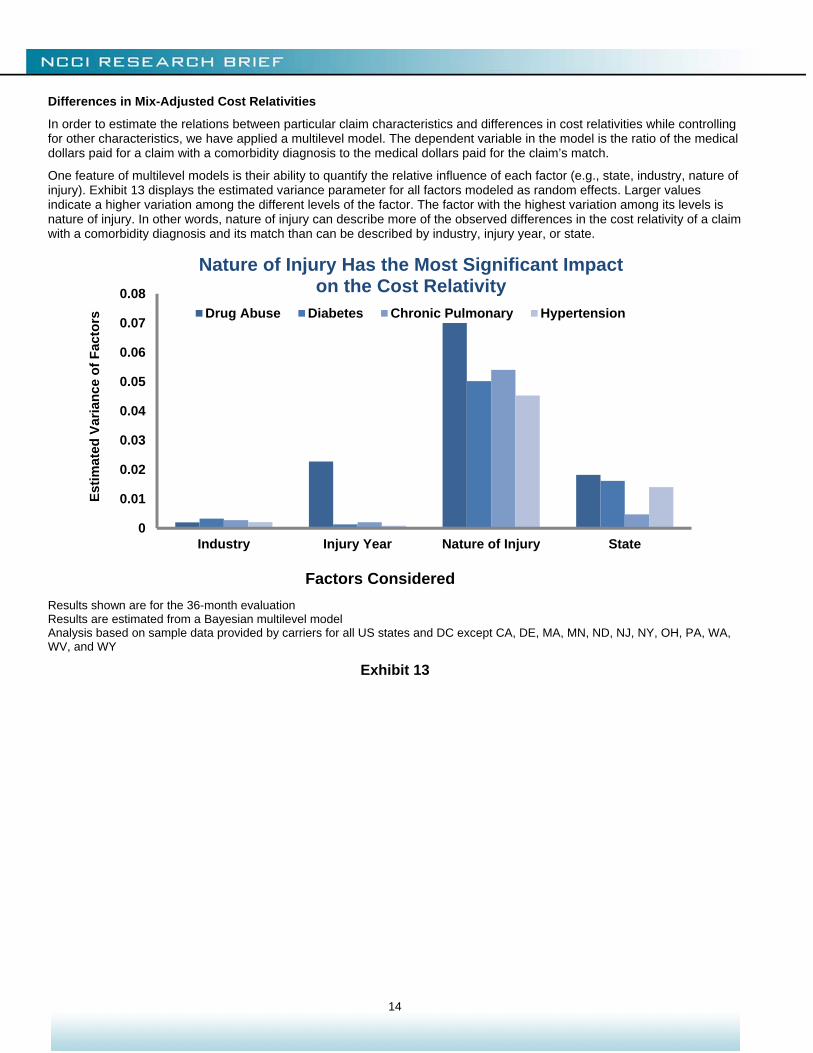
In order to estimate the relations between particular claim characteristics and differences in cost relativities while controlling for other characteristics, we have applied a multilevel model. The dependent variable in the model is the ratio of the medical dollars paid for a claim with a comorbidity diagnosis to the medical dollars paid for the claim’s match.
One feature of multilevel models is their ability to quantify the relative influence of each factor (e.g., state, industry, nature of injury). Exhibit 13 displays the estimated variance parameter for all factors modeled as random effects. Larger values indicate a higher variation among the different levels of the factor. The factor with the highest variation among its levels is nature of injury. In other words, nature of injury can describe more of the observed differences in the cost relativity of a claim with a comorbidity diagnosis and its match than can be described by industry, injury year, or state.
Results shown are for the 36-month evaluation Results are estimated from a Bayesian multilevel model Analysis based on sample data provided by carriers for all US states and DC except CA, DE, MA, MN, ND, NJ, NY, OH, PA, WA, WV, and WY
Exhibit 13
0
0.01
0.02
0.03
0.04
0.05
0.06
0.07
0.08
Industry Injury Year Nature of Injury State
Est
imat
ed V
aria
nce
of
Fac
tors
Factors Considered
Drug Abuse Diabetes Chronic Pulmonary Hypertension
Nature of Injury Has the Most Significant Impact on the Cost Relativity

15
Exhibits 14 (Diabetes), 15 (Hypertension), and 16 (Chronic Pulmonary) display the relationship each nature of injury has with the paid medical cost relativities between claims with a comorbidity diagnosis and their matches. For instance, Exhibit 14 shows that, for claims with a diabetes diagnosis, claim-pairs with a Crushing Injury have a cost relativity that is 33% higher than otherwise comparable claim-pairs with a Contusion (Skin Intact). Similarly, a claim-pair with an Open Wound would have (on average) a 21% smaller cost relativity when compared to a claim-pair with a Contusion (Skin Intact).
Injury Years 1998 through 2006 at the 36-month evaluation Results are estimated from a Bayesian multilevel model; the bands represent 80% credible intervals There were no observations for Poisonings Analysis based on sample data provided by carriers for all US states and DC except CA, DE, MA, MN, ND, NJ, NY, OH, PA, WA, WV, and WY
Exhibit 14
-60%
-40%
-20%
0%
20%
40%
60%
80%
Per
cen
tag
e Im
pac
t O
n C
ost
Rel
ativ
ity
Nature of Injury
Nature of Injury Can Have a Significant Impact on the Cost Relativity
Diabetes

16
Injury Years 1998 through 2006 at the 36-month evaluation Results are estimated from a Bayesian multilevel model; the bands represent 80% credible intervals There were no observations for Poisonings Analysis based on sample data provided by carriers for all US states and DC except CA, DE, MA, MN, ND, NJ, NY, OH, PA, WA, WV, and WY
Exhibit 15
-60%
-40%
-20%
0%
20%
40%
60%
Per
cen
tag
e Im
pac
t O
n C
ost
Rel
ativ
ity
Nature of Injury
Nature of Injury Can Have a Significant Impact on the Cost Relativity
Hypertension

17
Injury Years 1998 through 2006 at the 36-month evaluation Results are estimated from a Bayesian multilevel model; the bands represent 80% credible intervals There were no observations for Poisonings of Late Effects Analysis based on sample data provided by carriers for all US states and DC except CA, DE, MA, MN, ND, NJ, NY, OH, PA, WA, WV, and WY
Exhibit 16
-60%
-40%
-20%
0%
20%
40%
60%
80%
Per
cen
tag
e Im
pac
t o
n
Co
st R
elat
ivit
y
Nature of Injury
Nature of Injury Can Have a Significant Impact on the Cost Relativity
Chronic Pulmonary
18
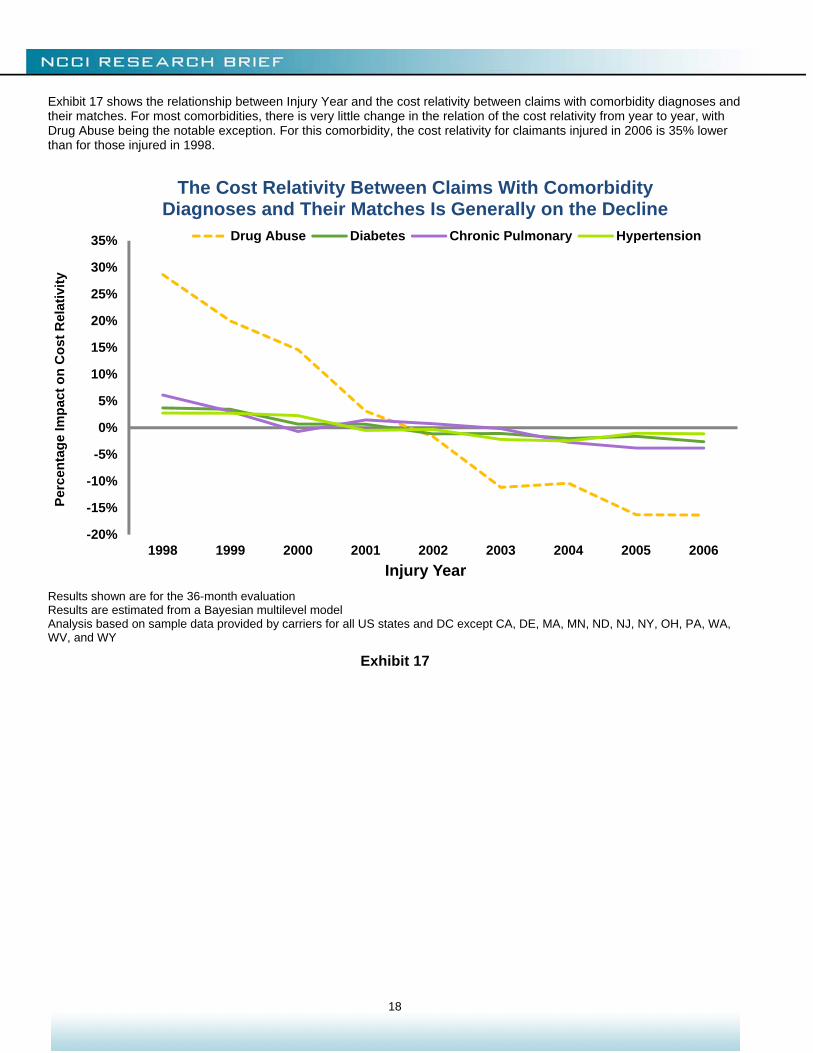
Exhibit 17 shows the relationship between Injury Year and the cost relativity between claims with comorbidity diagnoses and their matches. For most comorbidities, there is very little change in the relation of the cost relativity from year to year, with Drug Abuse being the notable exception. For this comorbidity, the cost relativity for claimants injured in 2006 is 35% lower than for those injured in 1998.
Results shown are for the 36-month evaluation Results are estimated from a Bayesian multilevel model Analysis based on sample data provided by carriers for all US states and DC except CA, DE, MA, MN, ND, NJ, NY, OH, PA, WA, WV, and WY
Exhibit 17
-20%
-15%
-10%
-5%
0%
5%
10%
15%
20%
25%
30%
35%
1998 1999 2000 2001 2002 2003 2004 2005 2006
Per
cen
tag
e Im
pac
t o
n C
ost
Rel
ativ
ity
Injury Year
Drug Abuse Diabetes Chronic Pulmonary Hypertension
The Cost Relativity Between Claims With Comorbidity Diagnoses and Their Matches Is Generally on the Decline

19
The industry from which a claim originates can be significantly related to its indemnity benefit duration. A construction worker sustaining a broken leg may be out of work for months. Conversely, if the claimant were an office worker, the claimant might return after only a few days. Analogously, one might expect to find a relation between Industry Group5 and the cost relativity between claims with comorbidity diagnoses to their matches. Exhibit 18 shows that claims originating from the Goods and Services industry generally have a smaller cost relativity between matched claim-pairs than those originating in the Manufacturing industry.
5 NCCI groups class codes into Industry Groups.
Results shown are for the 36-month evaluation Results are estimated from a Bayesian multilevel model Analysis based on sample data provided by carriers for all US states and DC except CA, DE, MA, MN, ND, NJ, NY, OH, PA, WA, WV, and WY
Exhibit 18

20
Time to heal (as measured by either days away from work or average medical severity) generally increases with claimant age at time of injury [10]. Exhibit 19 shows that the cost relativity between claims with comorbidity diagnoses and their matches also increases with age. This is of particular interest because the presence of a recorded comorbidity diagnosis and claimant age at time of injury are positively correlated (Exhibit 4). Thus, the effect of age and the presence of a recorded comorbidity diagnosis likely impact claim costs simultaneously. Older claimants tend to have (1) higher medical costs and (2) higher cost relativities between claims with comorbidity diagnoses and otherwise comparable claims than do younger claimants. Alternatively, since older claimants are more likely to receive a comorbidity diagnosis (Exhibit 4), the increase of claim costs with age could be attributed to the change in mix of claims with and those without a comorbidity diagnosis. Since age is not matched exactly, some of the effect shown in this exhibit might be due to inexact matching. See Appendix 4 and 5 for details.
Results shown are for the 36-month evaluation The impact of age is assumed to follow a linear spline which is estimated using reversible-jump Markov chain Monte Carlo Results are estimated from a Bayesian multilevel model Analysis based on sample data provided by carriers for all US states and DC except CA, DE, MA, MN, ND, NJ, NY, OH, PA, WA, WV, and WY
Exhibit 19
21
CLOSING REMARKS The share of claims with a comorbidity diagnosis has been rising over the past several years, and the cost of claims with a comorbidity diagnosis is about twice the costs of comparable claims without such comorbidity diagnoses.
Future research may address questions such as:
To what degree does legislation impact state differences?
Does the recording of comorbidity diagnoses continue throughout the life of a claim?
What types of treatments are associated with recorded comorbidity diagnoses?
How prevalent are tobacco and alcohol abuse in the Drug Abuse category?
NCCI will continue to monitor and report on these and other important issues that affect the workers compensation industry.
CREDITS Barry Lipton, John Robertson, and Chun Shyong of Actuarial and Economic Services contributed to this study.
22
APPENDICES
Appendix 1—Mappings Between Comorbidities and ICD9 Codes Comorbidity ICD9 Codes
Cancer* 140–200, 203–208
Cerebrovascular Disease* 430–433, 435
Chronic Pulmonary* 491–493
Dementia* 290, 291, 294
Diabetes* 250
Drug Abuse* 304, 305
HIV 042
Heart Disease* 398, 402, 410, 411, 428
Hemiplegia* 342, 434, 436, 437
Hypertension 401
Liver Disease* 070, 570–573
Renal Disease* 403, 404, 580–586
Obesity 278
Peripheral Vascular Disease* 440–447
Pregnancy 630–679, 760–779, V22, V23
Ulcer Disease* 531–534
* Categories originate from [2]
23
Appendix 2—CDC Estimates
“The Behavioral Risk Factor Surveillance System (BRFSS) is the world’s largest, on-going telephone health survey system, tracking health conditions and risk behaviors in the United States yearly since 1984. Currently, data are collected monthly in all 50 states, the District of Columbia, Puerto Rico, the U.S. Virgin Islands, and Guam.”
Source: cdc.gov/brfss/index.htm.
Survey questions can change slightly from year to year.
Hypertension
Hypertension estimates come from the BRFSS and cover various states, DC, and territories. The number of states (and territories) varies from 53 to 54 over the time period displayed. Numbers shown indicate the percentage of adults who have been told they have high blood pressure.
Obesity
Obesity estimates come from the BRFSS and cover various states, DC, and territories. The number of states (and territories) varies from 52 to 54 over the time period displayed. Numbers shown represent the share of respondents with a BMI between 30.0 and 99.8. Each respondent’s BMI was calculated from his or her disclosed height and weight.
Diabetes
Numbers represent estimates of the “percent of the U.S. population with diagnosed diabetes by using data from the National Health Interview Survey (NHIS) of the National Center for Health Statistics (NCHS), Centers for Disease Control and Prevention (CDC). Conducted continuously since 1957, the NHIS is a health survey of the civilian, noninstitutionalized, household population of the United States. The survey provides information on the health of the United States population, including information on the prevalence and incidence of disease, the extent of disability, and the use of health care services.”
“… all sampled adults are asked whether a health professional had ever told them they had diabetes. To exclude gestational diabetes, women were asked whether they had been told they had diabetes other than during pregnancy. Also, parents of sampled children were asked whether their child had diabetes. Three-year averages were used to improve the precision of the annual estimates.”
Source: cdc.gov/diabetes/statistics/prev/national/figage.htm.
24
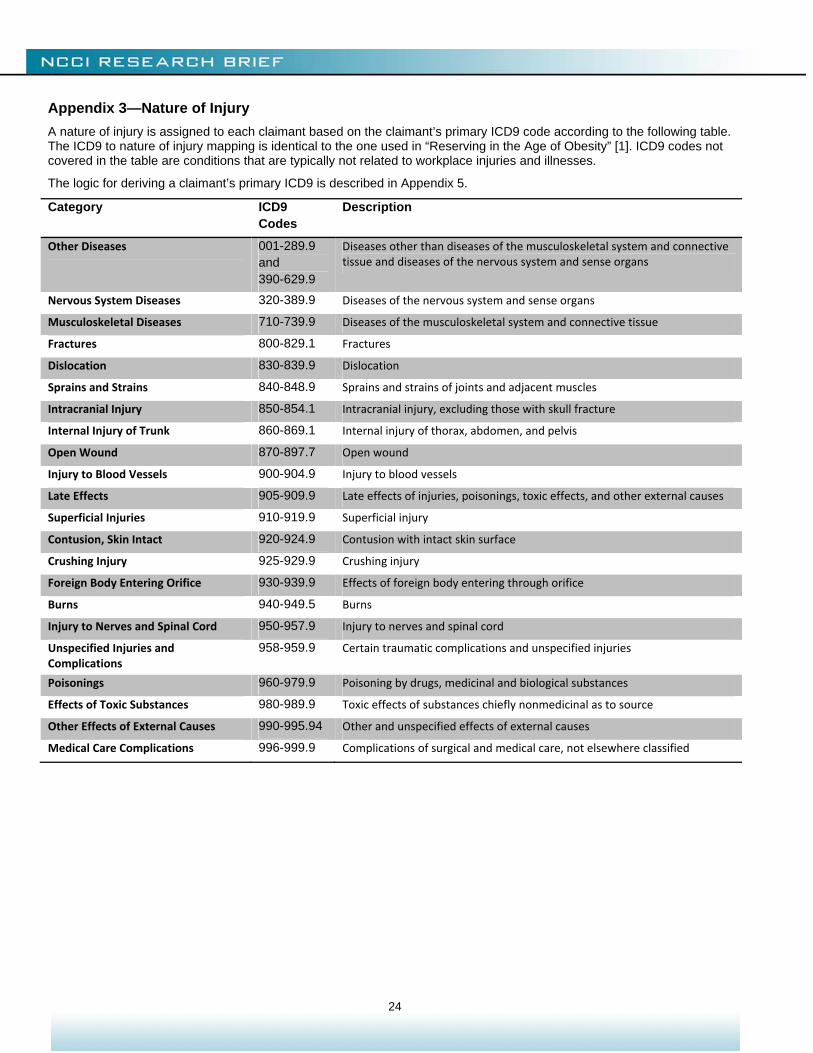
Appendix 3—Nature of Injury
A nature of injury is assigned to each claimant based on the claimant’s primary ICD9 code according to the following table. The ICD9 to nature of injury mapping is identical to the one used in “Reserving in the Age of Obesity” [1]. ICD9 codes not covered in the table are conditions that are typically not related to workplace injuries and illnesses.
The logic for deriving a claimant’s primary ICD9 is described in Appendix 5.
Category ICD9 Codes
Description
Other Diseases 001-289.9 and 390-629.9
Diseases other than diseases of the musculoskeletal system and connective tissue and diseases of the nervous system and sense organs
Nervous System Diseases 320-389.9 Diseases of the nervous system and sense organs
Musculoskeletal Diseases 710-739.9 Diseases of the musculoskeletal system and connective tissue
Fractures 800-829.1 Fractures
Dislocation 830-839.9 Dislocation
Sprains and Strains 840-848.9 Sprains and strains of joints and adjacent muscles
Intracranial Injury 850-854.1 Intracranial injury, excluding those with skull fracture
Internal Injury of Trunk 860-869.1 Internal injury of thorax, abdomen, and pelvis
Open Wound 870-897.7 Open wound
Injury to Blood Vessels 900-904.9 Injury to blood vessels
Late Effects 905-909.9 Late effects of injuries, poisonings, toxic effects, and other external causes
Superficial Injuries 910-919.9 Superficial injury
Contusion, Skin Intact 920-924.9 Contusion with intact skin surface
Crushing Injury 925-929.9 Crushing injury
Foreign Body Entering Orifice 930-939.9 Effects of foreign body entering through orifice
Burns 940-949.5 Burns
Injury to Nerves and Spinal Cord 950-957.9 Injury to nerves and spinal cord
Unspecified Injuries and Complications
958-959.9 Certain traumatic complications and unspecified injuries
Poisonings 960-979.9 Poisoning by drugs, medicinal and biological substances
Effects of Toxic Substances 980-989.9 Toxic effects of substances chiefly nonmedicinal as to source
Other Effects of External Causes 990-995.94 Other and unspecified effects of external causes
Medical Care Complications 996-999.9 Complications of surgical and medical care, not elsewhere classified
25
Appendix 4—Multilevel Model
The same multilevel model is estimated for each comorbidity. Each comorbidity is analyzed separately without regard to interaction among multiple comorbidities. The model used is identical to the one used in Laws and Schmid [1], who provide a more in-depth discussion.
The dependent variable is the natural logarithm of the ratio of paid medical costs for the claim with a comorbidity diagnosis to its match.
The model is semi-parametric. A linear spline measures the impact of age; the number of knots and their locations are both estimated endogenously.
All other independent variables—Gender, State, NCCI Industry Group, Injury Group, and Year—are discrete.
Appendix 5—Matching Algorithm Details
Implications of Matching by Industry Group
Because of the need to match by Industry Group, the matched-pairs analysis is restricted to the 39 jurisdictions for which we had industry group mappings (and sufficient data history) at the time of the study. The jurisdictions used are AK, AL, AR, AZ, CO, CT, DC, FL, GA, HI, IA, ID, IL, IN, KS, KY, LA, MD, ME, MI, MO, MS, MT, NC, NE, NH, NM, NV, OK, OR, RI, SC, SD, TN, TX, UT, VA, VT, and WI.
Primary ICD9 Code
The logic for the derivation of a claimant’s primary ICD9 code was developed by Schmid, Laws, and Montero in [9] and is outlined below.
The primary ICD9 code of a given claim is the first ICD9 code associated with reported medical transactions (with a valid date of service) based on the following order of priority:
(1) Paid amount must be greater than zero
(2) Provider Group must be one of the following four:
01 (Physician), 04 (Hospital, Ambulatory Surgical Center, X-Ray, Lab), 05 (Clinic), 07 (Non-Medical)
When no such transaction exists, transactions from all other providers are considered:
02 (Chiropractor), 03 (Therapist), 06 (Pharmacies and Durable Medical Equipment Center), 08 (Other)
(3) Transactions are selected from the first service date, subject to data cleansing considerations
(4) From the ICD9 codes resulting from steps 1 through 3, the ICD9 codes associated with the highest paid amount over the (heretofore recorded) life of the claim are selected
The paid amount of a transaction is assigned in full to any ICD9 code associated with the transaction
(5) If there are ties after applying the mentioned criteria, an ICD9 code is randomly selected from the set of tied codes
26
Immortal Time Bias
The presence of the immortal time bias in studies such as this is discussed in Schmid, Laws, and Montero [9].
Suppose there are two types of claims, simple and complex, and that preexisting conditions, such as comorbidities, do not impact the likelihood that a claim will be simple or complex. Thus, the distribution of preexisting conditions is the same between the two types.
Suppose, as the name implies, complex claims have many more transactions than simple claims. This study is only able to identify claimants with comorbidities if they generate a transaction through the workers compensation system with an associated ICD9 code. If a claimant receives more treatments, there is a higher chance that the presence of any preexisting conditions will complicate at least one of the treatments and be indicated on the corresponding transaction. Thus, more claimants involved in complex claims are identified as having a comorbidity even though the presence or absence of the comorbidity does not impact the likelihood that the claim will be a complex claim. Such a selection process detracts from the relevance of any findings related to cost impact.
The approach used to mitigating the impact of the immortal time bias as well as an analysis of its performance is also outlined in Schmid, Laws, and Montero [9]. In order for a claimant without a comorbidity diagnosis to be an eligible match for a claimant with a comorbidity diagnosis, the claimant without a comorbidity diagnosis must have at least one medical transaction occurring after (measured relative to each claim’s respective injury date) the first comorbidity diagnosis on the other claim.
Degree of Youngness
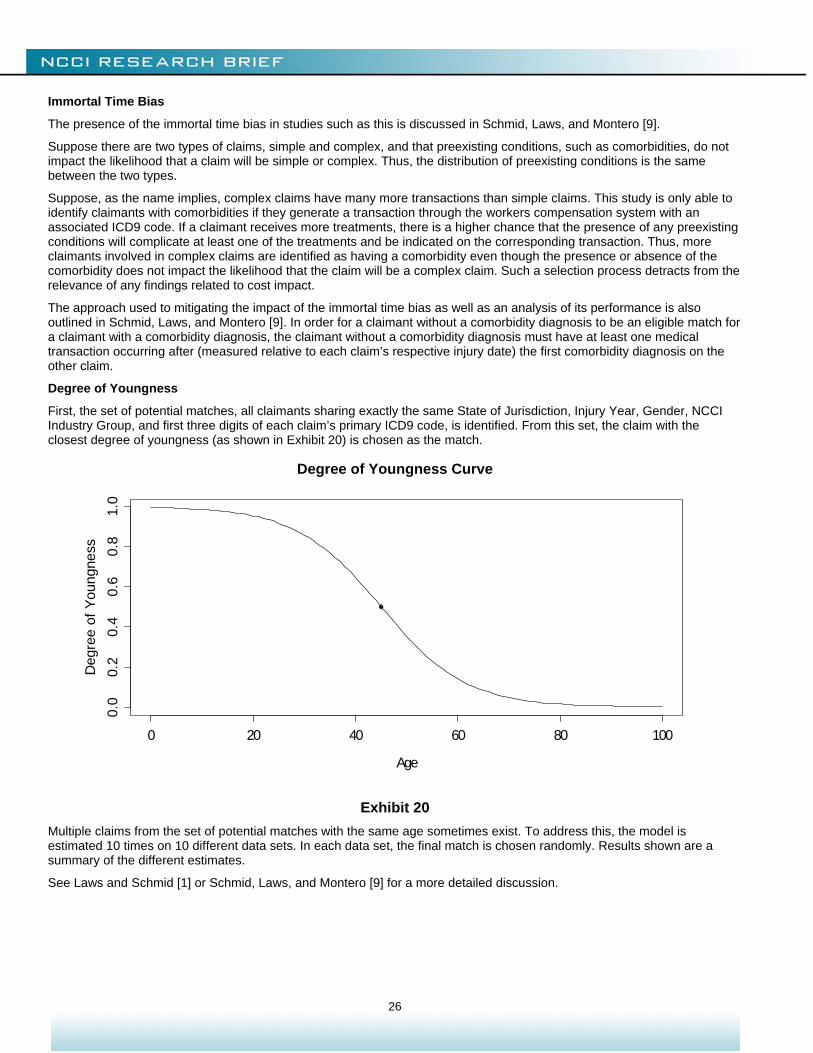
First, the set of potential matches, all claimants sharing exactly the same State of Jurisdiction, Injury Year, Gender, NCCI Industry Group, and first three digits of each claim’s primary ICD9 code, is identified. From this set, the claim with the closest degree of youngness (as shown in Exhibit 20) is chosen as the match.
Degree of Youngness Curve
Exhibit 20
Multiple claims from the set of potential matches with the same age sometimes exist. To address this, the model is estimated 10 times on 10 different data sets. In each data set, the final match is chosen randomly. Results shown are a summary of the different estimates.
See Laws and Schmid [1] or Schmid, Laws, and Montero [9] for a more detailed discussion.
0 20 40 60 80 100
0.0
0.2
0.4
0.6
0.8
1.0
Age
Deg
ree
of Y
oung
ness
27
REFERENCES [1] Laws, Chris and Frank Schmid, “Reserving in the Age of Obesity,” NCCI, November 1, 2010,
http://www.ncci.com/nccimain/IndustryInformation/ResearchOutlook/Pages/AgeofObesitySept09.aspx.
[2] D'Hoore, W., C. Sicotte, and C. Tilquin, “Risk Adjustment in Outcome Assessment: the Charlson Comorbidity Index,” Methods of Information in Medicine 32(5), 1993, pp. 382–387.
[3] Charlson, M., P. Pompei, K. Ales, and C. MacKenzie, “A New Method of Classifying Prognostic Comorbidity in Longitudinal Studies: Development and Validation,” Journal of Chronic Diseases 40(5), 1987, pp. 373–383.
[4] Roberts, S., “More states passing firefighter comp laws—Public employers say presumptive statutes costly, unnecessary,” Business Insurance, June 1, 2008, http://www.businessinsurance.com/apps/pbcs.dll/article?AID=9999100025059
[5] “Providing safe and healthy workplaces for both women and men,” International Labour Organization, Access July 6, 2012, http://www.ilo.org/wcmsp5/groups/public/@dgreports/@gender/documents/publication/wcms_105060.pdf.
[6] “Gender Differences in Substance Dependence and Abuse,” National Survey on Drug Use and Health, Office of Applied Studies, Substance Abuse & Mental Health Services Administration, October 29, 2004, http://www.samhsa.gov/data/2k4/genderDependence/genderDependence.htm#link_group_1.
[7] “Trends in COPD (Chronic Bronchitis and Emphysema): Morbidity and Mortality,” American Lung Association, Epidemiology and Statistics Unit Research and Program Services Division, August 2011, http://www.lung.org/finding-cures/our-research/trend-reports/copd-trend-report.pdf
[8] Reijman, Pols, Bergink, Hazes, Belo, Lievense, and Bierma-Zeinstra, “Body mass index associated with onset and progression of osteoarthritis of the knee but not of the hip: The Rotterdam Study,” Annals of the Rheumatic Diseases 66(2), February 2017, pp. 158–162, http://www.ncbi.nlm.nih.gov/pmc/articles/PMC1798486/
[9] Schmid, Frank, Chris Laws, and Matthew Montero, “Indemnity Benefit Duration and Obesity,” NCCI, May 29, 2012, https://www.ncci.com/nccimain/IndustryInformation/ResearchOutlook/Pages/IndemnityBenefitDuration-Obesity.aspx.
[10] Wolf, Martin, “Claims Characteristics of Workers Aged 65 and Older,” NCCI, January 15, 2010, https://www.ncci.com/nccimain/IndustryInformation/ResearchOutlook/Pages/Claims-65andOlder.aspx.
© Copyright 2012 National Council on Compensation Insurance, Inc. All Rights Reserved. THE RESEARCH ARTICLES AND CONTENT DISTRIBUTED BY NCCI ARE PROVIDED FOR GENERAL INFORMATIONAL PURPOSES ONLY AND ARE PROVIDED “AS IS.” NCCI DOES NOT GUARANTEE THEIR ACCURACY OR COMPLETENESS NOR DOES NCCI ASSUME ANY LIABILITY THAT MAY RESULT IN YOUR RELIANCE UPON SUCH INFORMATION. NCCI EXPRESSLY DISCLAIMS ANY AND ALL WARRANTIES OF ANY KIND INCLUDING ALL EXPRESS, STATUTORY AND IMPLIED WARRANTIES INCLUDING THE IMPLIED WARRANTIES OF MERCHANTABILITY AND FITNESS FOR A PARTICULAR PURPOSE.


![WORKERS’ COMPENSATION APPEALS BOARD …...WORKERS’ COMPENSATION APPEALS BOARD DIRECTORY 1 Laughlin, Falbo, Levy, &MoresiLLP ANAHEIM WORKERS’ COMPENSATION APPEALS BOARD [AHM]](https://img.pdfslide.net/doc/110x75/5eaa700449f5fa538c64e567/workersa-compensation-appeals-board-workersa-compensation-appeals-board.jpg)