Embed Size (px)
Citation preview
Compact Soft X-Ray Microscopy:Sources, Optics and Instrumentation
PER TAKMAN
PhD ThesisDepartment of Applied PhysicsRoyal Institute of TechnologyStockholm, Sweden 2007
TRITA-FYS 2007:25ISSN 0280-316XISRN KTH/FYS/--07:25-SEISBN 978-91-7178-613-5
KTHSE-100 44 Stockholm
SWEDEN
Akademisk avhandling som med tillstånd av Kungl Tekniska Högskolan framläggestill offentlig granskning för avläggande av teknologie doktorsexamen den 4 maj 2007kl. 13.00 i sal FD 5, Roslagstullsbacken 21, Albanova, Kungl Tekniska Högskolan,Stockholm.
© Per Takman, April 2007
Tryck: Universitetsservice US AB

Nog finns det mål och mening i vår färd - men det är vägen, som är mödan värd.
Karin Boye, ur I rörelse från Härdarna (1927)

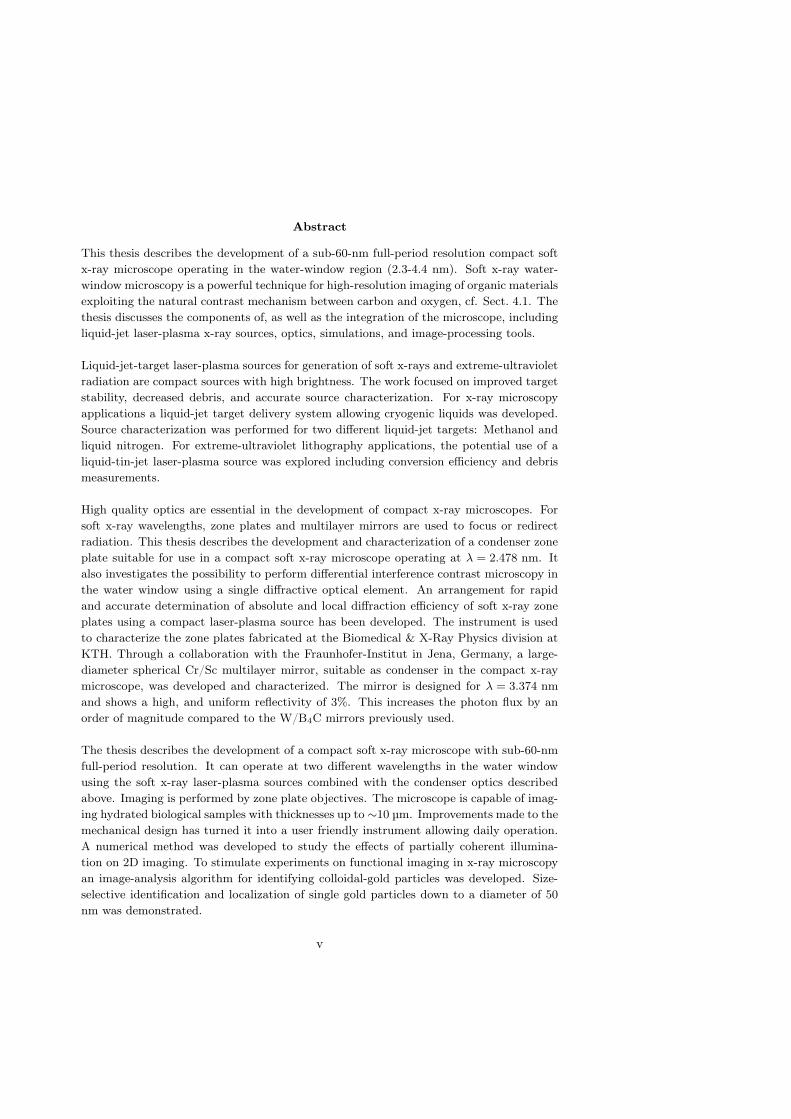
Abstract
This thesis describes the development of a sub-60-nm full-period resolution compact softx-ray microscope operating in the water-window region (2.3-4.4 nm). Soft x-ray water-window microscopy is a powerful technique for high-resolution imaging of organic materialsexploiting the natural contrast mechanism between carbon and oxygen, cf. Sect. 4.1. Thethesis discusses the components of, as well as the integration of the microscope, includingliquid-jet laser-plasma x-ray sources, optics, simulations, and image-processing tools.
Liquid-jet-target laser-plasma sources for generation of soft x-rays and extreme-ultravioletradiation are compact sources with high brightness. The work focused on improved targetstability, decreased debris, and accurate source characterization. For x-ray microscopyapplications a liquid-jet target delivery system allowing cryogenic liquids was developed.Source characterization was performed for two different liquid-jet targets: Methanol andliquid nitrogen. For extreme-ultraviolet lithography applications, the potential use of aliquid-tin-jet laser-plasma source was explored including conversion efficiency and debrismeasurements.
High quality optics are essential in the development of compact x-ray microscopes. Forsoft x-ray wavelengths, zone plates and multilayer mirrors are used to focus or redirectradiation. This thesis describes the development and characterization of a condenser zoneplate suitable for use in a compact soft x-ray microscope operating at λ = 2.478 nm. Italso investigates the possibility to perform differential interference contrast microscopy inthe water window using a single diffractive optical element. An arrangement for rapidand accurate determination of absolute and local diffraction efficiency of soft x-ray zoneplates using a compact laser-plasma source has been developed. The instrument is usedto characterize the zone plates fabricated at the Biomedical & X-Ray Physics division atKTH. Through a collaboration with the Fraunhofer-Institut in Jena, Germany, a large-diameter spherical Cr/Sc multilayer mirror, suitable as condenser in the compact x-raymicroscope, was developed and characterized. The mirror is designed for λ = 3.374 nmand shows a high, and uniform reflectivity of 3%. This increases the photon flux by anorder of magnitude compared to the W/B4C mirrors previously used.
The thesis describes the development of a compact soft x-ray microscope with sub-60-nmfull-period resolution. It can operate at two different wavelengths in the water windowusing the soft x-ray laser-plasma sources combined with the condenser optics describedabove. Imaging is performed by zone plate objectives. The microscope is capable of imag-ing hydrated biological samples with thicknesses up to ∼10 µm. Improvements made to themechanical design has turned it into a user friendly instrument allowing daily operation.A numerical method was developed to study the effects of partially coherent illumina-tion on 2D imaging. To stimulate experiments on functional imaging in x-ray microscopyan image-analysis algorithm for identifying colloidal-gold particles was developed. Size-selective identification and localization of single gold particles down to a diameter of 50nm was demonstrated.
v

List of papers
Note: P. A. C. Takman changed his name from P. A. C. Jansson in 2005.
Paper 1 P. A. C. Jansson, B. A. M. Hansson, O. Hemberg, M. Otendal, A. Holmberg,J. de Groot, and H. M. Hertz, Liquid-tin-jet laser-plasma extreme ultravioletgeneration, Appl. Phys. Lett. 84, 2256–2258 (2004).
Paper 2 U. Vogt, R. Frueke, T. Wilhein, H. Stollberg, P. A. C. Jansson, and H. M.Hertz, High-resolution spatial characterization of laser produced plasmas atsoft x-ray wavelengths, Appl. Phys. B 78, 53–58 (2004).
Paper 3 P. A. C. Jansson, U. Vogt, and H. M. Hertz, Liquid-nitrogen-jet laser-plasmasource for compact soft x-ray microscopy, Rev. Sci. Instrum. 76, 043503(2005).
Paper 4 S. Rehbein, A. Holmberg, G. A. Johansson, P. A. C. Jansson, and H. M.Hertz, Fabrication and characterization of a condenser zone plate for com-pact x-ray microscopy, J. Vac. Sci. Technol., B 22, 1118–1122 (2004).
Paper 5 U. Vogt, M. Lindblom, P. A. C. Jansson, T. T. Tuohimaa, A. Holmberg,H. M. Hertz, M. Wieland, and T. Wilhein, Single-optical-element soft-x-rayinterferometry with a laser-plasma x-ray source, Opt. Lett. 30, 2167–2169(2005).
Paper 6 M. Bertilson, P. A. C. Takman, U. Vogt, A. Holmberg, and H. M. Hertz, Lab-oratory arrangement for soft x-ray zone-plate efficiency measurements, Rev.Sci. Instrum. 78, 026103 (2007).
vii
viii
Paper 7 H. Stollberg, S. Yulin, P. A. C. Takman, and H. M. Hertz, High-reflectivityCr/Sc multilayer condenser for compact soft x-ray microscopy, Rev. Sci. In-strum. 77, 123101-1 (2006).
Paper 8 O. von Hofsten, P. A. C. Takman, and U. Vogt, Simulation of partially co-herent image formation in a compact soft x-ray microscope, In press: Ultra-microscopy (2007).
Paper 9 H. Stollberg, P. Guttmann, P. A. C. Takman, and H. M. Hertz, Size-selectivecolloidal-gold localization in transmission x-ray microscopy, J. Microsc. 225,80–87 (2007).
Paper 10 P. A. C. Takman, U. Vogt, and H. M. Hertz, Towards compact x-ray mi-croscopy with liquid-nitrogen-jet laser-plasma source, Proc. 8th Int. Conf.X-ray Microscopy, IPAP Conf. Series 7, 12-14, Himeji (2006).
Paper 11 P. A. C. Takman, H. Stollberg, G. A. Johansson, A. Holmberg, M. Lindblom,and H. M. Hertz, High-resolution compact x-ray microscopy, Accepted by J.Microsc. (2007).
Contents
Abstract v
List of papers vii
Contents ix
1 Introduction 1
2 Soft x-ray sources 52.1 Synchrotron radiation . . . . . . . . . . . . . . . . . . . . . . . . . . 62.2 Free-electron lasers . . . . . . . . . . . . . . . . . . . . . . . . . . . . 82.3 Laser-plasma sources . . . . . . . . . . . . . . . . . . . . . . . . . . . 102.4 Discharge-plasma sources . . . . . . . . . . . . . . . . . . . . . . . . 132.5 X-ray lasers and high-harmonic generation . . . . . . . . . . . . . . . 14
3 Soft x-ray optics 153.1 Reflective optics . . . . . . . . . . . . . . . . . . . . . . . . . . . . . 16
3.1.1 Grazing-incidence mirrors . . . . . . . . . . . . . . . . . . . . 163.1.2 Multilayer mirrors . . . . . . . . . . . . . . . . . . . . . . . . 17
3.2 Diffractive optics . . . . . . . . . . . . . . . . . . . . . . . . . . . . . 203.2.1 Gratings . . . . . . . . . . . . . . . . . . . . . . . . . . . . . . 203.2.2 Zone plates . . . . . . . . . . . . . . . . . . . . . . . . . . . . 213.2.3 Computer-generated holograms . . . . . . . . . . . . . . . . . 24
4 X-ray microscopy 254.1 Resolution and contrast . . . . . . . . . . . . . . . . . . . . . . . . . 254.2 Radiation damage . . . . . . . . . . . . . . . . . . . . . . . . . . . . 274.3 Synchrotron-based x-ray microscopy . . . . . . . . . . . . . . . . . . 28
5 Compact soft x-ray microscopy 315.1 Illumination system . . . . . . . . . . . . . . . . . . . . . . . . . . . 33
ix
x CONTENTS
5.1.1 Liquid-jet laser-plasma source . . . . . . . . . . . . . . . . . . 335.1.2 Condenser arrangements . . . . . . . . . . . . . . . . . . . . . 35
5.2 Imaging system . . . . . . . . . . . . . . . . . . . . . . . . . . . . . . 385.2.1 Sample stage . . . . . . . . . . . . . . . . . . . . . . . . . . . 385.2.2 Imaging optics . . . . . . . . . . . . . . . . . . . . . . . . . . 385.2.3 Image detector . . . . . . . . . . . . . . . . . . . . . . . . . . 39
5.3 Performance of the compact soft x-ray microscope . . . . . . . . . . 395.4 Future development . . . . . . . . . . . . . . . . . . . . . . . . . . . 40
5.4.1 Instrumentation . . . . . . . . . . . . . . . . . . . . . . . . . 405.4.2 Exposure time . . . . . . . . . . . . . . . . . . . . . . . . . . 405.4.3 Phase imaging . . . . . . . . . . . . . . . . . . . . . . . . . . 41
5.5 Towards functional imaging . . . . . . . . . . . . . . . . . . . . . . . 42
6 Summary of papers 45
Acknowledgements 49
Bibliography 51
Chapter 1
Introduction
Microscopy has a long history and it is impossible to say who really inventedthe compound microscope. About 1590, two Dutch spectacle makers, ZacchariasJanssen and his son Hans, while experimenting with several lenses in a tube, dis-covered that objects close to the last lens appeared greatly magnified. That was theforerunner of both the compound microscope and the telescope. In 1609, GalileoGalilei heard of these early experiments, worked out the principles of lenses, andmade a much better instrument with a focusing device. Anton van Leeuwenhoek(1632-1723), is generally credited with bringing the microscope to the attention ofbiologists, although his instruments were simply powerful magnifying glasses. Hestarted as an apprentice in a dry goods store where magnifying glasses were usedto count the threads in cloth. He taught himself new methods for grinding andpolishing tiny lenses of great curvature which gave magnifications up to 270×. Hewas the first to observe and describe bacteria, yeast, the teeming life in a drop ofwater, and the circulation of "blood corpuscles" in capillaries. During his life heused his lenses to make pioneering studies on an extraordinary variety of things,and reported his findings in over a hundred letters to the Royal Society of Eng-land and the French Academy. Another great contributor to microscopy is RobertHooke, who is sometimes credited with inventing the compound light microscope.It consisted of an eyepiece, a field lens and an objective. He studied various ob-jects using his microscope and published the first book on microscopy in 1664 [1]entitled "Micrographia", which is believed to have inspired van Leeuwenhoek inhis work. In the late 19th century the theoretical foundations of light microscopywere established by Ernst Abbe [2, 3], who together with Carl Zeiss constructedthe first diffraction-limited microscope in 1886. This and several other scientificand technical innovations that made microscopes better and easier to handle mademicroscopy more and more popular among scientists [4].
1
2 CHAPTER 1. INTRODUCTION
In microscopy two parameters are important: resolution and contrast. The resolu-tion, i.e., the ability to distinguish physical details, is limited by the imaging wave-length in a conventional far-field microscope. The best achievable resolution for avisible-light bright-field microscope, using immersion objectives, is about 0.44 timesthe employed wavelength [5]. With the invention of the confocal microscope thedepth resolution was greatly enhanced which enabled optical sectioning and 3-D re-construction of thick specimens [6]. By using advanced illumination and non-linearimaging methods from fluorescence microscopy the resolution limit for visible-lightmicroscopy today has been pushed to ∼ 45 nm [7,8].
The desire to study structures smaller than visible-light microscopy can resolve mo-tivated scientists to use a different "illumination" with a shorter wavelength. Thefirst electron microscope, invented in 1931 by Knoll and Ruska [9], used high-energyelectrons with a de Broglie wavelength much shorter than the wavelength of visiblelight. This provided a theoretical resolution comparable to the size of single atoms.The electron microscope has since then developed into an important instrumentfor biology and material science research. Transmission and scanning electron mi-croscopy are the two main approaches for imaging, but the possibility to performlocalized x-ray and electron spectroscopy have become increasingly important. An-other successful approach for studying surface structures with atomic resolution is abranch of microscopy called scanning probe microscopy (SPM). SPM was foundedwith the invention of the scanning tunneling microscope in 1981 [10]. Althoughlimited to the surface of a sample these instruments have become very popular andcan, besides the main field of material science, also be used for examination of wetbiological samples.
The contrast mechanism originally used in visible-light microscopy was natural ab-sorption contrast. However, many interesting biological specimens lack sufficientabsorption contrast to be studied successfully. To enhance contrast in optical mi-croscopy there exist two main classes of techniques. One class of techniques showsdifferences in refractive index as difference in contrast. These methods include,among others, phase-contrast imaging [11] and differential interference contrast [12].The other group of techniques changes the specimen properties, so that the spec-imen shows increased absorption or becomes fluorescent, e.g., immunofluorescencemicroscopy; a very successful method for functional studies in cell biology. However,staining may also introduce artifacts, apparent structural details that are caused bythe processing of the specimen and are, thus, not a legitimate feature of the speci-men. Today, microscopy has developed into a wide research field with a multitudeof applications and the microscope is considered to be one of the most important
3
tools in science.
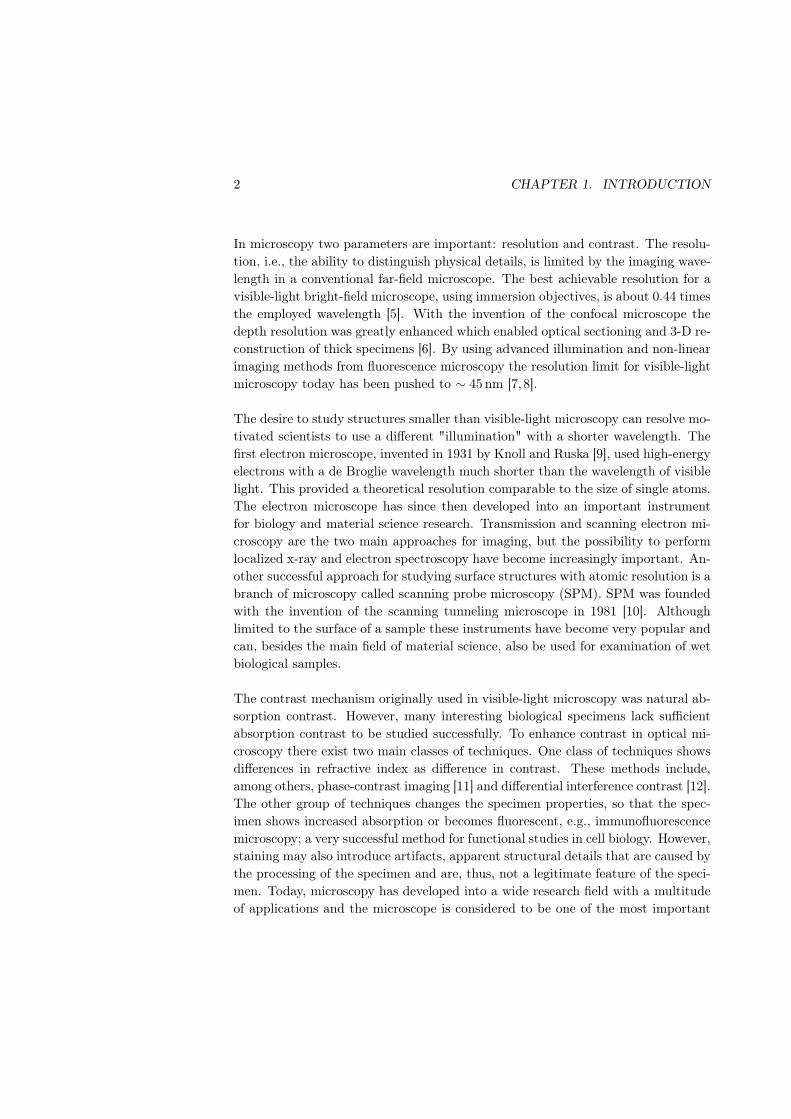
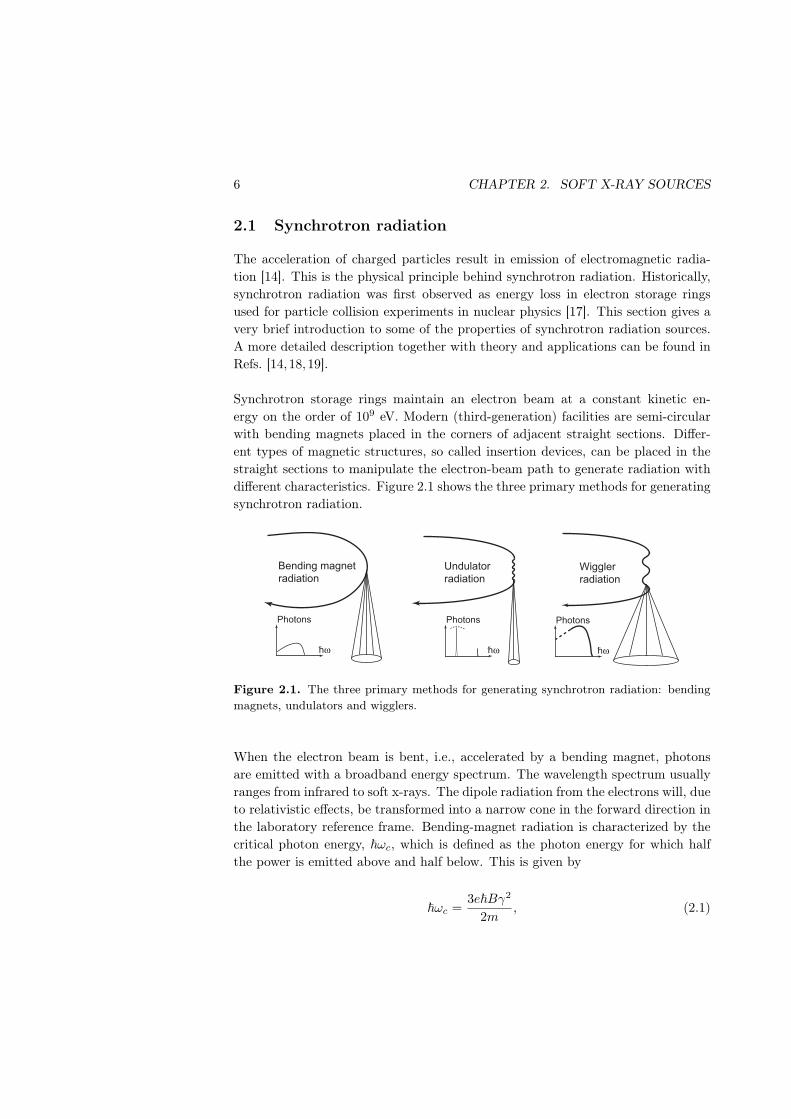
In 1895 Wilhelm Conrad Röntgen announced the discovery of x-rays [13], a part ofthe electromagnetic spectrum with a wavelength much shorter than visible light.The x-ray region is commonly divided into three different wavelength intervals (cf.Fig. 1.1): extreme-ultraviolet radiation with wavelengths between 5 nm and 40 nm(from about 250 eV to 30 eV), soft x-rays between 0.3 nm and 5 nm (from about4 keV to 250 eV), and hard x-rays below 0.3 nm (above 4 keV) [14].
1nm0.1 nm 10 nm
Wavelength
100 eV1 keV10 keV
Photon Energy
Soft X-rays
Hard X-Rays Extreme Ultraviolet
Figure 1.1. Electromagnetic spectrum for x-rays showing the hard x-ray, soft x-ray andextreme-ultraviolet wavelength regions.
This radiation has properties which offer a wide range of applications in medicine,biology, material science and astronomy. X-rays penetrate most matter and therebymake internal structures visible. The contrast mechanisms in imaging with x-raysare based on inner-shell electron excitations which distinguishes it from other mi-croscopy techniques. The wavelength is short, and a soft x-ray microscope couldtherefore potentially perform imaging with very high resolution.
Although suggestions on utilizing x-rays for microscopy came shortly after theirdiscovery, the lack of suitable sources and optics inhibited development until the1970s [15]. Over the last decades microscopes have been developed for the x-raywavelength region. Today there exist a number of x-ray microscopes, both for softand hard x-rays, using different imaging modes, e.g., full-field or scanning [16].Unfortunately these microscopes are located at synchrotron facilities, which makethem less accessible than if they were available in every lab. The recent develop-ment of laboratory-scale sources opened the field for compact x-ray microscopes,potentially making x-ray microscopy more available for researchers.
This thesis concerns the development of liquid-jet laser-plasma x-ray sources, op-tics, simulations, and image-processing tools, used in the construction of a reliable,
4 CHAPTER 1. INTRODUCTION
user friendly, high-resolution compact soft x-ray microscope at the Biomedical &X-Ray Physics division at KTH. With improved laser-plasma sources, condenseroptics, and instrumentation, the performance of the compact microscope has beenpushed to a new level. High-quality images with sub 60-nm resolution can now beacquired with exposure times below 5 minutes. Chapter 2 gives a review on soft x-ray sources with a special emphasis on laser-plasma sources. Chapter 3 introducesthe optical elements that are commonly used in the soft x-ray range. Chapter 4gives an overview of the history and characteristics of x-ray microscopy. Chapter 5describes the compact soft x-ray microscope including a characterization of the per-formance, and finally provides an outlook for the future.
Chapter 2
Soft x-ray sources
There are few natural x-ray sources, which means that x-rays must be generatedartificially. The first person to accomplish this was Wilhelm Conrad Röntgen whodiscovered x-rays in 1895 while exploring the effects of high voltage electrical dis-charges in evacuated glass tubes [13]. His discovery of the electron-impact hardx-ray source had an enormous impact on, e.g., diagnostic radiography and crystal-lography. However, the utilization of the soft x-ray and EUV spectral ranges oc-curred much later, primarily due to technical challenges. The development withinthis spectral regions was impeded not only by the lack of suitable sources and opticsbut also by the requirement of performing the experiments in vacuum, as well asby insensitive detectors.
Several aspects are important when considering soft x-ray sources: Average out-put power, source size and emitted spectrum. Light sources in general are com-pared by their radiance [W/(sr×m2)] or spectral radiance [W/(sr×m2×BW)], de-fined as the radiance divided by bandwidth. Researchers within the field of x-raysources have developed their own units and terminology concerning sources. Spec-tral brilliance or spectral brightness is often used [14]. This unit is defined as[photons/(s×sr×µm2×BW)]. For pulsed sources it is more convenient to use thenumber of photons per pulse instead of photons per second and for line-emittingsources, the bandwidth of one line is often chosen.
Today, there exist a number of soft x-ray sources, and the development of these andnew ones, is quite intense. This chapter gives a short description of each of thesesources with special emphasis on laser-produced plasma sources, as these are ofspecial interest for the development of a compact soft x-ray microscope. However,electron impact sources have been omitted since they generate very few photons inthe soft x-ray region and are thus of limited use for soft x-ray applications.
5
6 CHAPTER 2. SOFT X-RAY SOURCES
2.1 Synchrotron radiation
The acceleration of charged particles result in emission of electromagnetic radia-tion [14]. This is the physical principle behind synchrotron radiation. Historically,synchrotron radiation was first observed as energy loss in electron storage ringsused for particle collision experiments in nuclear physics [17]. This section gives avery brief introduction to some of the properties of synchrotron radiation sources.A more detailed description together with theory and applications can be found inRefs. [14, 18,19].
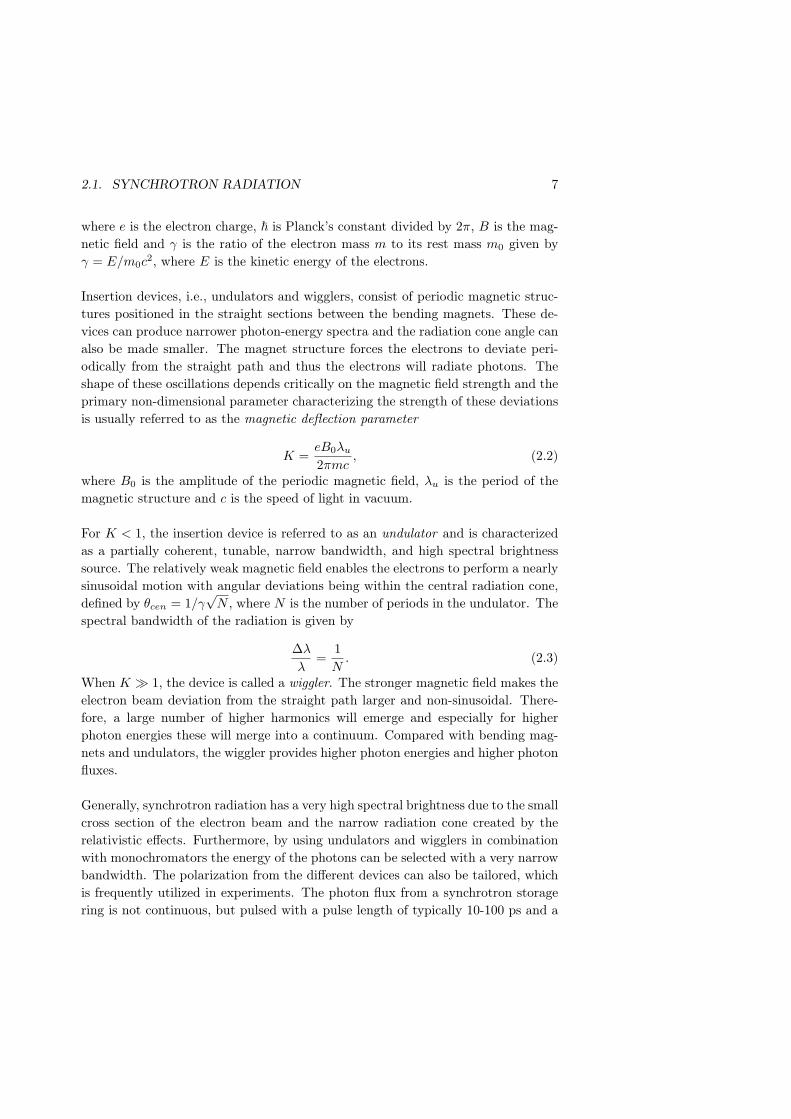
Synchrotron storage rings maintain an electron beam at a constant kinetic en-ergy on the order of 109 eV. Modern (third-generation) facilities are semi-circularwith bending magnets placed in the corners of adjacent straight sections. Differ-ent types of magnetic structures, so called insertion devices, can be placed in thestraight sections to manipulate the electron-beam path to generate radiation withdifferent characteristics. Figure 2.1 shows the three primary methods for generatingsynchrotron radiation.
Bending magnet
radiation
Photons
hω
Wiggler
radiation
Photons
hω
Undulator
radiation
Photons
hω
Figure 2.1. The three primary methods for generating synchrotron radiation: bendingmagnets, undulators and wigglers.
When the electron beam is bent, i.e., accelerated by a bending magnet, photonsare emitted with a broadband energy spectrum. The wavelength spectrum usuallyranges from infrared to soft x-rays. The dipole radiation from the electrons will, dueto relativistic effects, be transformed into a narrow cone in the forward direction inthe laboratory reference frame. Bending-magnet radiation is characterized by thecritical photon energy, ~ωc, which is defined as the photon energy for which halfthe power is emitted above and half below. This is given by
~ωc =3e~Bγ2
2m, (2.1)
2.1. SYNCHROTRON RADIATION 7
where e is the electron charge, ~ is Planck’s constant divided by 2π, B is the mag-netic field and γ is the ratio of the electron mass m to its rest mass m0 given byγ = E/m0c
2, where E is the kinetic energy of the electrons.
Insertion devices, i.e., undulators and wigglers, consist of periodic magnetic struc-tures positioned in the straight sections between the bending magnets. These de-vices can produce narrower photon-energy spectra and the radiation cone angle canalso be made smaller. The magnet structure forces the electrons to deviate peri-odically from the straight path and thus the electrons will radiate photons. Theshape of these oscillations depends critically on the magnetic field strength and theprimary non-dimensional parameter characterizing the strength of these deviationsis usually referred to as the magnetic deflection parameter
K =eB0λu
2πmc, (2.2)
where B0 is the amplitude of the periodic magnetic field, λu is the period of themagnetic structure and c is the speed of light in vacuum.
For K < 1, the insertion device is referred to as an undulator and is characterizedas a partially coherent, tunable, narrow bandwidth, and high spectral brightnesssource. The relatively weak magnetic field enables the electrons to perform a nearlysinusoidal motion with angular deviations being within the central radiation cone,defined by θcen = 1/γ
√N , where N is the number of periods in the undulator. The
spectral bandwidth of the radiation is given by
∆λ
λ=
1N
. (2.3)
When K À 1, the device is called a wiggler. The stronger magnetic field makes theelectron beam deviation from the straight path larger and non-sinusoidal. There-fore, a large number of higher harmonics will emerge and especially for higherphoton energies these will merge into a continuum. Compared with bending mag-nets and undulators, the wiggler provides higher photon energies and higher photonfluxes.
Generally, synchrotron radiation has a very high spectral brightness due to the smallcross section of the electron beam and the narrow radiation cone created by therelativistic effects. Furthermore, by using undulators and wigglers in combinationwith monochromators the energy of the photons can be selected with a very narrowbandwidth. The polarization from the different devices can also be tailored, whichis frequently utilized in experiments. The photon flux from a synchrotron storagering is not continuous, but pulsed with a pulse length of typically 10-100 ps and a
8 CHAPTER 2. SOFT X-RAY SOURCES
pulse separation on the order of ns. Synchrotron radiation sources offer excellentradiation quality and stability, but the size of these facilities as well as the pricetag make the number of available synchrotrons limited.
2.2 Free-electron lasers
Free-electron lasers (FELs) can be considered the next generation in the evolutionof synchrotron radiation sources [20, 21]. The FEL is in a sense an extension ofthe undulator concept, i.e., it consists of a periodic magnetic structure in whicha high-energy beam of electrons are propagating. In an undulator the electronsradiate independently, which means that the x-ray flux will be proportional to thenumber of electrons. However, with a very long undulator and a carefully preparedelectron beam, an effect arises that is known as the FEL instability. It introducescorrelations between the electrons, and opens the possibility of greatly enhancedpeak x-ray brightness. This instability produces exponential growth of the inten-sity of the emitted radiation at a particular wavelength. The radiation field thatinitiates the instability can be either spontaneous radiation from the undulator oran external seeding field. In the case of FEL action arising from spontaneous ra-diation, the process is called self-amplified spontaneous emission (SASE) [22]. Oneproblem with SASE FELs is the lack of temporal coherence due to the noisy startupprocess. To avoid this one can "seed" a FEL with a laser tuned to the resonanceof the FEL, but this requires an x-ray laser or the use of high harmonics, describedin Sect. 2.5. In this case the FEL is referred to as a FEL amplifier.
The phenomenon that creates a correlation between the electrons is known asmicro-bunching. It can be understood by looking at the interaction of the electron beamwith the electric field produced in the undulator or by the seed laser. At the start ofthe undulator, all the electrons still have the same energy. This changes, however,when the particles interact with the radiation. The charges can absorb energy fromthe radiation or relinquish energy to it.In the undulator, each electron energy is associated with a certain "slalom course",and for each slalom course, there is a certain forward speed. For this reason, theabsorption or release of energy causes the electrons to speed up or fall behind.In a FEL, the speed of the electrons and the shape of the magnetic structures arematched so that the charges fall behind by exactly one wavelength, compared to theemitted radiation, after two curves in the undulator. This means that the chargesare then in the same situation as before, after one oscillatory cycle. In a referenceframe where only the transverse oscillatory motion of the electron can be observed,the electron would experience an electric field traveling one wavelength during oneroundtrip for the oscillatory motion of the electron. This means that the transverse
2.2. FREE-ELECTRON LASERS 9
Photon energy [keV]
Wavelength [nm]
Ave
rag
e s
pe
ctr
al b
rig
htn
ess [
Ph
oto
ns/(
s×
mm
2×
mr2
×0
.1%
bw
)]
10-3 10-2 10-1 1 10 100 103106
108
1010
1012
1014
1016
1018
1020
1022
1024
1026 124 12.4 1.24 0.124 0.0124
DESY
TTF-FEL
SLAC
LCLS
(FEL)
ESRF/APS
7 GeV
Undulator1-2 GeV Undulators
(ALS)
NSLS x1
SSRL wiggler
NSLS bend
Laser plasmas
Cu-K
C-KElectron impact
sources
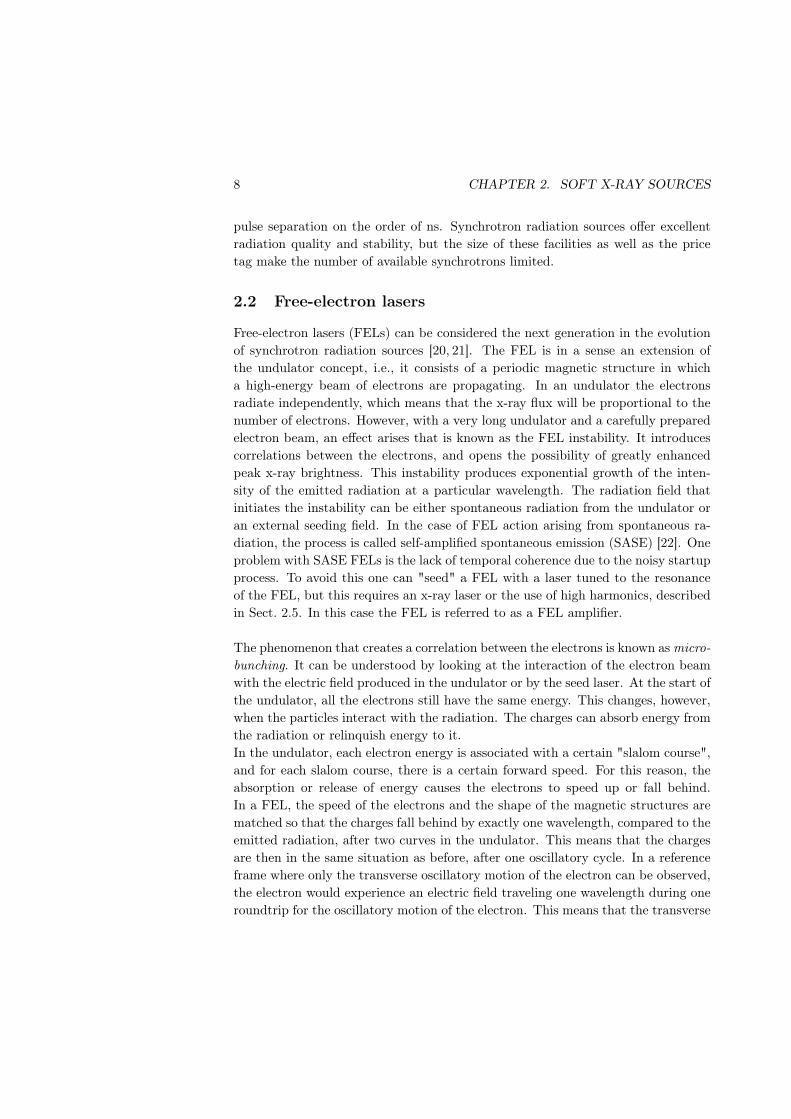
Figure 2.2. Comparison of average spectral brightness for various x-ray sources. Thediagram includes a typical electron impact source, the laser plasma source used in thecompact soft x-ray microscope, typical synchrotron light sources, and planned free electronlasers. (From Ref. [23])
motion of the electron can be either in phase or out of phase with the force exertedon the electron by the electric field. For electrons that happen to be in phase,the force will cause them to deviate slightly more from their equilibrium position.This means that their axial speed will be slightly reduced. Electrons being out ofphase experience an increased axial speed. This process goes on until all electronsare shifted into areas where the average axial speed in unchanged. In this way,the electrons move close together into small groups separated by a distance that isexactly one wavelength of the organizing radiation. The electrons continue to emitradiation as before, yet the result is a much more intense light, because radiationcontributions from the electrons in the micro-bunches add up coherently.
Presently, the FELs have been producing coherent radiation from the microwave re-gion down to the extreme ultraviolet region [24], but no FEL project has yet reachedinto the soft x-ray region. Figure 2.2 shows a comparison of average spectral bright-ness for various existing sources and two future x-ray FEL projects. Today, there
10 CHAPTER 2. SOFT X-RAY SOURCES
are two principal goals for future FEL development: Higher photon energies, i.e.,shorter wavelengths, and higher peak power. There are now several planned andongoing FEL projects with the aim of producing soft x-rays. The result could bea tunable, short pulsed (∼10−15 s), coherent x-ray source having a spectral bright-ness several orders of magnitude larger than present third-generation synchrotronsources.
2.3 Laser-plasma sources
Laser-produced plasma sources are an attractive alternative to synchrotron sourcesfor certain applications, since they are compact, relatively inexpensive, and havea high brightness relative to other compact sources. Figure 2.2, in Sect. 2.2, alsoshows the spectral brightness for the laser plasma source presently used in the com-pact soft x-ray microscope described in Chapter 5. A more extensive description oflaser-plasma sources, including theoretical models, is given in Refs. [25, 26].
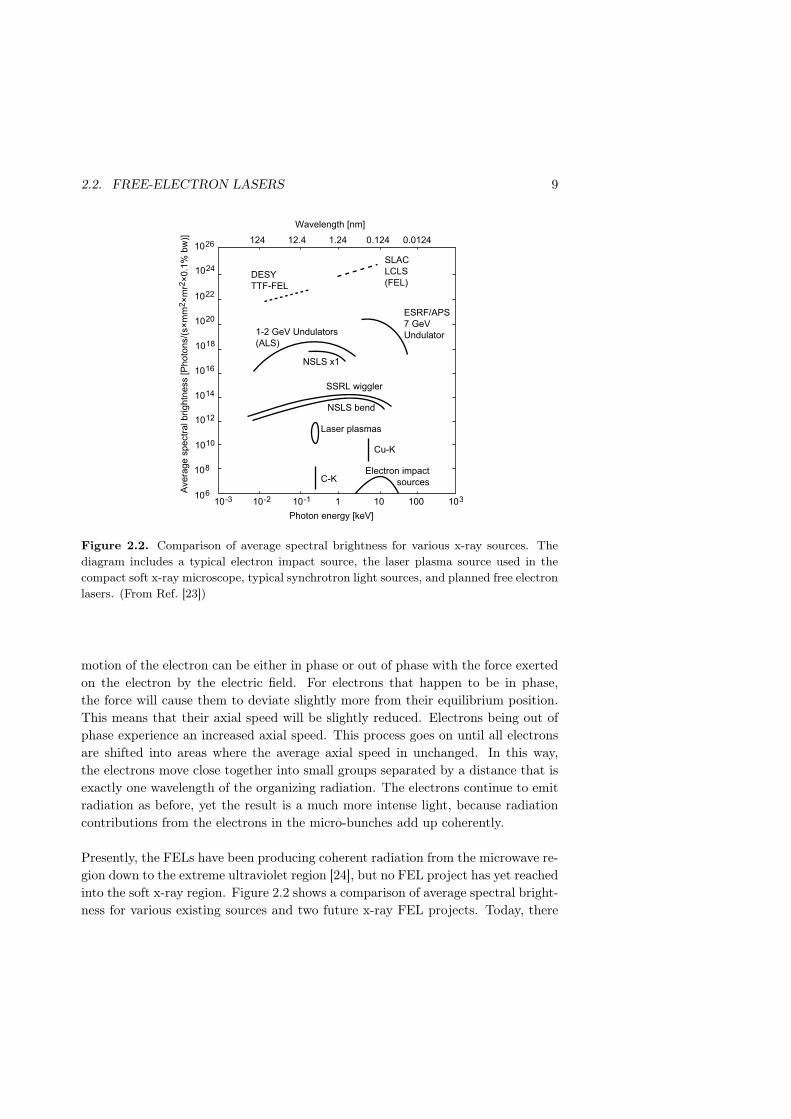
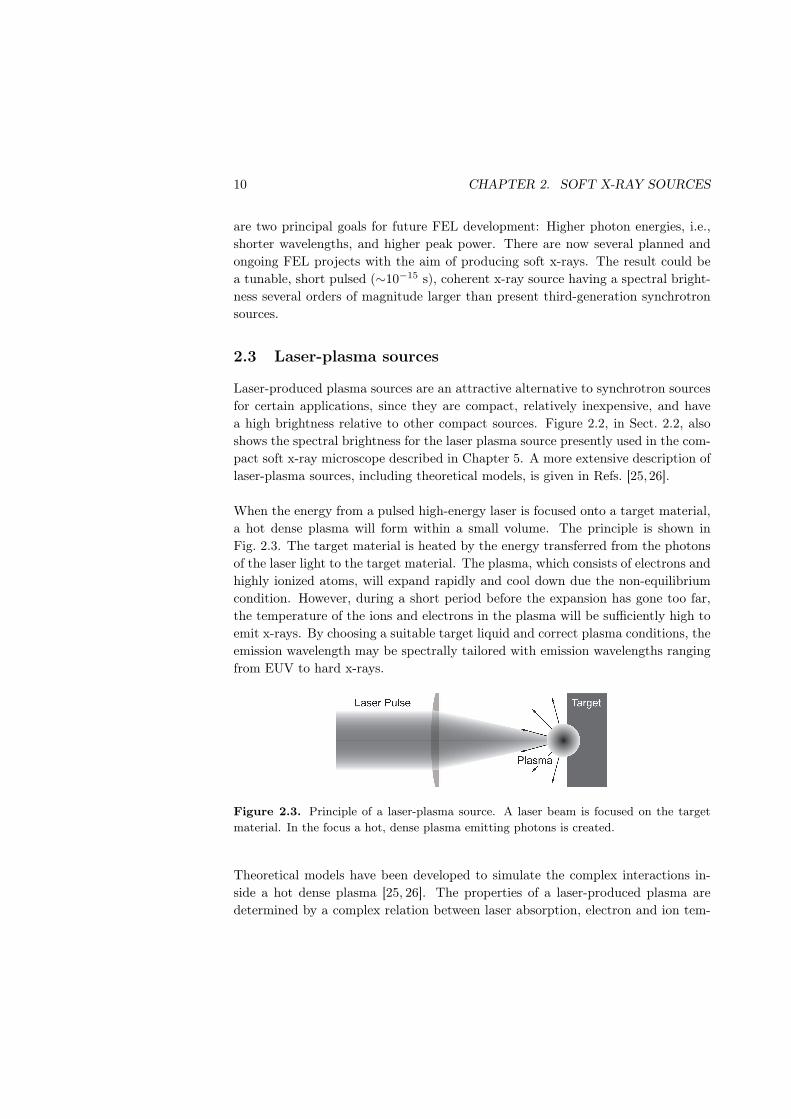
When the energy from a pulsed high-energy laser is focused onto a target material,a hot dense plasma will form within a small volume. The principle is shown inFig. 2.3. The target material is heated by the energy transferred from the photonsof the laser light to the target material. The plasma, which consists of electrons andhighly ionized atoms, will expand rapidly and cool down due the non-equilibriumcondition. However, during a short period before the expansion has gone too far,the temperature of the ions and electrons in the plasma will be sufficiently high toemit x-rays. By choosing a suitable target liquid and correct plasma conditions, theemission wavelength may be spectrally tailored with emission wavelengths rangingfrom EUV to hard x-rays.
Figure 2.3. Principle of a laser-plasma source. A laser beam is focused on the targetmaterial. In the focus a hot, dense plasma emitting photons is created.
Theoretical models have been developed to simulate the complex interactions in-side a hot dense plasma [25, 26]. The properties of a laser-produced plasma aredetermined by a complex relation between laser absorption, electron and ion tem-
2.3. LASER-PLASMA SOURCES 11
peratures, density, expansion rate, photon emission and re-absorption, and couplingbetween acoustic and electromagnetic waves. From a practical point of view, thesetheoretical results can be used to estimate appropriate laser parameters for theapplication of interest.
The required plasma temperature, T , for a plasma emitting strongly at a wavelengthλ can be estimated using Wien’s displacement law, assuming that the emittedspectra has black-body radiation distribution.
λ =2.898 · 10−3 m ·K
T(2.4)
According to the Stefan-Boltzmann radiation law, the black body would then emitradiation with an intensity given by
I = σT 4 (2.5)
where
σ =π2κ4
60c2~3(2.6)
is the Stefan-Boltzmann constant, written in terms of the Boltzmann constant κ,the speed of light c and ~, which is Planck’s constant divided by 2π.
Taking fractional absorption of the incident laser radiation, and fractional conver-sion of absorbed light to re-radiated near-thermal emission, into account shows thatthe focus spot intensity required to heat the target material must be higher than theradiated intensity. The absorption of the incoming laser light is highly dependenton the electron density in the plasma. Initially, during the first picoseconds of thelaser pulse, free electrons are created. A plasma is formed and rapidly heated byinverse bremsstrahlung absorption, i.e., the energy of an incoming photon is trans-ferred into increased kinetic energy of the free electrons. As the plasma is heated,more free electrons will be generated and an electron density gradient will arise, seeFig. 2.4.
The electron distribution tends to oscillate with a natural plasma frequency givenby
ωp =(
e2ne
ε0me
)1/2
, (2.7)
where e is the electron charge, ne is the electron density, ε0 is the permeabilityof vacuum and me is the electron mass. The electron oscillations are driven by
12 CHAPTER 2. SOFT X-RAY SOURCES
ne
nc
Laser-plasma
interaction region
Critical
density
Electron
heat
transport
Incident laser light
Distance
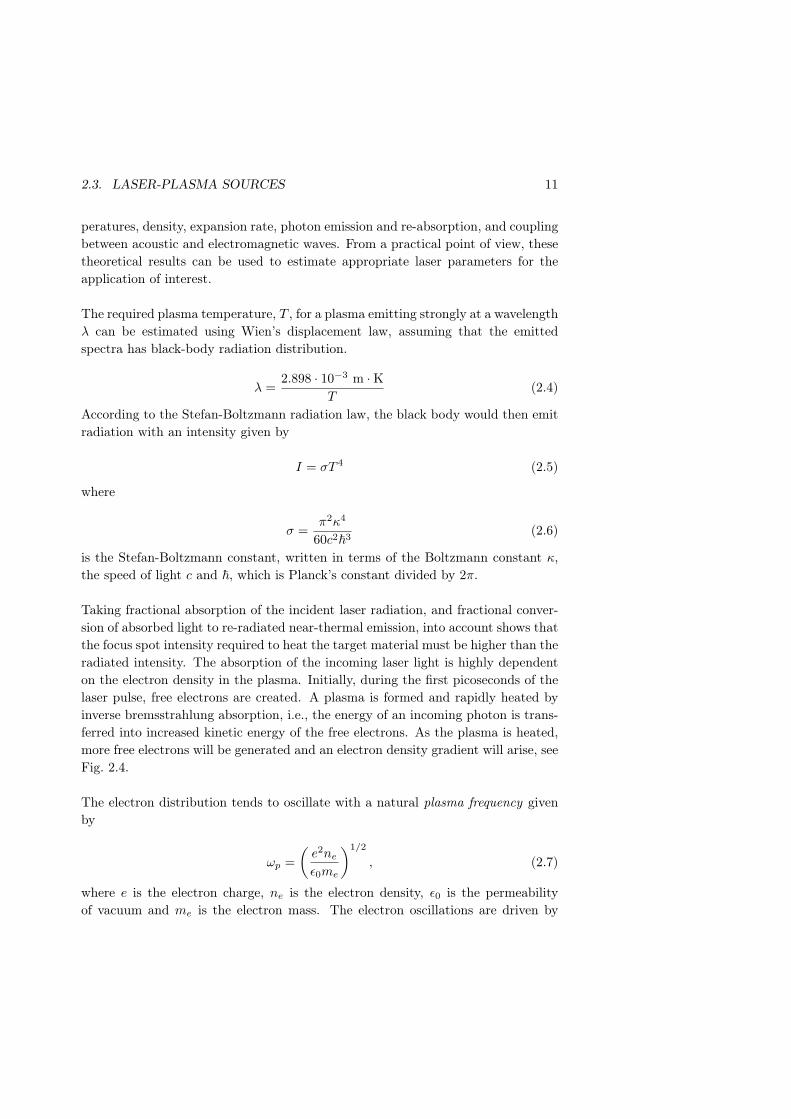
Figure 2.4. Schematic diagram of a one-dimensional electron density profile in a laserproduced plasma. The laser energy is absorbed in the region where the electron density,ne, is below the critical electron density, nc. (From Ref. [26])
the external electromagnetic field, i.e., the incoming laser light with frequency ω,and propagation of the incoming radiation through the plasma can occur if thecondition ω > ωp is satisfied. When the laser light reaches the region where theelectron density gives a plasma frequency equal to the frequency of the incomingwave (ωp = ω), the incoming laser pulse is subjected to total reflection and can notpenetrate any further into the plasma. This defines the critical electron density, nc.In the underdense region (ne < nc), close to the critical density, most of the laserenergy is absorbed and thermal energy is conducted into the more dense regions bythe electrons.
There is no simple formula to calculate the total radiation conversion efficiency, de-fined as the energy emitted by x-rays within the spectral range of interest dividedby the incident laser energy. However, experiments performed on gold targets showthat the conversion efficiency can be increased by using a shorter laser wavelengthfor high focus intensities [26]. This effect can largely be ascribed to the increasedpenetration depth of the incident radiation.
The plasma expands rapidly once it has been created and its size is determined bya combination of the laser pulse length and the focus size. The repetition rate ofthe laser determines the average brightness of the source.
The emitted spectrum from a laser-produced plasma is a complex composition from
2.4. DISCHARGE-PLASMA SOURCES 13
three contributing processes. First, non-bound electrons interacting with highlycharged ions produce a continuum of bremsstrahlung radiation. Next, recombina-tion of free electrons and ions will also result in a continuous spectrum since itis a free-bound process. The free-bound spectrum begins where the photon en-ergy equals the ionization potential energy, and the shape depends on the localkinetic energy distribution of the electrons. Finally, the radiative emission fromthe bound-bound electron transitions within the excited ions will give line emis-sion. For the plasma temperatures we operate at, a plasma of ions with low atomicnumber will have nearly or fully ionized atoms and line emission will dominate theradiated spectrum. A plasma consisting of ions with a higher atomic number willhave a blackbody-shaped spectrum with superimposed characteristic line emission.Consequently, the emission spectrum from a laser-plasma source can be tailored byvarying the target material and plasma temperature.
In addition to x-rays, the plasma emits debris, i.e., atoms, ions, and clusters, whichcan damage sensitive components in the vicinity of the source. Different targetsystems show different debris characteristics. There are basically three groups oftarget systems: solid targets, gas targets [27], and liquid-jet targets [28,29]. Liquid-jet targets show advantages compared to solid bulk targets, as the debris emissionfrom liquid-jet targets is significantly lower. Furthermore, liquid-jet targets areregenerative, thereby allowing long-term high-repetition rate operation. A moretechnical description of the implementation of a liquid-jet target laser-plasma sourcecan be found in Sect. 5.1.1.
2.4 Discharge-plasma sources
Another way of producing plasmas is through an electric discharge, e.g., the pinch-plasma source where a high-current pulse is driven through a gaseous target. Thecurrent flowing through the low density target will initially create a low temperatureplasma. Simultaneously, the current induces a magnetic field which compresses theplasma, thereby increasing the plasma density and temperature. This enables thegeneration of x-ray photons with source emission characteristics similar to laser-based plasmas, although discharge-plasma sources usually are bigger in size. Due tothe lower density and temperature, electrical discharge plasmas are more suitablefor EUV radiation generation [30]. One advantage of this type of source is therather high conversion efficiency from electrical power to emitted radiation power.Thermal problems has made it difficult to run these sources at high power. However,recent progress by Philips on their NovaTin® source has made it possible to deliver200 W in-band EUV into 2π sr [31]. A general overview of electrical dischargesources can be found in Ref. [18].
14 CHAPTER 2. SOFT X-RAY SOURCES
2.5 X-ray lasers and high-harmonic generation
Light amplification by stimulated emission of radiation (LASER) has been shownfor EUV and soft x-ray wavelengths [32,33]. The most common scheme to achievethe required population inversion for these wavelengths is through a laser-producedplasma, cf. Sect. 2.3. However, electrical discharge excitation is also pursued al-though mainly for the EUV region [34]. X-ray lasers have the potential to providea compact cost-effective partially coherent x-ray source with a spectral brightnessthat is 5 to 6 orders of magnitude higher than today’s third generation synchrotronsources [35]. Unfortunately, due to the short lifetime of the plasma and the lack ofsuitable mirrors, most x-ray lasers today are running in the amplified spontaneousemission (ASE) mode, i.e., single pass through the gain medium. Consequently, thedivergence of the emitted radiation and the coherence properties are limited by theavailable length of the gain medium. Furthermore, the special types of high powerpump lasers required, in combination with poor conversion efficiency with regardsto average output power makes the use of present x-ray lasers quite limited. Areview of today’s research and development of soft x-ray lasers is found in Ref. [36]and a general introduction to theory and experiments in Ref. [37].
Another way of producing EUV radiation and soft x-rays is through the generationof very high odd harmonics of high-intensity femtosecond laser pulses in a gaseousmedium, see, e.g., Ref. [38]. Typically, linearly polarized laser pulses of 20-100fs duration are focused to an intensity of 1014–1015 W/cm2 in a gas of neutralHe, Ne, Ar, or Xe. The laser intensities and pulse durations should be just belowthe limit of ionizing the individual atoms. The radiation results from a stronglynon-linear interaction between the electric field of the incident laser pulse and theindividual atoms, producing phase-matched harmonics that could extend up toseveral hundreds of orders. Consequently, the produced radiation is coherent andhave a small divergence, and thus, is of great interest for EUV and soft x-rayapplications. However, a lot of energy is lost in the intermediate harmonics makingthe conversion efficiency into the soft x-ray range low.
Chapter 3
Soft x-ray optics
Experiments utilizing soft x-rays often involve focusing or redirecting the radiationby using optical components such as lenses or mirrors. Refs. [14,18,19,39,40] con-tain extensive reviews of EUV and soft x-ray optics and also some references tohard x-ray optics. This chapter gives a short introduction to the optical compo-nents commonly used together with soft x-rays.
In the x-ray wavelength range the refractive index is commonly written as
n = 1− δ + iβ, (3.1)
where δ is the refractive index decrement and β is the absorption or extinctioncoefficient [14]. The real part of the refractive index induces a phase shift for raystraveling through a material, and the imaginary part accounts for absorption. Therefractive index can be calculated from the atomic properties of a material by [14]
n = 1− nareλ2
2π(f1 − if2), (3.2)
Where na is the average density of atoms in the material, re = 2.818 · 10−15 mis the classical electron radius, λ is the x-ray wavelength, and f = f1 − if2 isthe atomic scattering factor which shows a strong wavelength dependency for softx-rays. Henke [41, 42] and colleagues have compiled absorption data (f2) for allelements from hydrogen to uranium from which they have computed and tabulatedvalues of f1, using the Kramers-Kronig relations [14], for photon energies from 50eV to 30 keV.
For soft x-rays the real part of the refractive index is close to unity and the absorp-tion is strong. Refractive lenses would thus require a very small radius of curvature
15
16 CHAPTER 3. SOFT X-RAY OPTICS
in order to refract sufficiently, and they would also need to be extremely thin due tothe high absorption. These two demands are incompatible, which is why focusingoptics for soft x-rays are based on reflection or diffraction. In the following sectionsthe basic concepts of reflective and diffractive optics for soft x-rays are presented.
3.1 Reflective optics
Clearly, the optical characteristics of a material at x-ray wavelengths are governedby the same classical equations that are valid for all electromagnetic radiation,although the behavior can be very different from what is experienced at visiblewavelengths. The intensity reflectance for an electromagnetic wave incident on aboundary between two different media (n1 and n2) is given by the Fresnel equations
R⊥ =∣∣∣∣n1cosφ1 − n2cosφ2
n1cosφ1 + n2cosφ2
∣∣∣∣2
(3.3)
R‖ =∣∣∣∣n2cosφ1 − n1cosφ2
n2cosφ1 + n1cosφ2
∣∣∣∣2
(3.4)
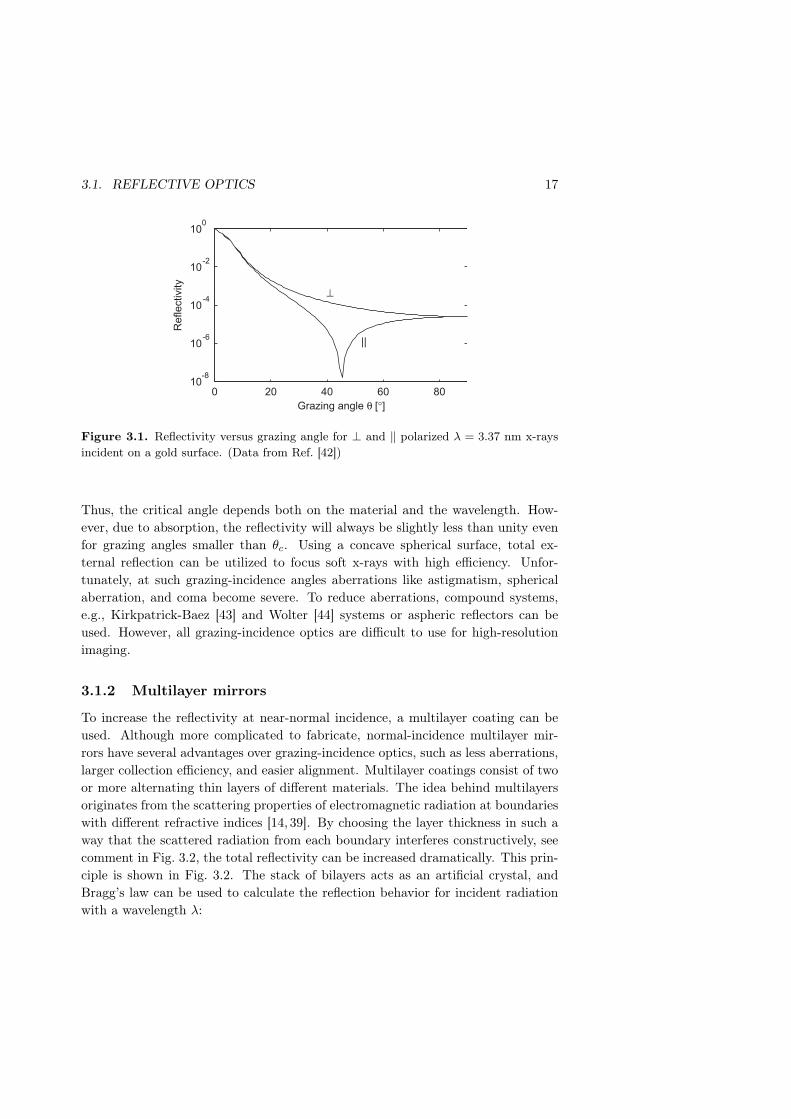
where φ1 is the angle of incidence, φ2 is the angle of refraction (given by Snell’s lawof refraction), and n is the complex refractive index. The indices ⊥ and ‖ standfor radiation polarized perpendicular to and parallel with the plane of incidence,respectively. For soft x-rays, δ is small and positive for most materials, i.e., thereal part of the refractive index is slightly smaller than unity, which results in a lowreflectivity except at small grazing angles (θ = (90◦ − φ1)). Figure 3.1 shows thereflectivity versus grazing angle for radiation at λ = 3.37 nm incident from vacuumonto a gold surface. At normal incidence the reflectivity is on the order of 10−5 formost materials, which makes it practically impossible to use single-boundary-layermirrors at normal incidence in the soft x-ray region.
3.1.1 Grazing-incidence mirrors
Although the reflectivity is very low for most materials in the soft x-ray range, thereexists an important exception for radiation incident at very small grazing angles,cf. Fig. 3.1. While visible light can experience total internal reflection, soft x-rayscan instead be subject to total external reflection. This can take place because1 − δ < 1. By using Snell’s law of refraction and neglecting the absorption, thecritical angle [14] for this phenomenon can be calculated as
θc =√
2δ (3.5)
3.1. REFLECTIVE OPTICS 17
0 20 40 60 8010
-8
10 -6
10 -4
10 -2
100
⊥
||
Grazing angle θ [°]
Refle
ctivity
Figure 3.1. Reflectivity versus grazing angle for ⊥ and ‖ polarized λ = 3.37 nm x-raysincident on a gold surface. (Data from Ref. [42])
Thus, the critical angle depends both on the material and the wavelength. How-ever, due to absorption, the reflectivity will always be slightly less than unity evenfor grazing angles smaller than θc. Using a concave spherical surface, total ex-ternal reflection can be utilized to focus soft x-rays with high efficiency. Unfor-tunately, at such grazing-incidence angles aberrations like astigmatism, sphericalaberration, and coma become severe. To reduce aberrations, compound systems,e.g., Kirkpatrick-Baez [43] and Wolter [44] systems or aspheric reflectors can beused. However, all grazing-incidence optics are difficult to use for high-resolutionimaging.
3.1.2 Multilayer mirrors
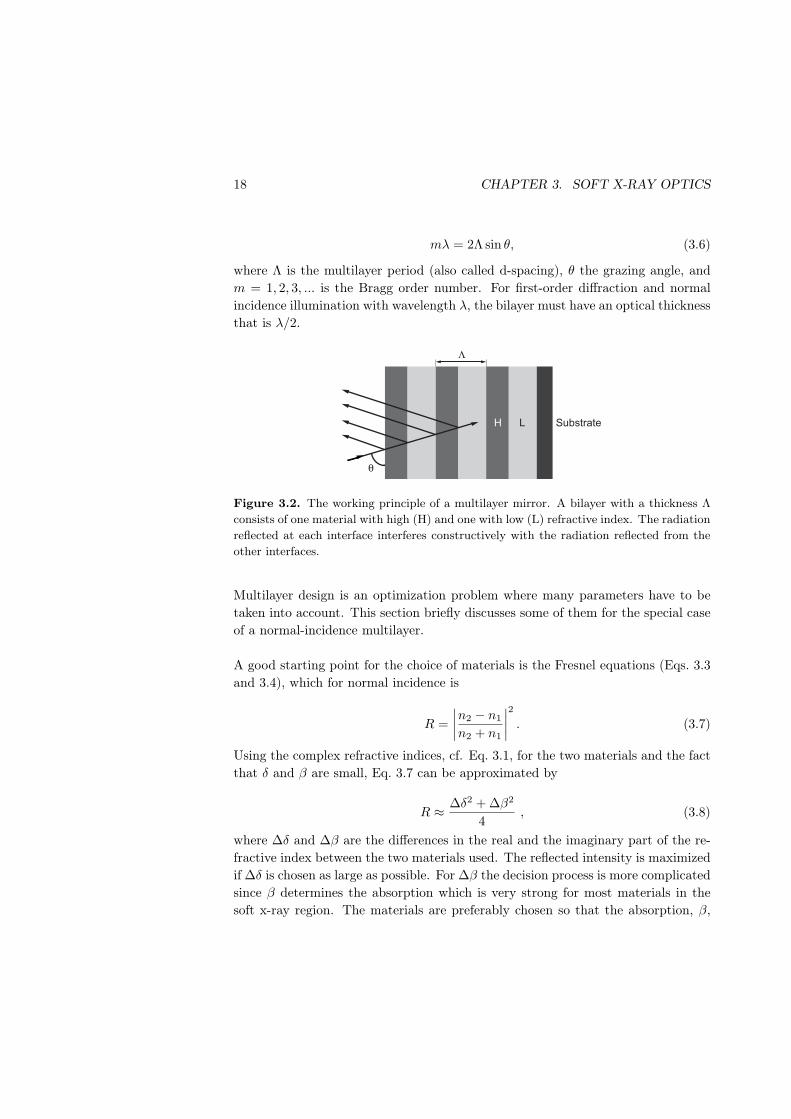
To increase the reflectivity at near-normal incidence, a multilayer coating can beused. Although more complicated to fabricate, normal-incidence multilayer mir-rors have several advantages over grazing-incidence optics, such as less aberrations,larger collection efficiency, and easier alignment. Multilayer coatings consist of twoor more alternating thin layers of different materials. The idea behind multilayersoriginates from the scattering properties of electromagnetic radiation at boundarieswith different refractive indices [14, 39]. By choosing the layer thickness in such away that the scattered radiation from each boundary interferes constructively, seecomment in Fig. 3.2, the total reflectivity can be increased dramatically. This prin-ciple is shown in Fig. 3.2. The stack of bilayers acts as an artificial crystal, andBragg’s law can be used to calculate the reflection behavior for incident radiationwith a wavelength λ:
18 CHAPTER 3. SOFT X-RAY OPTICS
mλ = 2Λ sin θ, (3.6)
where Λ is the multilayer period (also called d-spacing), θ the grazing angle, andm = 1, 2, 3, ... is the Bragg order number. For first-order diffraction and normalincidence illumination with wavelength λ, the bilayer must have an optical thicknessthat is λ/2.
Substrate
H L
Λ
θ
Figure 3.2. The working principle of a multilayer mirror. A bilayer with a thickness Λ
consists of one material with high (H) and one with low (L) refractive index. The radiationreflected at each interface interferes constructively with the radiation reflected from theother interfaces.
Multilayer design is an optimization problem where many parameters have to betaken into account. This section briefly discusses some of them for the special caseof a normal-incidence multilayer.
A good starting point for the choice of materials is the Fresnel equations (Eqs. 3.3and 3.4), which for normal incidence is
R =∣∣∣∣n2 − n1
n2 + n1
∣∣∣∣2
. (3.7)
Using the complex refractive indices, cf. Eq. 3.1, for the two materials and the factthat δ and β are small, Eq. 3.7 can be approximated by
R ≈ ∆δ2 + ∆β2
4, (3.8)
where ∆δ and ∆β are the differences in the real and the imaginary part of the re-fractive index between the two materials used. The reflected intensity is maximizedif ∆δ is chosen as large as possible. For ∆β the decision process is more complicatedsince β determines the absorption which is very strong for most materials in thesoft x-ray region. The materials are preferably chosen so that the absorption, β,
3.1. REFLECTIVE OPTICS 19
is low for one of the materials. The other material should be selected to maximize∆β without compromising the overall multilayer reflectivity due to attenuation.Moreover, the materials have to fulfill mechanical, physical, and chemical require-ments. The selected materials should be possible to deposit and easily form smoothboundaries, which have to be both chemically and physically stable, i. e., no chem-ical reactions at the interfaces are allowed, and diffusion of material through theinterfaces should be negligible. Since it is impossible to manufacture ideal inter-faces, the interface between two layers gets a certain width σ larger than zero. Theconcept of interface width includes two different physical aspects: interface rough-ness and intermixing/interdiffusion. Real surfaces are a combination of these twoaspects. The reflectivity at such a surface can be reduced significantly comparedto the ideal reflectivity [40].
High performance multilayer mirrors for the soft x-ray wavelength region are dif-ficult to manufacture since the differences in the refractive indices are small andthe number of interfering reflections therefore must be large. The optimum numberof bilayers in a multilayer stack depends on a balance between the superpositionof the reflected amplitude and the absorption of the materials. Today, there areseveral advanced computer programs for calculating the reflectivity of multilayerstacks for different materials, wavelengths, and incident angles, e.g., IMD [45], oron the CXRO homepage [42].
During the last years, the reflectivity for normal-incidence water-window multilayermirrors has increased by nearly an order of magnitude. The improvement of dif-ferent multilayers are listed on the CXRO homepage [46]. Established materialsfor water-window wavelengths above 3 nm are multilayer stacks of W/B4C bilayerswith a demonstrated reflectivity of at least 1.9% at λ = 3.4 nm [47] or Cr/Sc bilay-ers, which were pioneered by Salashchenko et al. [48]. For Cr/Sc a reflectivity of14.8% at λ = 3.11 nm was demonstrated [49]. With a DC magnetron sputtering ma-chine with tailored ion assistance, 5.5% reflectivity was achieved at λ = 3.374 nm,which is an interesting wavelength for compact x-ray microscopy. Recently, mul-tilayers have been manufactured for the shorter wavelengths in the water window,e. g., Cr/Ti with 17% reflectivity at λ = 2.73 nm or Cr/V with 9% reflectivity atλ = 2.42 nm [50]. These reflectivities were all obtained on small substrates. Themajor difficulty during fabrication of application-oriented multilayer mirrors is tocontrol the layer thickness over a large area, which is required to obtain a uniformreflectivity over the whole mirror. Since the incidence angle of x-rays varies for aspherical mirror, the best uniformity can be obtained by a graded multilayer stack,where the thickness is optimized for the corresponding incidence angle.
20 CHAPTER 3. SOFT X-RAY OPTICS
3.2 Diffractive optics
Diffractive optics utilize the wave properties of electromagnetic radiation [51]. Ref-erences [14,39,40] cover the theory and applications of soft x-ray diffractive optics.Diffractive optics can be used either in transmission or reflection mode. Lineargratings are often used in spectroscopy [52] or as monochromators at synchrotronfacilities. Fresnel zone plates are used both as objectives for high resolution imag-ing and as condenser optics for collecting light in x-ray microscopy. The followingsections describe the basic properties of gratings and zone plates.
3.2.1 Gratings
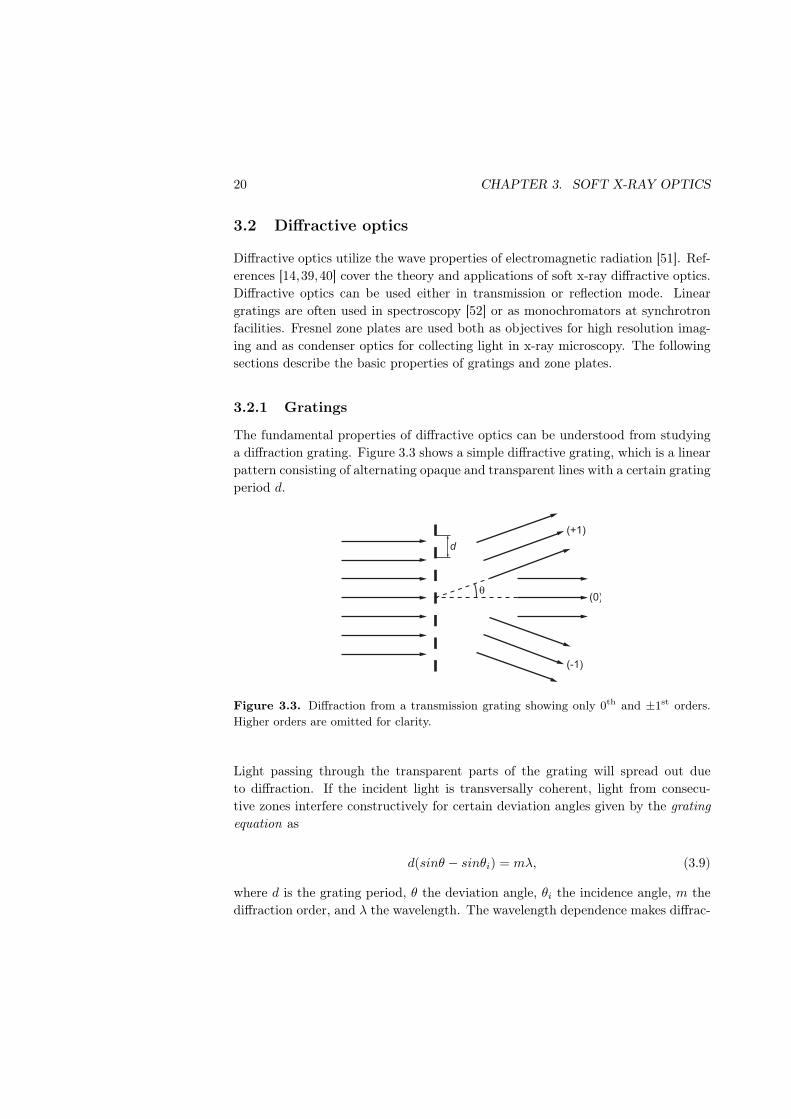
The fundamental properties of diffractive optics can be understood from studyinga diffraction grating. Figure 3.3 shows a simple diffractive grating, which is a linearpattern consisting of alternating opaque and transparent lines with a certain gratingperiod d.
d
(+1)
(0)
(-1)
θ
Figure 3.3. Diffraction from a transmission grating showing only 0th and ±1st orders.Higher orders are omitted for clarity.
Light passing through the transparent parts of the grating will spread out dueto diffraction. If the incident light is transversally coherent, light from consecu-tive zones interfere constructively for certain deviation angles given by the gratingequation as
d(sinθ − sinθi) = mλ, (3.9)
where d is the grating period, θ the deviation angle, θi the incidence angle, m thediffraction order, and λ the wavelength. The wavelength dependence makes diffrac-
3.2. DIFFRACTIVE OPTICS 21
tion gratings well suited for spectroscopy.
The fraction of incident energy diffracted into the various orders depends on thenature of the periodic structure, i.e., the sharpness of the profile, the line-to-spaceratio, and the complex refractive index, which affects absorption and phase shift inthe grating. For a transmission grating consisting of opaque lines of width equal tohalf the grating period, the diffraction efficiency ηm is given by
ηm =
0.25 m = 01/m2π2 m odd0 m even
(3.10)
The diffraction efficiency for such a grating is limited to ∼10% in the first order.However, the efficiency can be improved significantly if the absorbing opaque linesare replaced by a transparent phase shifting material. Ideally, this material shouldgive a π phase shift while having zero absorption. For such an ideal grating the firstorder efficiency would be ∼40%. Since there are no materials without absorptionin the soft x-ray region, a compromise between phase-shift and absorption must bemade. The theoretical diffraction efficiency of a general grating with absorptionand phase shift included for m 6= 0 is given by
ηm =sin2(rmπ)
(mπ)2[1 + e−4πβt/λ − 2e−2πβt/λcos(2πδt/λ)
], (3.11)
where r is the line-to-space ratio and t is the thickness of the lines [53, 54]. Thisequation can be used to compare materials suitable for grating production. Thechoice of material must also include fabrication aspects and long-term stability toatmospheric exposure. Several materials have successfully been used with gold,germanium and nickel being the most frequently used for soft x-rays. Nickel hasproven to be the best choice, as it allows for high efficiency with relatively moderateline thickness.
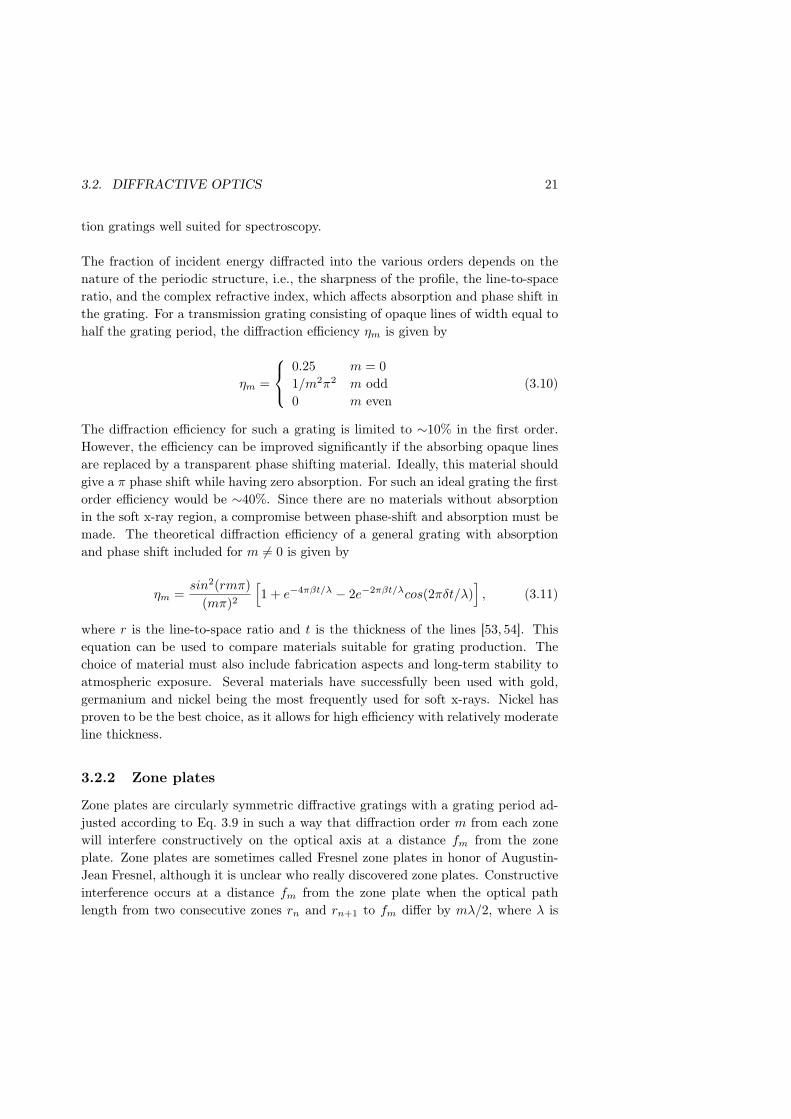
3.2.2 Zone plates
Zone plates are circularly symmetric diffractive gratings with a grating period ad-justed according to Eq. 3.9 in such a way that diffraction order m from each zonewill interfere constructively on the optical axis at a distance fm from the zoneplate. Zone plates are sometimes called Fresnel zone plates in honor of Augustin-Jean Fresnel, although it is unclear who really discovered zone plates. Constructiveinterference occurs at a distance fm from the zone plate when the optical pathlength from two consecutive zones rn and rn+1 to fm differ by mλ/2, where λ is
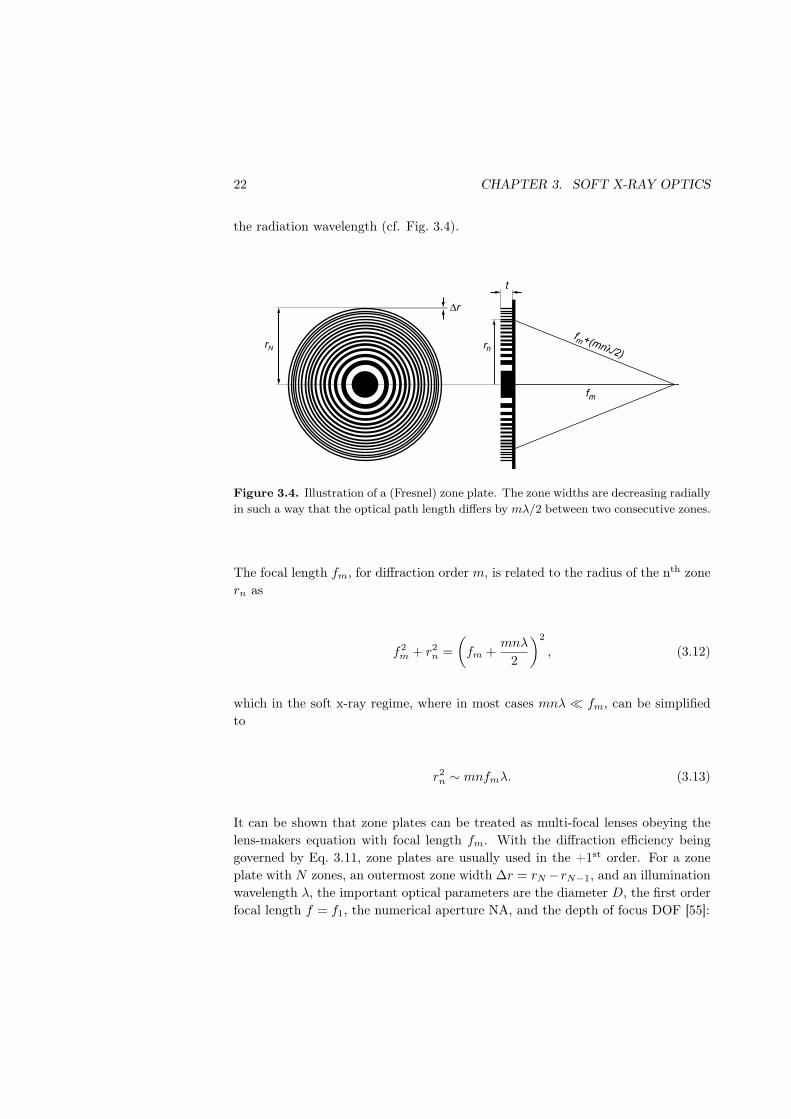
22 CHAPTER 3. SOFT X-RAY OPTICS
the radiation wavelength (cf. Fig. 3.4).
rN
∆r
t
fm+(mnλ/2)
fm
rn
Figure 3.4. Illustration of a (Fresnel) zone plate. The zone widths are decreasing radiallyin such a way that the optical path length differs by mλ/2 between two consecutive zones.
The focal length fm, for diffraction order m, is related to the radius of the nth zonern as
f2m + r2
n =(
fm +mnλ
2
)2
, (3.12)
which in the soft x-ray regime, where in most cases mnλ ¿ fm, can be simplifiedto
r2n ∼ mnfmλ. (3.13)
It can be shown that zone plates can be treated as multi-focal lenses obeying thelens-makers equation with focal length fm. With the diffraction efficiency beinggoverned by Eq. 3.11, zone plates are usually used in the +1st order. For a zoneplate with N zones, an outermost zone width ∆r = rN −rN−1, and an illuminationwavelength λ, the important optical parameters are the diameter D, the first orderfocal length f = f1, the numerical aperture NA, and the depth of focus DOF [55]:
3.2. DIFFRACTIVE OPTICS 23
D = 4N∆r (3.14)
f =4N(∆r)2
λ(3.15)
NA =λ
2∆r(3.16)
DOF = ±2(∆r)2
λ(3.17)
The focal length is inversely proportional to the wavelength which makes zone plateshighly chromatic. To avoid blurring due to chromatic aberrations, the relativespectral bandwidth of the illumination must fulfill the condition
∆λ
λ≤ 1
N. (3.18)
Ideally, zone plates have no other on-axis aberrations or distortion. Off-axis aberra-tions occur in imaging of extended objects, and are discussed in detail in Ref. [56].However, these aberrations can be neglected for most x-ray microscopy applications.The performance of a zone plate, in terms of resolution, is mainly determined bythe accuracy of the produced pattern. The most common defects are ellipticity,radial displacement of the zones, and nonconcentricity of the zones. Ellipticity isthe difference in two perpendicular radii of the zone plate and causes astigmatism.Radial displacement is a measure of the misplacement of the outmost zone causedby a linear scaling of the zone radii, which introduces spherical aberration. Noncon-centricity, describing the shift of the zone centers, causes coma. If the fabricationtolerances for these effects are less than about two times the outermost zone width∆r the arising aberrations can be neglected [57]. The resolving power of a zoneplate also depends on the illumination conditions, i.e. the numerical aperture ofthe condenser system [5]. For a diffraction limited objective, used together withincoherent illumination, the resolution limit according to the Rayleigh criterion isgiven by
0.61λ
NA= 1.22∆r. (3.19)
Zone plates with outmost zone widths of 15 nm have been fabricated for soft x-rays(see Ref [58]). These could potentially resolve periodic structures with a periodof ∼18 nm. These zone plates are manufactured utilizing techniques developedfrom the manufacturing of integrated circuits within the semiconductor industry.Patterns are generated by e-beam lithography which are transferred by reactive ionetching and nickel electroplating [59].
24 CHAPTER 3. SOFT X-RAY OPTICS
3.2.3 Computer-generated holograms
Generation of computer generated holograms is a method for designing diffractiveoptical elements (DOE) that can transform the illumination wave into a wave witha desired distribution [60]. This is powerful technique commonly used in the visiblerange to produce laser intensity distributions that cannot be achieved using conven-tional lenses and mirrors. Paper 5 in this thesis describes development and testingof a DOE that produces two slightly shifted foci that acts as a diffractive amplitudebeam splitter and an x-ray objective simultaneously. These kind of optical elementscan potentially be used to perform differential interference contrast imaging in thesoft x-ray region.
Chapter 4
X-ray microscopy
The use of x-rays for microscopy purposes was suggested by Goby [61] shortlyafter Röntgen’s discovery of x-rays. With the resolution in far-field microscopy be-ing limited by the imaging wavelength, the short wavelengths of x-rays combinedwith their large penetration depth seemed promising. In 1923, Compton investi-gated the properties of grazing-incidence reflection of x-rays [62]. This led to thefirst x-ray microscope ever, working at wavelengths between 1 Å and 10 Å, usinggrazing-incidence optics. It was built by Kirkpatrick & Baez in 1948 [43]. Softx-ray microscopy in the water-window region (2.3-4.4 nm) was first proposed byWolter [44] in 1952. However, at that time it was not possible to experimentallyimplement the idea due to lack of suitable soft x-ray sources and optics. Baez hadproposed to use Fresnel zone plates as focusing elements for soft x-rays, but it wasnot until in the 1960s that technological advances made it possible to manufacturezone plates with sufficiently small structure sizes using holographic methods. In1976, the first transmission soft x-ray microscope using zone plates both for illumi-nation and imaging was built at the synchrotron DESY in Hamburg, Germany [15].The following chapter describes the special properties of soft x-ray microscopy andexplains the two most commonly used microscopy arrangements.
4.1 Resolution and contrast
Resolution and contrast are the two most important parameters when evaluatingdifferent microscopy techniques. They are closely linked, and define how muchinformation that can be obtained from an imaging process. The Rayleigh resolutioncriterion states that the minimum resolvable distance between two point objects,in a far field microscope, is
25
26 CHAPTER 4. X-RAY MICROSCOPY
0.61λ
NA, (4.1)
where λ is the wavelength and NA the numerical aperture. For soft x-rays, thiswould suggest a theoretical resolution of a few nanometers provided high-numerical-aperture optics could be fabricated. Presently, the resolution is limited to ∼30 nmby the currently available diffractive optics [58]. Even though soft x-ray microscopypotentially could provide higher resolution than visible light microscopes, electronmicroscopes already offer much higher resolution [63]. However, the penetrationdepth of electrons is limited to a few hundred nanometers in most materials dueto scattering processes. This means that only very thin samples can be imaged.Soft x-ray microscopy is motivated by the potential for high resolution imaging ofrelatively thick samples compared to electron microscopy. Furthermore, it exploitsa natural contrast mechanism described below.
X-rays interact with matter in three ways - elastic scattering, inelastic scattering,and absorption via the photoelectric effect [40]. Elastic (or coherent) scattering is aprocess where reemission of radiation occurs at the same frequency as the incidentradiation. Elastic scattering from free electrons is called Thomson scattering, whileelastic scattering from bound electrons is called Rayleigh scattering. Inelastic, in-coherent or Compton scattering occurs when the scattering causes an electron tobe ejected from the atom, thereby transferring a small fraction of the incident x-rayenergy to the electron. In the soft x-ray regime incoherent scattering is negligible,and the coherent scattering cross section is less than 1% of the absorption crosssection. Thus, the dominating process is photoelectric absorption, although coher-ent scattering is important in phase-contrast imaging.
When x-rays travel through a material of thickness t, the intensity I will be atten-uated according to the Beer-Lambert law
I(t) = I0e−µt, (4.2)
where I0 is the incident intensity and µ is the linear absorption coefficient, whichdepends on the wavelength λ and the imaginary part of the refractive index β forthe material (cf. Eq. 3.1),
µ =4πβ
λ. (4.3)
Soft x-ray microscopy is mostly performed in the so-called water window, i.e., thewavelength interval between 2.3 nm and 4.4 nm, determined by the oxygen and the
4.2. RADIATION DAMAGE 27
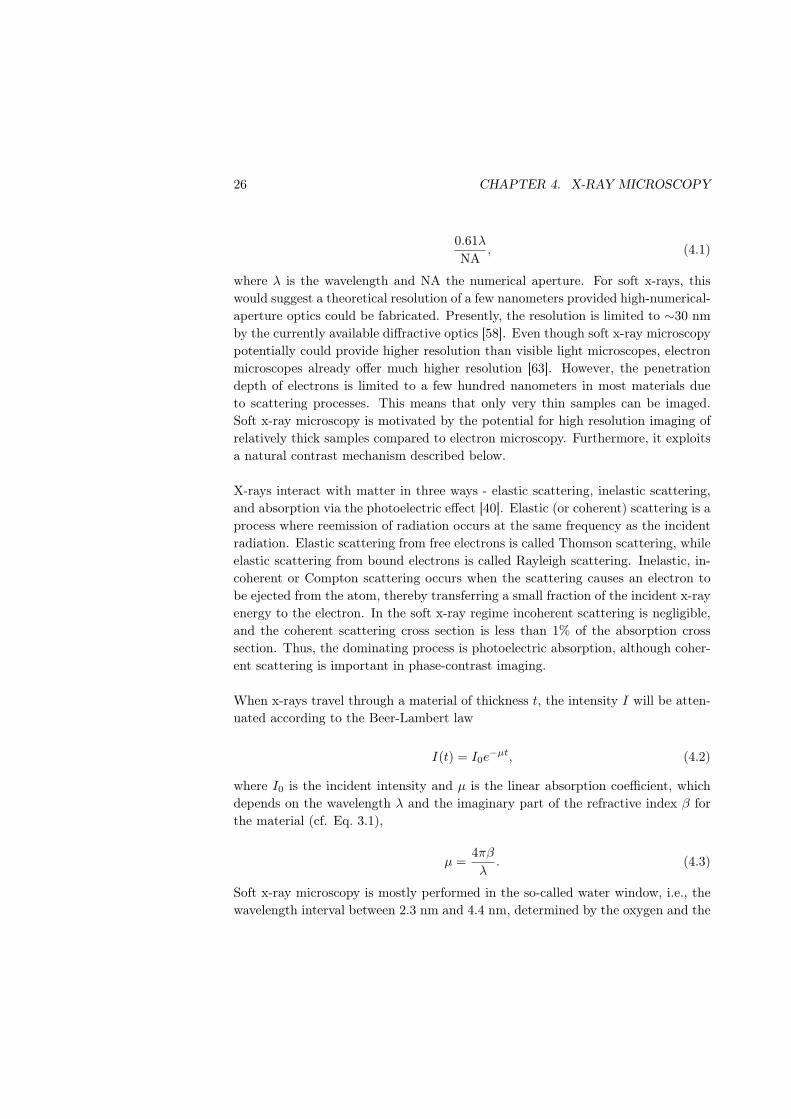
carbon absorption edges. The attenuation lengths, 1/µ, for oxygen and carbon dif-fer strongly in this wavelength region, cf. Fig. 4.1. This provides a natural contrastmechanism for carbon-containing biological specimens in an aqueous environment.
1 2 3 4 50.1
1
10
Wavelength λ [nm]
Att
en
ua
tion
Le
ng
th [
µm
]
Water
ProteinO N
C
Figure 4.1. The attenuation length for soft x-rays in water and a typical protein [64] asa function of wavelength. The spectral range between the carbon and oxygen absorptionedges is called the water window and offers a natural contrast mechanism for biologicalmaterials.
Even if absorption is the major contrast mechanism for soft x-ray microscopy, thereis a non-negligible phase shift φ for rays passing through matter of thickness t,
φ(t) =2πδ
λt, (4.4)
where δ is the real part of the refractive index, which makes phase-contrast imag-ing possible. Zernike phase contrast imaging of biological specimens in the waterwindow has the advantage of a higher image contrast and a reduced radiation dosecompared to absorption contrast [65]. Differential interference contrast (DIC), in-troduced to visible-light microscopy by Nomarski [12, 66], has been demonstratedfor hard x-ray microscopy at 4 keV [67] and for soft x-rays at 430 eV as describedin Paper 5.
4.2 Radiation damage
Soft x-ray photons have sufficient energy to ionize atoms and thereby break chemicalbonds, a process which can lead to morphological changes in the specimen. Sayreand his co-authors have performed model calculations of minimum soft x-ray dose
28 CHAPTER 4. X-RAY MICROSCOPY
as a function feature resolution, d, and specimen thickness [64, 68]. The requiredminimum dose to the specimen is a rapidly increasing function of resolving power,varying approximately as d−4. Although these calculations are highly idealized,the results can be used to give an estimate of the resolution attainable before theonset of significant radiation damage. A soft x-ray transmission microscope withhigh resolution delivers a large radiation dose to the sample, typically 105 to 108
Gy, during exposure. However, unfixed hydrated cells show structural alterationsalready at a dose of ∼ 104 Gy [69]. There exist two approaches to reduce theproblem with radiation damage. One of them involves techniques that increase theresistance to radiation damage. Biological samples that have been fixated chemi-cally can withstand up to 106 Gy [70] and cryogenically fixated samples can endurea dose of 1010 Gy [69] without introducing any morphological changes. Anotherapproach is to reduce the dose required to obtain high quality image by using scan-ning microscopy, cf. Sec. 4.3, or phase contrast imaging techniques that enhanceimage contrast.
4.3 Synchrotron-based x-ray microscopy
Today, most soft x-ray microscopes in operation are based on synchrotron sources.This section gives a brief explanation of the two major operation modes and thelocation of the most important instruments.
Specimen
Image
Condenser
zone plate
Objective
Zone Plate
Order sorting
aperture
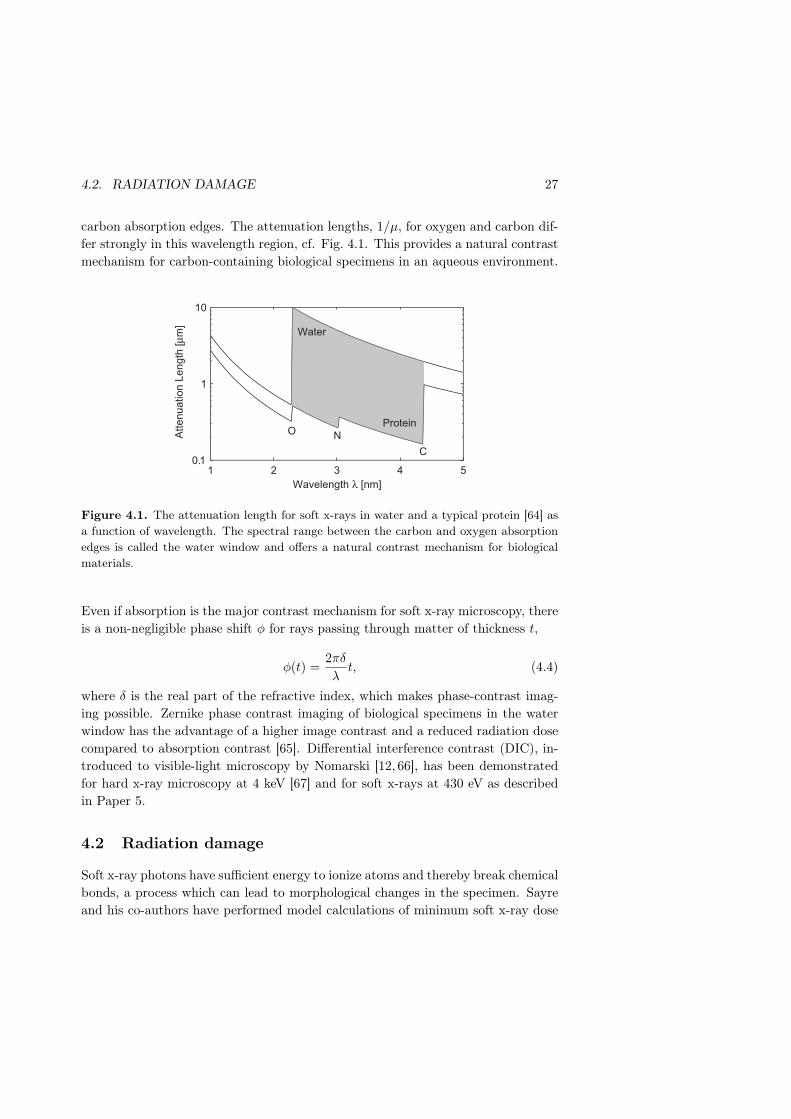
Figure 4.2. Typical arrangement of a high-resolution transmission x-ray microscope(TXM).
High-resolution transmission x-ray microscopy (TXM) was pioneered by Schmal etal. at the George-August University in Göttingen in Germany [15]. Their micro-scope is today in operation at the BESSY II synchrotron facility in Berlin [71–74].Figure 4.2 shows a typical TXM arrangement where soft x-rays from a synchrotronradiation source illuminate the sample by means of a condenser zone plate. A cen-
4.3. SYNCHROTRON-BASED X-RAY MICROSCOPY 29
tral stop in front of the condenser zone plate creates the hollow cone illuminationrequired for zone plate imaging. An order-sorting aperture placed close to the sam-ple location sorts out the first diffraction order from the condenser zone plate andacts as a monchromator. A micro zone plate then images the sample onto a thinnedback-illuminated CCD detector.
Scanning soft x-ray microscopy was pioneered by Kirz et al. at SUNY Stony Brookand Brookhaven National Laboratory in USA [16, 75–77]. Such microscopes usespatially coherent x-rays to illuminate a zone plate lens, which forms a first orderfocal spot at the sample plane with a spot size limited by the resolution of thezone plate. A central stop in front of the zone plate together with an order-sortingaperture before the sample block all diffraction orders except the first. The radi-ation transmitted through the sample is then detected by a fast x-ray detector asthe sample is raster scanned past the focal spot. Since there are no optical compo-nents between sample and detector the losses are minimal and the radiation dose islower than in a TXM. Furthermore, the scanning microscope can be used in severaldetection modes, e.g., X-ray Absorption Near Edge Structure (XANES), which isan important method to image molecular or elemental distribution in a sample [78].
The major water-window microscopes currently in operation are located at the Ad-vanced Light Source in Berkeley, USA, at BESSY II in Berlin, Germany, at theNational Synchrotron Light Source in New York, USA, and at ASTRID in Aarhus,Denmark. Applications for these microscopes cover a wide range of topics, e.g., cellbiology, colloidal physics, magnetic materials and material science. An extendedoverview of the development of different microscopes and their applications can befound in the proceedings of the x-ray microscopy conference series from 1983 untiltoday [79–86].
The limited accessibility to synchrotron-based microscopes has reduced the impactof x-ray microscopy as an important tool for user-motivated research. This has mo-tivated the development of compact soft x-ray microscopes operating in the waterwindow. The next chapter summarizes previous efforts and describes the develop-ment of a reliable, user friendly, high-resolution compact soft x-ray microscope withthe ability to operate at two different wavelengths.

Chapter 5
Compact soft x-ray microscopy
Although the actual microscope is very compact for synchrotron based arrange-ments, the x-ray source certainly is not. This means that users have to bringtheir samples to the synchrotron radiation facility to do experiments, which inmany cases is neither convenient nor possible. Therefore, compact soft x-ray mi-croscopes that could be placed in the biological or material science laboratoriesare needed. Previous work on compact transmission x-ray microscopy in the waterwindow has been based on laboratory-scale laser-plasma or pinch-plasma sources.Nakayama et al. combined a carbon-tape-target laser plasma with an ellipticalcondenser mirror and a zone plate, performing λ = 3.37 nm imaging of dry testobjects [87, 88]. The magnification was 500× and periods down to 180 nm wereresolved. The debris emission from the plasma and the non-regenerative characterof the carbon-tape target resulted in a system with a limited operability. Rudolphet al. used a low-repetition-rate pinch-plasma source, operating at λ = 2.48 nm,together with an elliptical condenser mirror and zone plate optics, demonstratingdry and wet imaging [89]. The low repetition rate and the instability of the sourcemade operation of the system difficult; still 100-150 nm features were detectablefor dry objects with low signal-to-noise ratio. This microscope did not isolate theλ = 2.48 nm line from the λ = 2.49 nm line resulting in a large effective linewidth which caused chromatic aberrations in the zone-plate image, thereby lim-iting the extendability towards high-resolution x-ray microscopy. Berglund et al.demonstrated a λ = 3.37 nm vertical microscope in 1999 [90] which was improvedduring the following years [91]. It employed a normal-incidence spherical multilayercondenser mirror and zone plate optics obtaining a resolution of 100 nm. This mi-croscope used a minimum-debris regenerative liquid-jet laser-plasma source [92]. Adifferent approach was recently demonstrated by Hoshino et al. where a broad-band solid-tantalum-target laser-plasma source in combination with Wolter-type
31
32 CHAPTER 5. COMPACT SOFT X-RAY MICROSCOPY
grazing-incidence mirrors used both as condenser and objective resulted in an es-timated resolution of 100 nm [93]. Kyong et al. combined an elliptical condensermirror and zone plate optics for λ = 2.88 nm microscopy, claiming 50 nm resolu-tion [94]. Scanning microscopy with a laser-plasma source operating at 3.37 nmusing a Mylar® target was demonstrated by Michette et al. with the capability ofresolving structures with a period of ∼400 nm [95].
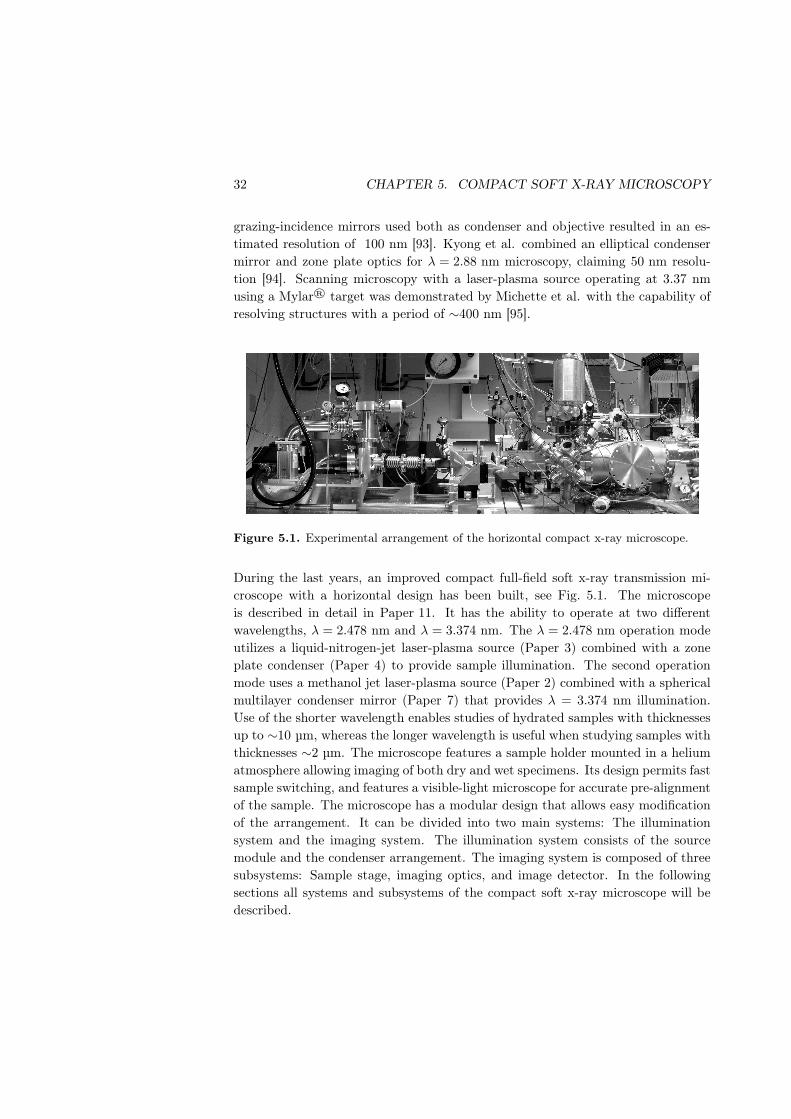
Figure 5.1. Experimental arrangement of the horizontal compact x-ray microscope.
During the last years, an improved compact full-field soft x-ray transmission mi-croscope with a horizontal design has been built, see Fig. 5.1. The microscopeis described in detail in Paper 11. It has the ability to operate at two differentwavelengths, λ = 2.478 nm and λ = 3.374 nm. The λ = 2.478 nm operation modeutilizes a liquid-nitrogen-jet laser-plasma source (Paper 3) combined with a zoneplate condenser (Paper 4) to provide sample illumination. The second operationmode uses a methanol jet laser-plasma source (Paper 2) combined with a sphericalmultilayer condenser mirror (Paper 7) that provides λ = 3.374 nm illumination.Use of the shorter wavelength enables studies of hydrated samples with thicknessesup to ∼10 µm, whereas the longer wavelength is useful when studying samples withthicknesses ∼2 µm. The microscope features a sample holder mounted in a heliumatmosphere allowing imaging of both dry and wet specimens. Its design permits fastsample switching, and features a visible-light microscope for accurate pre-alignmentof the sample. The microscope has a modular design that allows easy modificationof the arrangement. It can be divided into two main systems: The illuminationsystem and the imaging system. The illumination system consists of the sourcemodule and the condenser arrangement. The imaging system is composed of threesubsystems: Sample stage, imaging optics, and image detector. In the followingsections all systems and subsystems of the compact soft x-ray microscope will bedescribed.
5.1. ILLUMINATION SYSTEM 33
5.1 Illumination system
5.1.1 Liquid-jet laser-plasma source
The compact x-ray microscope uses a liquid-jet laser-plasma source to provide ra-diation in the water window. An introduction to laser-plasma sources is found inSect. 2.3, whereas this section focuses on the liquid-jet laser-plasma target conceptand the technical properties of the sources used in the microscope.
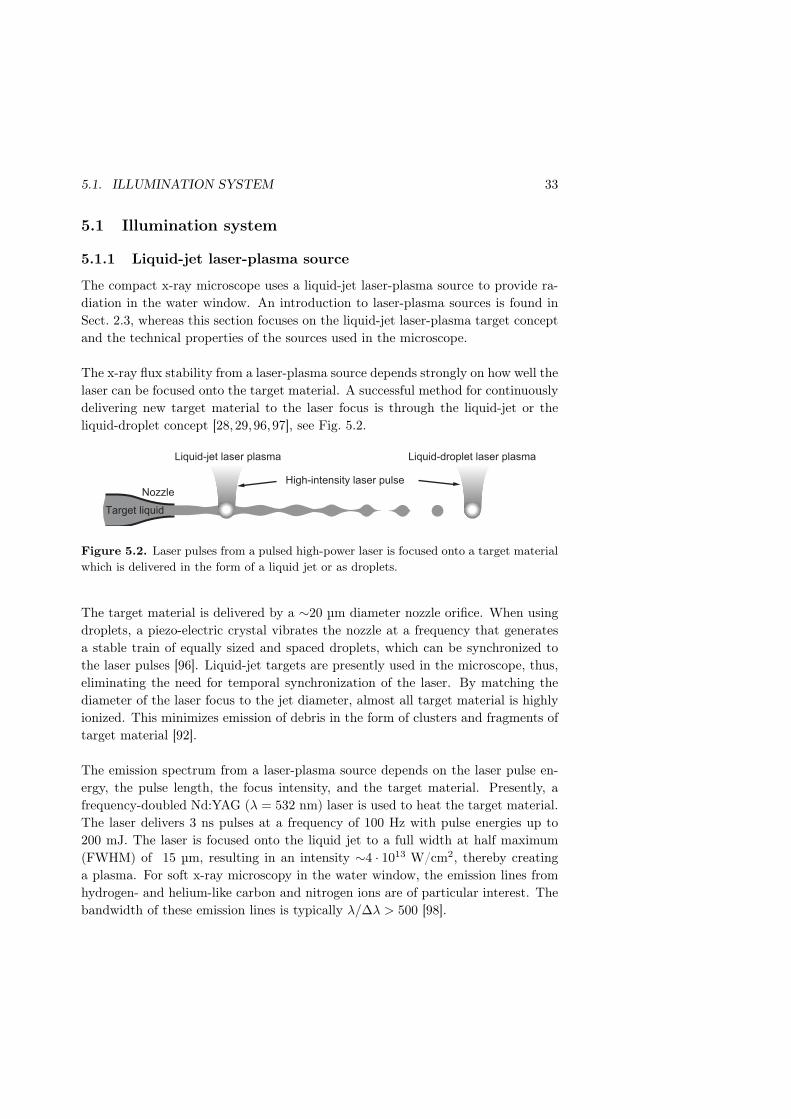
The x-ray flux stability from a laser-plasma source depends strongly on how well thelaser can be focused onto the target material. A successful method for continuouslydelivering new target material to the laser focus is through the liquid-jet or theliquid-droplet concept [28,29,96,97], see Fig. 5.2.
Liquid-jet laser plasma Liquid-droplet laser plasma
NozzleHigh-intensity laser pulse
Target liquid
Figure 5.2. Laser pulses from a pulsed high-power laser is focused onto a target materialwhich is delivered in the form of a liquid jet or as droplets.
The target material is delivered by a ∼20 µm diameter nozzle orifice. When usingdroplets, a piezo-electric crystal vibrates the nozzle at a frequency that generatesa stable train of equally sized and spaced droplets, which can be synchronized tothe laser pulses [96]. Liquid-jet targets are presently used in the microscope, thus,eliminating the need for temporal synchronization of the laser. By matching thediameter of the laser focus to the jet diameter, almost all target material is highlyionized. This minimizes emission of debris in the form of clusters and fragments oftarget material [92].
The emission spectrum from a laser-plasma source depends on the laser pulse en-ergy, the pulse length, the focus intensity, and the target material. Presently, afrequency-doubled Nd:YAG (λ = 532 nm) laser is used to heat the target material.The laser delivers 3 ns pulses at a frequency of 100 Hz with pulse energies up to200 mJ. The laser is focused onto the liquid jet to a full width at half maximum(FWHM) of 15 µm, resulting in an intensity ∼4 · 1013 W/cm2, thereby creatinga plasma. For soft x-ray microscopy in the water window, the emission lines fromhydrogen- and helium-like carbon and nitrogen ions are of particular interest. Thebandwidth of these emission lines is typically λ/∆λ > 500 [98].
34 CHAPTER 5. COMPACT SOFT X-RAY MICROSCOPY
Methanol target
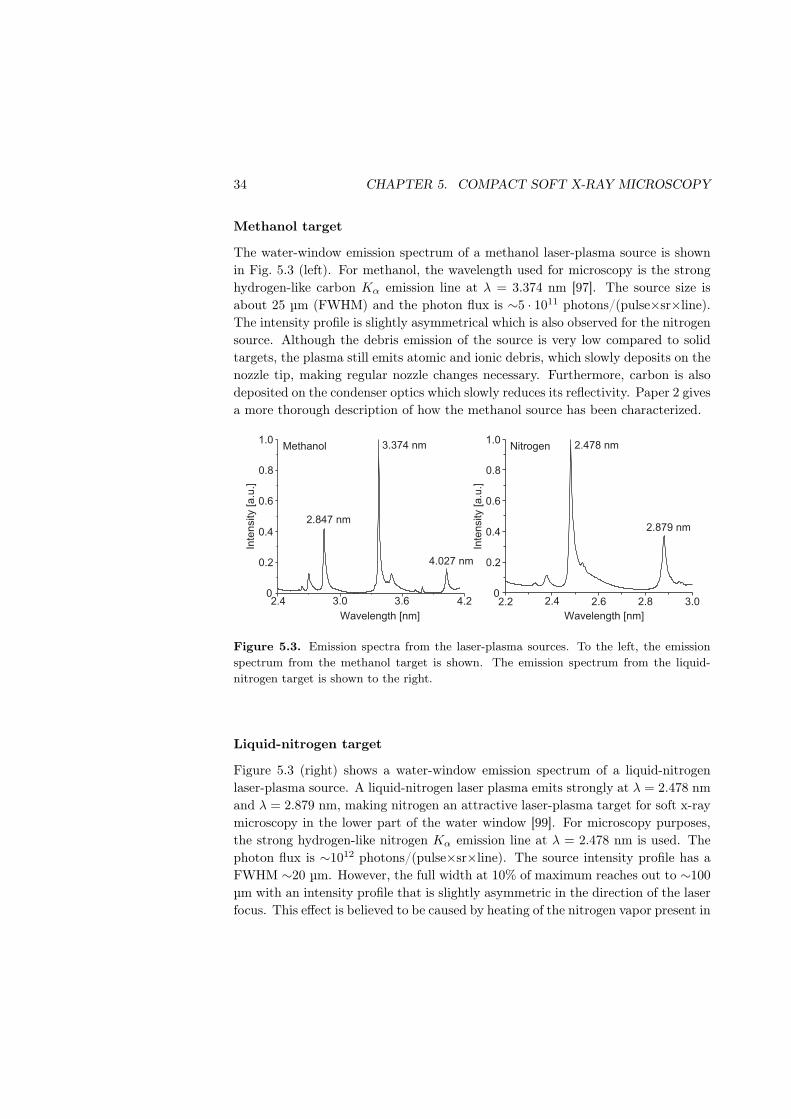
The water-window emission spectrum of a methanol laser-plasma source is shownin Fig. 5.3 (left). For methanol, the wavelength used for microscopy is the stronghydrogen-like carbon Kα emission line at λ = 3.374 nm [97]. The source size isabout 25 µm (FWHM) and the photon flux is ∼5 · 1011 photons/(pulse×sr×line).The intensity profile is slightly asymmetrical which is also observed for the nitrogensource. Although the debris emission of the source is very low compared to solidtargets, the plasma still emits atomic and ionic debris, which slowly deposits on thenozzle tip, making regular nozzle changes necessary. Furthermore, carbon is alsodeposited on the condenser optics which slowly reduces its reflectivity. Paper 2 givesa more thorough description of how the methanol source has been characterized.
Inte
nsity [
a.u
.]
0
0.2
0.4
0.6
0.8
1.0
Wavelength [nm]
3.0 3.62.4 4.2
3.374 nm
4.027 nm
2.847 nm
Inte
nsity [
a.u
.]
0
0.2
0.4
0.6
0.8
1.0
Wavelength [nm]
2.4 2.6 2.8 3.02.2
2.478 nm
2.879 nm
Methanol Nitrogen
Figure 5.3. Emission spectra from the laser-plasma sources. To the left, the emissionspectrum from the methanol target is shown. The emission spectrum from the liquid-nitrogen target is shown to the right.
Liquid-nitrogen target
Figure 5.3 (right) shows a water-window emission spectrum of a liquid-nitrogenlaser-plasma source. A liquid-nitrogen laser plasma emits strongly at λ = 2.478 nmand λ = 2.879 nm, making nitrogen an attractive laser-plasma target for soft x-raymicroscopy in the lower part of the water window [99]. For microscopy purposes,the strong hydrogen-like nitrogen Kα emission line at λ = 2.478 nm is used. Thephoton flux is ∼1012 photons/(pulse×sr×line). The source intensity profile has aFWHM ∼20 µm. However, the full width at 10% of maximum reaches out to ∼100µm with an intensity profile that is slightly asymmetric in the direction of the laserfocus. This effect is believed to be caused by heating of the nitrogen vapor present in
5.1. ILLUMINATION SYSTEM 35
the vicinity of the liquid jet. Nitrogen benefits from being relatively inert, therebyminimizing damage of and deposition on sensitive x-ray optics due to debris. Paper3 gives a full description of the liquid-nitrogen source characterization.
5.1.2 Condenser arrangements
The condenser arrangement is a critical component in a compact soft x-ray micro-scope. It should provide high photon flux, a uniform illumination of the sampleplane, and ideally also match the numerical aperture of the objective zone plate.Although the laser-plasma sources described above produce a high photon flux, theemitted photons are almost uniformly distributed into a 4π sr solid angle. Due tophoton-economic reasons, the condenser arrangements operate using critical illu-mination, i.e., the source is imaged directly onto the sample. This means that thesource profile affects the sample illumination profile. Furthermore, when workingwith zone plate objectives one must use a hollow-cone illumination since only afraction of the illumination is diffracted into the first order image. Presently, thecompact x-ray microscope uses two different types of condenser arrangements: anormal incidence multilayer mirror for the λ = 3.374 nm source and a zone platefor the λ = 2.478 nm source. The basic theory for these optical elements can befound in Chapter 3.
Multilayer mirror condenser
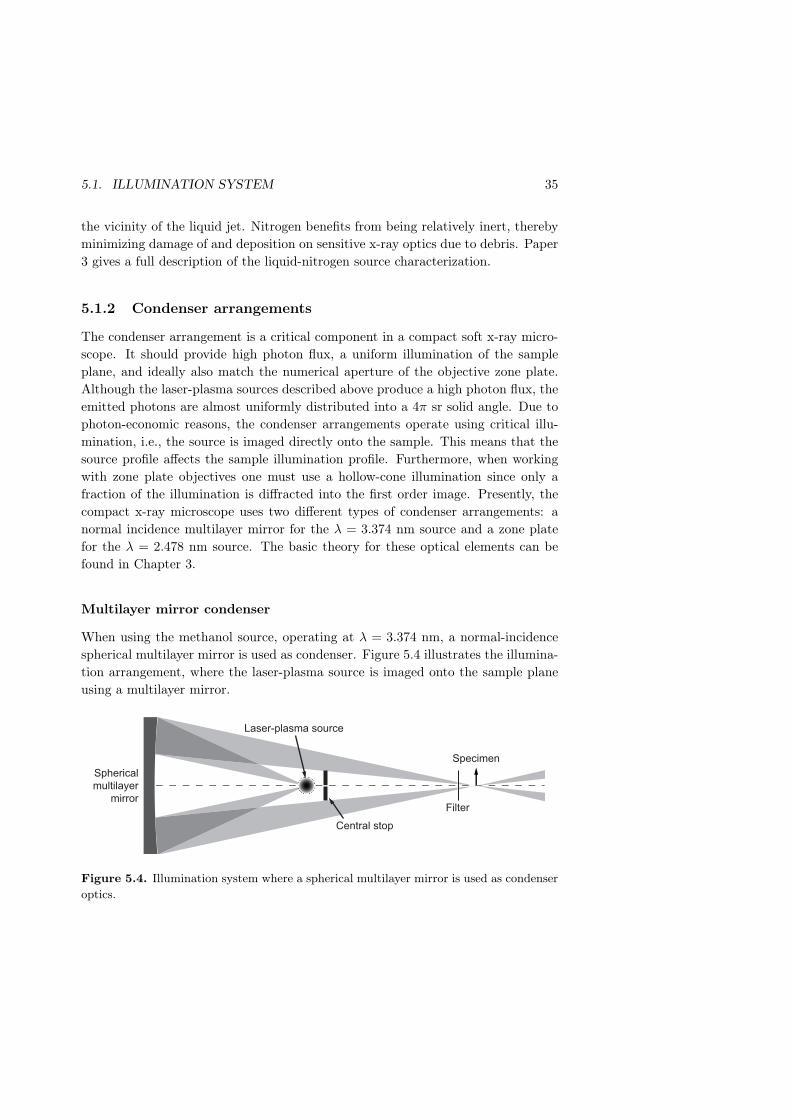
When using the methanol source, operating at λ = 3.374 nm, a normal-incidencespherical multilayer mirror is used as condenser. Figure 5.4 illustrates the illumina-tion arrangement, where the laser-plasma source is imaged onto the sample planeusing a multilayer mirror.
Specimen
Laser-plasma source
Spherical
multilayer
mirror
Central stop
Filter
Figure 5.4. Illumination system where a spherical multilayer mirror is used as condenseroptics.
36 CHAPTER 5. COMPACT SOFT X-RAY MICROSCOPY
Direct light from the source onto the sample is avoided by placing a central stopbetween the source and the sample plane, a stop which at the same time createsthe required hollow-cone illumination. Consequently, only a part of the mirror isused to collect radiation from the source. The diameter of the central stop togetherwith the focal length and magnification of the objective determines the field of viewfor the microscope. The mirror also reflects green laser light which makes align-ment very easy. However, during experiments this light must be prevented fromreaching the sample plane, which is done by placing a 300 nm thick titanium filterin front of the sample plane. The transmission of the filter is ∼50% at λ = 3.374 nm.
The multilayer stack consist of 300 bilayers of Cr/Sc deposited on a spherical SiO2
substrate with a multilayer period optimized for λ = 3.374 nm. Theoretically, areflectivity of 39% is possible. However, experimentally, the mirrors show a uniformreflectivity of ∼3%. The difference between theory and practice is mainly due tosubstrate roughness and layer interdiffusion, as described in Paper 7. The largenumber of bilayers gives the mirror a narrow spectral bandwidth of λ/∆λ ≈ 240.Therefore, the multilayer mirror together with the titanium filter act as a monochro-mator for the illumination system. The mirror substrate has a radius of curvatureof 350 mm and a diameter of 58 mm. It images the source using a source-to-sampledistance of 180 mm which gives a source magnification of 1.64× and a numericalaperture of ∼0.063 for the illumination.
The quality of the illumination in a microscope is an important parameter. Theillumination uniformity is defined as
U =Imax − Imin
Imax + Imin, (5.1)
where Imax is the maximum intensity and Imin is the minimum intensity of the illu-mination within the field of view. Using a typical objective, the methanol source to-gether with the multilayer mirror condenser gives a good uniformity, ∼12%, withina field-of-view with a diameter of 20 µm. However, this way of producing a uniformillumination comes at the cost of losing a large fraction of the source radiationwhich is imaged outside the field of view.
Taking source brightness, collected solid angle, mirror reflectivity, filter transmis-sion, vacuum window transmission, and source magnification into account the ar-rangement gives an average illumination, in the sample plane, of∼2 · 106 photons/(s×µm2)within the field of view. This is an improvement by a factor of ten compared tothe arrangement demonstrated by Berglund et al. in 1999, which used a W/B4Cmultilayer mirror described in Ref. [100].
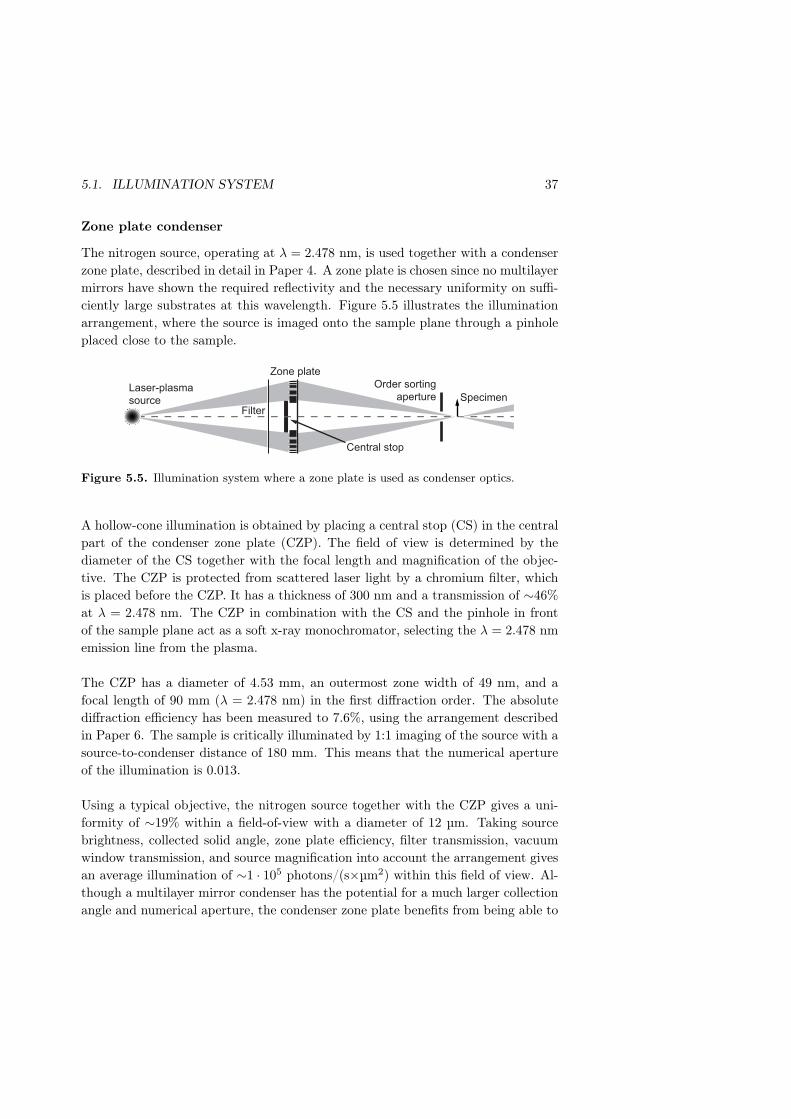
5.1. ILLUMINATION SYSTEM 37
Zone plate condenser
The nitrogen source, operating at λ = 2.478 nm, is used together with a condenserzone plate, described in detail in Paper 4. A zone plate is chosen since no multilayermirrors have shown the required reflectivity and the necessary uniformity on suffi-ciently large substrates at this wavelength. Figure 5.5 illustrates the illuminationarrangement, where the source is imaged onto the sample plane through a pinholeplaced close to the sample.
SpecimenLaser-plasma
source
Zone plate
Central stop
Order sorting
aperture
Filter
Figure 5.5. Illumination system where a zone plate is used as condenser optics.
A hollow-cone illumination is obtained by placing a central stop (CS) in the centralpart of the condenser zone plate (CZP). The field of view is determined by thediameter of the CS together with the focal length and magnification of the objec-tive. The CZP is protected from scattered laser light by a chromium filter, whichis placed before the CZP. It has a thickness of 300 nm and a transmission of ∼46%at λ = 2.478 nm. The CZP in combination with the CS and the pinhole in frontof the sample plane act as a soft x-ray monochromator, selecting the λ = 2.478 nmemission line from the plasma.
The CZP has a diameter of 4.53 mm, an outermost zone width of 49 nm, and afocal length of 90 mm (λ = 2.478 nm) in the first diffraction order. The absolutediffraction efficiency has been measured to 7.6%, using the arrangement describedin Paper 6. The sample is critically illuminated by 1:1 imaging of the source with asource-to-condenser distance of 180 mm. This means that the numerical apertureof the illumination is 0.013.
Using a typical objective, the nitrogen source together with the CZP gives a uni-formity of ∼19% within a field-of-view with a diameter of 12 µm. Taking sourcebrightness, collected solid angle, zone plate efficiency, filter transmission, vacuumwindow transmission, and source magnification into account the arrangement givesan average illumination of ∼1 · 105 photons/(s×µm2) within this field of view. Al-though a multilayer mirror condenser has the potential for a much larger collectionangle and numerical aperture, the condenser zone plate benefits from being able to
38 CHAPTER 5. COMPACT SOFT X-RAY MICROSCOPY
operate over a wide range of wavelengths within the water window.
5.2 Imaging system
5.2.1 Sample stage
The specimen is supported by a thin silicon nitride membrane centered on a siliconwafer, which is placed in a sample holder held in place by a magnetic kinematicmount. The thickness of the membrane is either 50 nm or 100 nm, which corre-sponds to transmissions between 62% and 80%, depending on the thickness andwavelength used. The sample holder is mounted in a helium atmosphere separatedfrom the illumination-system vacuum by a silicon nitride membrane, and from theimaging-system vacuum by the objective zone plate membrane. A visible-light mi-croscope with 20× magnification is used for accurate pre-alignment of the samplewith respect to the zone plate objective. The design enables fast sample switch-ing and since the sample is kept at atmospheric pressure, a wet-specimen chambercan easily be obtained by clamping the specimen between two silicon nitride mem-branes. Wet-specimen imaging is advantageous in, e.g., polymer science, where thestructure is often determined by the hydration forces [101]. Also the environmen-tal and soil sciences benefit from keeping the specimens in their natural aqueousenvironment [102].
5.2.2 Imaging optics
High-resolution imaging is performed with phase zone plates made of nickel. Theyare fabricated utilizing a tri-level nanostructuring process described in Ref. [59].The patterns are generated by e-beam lithography and transferred by reactive ionetching and nickel electroplating. Presently, outermost zone widths down to 25 nmhave been achieved [103]. Table 5.1 gives the important parameters for the threeobjective zone plates that have been used during the characterization of the micro-scope.The coherence factor, m, is defined as
m =NAc
NAo, (5.2)
where NAc is the numerical aperture of the condenser system and NAo is the nu-merical aperture of the imaging objective. For coherent imaging in which a planewave illuminates the sample, NAc and m are zero. For incoherent imaging, in whichthe angular illumination of the sample is large relative to the acceptance angle ofthe objective, m approaches unity or larger. The coherence factor influences theresolution limit of an imaging system. Ideally, the coherence factor should be equal
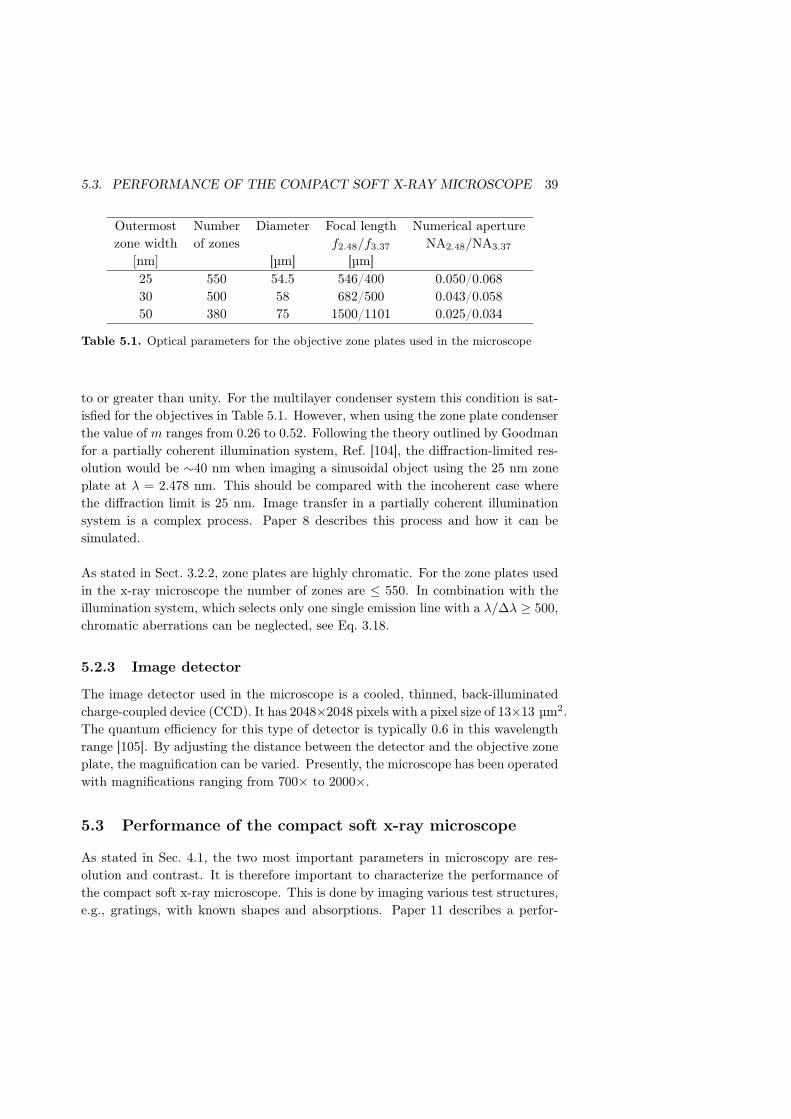
5.3. PERFORMANCE OF THE COMPACT SOFT X-RAY MICROSCOPE 39
Outermost Number Diameter Focal length Numerical aperturezone width of zones f2.48/f3.37 NA2.48/NA3.37
[nm] [µm] [µm]25 550 54.5 546/400 0.050/0.06830 500 58 682/500 0.043/0.05850 380 75 1500/1101 0.025/0.034
Table 5.1. Optical parameters for the objective zone plates used in the microscope
to or greater than unity. For the multilayer condenser system this condition is sat-isfied for the objectives in Table 5.1. However, when using the zone plate condenserthe value of m ranges from 0.26 to 0.52. Following the theory outlined by Goodmanfor a partially coherent illumination system, Ref. [104], the diffraction-limited res-olution would be ∼40 nm when imaging a sinusoidal object using the 25 nm zoneplate at λ = 2.478 nm. This should be compared with the incoherent case wherethe diffraction limit is 25 nm. Image transfer in a partially coherent illuminationsystem is a complex process. Paper 8 describes this process and how it can besimulated.
As stated in Sect. 3.2.2, zone plates are highly chromatic. For the zone plates usedin the x-ray microscope the number of zones are ≤ 550. In combination with theillumination system, which selects only one single emission line with a λ/∆λ ≥ 500,chromatic aberrations can be neglected, see Eq. 3.18.
5.2.3 Image detector
The image detector used in the microscope is a cooled, thinned, back-illuminatedcharge-coupled device (CCD). It has 2048×2048 pixels with a pixel size of 13×13 µm2.The quantum efficiency for this type of detector is typically 0.6 in this wavelengthrange [105]. By adjusting the distance between the detector and the objective zoneplate, the magnification can be varied. Presently, the microscope has been operatedwith magnifications ranging from 700× to 2000×.
5.3 Performance of the compact soft x-ray microscope
As stated in Sec. 4.1, the two most important parameters in microscopy are res-olution and contrast. It is therefore important to characterize the performance ofthe compact soft x-ray microscope. This is done by imaging various test structures,e.g., gratings, with known shapes and absorptions. Paper 11 describes a perfor-
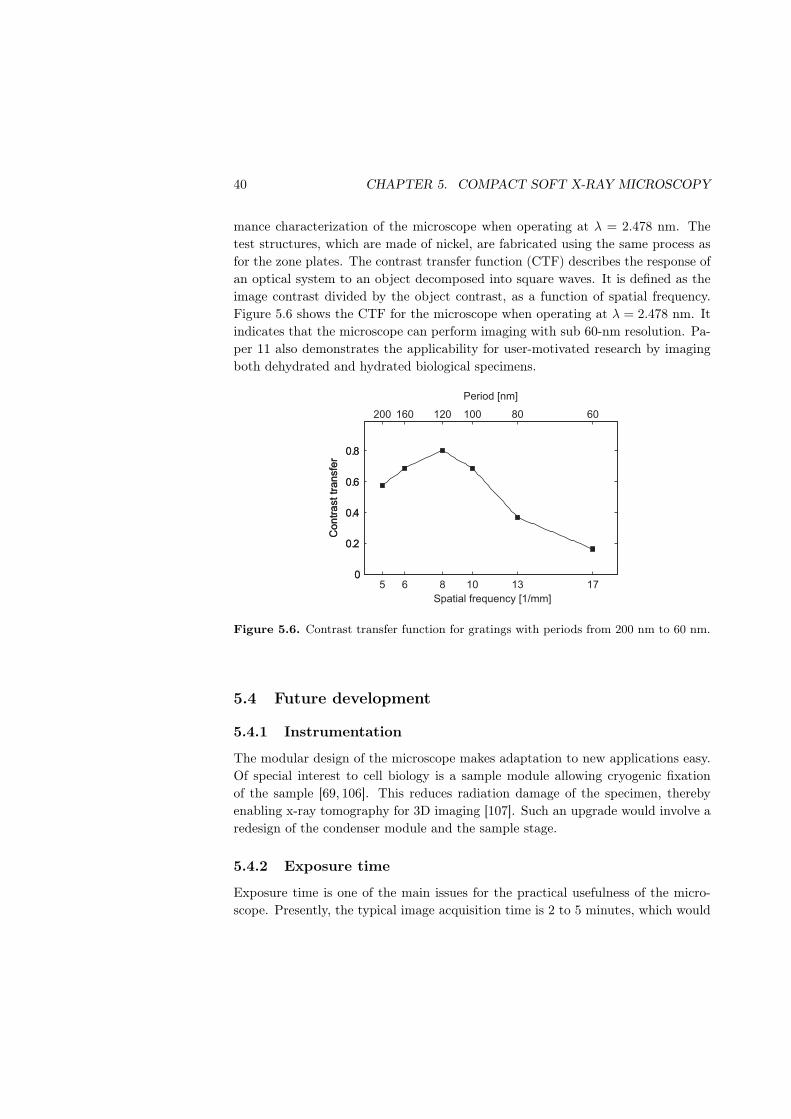
40 CHAPTER 5. COMPACT SOFT X-RAY MICROSCOPY
mance characterization of the microscope when operating at λ = 2.478 nm. Thetest structures, which are made of nickel, are fabricated using the same process asfor the zone plates. The contrast transfer function (CTF) describes the response ofan optical system to an object decomposed into square waves. It is defined as theimage contrast divided by the object contrast, as a function of spatial frequency.Figure 5.6 shows the CTF for the microscope when operating at λ = 2.478 nm. Itindicates that the microscope can perform imaging with sub 60-nm resolution. Pa-per 11 also demonstrates the applicability for user-motivated research by imagingboth dehydrated and hydrated biological specimens.
5 6 8 10 13 170
0.2
0.4
0.6
0.8
Spatial frequency [1/mm]
Con
tra
st
tra
nsfe
r
200 160 120 100 80 60
0
0.2
0.4
0.6
0.8
Period [nm]
Con
tra
st
tra
nsfe
r
Figure 5.6. Contrast transfer function for gratings with periods from 200 nm to 60 nm.
5.4 Future development
5.4.1 Instrumentation
The modular design of the microscope makes adaptation to new applications easy.Of special interest to cell biology is a sample module allowing cryogenic fixationof the sample [69, 106]. This reduces radiation damage of the specimen, therebyenabling x-ray tomography for 3D imaging [107]. Such an upgrade would involve aredesign of the condenser module and the sample stage.
5.4.2 Exposure time
Exposure time is one of the main issues for the practical usefulness of the micro-scope. Presently, the typical image acquisition time is 2 to 5 minutes, which would
5.4. FUTURE DEVELOPMENT 41
make data collection for tomography very time consuming. Fortunately, the laser-plasma target delivery system allows operation at much higher repetition rates [108]than the present 100 Hz. A new kHz laser with pulse energies similar to the presentlaser will increase the average power and the expected x-ray flux by nearly an orderof magnitude. However, it remains to be seen if the increased average power willintroduce problems with jet instability that potentially could be caused by radiativeheating of the nozzle. Further reduction of the exposure time for the λ = 2.478 nmarrangement will be made possible by a new generation of condenser zone plates.By increasing the outer diameter of the zone plate we expect to be able to increasethe effective area by a factor of 5, corresponding to an outer zone width of 33nm. However, the smaller outermost zone width also reduces the attainable plat-ing height of the structures which reduces the diffraction efficiency. The reductioncould to some extent be alleviated by recent improvements in the overall patternquality. Together these two improvements would result in exposure times of theorder of 3-30 seconds, which is similar to synchrotron-based microscopes.
5.4.3 Phase imaging
Phase contrast imaging techniques, cf. Sect. 4.1, can be used to enhance imagecontrast, which means that the radiation dose can be reduced compared to im-ages obtained using absorption contrast. Zernike phase contrast imaging has beendemonstrated at synchrotrons for biological specimens in the water window [65].However, this technique requires the introduction of a phase ring which absorbs alarge fraction of the incoming photons. This would further increase the exposuretimes, which makes this technique unsuitable for present compact soft x-ray micro-scopes. Paper 5 describes a single diffractive optical element, cf. Sect. 3.2.3, thatproduces two slightly shifted foci. This optical element act as a diffractive ampli-tude beam splitter and an x-ray objective simultaneously. A promising applicationis to perform differential interference contrast microscopy in the water window us-ing these optical elements in the compact soft x-ray microscope. In fact, differentialinterference contrast microscopy was recently reported using a single optical ele-ment for hard x-rays [67, 109] and for soft x-rays, cf. Paper 5. These objectiveshas the same diffraction efficiency, cf. Sect. 3.2.1, as a normal zone plate but couldprovide interferometric contrast enhancement. This makes them suitable for use incompact x-ray microscopes. The method for simulating imaging formation processusing partially coherent illumination, described in Paper 8, is a valuable tool whichhas been extended to simulate a compact differential interference contrast micro-scope. It is now used to evaluate and compare the imaging properties of differentzone plate designs.
42 CHAPTER 5. COMPACT SOFT X-RAY MICROSCOPY
5.5 Towards functional imaging
To understand functions in cell biology, it is valuable to know the location ofthe molecules, mostly proteins, which are responsible for the cell molecular pro-cesses [110]. Localization is made possible by labeling the proteins with markers.Attaching a marker to a protein can be done, e.g., by immunolabeling, a processoften carried out in two steps: First, a primary antibody binds to the protein to beinvestigated. Thereafter, a secondary antibody with the attached marker binds tothe primary antibody. The marker can then be detected by a microscope suitablefor the detection of the specific marker. In confocal light microscopy, immuno-labeling using fluorescent markers is a commonly used method that has found anumber of applications in biological studies. For electron microscopy, colloidal goldmarkers was introduced in 1971 by Faulk & Taylor [111]. These markers havebeen widely used in electron microscopy and light microscopy [112, 113]. Studiesof different proteins simultaneously is made possible by using double-labeling tech-niques, where different proteins are labeled with different markers. Double-labelingexperiments using electron microscopy have been based on both element-selectiveand size-selective detection methods [112,114]. Silver enhancement of colloidal-goldmarkers is a technique that can be used to increase the marker visibility [115,116].The technique is based on the photochemical process commonly used in photo-graphic films where silver ions are reduced to metallic silver. Metallic silver isdeposited on the gold particles, which acts as a catalyst in this reaction, therebyincreasing the particle size from a few to a few tens of nanometers.
Colloidal gold with subsequent silver enhancement has also been used as label indifferent fields of soft x-ray microscopy. In early experiments, surface proteinslabeled with silver-enhanced colloidal gold were imaged using contact x-ray mi-croscopy [117]. Other experiments had the purpose of investigating proteins lo-cated in the nuclei with transmission x-ray microscopy [118, 119], or to visualizethe low-contrast microtubule network of cells [120]. During these experiments theimmunolabeling was mainly used to enhance image contrast, without aiming for ac-curate localization of single proteins. In scanning x-ray microscopy, localization ofgold particles was performed by combining dark-field images, where only signal fromgold particles is detected, with bright-field images of gold-labeled cells [121, 122].Recent x-ray tomography experiments have used specimens labeled with silver-enhanced colloidal gold with additional 100-nm sized gold particles used as fiducialmarkers [107, 123]. However, in transmission x-ray microscopy, these teqniques donot allow determination of the exact location of the proteins, making it hard toperform size-selective double-labeling experiments.
5.5. TOWARDS FUNCTIONAL IMAGING 43
To stimulate further experiments on functional imaging in transmission x-ray mi-croscopy an image-analysis algorithm with the ability to size selectively localizesingle gold particles was developed. The algorithm was developed and evaluatedusing x-ray transmission images of diatoms stained with gold particles of differentsizes. These images were recorded using both the compact x-ray microscope de-scribed here and the x-ray microscope at BESSY II [74]. Paper 9 describes themethod in detail. In summary, the algorithm proved to be size-selective for 50-nmand 80-nm gold particles. It may thus be applied for accurate localization of pro-teins labeled with gold particles. Silver enhancement may be necessary to obtainparticles with resolvable sizes. For x-ray tomography, these silver-enhanced goldparticles can be used simultaneously as fiducial markers. The size sensitivity of thealgorithm makes it feasible to perform double-labeling experiments comparable tothose done with electron microscopy.

Chapter 6
Summary of papers
This thesis is based on the following eleven papers. With the exception of Paper 1,they are all related to the development of a compact soft x-ray microscope. Theauthor has had the main responsibility for Papers 1, 3, 10, and 11. In Papers 2, 4,and 6 the author has been actively involved in the planning, preparation and per-forming of the experiments but not in the fabrication of the optical components.For Papers 5, 7, 8, and 9 the author’s main responsibility was to facilitate mea-surements using the soft x-ray sources described in Papers 2 and 3. Simulations,multilayer fabrication and image processing were done by others.
Paper 1 reports on the first liquid-tin-jet laser-plasma EUV source. The conversionefficiency (CE) is measured as a function of laser pulse energy and power density. Amaximum CE of 2.5% into 2π×sr×2%BW at 13.5 nm is reported. Quantitative de-bris measurements as well as maximum repetition rate estimates are also presented.
Paper 2 describes experiments done to spatially characterize a liquid-jet laser-plasma source operating at λ =3.37 nm, suitable for compact soft x-ray microscopy.The target materials used in these experiments were methanol and ethanol. Char-acterization of the source parameters was done for different laser energies, differentpulse lengths, and different jet diameters.
Paper 3 presents a liquid-nitrogen-jet laser-plasma source with sufficient bright-ness, uniformity, stability, and reliability to be suitable for compact soft x-raymicroscopy at 2.478 nm wavelength. The source is quantitatively characterized bycalibrated slit-grating spectroscopy and zone-plate imaging. The absolute photonnumber in the major spectral lines is ∼1012 photons/(pulse×sr×line). The sourcediameter is ∼20 µm (FWHM) and the spatial stability is better than ±2 µm.
45
46 CHAPTER 6. SUMMARY OF PAPERS
Paper 4 describes the fabrication and characterization of a condenser zone platesuitable for compact laser-plasma-based soft x-ray microscopy operating at 2.478 nmwavelength. The focal length of the condenser is 90 mm, and it has a diameter of4.53 mm and an outermost zone width of 49 nm. Incoherent source conditionsrelaxes fabrication tolerances and a high grove diffraction efficiency of 11% wasachieved for λ = 2.879 nm.
Paper 5 reports on a compact interferometer for the soft x-ray range that is suit-able for operation with laser-plasma sources. It consist of a single diffractive opticalelement that produces two focal spots. The light from these two secondary sourcesforms the interference pattern. The diffractive optical element can simultaneouslybe used as an imaging optic, enabling differential interference contrast microscopy.
Paper 6 presents a laboratory-scale arrangement for rapid and accurate determina-tion of the absolute and local efficiency of soft x-ray zone plates. By simultaneouslycomparing the +1st diffraction-order photon flux with the flux in a calibrated refer-ence signal, source fluctuations are eliminated. The performance of the method isdemonstrated by measurements on zone plate objectives made of nickel. The instru-ment can provide rapid feedback to the fabrication process for future improvements.
Paper 7 describes the development of a large-diameter spherical Cr/Sc multilayermirror, suitable as condenser in the compact x-ray microscope. The mirror ope-rates at λ = 3.374 nm and shows an average reflectivity of 3% with good uniformity.Thus, the exposure time in the compact x-ray microscope was reduced by a factorof 10 compared to imaging with the W/B4C mirrors previously used.
Paper 8 reports on a numerical method for simulating two-dimensional images ina compact soft x-ray microscope using partially coherent illumination. The numer-ical model is valid when the condenser can be considered as a secondary incoherentsource. The results are compared with images acquired from a compact soft x-raymicroscope showing qualitative agreement.
Paper 9 describes an image-analysis algorithm for identification of single goldparticles in x-ray microscope images. The size-sensitive algorithm was developedand evaluated with images taken at the transmission x-ray microscope at BESSY IIin Berlin. Furthermore, the algorithm was successfully tested on images taken withthe compact soft x-ray microscope described in this thesis.
47
Paper 10 reports on source properties and design considerations for a compactx-ray microscope operating at 2.478 nm wavelength. The microscope will use aliquid-nitrogen-jet laser-plasma source in combination with a zone plate condenserfor sample illumination. Calculations including source parameters as well as char-acteristics of available x-ray optics indicate that high-quality microscope imagescan be obtained with exposure times in the range of a few minutes.
Paper 11 presents the instrumentation and performance of a sub-60 nm resolu-tion compact x-ray microscope based on a liquid-nitrogen-jet laser-plasma source.The microscope operates in the lower wavelength region of the water window, atλ = 2.478 nm. High-quality images can be acquired with exposure times below 5minutes. The performance of the microscope is demonstrated using both dry andwet samples.

Acknowledgements
This thesis work would not have been possible without the contributions and sup-port from many. I therefore wish to express my gratitude to all of them.
First of all, my supervisor Hans Hertz for his ability to inspire, encourage, andsupport me during my studies. His relaxed approach to experimental setbacksmade me grow as an experimentalist. I have never regretted working for him.
My co-authors: Anders Holmberg, Björn Hansson, Göran Johansson, Heide Stoll-berg, Jaco de Groot, Magnus Lindblom, Marek Wieland, Michael Bertilson, MikaelOtendal, Olov von Hofsten, Oscar Hemberg, Peter Guttmann, Rolf Frueke, SergiyYulin, Stefan Rehbein, Thomas Wilhein, Tomi Tuohimaa, and Ulrich Vogt for su-pervision, successful and miserable experiments, and collaboration, as well as in-teresting discussions regarding physics and other topics.
Rolg Helg and Kjell Hammarström, from the mechanical workshop at KTH, fortheir invaluable advice on mechanical design. Without their efforts, none of theexperiments described in this thesis would have been possible.
All past and present colleagues at the Biomedical & X-Ray Physics division notmentioned earlier, for the warm and friendly atmosphere at the division. My specialthanks goes to: Göran Manneberg, Kjell Carlsson, and Peter Unsbo for introducingme to optics as well as letting me teach in their courses; my dear friend LindaLundström; my fantastic roommates Anna Gustrin, Jessica Hultström, and OttoManneberg who also posed as my personal trainer and proofread my thesis; HeideStollberg, who became a great friend during the time we spent working together;Milan Pokorny for his assistance with mechanical design and laboratory equipment;and Anders Liljeborg for the hours spent working together on computer support.
Finally, my wife, family, and friends for the love and encouragement I have receivedduring my studies.
49

Bibliography
[1] R. Hooke, Micrographia. Project GutenBerg, http://www.gutenberg.org/,(2005).
[2] E. Abbe, Beitrage zur Theorie des Mikroskops und der mikroskopischenWahrnehmung. Arch. Mikrosk. Anat. 9, 413–468 (1873).
[3] E. Abbe, Note on the proper definition of the amplifying power of a lens ora lens system. J. Roy. Microsc. Soc. 4, 348–351 (1884).
[4] S. Bradbury, The quality of the image produced by the compound microscope:1700-1840, 151–173, Heffer, Cambridge (1967).
[5] M. Born and E. Wolf, Principles of optics: electromagnetic theory of propa-gation, interference and diffraction of light. Cambridge university press, 7th
edition, (1999).
[6] J. B. Pawley (ed.), Handbook of biological confocal microscopy. Springer, 3rd
edition, (2006).
[7] V. Westphal and S. W. Hell, Nanoscale resolution in the focal plane of anoptical microscope. Phys. Rev. Lett. 94, 143903–1 (2005).
[8] K. I. Willig et al., STED microscopy reveals that synaptotagmin remainsclustered after synaptic vesicle exocytosis. Nature 440, 935–939 (2006).
[9] M. Knoll and E. Ruska, Das Elektronenmikroskop. Z. Phys. A: Hadrons Nucl.78, 318–339 (1932).
[10] G. Binning et al., Surface Studies by Scanning Tunneling Microscopy. Phys.Rev. Lett. 49, 57–61 (1982).
[11] F. Zernike, Phase contrast, a new method for the microscopic observation oftransparent objects. I-II. Physica 9, 686–698 (1942).
51
52 BIBLIOGRAPHY
[12] G. Nomarski and A. R. Weill, Application à la métallographie des méthodesinterférentielles à deux ondes polarisées. Revue de métallurgie LII, 121–134(1955).
[13] W. C. Röntgen, Eine neue Art von Strahlen. Stahel’sche K.B. Hof- undUniversitätsbuch- und Kunsthandlung, Würzburg, 3rd edition, (1896).
[14] D. T. Attwood, Soft X-Rays and Extreme Ultraviolet Radiation. CambridgeUniversity Press, Cambridge, (1999).
[15] B. Niemann, D. Rudolph, and G. Schmahl, X-Ray Microscopy with Syn-chrotron Radiation. Appl. Opt. 15, 1883–1884 (1976).
[16] H. Rarback, J. M. Kenney, and J. Kirz, Recent results from the Stony Brookscanning microscope, In: G. Schmahl and D. Rudolph (eds.), X-ray mi-croscopy, volume 43, Springer-Verlag, 203–216 (1984).
[17] W. Brefeld and P. Gurtler, Handbook on synchrotron radiation. North-Holland, Amsterdam, (1991).
[18] J. A. Samson and D. L. Ederer, Vacuum ultraviolet spectroscopy. 1, volume 31of Experimental Methods in the Physical Sciences. Academic Press, SanDiego, (1998).
[19] J. A. Samson and D. L. Ederer, Vacuum ultraviolet spectroscopy. 2, volume 32of Experimental Methods in the Physical Sciences. Academic Press, SanDiego, (1998).
[20] www-ssrl.slac.stanford.edu/lcls/, Electronic Citation, (2007).
[21] P. G. O’Shea and H. P. Freund, Free-electron lasers: status and applications.Science 292, 1853–1858 (2001).
[22] K. J. Kim, 3-Dimensional Analysis of Coherent Amplification and Self-Amplified Spontaneous Emission in Free-Electron Lasers. Phys. Rev. Lett.57, 1871–1874 (1986).
[23] G. A. Johansson, Compact soft x-ray microscopy. Royal Institute of Technol-ogy, Stockholm, (2003).
[24] V. Ayvazyan et al., First operation of a free-electron laser generating GWpower radiation at 32 nm wavelength. Eur. Phys. J. D 37, 297–303 (2006).
[25] R. Kauffman, X-ray radiation from laser plasma, volume 3 of Handbook ofplasma physics, book chapter 3, 111–162, North-Holland, Amsterdam (1991).
53
[26] D. T. Attwood, Soft X-Rays and Extreme Ultraviolet Radiation, book chap-ter 6, 189–266, Cambridge University Press, New York (1999).
[27] H. Fiedorowicz et al., X-ray emission from laser-irradiated gas puff targets.Appl. Phys. Lett. 62, 2778–2780 (1993).
[28] L. Rymell and H. M. Hertz, Droplet Target for Low-Debris Laser-PlasmaSoft-X-Ray Generation. Opt. Commun. 103, 105–110 (1993).
[29] L. Malmqvist et al., Liquid-jet target for laser-plasma soft X-ray generation.Rev. Sci. Instrum. 67, 4150–4153 (1996).
[30] V. Bakshi (ed.), EUV Sources for Lithography. SPIE Press, (2006).
[31] J. Pankert et al., EUV sources for the alpha-tools. Proc. SPIE 6151 I, 61510(2006).
[32] D. V. Korobkin et al., Demonstration of soft x-ray lasing to ground state inLi III. Phys. Rev. Lett. 77, 5206–5209 (1996).
[33] H. Daido et al., Experimental characterization of short-wavelength Ni-likesoft-x-ray lasing toward the water window. J. Opt. Soc. Amer. B 16, 2295–2299 (1999).
[34] B. R. Benware et al., Demonstration of a high average power tabletop softX-ray laser. Phys. Rev. Lett. 81, 5804–5807 (1998).
[35] T. N. Lee, S. H. Kim, and H. J. Shin, Comparison of x-ray lasers and third-generation synchrotron radiation sources. Proc. SPIE 3156, 250–259 (1997).
[36] H. Daido, Review of soft x-ray laser researches and developments. Rep. Prog.Phys. 65, 1513–1576 (2002).
[37] D. T. Attwood, Soft X-Rays and Extreme Ultraviolet Radiation, book chap-ter 7, 267–299, Cambridge University Press, New York (1999).
[38] A. Rundquist et al., Phase-matched generation of coherent soft X-rays. Sci-ence 280, 1412–1415 (1998).
[39] E. Spiller, Soft X-ray Optics. SPIE Press, Bellingham, Washington, (1994).
[40] A. G. Michette, Optical systems for soft X rays. Plenum Press, New York,(1986).
[41] B. L. Henke, E. M. Gullikson, and J. C. Davis, X-Ray Interactions - Pho-toabsorption, Scattering, Transmission, and Reflection at E=50-30,000 Ev,Z=1-92. At. Data Nucl. Data Tables 54, 181–342 (1993).
54 BIBLIOGRAPHY
[42] www.cxro.lbl.gov, Electronic Citation, (2007).
[43] P. Kirkpatrick and A. V. Baez, Formation of optical images by X-rays. J.Opt. Soc. Am. 38, 766–774 (1948).
[44] H. Wolter, Spiegelsysteme streifenden Einfalls als abbildende Optiken fürRöntgenstrahlen. Ann. Physik 10, 94–114 (1952).
[45] D. L. Windt, IMD - Software for modeling the optical properties of multilayerfilms. Comput. Phys. 12, 360–370 (1998).
[46] www.cxro.lbl.gov/multilayer/survey.html, Electronic Citation, (2007).
[47] www.cxro.lbl.gov/optical_constants/, Electronic Citation, (2007).
[48] N. N. Salashchenko and E. A. Shamov, Short-period X-ray multilayers basedon Cr/Sc. Opt. Commun. 134, 7–10 (1997).
[49] S. A. Yulin et al., High-performance Cr/Sc multilayers for the soft x-rayrange. Proc. SPIE 5193, 172–176 (2004).
[50] E. M. Gullikson et al., Progress in short period multilayer coatings for waterwindow applications, In The 8th International Conference on The Physics ofX-Ray Multilayers Structures March (2006).
[51] E. Hecht, Optics. Addison-Wesley, Massachusetts, (1987).
[52] T. Wilhein et al., A slit grating spectrograph for quantitative soft X-ray spec-troscopy. Rev. Sci. Instrum. 70, 1694–1699 (1999).
[53] J. Kirz, Phase zone plates for X-rays and the extreme UV. J. Opt. Soc. Am.64, 301–309 (1974).
[54] H. W. Schnopper et al., Diffraction grating transmission efficiencies for XUVand soft X-rays [for astronomical grating spectrometer]. Appl. Opt. 16, 1088–1091 (1977).
[55] D. T. Attwood, Soft X-Rays and Extreme Ultraviolet Radiation, book chap-ter 9, 337–394, Cambridge University Press, New York (1999).
[56] M. Young, Zone plates and their aberrations. J. Opt. Soc. Am. 62, 972–976(1972).
[57] Y. Vladimirsky and H. W. P. Koops, Moire method and zone plate patterninaccuracies. J. Vac. Sci. Technol. B 6, 2142–2146 (1988).
55
[58] W. Chao et al., Soft X-ray microscopy at a spatial resolution better than 15nm. Nature 435, 1210–1213 (2005).
[59] A. Holmberg, S. Rehbein, and H. M. Hertz, Nano-fabrication of condenserand micro-zone plates for compact X-ray microscopy. Microelectron. Eng.73-74, 639–643 (2004).
[60] J. W. Goodman, Holography, book chapter 9, 355–367, McGraw-Hill, 3rd
edition (2005).
[61] P. Goby, A New application of the X-rays: Microradiography. J. Roy. Microsc.Soc. 4, 373–375 (1913).
[62] A. H. Compton, Total reflection of X-rays. Philos. Mag. 45, 1121–1131(1923).
[63] L. Reimer, Transmission electron microscopy : physics of image formationand microanalysis, Springer series in optical sciences. Springer, 4th edition,(1997).
[64] D. Sayre et al., Transmission Microscopy of Unmodified Biological-Materials -Comparative Radiation Dosages with Electrons and Ultrasoft X-Ray Photons.Ultramicroscopy 2, 337–349 (1977).
[65] G. Schmahl et al., Phase contrast X-ray microscopy studies. Optik 97, 181–182 (1994).
[66] R. D. Allen, G. B. David, and G. Nomarski, The Zeiss-Nomarski differentialinterference equipment for transmitted-light microscopy. Zeitschrift fur Wis-senschaftliche Mikroskopie und Mikroskopische Technik 69, 193–222 (1969).
[67] T. Wilhein et al., Differential interference contrast X-ray microscopy withsubmicron resolution. Appl. Phys. Lett. 78, 2082–2084 (2001).
[68] D. Sayre et al., Potential Operating Region for Ultrasoft X-Ray Microscopyof Biological-Materials. Science 196, 1339–1340 (1977).
[69] G. Schneider, Cryo X-ray microscopy with high spatial resolution in amplitudeand phase contrast. Ultramicroscopy 75, 85–104 (1998).
[70] S. Williams et al., Measurements of Wet Metaphase Chromosomes in theScanning-Transmission X-Ray Microscope. J. Microsc. 170, 155–165 (1993).
[71] B. Niemann, D. Rudolph, and G. Schmahl, Soft X-ray imaging zone plateswith large zone numbers for microscopic and spectroscopic applications. Opt.Commun. 12, 160–163 (1974).
56 BIBLIOGRAPHY
[72] G. Schmahl et al., X-Ray Microscopy Studies. Optik 93, 95–102 (1993).
[73] P. Guttmann et al., Instrumentation advances with the new X-ray microscopesat BESSY II. Nucl. Instrum. Methods Phys. Res. A 467, 849–852 (2001).
[74] P. Guttmann et al., The transmission X-ray microscope at BESSY II, In:J. Susini, D. Joyeux, and F Polack (eds.), Journal De Physique. IV : JP,volume 104, EDP Sciences, Grenoble, France, 85–90 (2003).
[75] H. Rarback et al., Scanning X-ray microscope with 75-nm resolution. Rev.Sci. Instrum. 59, 52–59 (1988).
[76] C. Jacobsen et al., Diffraction-Limited Imaging in A Scanning-TransmissionX-Ray Microscope. Opt. Commun. 86, 351–364 (1991).
[77] C. Jacobsen, J. Kirz, and S. Williams, Resolution in Soft-X-Ray Microscopes.Ultramicroscopy 47, 55–79 (1992).
[78] X. Zhang et al., Micro-Xanes - Chemical Contrast in the Scanning-Transmission X-Ray Microscope. Nucl. Instrum. Methods Phys. Res. A 347,431–435 (1994).
[79] G. Schmahl and D. Rudolph (eds.), X-ray microscopy, Springer series inoptical sciences. Springer, Berlin, (1984).
[80] D. Sayre, M. Howells, J. Kirz, and H. Rarback (eds.), X-ray microscopy II,Springer series in optical sciences. Springer-Verlag, Berlin, (1988).
[81] A. G. Michette, G. Morrison, and C. Buckley (eds.), X-ray microscopy III,Springer series in optical sciences. Springer, Berlin, (1992).
[82] V. V. Aristov and A. I. Erko (eds.), X-Ray Microscopy IV. BogorodskiiPechatnik, Chernogolovka, Russia, (1994).
[83] J. Thieme, G. Schmahl, D. Rudolph, and E. Umbach (eds.), X-Ray Mi-croscopy and Spectromicroscopy. Springer-Verlag, (1998).
[84] W. Meyer-Ilse, T. Warwick, and D. Attwood (eds.), X-ray microscopy. AIP,New York, (2000).
[85] J. Susini, D. Joyeux, and F Polack (eds.), X-ray microscopy. EDP sciences,Paris, (2003).
[86] S. Aoki, Y Kagoshima, and Y. Suzuki (eds.), X-ray microscopy, volume 7 ofIPAP Conference Series. The Institute of Pure and Applied Physics, Tokyo,Japan, (2006).
57
[87] S. Nakayama et al., Zone-Plate X-Ray Microscope Using A Laser-PlasmaSource. Jpn. J. Appl. Phys. , Part 2 33, L1280–L1282 (1994).
[88] H. Aritome et al., An imaging zone plate X-ray microscope using a laserplasma source, In: W. Meyer-Ilse, T. Warwick, and D. Attwood (eds.), AIPConf. Proc. (USA), AIP, Osaka Univ., Japan, 401–404 (2000).
[89] D. Rudolph et al., Wet specimen imaging with an x-ray microscope witha pulsed plasma source, In: V. V. Aristov and A. I. Erko (eds.), X-RayMicroscopy IV, Bogorodskii Pechatnik, Moscow, 381–386 (1994).
[90] M. Berglund et al., Compact water-window transmission X-ray microscopy.J. Microsc. 197, 268–273 (2000).
[91] G. A. Johansson et al., Design and performance of a laser-plasma-basedcompact soft X-ray microscope. Rev. Sci. Instrum. 73, 1193–1197 (2002).
[92] L. Rymell and H. M. Hertz, Debris elimination in a droplet-target laser-plasma soft X-ray source. Rev. Sci. Instrum. 66, 4916–4920 (1995).
[93] M. Hoshino and S. Aoki, Laser plasma soft x-ray microscope with Woltermirrors for observation of biological specimens in air. Jpn. J. Appl. Phys. 45,989–994 (2006).
[94] Woo K. Kyong et al., Compact soft x-ray transmission microscopy with sub-50nm spatial resolution. Phys. Med. Biol. 51, 99–107 (2006).
[95] A. G. Michette et al., Progress with the King’s College laboratory scanningx-ray microscope, In J. Phys. IV, Proc. (France), volume 104, EDP Sciences,King’s Coll., London, 123–126 (2003).
[96] O. Hemberg et al., Stability of droplet-target laser-plasma soft X-ray sources.J. Appl. Phys. 88, 5421–5425 (2000).
[97] J. de Groot et al., Target optimization of a water-window liquid-jet laser-plasma source. J. Appl. Phys. 94, 3717–3721 (2003).
[98] T. Wilhein et al., Off-axis reflection zone plate for quantitative soft X-raysource characterization. Appl. Phys. Lett. 71, 190–192 (1997).
[99] M. Berglund et al., Cryogenic liquid-jet target for debris-free laser-plasmasoft x-ray generation. Rev. Sci. Instrum. 69, 2361–2364 (1998).
[100] H. M. Hertz et al., Normal-incidence condenser mirror arrangement for com-pact water-window X-ray microscopy. Proc. SPIE 3766, 247–251 (1999).
58 BIBLIOGRAPHY
[101] A. P. Hitchcock et al., Soft X-ray spectromicroscopy of biological and syntheticpolymer systems. J. Electron. Spectrosc. Relat. Phenom. 144-147, 259–269(2005).
[102] U. Neuhausler et al., Soft X-ray spectromicroscopy on solid-stabilized emul-sions. Colloid. Polym. Sci. 277, 719–726 (1999).
[103] A. Holmberg et al., Nickel zone plates for compact soft x-ray microscopy,In: S. Aoki, Y Kagoshima, and Y. Suzuki (eds.), IPAP Conference Series 7:X-ray microscopy, The Institute of Pure and Applied Physics, Tokyo, Japan,124–126 (2006).
[104] J. W. Goodman, Effects of partial coherence on imaging systems, book chap-ter 7, 286–360, Wiley (1985).
[105] T. Wilhein et al., Thinned, back illuminated CCDs for x-ray microscopy,In: V. V. Aristov and A. I. Erko (eds.), X-Ray Microscopy IV, BogorodskiiPechatnik, 470–474 (1994).
[106] J. Maser et al., Soft X-ray microscopy with a cryo scanning transmissionX-ray microscope: I. Instrumentation, imaging and spectroscopy. J. Microsc.197, 68–79 (2000).
[107] Carolyn A. Larabell and Mark A. Le Gros, X-ray Tomography Generates 3-DReconstructions of the Yeast, Saccharomyces cerevisiae, at 60-nm Resolution.Mol. Biol. Cell 15, 957–962 (2004).
[108] U. Vogt et al., Influence of laser intensity and pulse duration on the extremeultraviolet yield from a water jet target laser plasma. Appl. Phys. Lett. 79,2336–2338 (2001).
[109] E. Di Fabrizio et al., Diffractive optical elements for differential interferencecontrast x-ray microscopy. Opt. Express 11, 2278–2288 (2003).
[110] B. Alberts, Molecular biology of the cell. Garland Publishing, New York, 4th
edition, (2002).
[111] W. P. Faulk and G. M. Taylor, An immunocolloid method for the electronmicroscope. Immunochemistry 8, 1081–1083 (1971).
[112] J. Roth, The colloidal gold marker system for light and electron microscopiccytochemistry, In Techniques in Immunochemistry, volume 2, Academic Press,217–284 (1983).
59
[113] J. Roth, The silver anniversary of gold: 25 years of the colloidal gold markersystem for immunocytochemistry and Histochemistry. Histochem. Cell Biol.106, 1–8 (1996).
[114] J. Roth and M. Binder, Colloidal gold, ferritin and peroxidase as markersfor electron microscopic double labeling lectin techniques. J. Histochem. Cy-tochem. 26, 163–169 (1978).
[115] G. Danscher and J. O. R. Norgaard, Light Microscopic Visualization of Col-loidal Gold on Resin-Embedded Tissue. J. Histochem. Cytochem. 31, 1394–1398 (1983).
[116] C. S. Holgate et al., Immunogold Silver Staining - New Method of Immunos-taining with Enhanced Sensitivity. J. Histochem. Cytochem. 31, 938–944(1983).
[117] S. H. Jia et al., Soft x-ray images of immunogold labelling of tumor cell surfaceantigens, In X-Ray Microscopy III, Springer-Verlag, 413–416 (1992).
[118] L. B. Da Silva et al., X-Ray Laser Microscopy of Rat Sperm Nuclei. Science258, 269–271 (1992).
[119] S. Vogt et al., X-ray microscopic studies of the Drosophila dosage compensa-tion complex. J. Struct. Biol. 132, 123–132 (2000).
[120] W. Meyer-Ilse et al., High resolution protein localization using soft X-raymicroscopy. J. Microsc. 201, 395–403 (2001).
[121] H. N. Chapman, C. Jacobsen, and S. Williams, A characterisation of dark-field imaging of colloidal gold labels in a scanning transmission X-ray micro-scope. Ultramicroscopy 62, 191–213 (1996).
[122] H. N. Chapman et al., Dark-Field X-Ray Microscopy of Immunogold-LabeledCells. Microsc. Microanal. 2, 53–62 (1996).
[123] G. Schneider et al., Computed tomography of cryogenic cells. Surf. Rev. Lett.9, 177–183 (2002).


![IS 11899 (1986): Flyers for Jute Spinning Frames · IS 11899 (1986): Flyers for Jute Spinning Frames [TXD 14: Machinery for Fabric Manufacture] Title: IS 11899 (1986): Flyers for](https://img.pdfslide.net/doc/110x75/601d1f71b566054ba5627b82/is-11899-1986-flyers-for-jute-spinning-frames-is-11899-1986-flyers-for-jute.jpg)