Embed Size (px)
Citation preview

Ambit Capital and / or its affiliates do and seek to do business including investment banking with companies covered in its research reports. As a result, investors should be aware that Ambit Capital may have a conflict of interest that could affect the objectivity of this report. Investors should not consider this report as the only factor in making their investment decision.
It’s getting better
We turn BUYers. Whilst BJE’s consumer franchise is relatively weak (losing market share across categories), we believe there is value. Supply chain is now getting stable (TOC now covers 35% of sales), hence this should lead to improvement in Range (more SKUs), Reach (more retailers) and Replenishment (more availability); we expect growth/EBITDA margin to recover in FY17. Despite the exit of E&P segment president (HOD), profitability should sustain given improved processes—apt site selection (close to centralized warehouses), stringent project monitoring and rational bidding (NIL YTD losses). Our implied target multiple of 19.8x for the consumer business implies 39%/28% discount to Havells/V-Guard’s multiple; further upgrade is subject to sustained double-digit margin, product portfolio upgrades and E&P business scale-down.
Competitive position: MODERATE Changes to this position: NEUTRAL Consumer durables—set to change course for better in FY17 TOC rollout led to channel inventory rationalization as distributors were instructed to restrict inventory across SKUs to 1.5 months vs no limit earlier; this impacted BJE’s primary sales. TOC is now rolled out in 35% of the sales area and the impact of inventory rationalization is already visible in ~60% of the area. As distributors in non-TOC adopted areas also start rationalizing inventory in anticipation of TOC rollout, we expect primary sales to pick up from FY17 to 11%. TOC stabilizing to aid 120bps margin expansion over FY16-FY18 Large distributors in TOC covered areas and consultants implementing TOC indicate product availability has improved significantly with timely replenishment within 1 week. Number of SKUs across categories has increased materially and price discounting has stopped (aids margins) as wholesalers who earlier pushed 2/3 SKUs for trade discounts are now dumped. E&P business to remain profitable despite loss of HOD BJE has become selective in site selection (order intake down 39% YoY); working only on 40 sites vs 100 in FY15. In power distribution, the strategy is to take orders only in Bihar and Madhya Pradesh given central warehouses there which ensure timely inventory replenishment. Monitoring of sites is now on a weekly basis; further, 25% of the backlog is running ahead of schedule.
What can lead to material upgrades? Successful implementation of TOC has led to significant expansion in margins for many companies (see Britannia case study inside). If BJE is able to replicate this; it will lead to material upgrades in TP (sensitivity inside). Exit from E&P is another catalyst, as it will deleverage the balance sheet; presently BJE’s interest cost is `1bn; equivalent to 45% of FY16 EBIT. Key risk remains incompetent management behavior, E&P slipping into losses and further pain under ToC.
COMPANY INSIGHT BJE IN EQUITY February 24, 2016
Bajaj ElectricalsBUY
Light Electricals
Recommendation Mcap (bn/mn): `17/US$252 6M ADV (mn): `45/US$0.7 CMP: `167 TP (12 mths): `229 Upside (%): 37
Flags Accounting: AMBER Predictability: RED Earnings Momentum: AMBER
Catalyst
Improvement in consumer business’ EBITDA margin by 120bps over FY16-18
Sustained profitability in E&P
Performance (%)
Source: Bloomberg, Ambit Capital Research
70
90
110
130
150
Feb-
15
Mar
-15
Apr
-15
May
-15
Jun-
15
Jul-
15
Au
g-1
5
Sep-
15
Oct
-15
Nov
-15
Dec
-15
Jan-
16
Sensex Bajaj
Analyst Details
Bhargav Buddhadev +91 3043 3252
Deepesh Agarwal, CFA
+91 3043 3275
Key financials YE March (` mn) FY14 FY15 FY16E FY17E FY18E Operating income 40,298 42,581 47,329 52,789 59,117 EBITDA 818 890 2,646 3,231 3,705 Net profit - 53 - 139 999 1,459 1,769
EPS (`) - 0.5 - 1.4 9.9 14.5 17.6 RoE (%) (0.7) (2.0) 13.8 17.9 18.9 RoCE (%) 5.2 3.8 14.2 16.5 17.9 P/E (x) NA NA 16.9 11.5 9.5 P/BV (x) 2.4 2.4 2.2 1.9 1.7
Source: Company, Ambit Capital research

Bajaj Electricals
February 24, 2016 Ambit Capital Pvt. Ltd. Page 2
BJE’s stock price has underperformed YTD BJE’s stock price has declined by 20% YTD, underperforming peers and the BSE Mid cap index by 14% and 30% respectively; hence the stock has de-rated to 11.2x FY17E P/E; vs ~15x a year ago. This should be considered in light of only 15%/12% downgrade to FY16/FY17 earnings in the past nine months.
Exhibit 1: BJE has underperformed BSE Midcap index and peers in the past one year
Source: Bloomberg, Ambit Capital research
The de-rating of the stock may have been led by three reasons: Attrition in senior management resulting in stagnation of consumer
franchise: After the exit of Mr Ramakrishnan in 2012, BJE’s consumer business’ franchise has stagnated due to multiple senior management exits (see exhibit 3 for more details). Consequently, BJE has lost market share across several products such as appliances (only Philips + Preethi grew slower than BJE), lighting (only Philips grew slower than BJE) and fans (BJE’s growth has been lowest amongst top four players) over the last three years. Furthermore, BJE has not been able to launch any new categories, the growth driver for most peers.
Exhibit 2: BJE’s stagnating consumer franchise
FY15 market share (%)
Revenue CAGR over FY12-15 (%)
Fans
Crompton 24.6% 17.5%
Orient 15.2% 11.2%
Havells 13.0% 11.0%
BJE 11.0% 6.5%
Appliances
BJE 15.2% 12.5%
Philips + Preethi 14.0% 0.2%
Crompton 2.2% 18.4%
Havells 2.7% 392.4%
V-Guard 3.1% 30.9%
Lighting
Philips 20.7% 2.4%
Surya 7.0% 14.3%
Crompton 6.0% 13.8%
BJE 5.5% 6.5%
Havells 4.5% 10.2%
Source: Company, Industry, Ambit Capital research
Exhibit 3: Several senior management exits
Year of exit Employee Last designation
FY14 L.K.Mehta Executive Director, B2B business
FY14 A.S.Radhakrishna President, Fans
FY14 Vivek Sharma EVP, Morphy Richard
FY14 Aloke Kumar Dube EVP, Special projects
FY14 B.M Mane GM, Works
FY14 A.R.Sreedhar VP, Branch Support
FY15 P.S.Tandon Consumer business head
FY15 C.G.S.Mani Executive president, Fans /lighting
FY15 Sandeep Sharma EVP, Export & Import
FY15 Rohit Kumar VP, Lighting
FY15 Jayant Deshmukh VP, Operations
FY16 Karunakar Hari Mowar VP, Morphy Richard
FY16 Rakesh Markhedkar President, E&P
FY16 Amit Kaushik Head ToC, Morphy Richard
Source: Company, LinkedIn, Ambit Capital research
70 80 90
100 110 120 130 140 150
Feb-
15M
ar-1
5M
ar-1
5M
ar-1
5A
pr-1
5A
pr-1
5M
ay-1
5M
ay-1
5Ju
n-1
5Ju
n-1
5Ju
l-15
Jul-
15A
ug-1
5A
ug-1
5Se
p-1
5Se
p-1
5Se
p-1
5O
ct-1
5O
ct-1
5N
ov-1
5N
ov-1
5D
ec-1
5D
ec-1
5Ja
n-16
Jan-
16Fe
b-16
Havells Bajaj V-Guard TTK Prestige BSE Midcap
Attrition in senior management led to BJE losing market share in appliances and fans
Bajaj Electricals
February 24, 2016 Ambit Capital Pvt. Ltd. Page 3
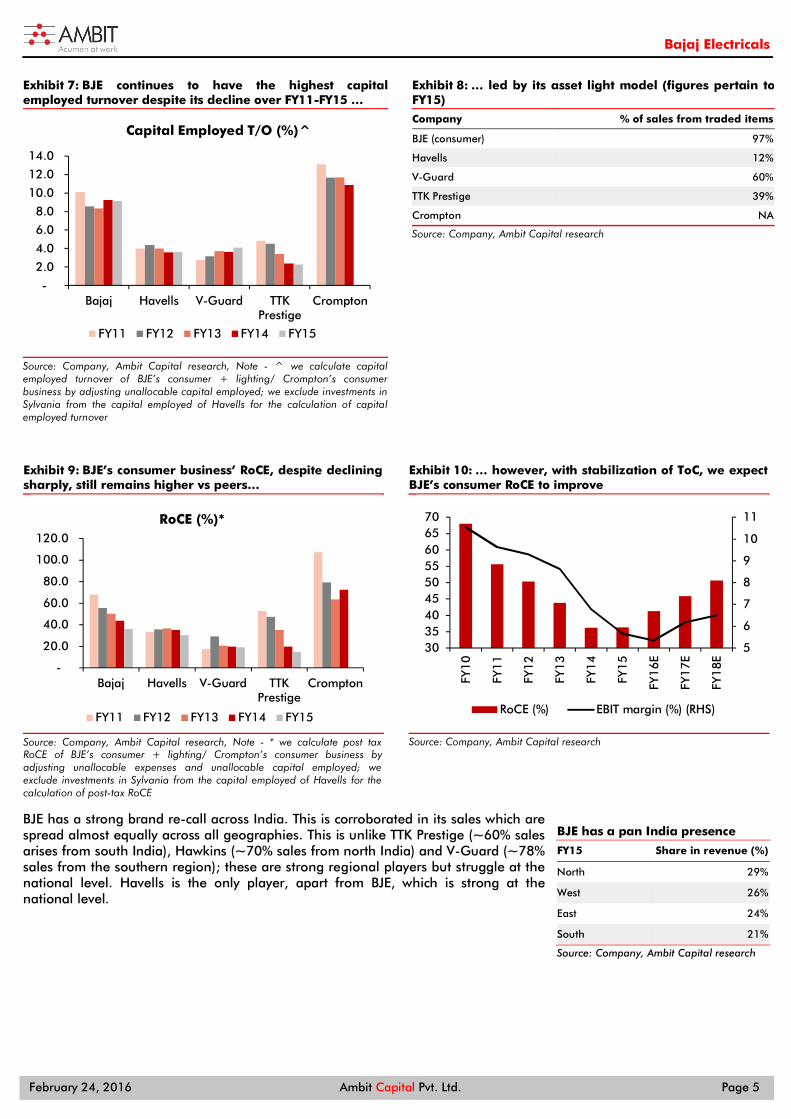
Poor implementation of TOC led to market share loss: In early CY14, BJE had resorted to a new distribution strategy (Theory of Constraints, TOC). Under this strategy, a first in the light electrical industry, BJE decided not to dump its products to distributors at the month-end in order to protect its gross margin. BJE also started monitoring secondary market demand by asking each distributor to appoint a BJE-specific salesperson.
Whilst ToC is a good marketing concept with companies such as Britannia, Pidilite, Relaxo having witnessed improvement in operating performance and profitability post the successful implementation of ToC, the chaotic implementation of ToC led to BJE losing market share.
Three reasons for BJE’s market share loss under ToC were: (a) fast pace of implementation; implemented in BJE’s key markets to start with and that too in one go; (b) intolerant approach to the sceptics of ToC (both employees and channel partners) leading to increase in channel friction and higher employee attrition; and (c) sudden weakening of the distribution network through mass dis-empanelment of wholesalers.
The implementation of ToC would not have been painful, had it been implemented in a graded manner, rather than rolling it out in one go in areas which accounted for one-thirds of the revenues. Also, BJE did not focus on improving its “PULL” factor by increasing its customer-connect through quality scale-up in the advertisement and ramp-up in the product portfolio before launching the TOC.
Exhibit 4: TOC has been successfully implemented by several companies across sectors
Sector Company
Consumer Goods & Retail Pidilite, Liberty, Raymond, VIP Industries, Westside, Himatsingka, Britannia, Relaxo, Trent
Equipment manufacturing Crompton Greaves, Godrej Security, L&T, Kirloskar Oil Engines, ABB
Engineering & Construction Trident Group, TRF, Rallis, Shriram EPC, Tata Metaliks
Automobiles Tata Motors, Eicher Motors, Escorts, Mahindra First Choice
Source: Company, Industry, Ambit Capital research
Recurrence of E&P losses given recent resignation of the president of E&P business, Mr Rakesh Markhedkar: As per the LinkedIn website (https://goo.gl/5gF7JV), Mr Rakesh Markhedkar who was instrumental in turning around BJE’s loss making E&P business (see pages 11-14 of our note titled ‘E&P turnaround on the cards’ dated 24 January 2014), left BJE in November 2015. He is now the MD of Vikran Engineering & Exim which conducts turnkey projects in power T&D (similar to BJE’s E&P business). Rakesh’s resignation is a loss to BJE given a lot of credit goes to him for turning around BJE’s ailing E&P business. Previously, he was instrumental in turning around EMCO and KEI Industries’ E&P businesses during the period Aug ’05 to Feb ’10 and Mar ’10 to Jul ’11 respectively. Key initiatives adopted by Rakesh at BJE were: (a) implemented strict monitoring processes whereby execution at all the sites is monitored on a weekly basis by preparing detailed MIS reports; (b) created centralized warehouses and selected only those sites which were within a radius of ~150km from these central warehouses; (c) linked incentives to performance so as to make the top project management team accountable for their actions; and (d) involved the Finance department in the bidding and project execution stage to ensure rational bidding.
Chaotic implementation of TOC, intolerant approach to skeptics of TOC and mass dis-empanelment of wholesalers led to BJE losing market share
TOC would have been much better for BJE had it been rolled out in a graded manner alongside emphasizing on the “PULL” factor
Key initiatives to turnaround E&P were (a) strict monitoring of sites; (b) selective approach to sites; (c) linking incentives to performance and (d) involving finance team in bidding

Bajaj Electricals
February 24, 2016 Ambit Capital Pvt. Ltd. Page 4
BJE still remains a strong brand 75 year old brand; top 3 player across all categories BJE’s brand is a trusted brand especially amidst the masses. In FY15 it completed 75 years of existence and it has the largest number of distributors which reach out to 400,000 retailers. Despite the recent loss of market share, BJE continues to enjoy strong positioning across product categories. Within domestic appliances, which is its main bread and butter business, it continues to remain the market leader; in mixers, grinders and irons it continues to remain India’s leading player. Alongside appliances, BJE is ranked fourth in fans and lighting.
Exhibit 5: BJE has India’s largest number of distributors reaching out to 400,000 retailers
BJE Havells V-Guard Finolex Polycab RR Kabel Crompton Gandhimathi
Butterfly Orient Electric
Exclusive stores 103 BJE World Stores
210 Havells Galaxy stores
30 C& F agents
NA 3 stores
Distributors 1,000 NA 470 150 650 4,000 300
Dealers 4,000 2,500 3,000 4,500 5,000
NA 3,500
Retailers 400,000 100,000 15,000 45,000 7,000 NA 100,000
Source: Company, Industry, Ambit Capital research
Exhibit 6: BJE is India’s no.1 appliance company and amongst top 4 players in fans and lighting
Ranking Company FY15 market share (%)
Appliances
1 BJE 15.2%
2 Philips 10.1%
3 Preethi 3.9%
4 V-Guard 3.1%
5 Havells 2.7%
6 Crompton 2.2%
Fans
1 Crompton 24.6%
2 Orient 15.2%
3 Havells 13.0%
4 BJE 11.0%
Lighting
1 Philips 20.7%
2 Surya 7.0%
3 Crompton 6.0%
4 BJE 5.5%
5 Havells 4.5%
Source: Company, Industry, Ambit Capital research
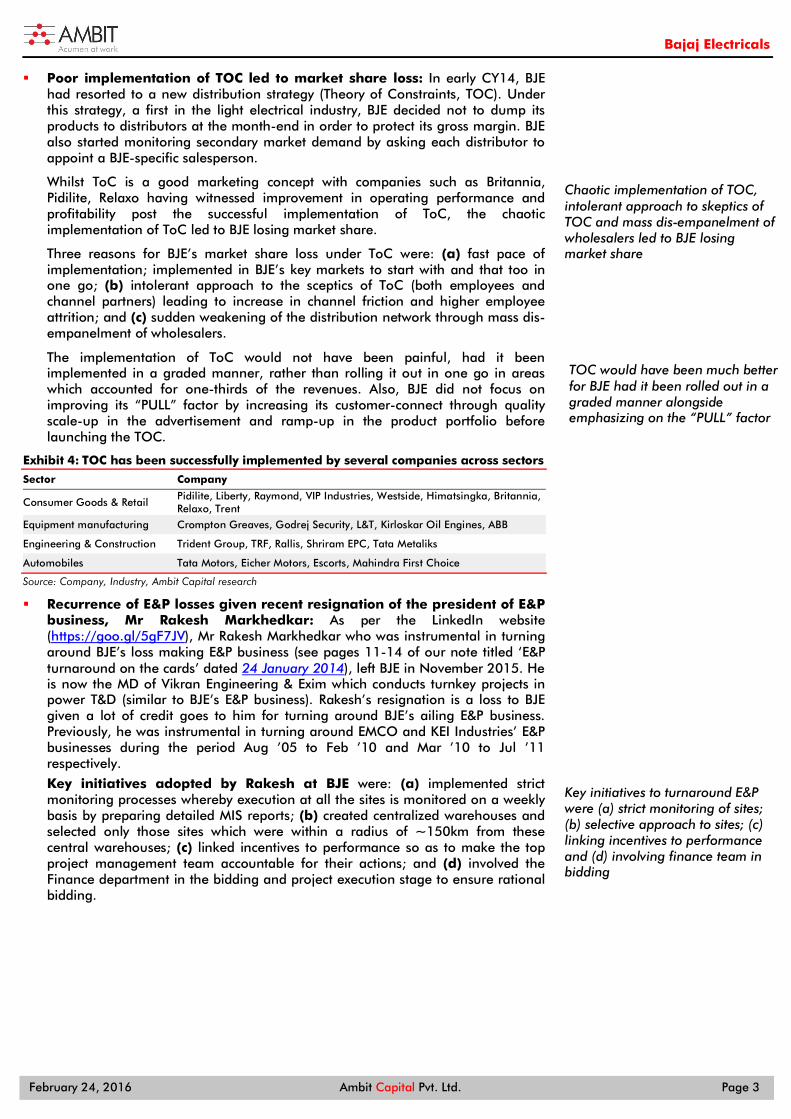
RoCE to improve led by TOC implementation Being a pioneer in import of small appliances from China (97% of products are outsourced), BJE enjoyed strong capital employed turnover of 9.1x in the consumer business over FY11-FY15 vs peer average of 4.0x. This has been the reason for the consumer business’ strong RoCE (post-tax) of 51% over FY11-FY15 vs peer’s median RoCE of 33.5%. Though BJE’s RoCE has been declining from 68% in FY11 to 36% in FY15 due to contraction in EBIT margin of the consumer business from 10.5% in FY11 to 5.7% in FY15; with the stabilization of ToC, we expect this declining trend to reverse; we model RoCE to improve to 46%/51% in FY17/FY18 vs 36%/45% in FY15/FY16.
BJE is no.1 in appliances and top 4 in fans and lighting
We expect ROCE of consumer business to improve to 46/51% in FY17/18 vs 36%/45% in FY15/16
Bajaj Electricals
February 24, 2016 Ambit Capital Pvt. Ltd. Page 5
Exhibit 7: BJE continues to have the highest capitalemployed turnover despite its decline over FY11-FY15 …
Source: Company, Ambit Capital research, Note - ^ we calculate capital employed turnover of BJE’s consumer + lighting/ Crompton’s consumer business by adjusting unallocable capital employed; we exclude investments in Sylvania from the capital employed of Havells for the calculation of capital employed turnover
Exhibit 8: … led by its asset light model (figures pertain to FY15)
Company % of sales from traded items
BJE (consumer) 97%
Havells 12%
V-Guard 60%
TTK Prestige 39%
Crompton NA
Source: Company, Ambit Capital research
Exhibit 9: BJE’s consumer business’ RoCE, despite declining sharply, still remains higher vs peers…
Source: Company, Ambit Capital research, Note - * we calculate post tax RoCE of BJE’s consumer + lighting/ Crompton’s consumer business by adjusting unallocable expenses and unallocable capital employed; we exclude investments in Sylvania from the capital employed of Havells for the calculation of post-tax RoCE
Exhibit 10: … however, with stabilization of ToC, we expect BJE’s consumer RoCE to improve
Source: Company, Ambit Capital research
BJE has a strong brand re-call across India. This is corroborated in its sales which are spread almost equally across all geographies. This is unlike TTK Prestige (~60% sales arises from south India), Hawkins (~70% sales from north India) and V-Guard (~78% sales from the southern region); these are strong regional players but struggle at the national level. Havells is the only player, apart from BJE, which is strong at the national level.
-
2.0
4.0
6.0
8.0
10.0
12.0
14.0
Bajaj Havells V-Guard TTKPrestige
Crompton
FY11 FY12 FY13 FY14 FY15
Capital Employed T/O (%)^
-
20.0
40.0
60.0
80.0
100.0
120.0
Bajaj Havells V-Guard TTKPrestige
Crompton
FY11 FY12 FY13 FY14 FY15
RoCE (%)*
5
6
7
8
9
10
11
303540455055606570
FY1
0
FY1
1
FY1
2
FY1
3
FY1
4
FY1
5
FY1
6E
FY1
7E
FY1
8ERoCE (%) EBIT margin (%) (RHS)
BJE has a pan India presence
FY15 Share in revenue (%)
North 29%
West 26%
East 24%
South 21%
Source: Company, Ambit Capital research
Bajaj Electricals
February 24, 2016 Ambit Capital Pvt. Ltd. Page 6
EBITDA margin to improve over FY16-FY18 Gross margin improvement sustainable Our discussion with channel partners suggests that BJE has introduced a uniform pricing policy in 35% of their customer base despite TOC being rolled out in 20% of the area since April 2015. We have confirmed this by speaking to distributors and ex-senior employees. As price rationalization is forced in the non-TOC areas, the gross margin should improve further; over and above the 200bps/40bps YoY expansion already having taken place in lighting/consumer durables YTD to 22.7%/27.8%.
Exhibit 11: Lighting/consumer durables segment has seen gross margin expansion Product 3QFY16 3QFY15 YoY
Lighting 22.7% 20.7% 200bps
Consumer durables 27.8% 27.4% 40bps
EPC (EBIT margin) 6.9% -26.2% 3,310bps
Source: Company, Ambit Capital research
Primary sales to pick up with inventory rationalization BJE has lagged peers on revenue growth so far in FY16, led by implementation of TOC, which again has led to discontinuation of dumping. Under TOC, distributors have been instructed to rationalize inventories to ~1.5 months vs the earlier levels of 3 months; the rationale being to improve the distributors’ RoI. Whilst TOC has been implemented only in 35% of its customer base;, the inventory rationalization has taken place in ~60% of the area given that wholesalers in areas where TOC has not been implemented have already started reducing inventory in anticipation of TOC being rolled out. As TOC stabilizes in FY17, we expect primary sales and revenue growth to pick up to 12% in consumer durables vs 1% in FY16E. For lighting we expect moderation in revenue growth to 10% in FY17E from 22% in FY16E as we are not building in the sales under EESL orders.
Exhibit 12: BJE has lagged peers on revenue growth so far in FY16… Revenue growth (%) FY15 9MFY16
BJE consumer 1% 5%
Havells standalone 11% 2%
Crompton Consumer 13% 11%
Surya Roshni 7% 26%
TTK Prestige 7% 10%
Source: Company, Ambit Capital research
Exhibit 13: …however, secondary 9M revenue growth (YoY) for lighting/consumer durables has been strong at 26%/10% 9MFY16 revenue growth (%)
Primary market Secondary market
Lighting 21% 26%
Lighting (excluding for EESL sales)
10% 15%
Consumer -1% 10%
Source: Company, Ambit Capital research
Operating leverage to boost EBITDA margin from FY17 Despite gross margin improvement in 9MFY16; BJE reported 180bps decline in EBIT margins in consumer durables. This is because volume growth got impacted in 9MFY16, which led to under recovery of the fixed cost. With volume growth expected to pick up from FY17 onwards (as explained above) we expect gross margin expansion to flow into the EBITDA margin.
Exhibit 14: EBIT margin for BJE’s consumer durables business in 9MFY16 was at a 13-year low despite 60bps YoY improvement in gross margin …
Particulars 9MFY16
3QFY16
Margin (%) YoY change
Margin (%) YoY change
Gross Margin (%)
Lighting NA* 250bps
22.7% 200bps Consumer durables NA* 60bps
27.8% 40bps
EBIT margin (%)
Lighting 5.9% 280bps
7.1% 250bps Consumer durables 4.7% -180bps
5.0% -170bps
Source: Company, Ambit Capital research, Note - * Not available
BJE has implemented a uniform pricing in 35% of its sales area despite TOC covering only 20% of the geographical area
Primary sales should pick up in FY17 given inventory rationalization has already taken place in 60% of the area as distributors in non-TOC areas have also started rationalizing inventory
Bajaj Electricals
February 24, 2016 Ambit Capital Pvt. Ltd. Page 7
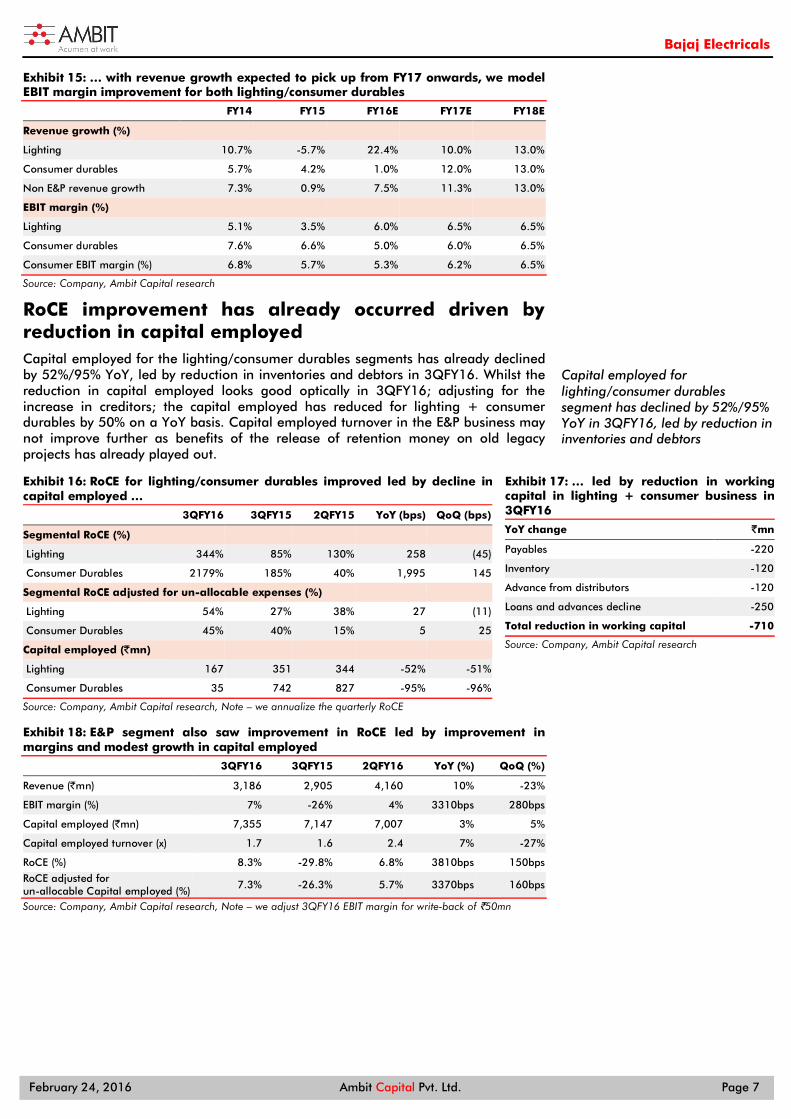
Exhibit 15: … with revenue growth expected to pick up from FY17 onwards, we model EBIT margin improvement for both lighting/consumer durables
FY14 FY15 FY16E FY17E FY18E
Revenue growth (%)
Lighting 10.7% -5.7% 22.4% 10.0% 13.0%
Consumer durables 5.7% 4.2% 1.0% 12.0% 13.0%
Non E&P revenue growth 7.3% 0.9% 7.5% 11.3% 13.0%
EBIT margin (%)
Lighting 5.1% 3.5% 6.0% 6.5% 6.5%
Consumer durables 7.6% 6.6% 5.0% 6.0% 6.5%
Consumer EBIT margin (%) 6.8% 5.7% 5.3% 6.2% 6.5%
Source: Company, Ambit Capital research
RoCE improvement has already occurred driven by reduction in capital employed Capital employed for the lighting/consumer durables segments has already declined by 52%/95% YoY, led by reduction in inventories and debtors in 3QFY16. Whilst the reduction in capital employed looks good optically in 3QFY16; adjusting for the increase in creditors; the capital employed has reduced for lighting + consumer durables by 50% on a YoY basis. Capital employed turnover in the E&P business may not improve further as benefits of the release of retention money on old legacy projects has already played out.
Exhibit 16: RoCE for lighting/consumer durables improved led by decline in capital employed …
3QFY16 3QFY15 2QFY15 YoY (bps) QoQ (bps)
Segmental RoCE (%)
Lighting 344% 85% 130% 258 (45)
Consumer Durables 2179% 185% 40% 1,995 145
Segmental RoCE adjusted for un-allocable expenses (%)
Lighting 54% 27% 38% 27 (11)
Consumer Durables 45% 40% 15% 5 25
Capital employed (`mn)
Lighting 167 351 344 -52% -51%
Consumer Durables 35 742 827 -95% -96%
Source: Company, Ambit Capital research, Note – we annualize the quarterly RoCE
Exhibit 17: … led by reduction in working capital in lighting + consumer business in 3QFY16
YoY change `mn
Payables -220
Inventory -120
Advance from distributors -120
Loans and advances decline -250
Total reduction in working capital -710
Source: Company, Ambit Capital research
Exhibit 18: E&P segment also saw improvement in RoCE led by improvement in margins and modest growth in capital employed
3QFY16 3QFY15 2QFY16 YoY (%) QoQ (%)
Revenue (`mn) 3,186 2,905 4,160 10% -23%
EBIT margin (%) 7% -26% 4% 3310bps 280bps
Capital employed (`mn) 7,355 7,147 7,007 3% 5%
Capital employed turnover (x) 1.7 1.6 2.4 7% -27%
RoCE (%) 8.3% -29.8% 6.8% 3810bps 150bps
RoCE adjusted for un-allocable Capital employed (%)
7.3% -26.3% 5.7% 3370bps 160bps
Source: Company, Ambit Capital research, Note – we adjust 3QFY16 EBIT margin for write-back of `50mn
Capital employed for lighting/consumer durables segment has declined by 52%/95% YoY in 3QFY16, led by reduction in inventories and debtors

Bajaj Electricals
February 24, 2016 Ambit Capital Pvt. Ltd. Page 8
Key Assumptions Exhibit 19: Key assumptions
Particulars FY14 FY15 FY16E FY17E FY18E Comments
Key assumptions (all figures in ` mn unless otherwise specified)
Lighting
Revenue 9,529 8,983 10,994 12,093 13,665 We expect modest revenue CAGR of 11% over FY16-18 vs -6% in FY15 led by stabilization of ToC (as discussed before). FY16 revenue growth of 22% is not comparable as it has been led by supply under EESL orders, which are not predictable.
% YoY growth 11% -6% 22% 10% 13%
EBIT margin (%) 5.1% 3.5% 6.0% 6.5% 6.5% We model 50bps improvement in EBIT margin over FY16-18 led by improvement in share of LED portfolio and stabilization of ToC
Consumer durables
Revenue 19,427 20,237 20,429 22,881 25,855 With the stabilization of ToC (as discussed before), we expect revenue growth to recover in FY17 and FY18. We model revenue CAGR of 12% over FY16-18 vs 2.5% over FY14-16. % YoY growth 6% 4% 1% 12% 13%
EBIT margin (%) 7.6% 6.6% 5.0% 6.0% 6.5% We model 150bps improvement in EBIT margin over FY16-18 led by gross margin expansion under ToC
E&P
Revenue 11,508 13,355 15,906 17,815 19,597 We model modest revenue CAGR of 11% over FY16-18 vs 18% over FY14-16 given the order inflow in 9MFY16 has declined 39% due to selective site bidding by the company. % YoY growth 67% 16% 19% 12% 10%
EBIT margin (%) -9.0% -6.5% 5.5% 5.5% 5.3% Whilst we expect profitability in E&P business to sustain, we model a lower EBIT margin of 5.5%/5.3% in FY17/FY18 vs 6.9% in 3QFY16
Key estimates (all figures in ` mn unless otherwise specified)
Net revenues 40,298 42,581 47,329 52,789 59,117 Based on the above assumptions, BJE is likely to register revenue CAGR of 12% over FY16-18 % YoY growth 19% 6% 11% 12% 12%
EBITDA 818 890 2,646 3,231 3,705 Based on the above assumptions, BJE is likely to register EBITDA CAGR of 18% over FY16-18 EBITDA margin (%) 2% 2% 6% 6% 6%
EBITDA (YoY growth) (%) -26% 9% 197% 22% 15%
PBT - 59 - 208 1,513 2,210 2,680 Consequently increase in PBT
Tax rate (%) 11% 33% 34% 34% 34% We have assumed full tax rate of 34% over FY16-18
Adj. PAT - 53 -139 999 1,459 1,769 Consequent improvement in PAT
PAT (YoY growth) (%) NA NA NA 46% 21%
CFO - 65 882 7,471 2,761 3,058 We expect improvement in CFO in FY16 led by recovery of the legacy receivables in E&P business.
Capex - 472 - 574 - 401 - 448 - 500 We have modelled maintenance capex.
Free cash flow - 537 307 7,070 2,313 2,558 Consequent increase in FCF
EPS - 0.5 - 1.4 9.9 14.5 17.6 Based on the above assumptions we estimate EPS CAGR of 33% over FY16-18
Source: Ambit Capital research
Exhibit 20: Ambit vs Consensus
`mn unless specified Ambit Consensus Divergence (%) Comment
Revenue
FY16 47,329 47,413 0% Lower revenue estimates, as we have not modelled a significant recovery in consumer demand in FY17 and FY18 FY17 52,789 54,673 -3%
FY18 59,117 61,727 -4%
EBITDA margin (%)
FY16 5.6% 5.7% -10bps Lower EBITDA margin could be led by our expectation of E&P business' EBIT margin not sustaining at 3QFY16 level of 6.9%
FY17 6.1% 6.2% -10bps
FY18 6.3% 6.6% -30bps
EBITDA
FY16 2,646 2,698 -2%
Consequent to lower revenue and EBITDA margin expectation FY17 3,231 3,401 -5%
FY18 3,705 4,047 -8%
PAT
FY16 999 1,056 -5%
Consequent to lower EBITDA estimate FY17 1,459 1,535 -5%
FY18 1,769 1,878 -6%
Source: Bloomberg, Ambit Capital research
Bajaj Electricals
February 24, 2016 Ambit Capital Pvt. Ltd. Page 9
Attractive valuation: Consumer business trading at 15.5x FY17E P/E Consumer business to see growth revival; E&P to remain profitable At CMP, BJE’s consumer business (assuming E&P business is trading at our fair valuation of `45/share; implies a meagre FY17E P/E of 7.1x) is trading at an attractive valuation of 15.5x on consumer business’ FY17 EPS `14.1/share. This is at 43%/25%/45% discount to Havells/V-Guard/and TTK Prestige. Whilst we believe that BJE’s consumer business deserves to trade at a discount to these peers given: (a) lack of product diversification and (b) mediocre management quality; however, such a steep discount is unwarranted. This is because BJE continues to be amidst India’s top four players across all its product categories (leader in small appliances; number four in fans and lighting) and has the strongest distribution reach with 4,000 distributors reaching out to 400,000 retailers. We turned SELLers on BJE on 18 November 2014 due to: (a) implementation concerns over TOC, which caused market share loss in the consumer business; (b) rising attrition amongst senior management given the change of guard to Mr Anant Bajaj from Mr Shekhar Bajaj (though Mr Shekhar Bajaj continues to be CMD his involvement in the business has reduced substantially); and (c) risk of losses re-emerging in the E&P business if the HOD resigns (keyman risk). However now we turn BUYers on BJE because: Our recent checks suggest that the market in which TOC has been
implemented is stabilizing with distributors and retailers now more content in general. Three reasons for their contentment: (a) higher gross margins on the back of marginalization of wholesalers; (b) timely replenishment of inventory with distributors’ inventory being mapped (through ERP) with BJE’s nearest warehouse. Alongside this availability has improved across SKUs rather than just fast moving SKUs; and (c) improvement in range with the retailers. Earlier, when BJE was dealing with multiple wholesalers, only a few SKUs were sold as the wholesalers were interested in bulk discounts; now under TOC, distributors are not allowed to stock more than 1.5 months of inventory across SKUs. This forces them to stock all varieties of SKUs rather than pushing only a few SKUs thereby making a wider range available with retailers.
Management attrition has also reduced since Oct ’15 as per our interaction with management. The reason why the attrition was higher earlier may be on account of non-agreement over TOC. Now the team is broadly in sync with TOC and so is the case with a majority of channel partners in areas where it is implemented. Hence the attrition has significantly reduced since Oct ’15.
On the E&P side, the bidding process for new projects has been significantly tightened especially after the roll out of TOC; this has led to business shrinking in size; order inflow/order book are down 39%/17% YoY in 9MFY16. BJE is not taking up sites which are farther away from the central warehouses located in Bihar and Madhya Pradesh (to ensure timely replenishment at sites) and the CFO’s team now gets involved in the due diligence of any new bid (this ensures that aggressive bidding is not undertaken). On the execution front, weekly monitoring is being done at all the sites in order to track statistical fluctuations and remedial measures are taken accordingly. This is corroborated from the fact that in 26% of its total order backlog, BJE is already ahead of schedule and the balance on schedule.
Consumer business to see growth revival alongside margin improvement: Hence we believe that the business should improve from FY17 onwards. For the consumer business, we expect 11.3% YoY growth in revenue in FY17E vs 0.9% in FY15 and 5.4% in 9MFY16 led by the stabilization of TOC (as discussed above). We expect RoCE of consumer business to improve from 36% in FY15 to 41% in FY17 led by 10 days improvement in the cash conversion cycle to -3 days in FY17, primarily led
BJE’s consumer business is trading at a 43%25%/45% discount to Havells/V-Guard/TTK
TOC is now stabilizing as distributors earn higher margins, inventory is replenished on a timely basis and the numbers of SKUs have improved significantly
Management attrition has significantly reduced since Oct ’15 given the team is broadly in sync with TOC
In E&P, BJE has become selective with orders (order inflow/order book declined 39%/17% YoY), weekly monitoring is done to reduce statistical fluctuations and CFO’s team is involved to ensure rational bidding
We value the consumer business at `279/share; implied FY17 P/E of 19.8x (39%/28% discount to target multiple of Havells/V-Guard).

Bajaj Electricals
February 24, 2016 Ambit Capital Pvt. Ltd. Page 10
by reduction in inventory/receivables days by 5/5 days. We value the consumer business at `279/share which implies FY17E P/E of 19.8x. This is at a significant discount of 39%/28% to the target multiple given to Havells/V-Guard.
E&P business – Tough times are passé: Since 4QFY15, the E&P business has been reporting an impressive performance with average EBIT margin of 5.2% in CY15 and 6.9% in 3QFY16 (adjusted for writeback). Improvement in the performance has been led by closure of the loss making legacy projects. Whilst Mr Rakesh Markhedkar who played an instrumental role in turning around the E&P business has resigned, we believe the profitable performance (though at lower margins) will continue, as there are no pending legacy orders and the rollout of TOC has led to processes and systems getting tightened as explained earlier. We model EBIT margin of 5.4% over FY17-FY18 vs 6.9% in 3QFY16. We value E&P business at `45/share which implies FY17E P/E of 7.1x, a 47% discount to peers. We believe the discount is justified given 6% RoCE over FY16-FY18 vs peers’ ~15% and EPS CAGR of 9% over FY16-FY18 vs peers’ ~20%.
Our margin for consumer business is conservative; other firms that have implemented TOC have seen better results We build a marginal improvement in the consumer business’ margin of 90bps to 6.2% for FY17 (vs 5.7% in FY15 and 5.3% in FY16E), and further to only a 6.6% average over FY18-FY21. This is despite our discussion with management consultants suggesting double-digit margins for the consumer business once ToC is successfully implemented across pan-India. TOC was very successful at Britannia which reported 470bps/850bps gross/EBITDA margin expansion over 3QFY13 to 3QFY16. The reason why we look at Britannia is because both Britannia and BJE have very good brand recall but both entities were unable to capitalize on it. Both were impacted by the same set of issues: (a) inventory dumping; (b) price discounting (c) low adspend.
Exhibit 21: Britannia reported 470bps gross margin and 850bps EBITDA margin improvement over 3QFY13 to 3QFY16 led by distribution channel rationalization
Source: Ace Equity, Ambit Capital research
5.0
7.0
9.0
11.0
13.0
15.0
17.0
35.0
36.0
37.0
38.0
39.0
40.0
41.0
42.0
43.0
1Q
FY1
3
2Q
FY1
3
3Q
FY1
3
4Q
FY1
3
1Q
FY1
4
2Q
FY1
4
3Q
FY1
4
4Q
FY1
4
1Q
FY1
5
2Q
FY1
5
3Q
FY1
5
4Q
FY1
5
1Q
FY1
6
2Q
FY1
6
3Q
FY1
6
Gross margin (%) (LHS) EBITDA margin (%)
started rationalising distribution channel in Jan'13
470bps gross margin and 850bps EBITDA margin improvement over 3QFY13 and 3QFY16
We value the E&P business at `45/share; implied FY17 P/E of 7.1x (45% discount to peers)
We assume only 90bps expansion in consumer margins to 6.2% in FY17 and thereafter increase to only 6.6% average over FY18-21
Bajaj Electricals
February 24, 2016 Ambit Capital Pvt. Ltd. Page 11
Exhibit 22: BJE’s ToC is similar to Britannia’s channel rationalisation programme, launched in January 2014
Britannia BJE
Distribution channel Discontinued wholesalers; increased distributor strength
Discontinued wholesalers in RREP region (20% by area; 35% by value)
Channel dumping Stopped Stopped
Sales staff Separated product category-wise sales team
Distributors are asked to appoint a separate sales person for each product category
Replenishment to distributors Same day replenishment in major markets
7 days replenishment
Channel inventory norm 1 week 1.5 months
Senior management Change in top brass Change in top brass except executive promoter
Wastage management Reduced product return/wastages from 2.5% of revenue to 0.5% of revenue
Not applicable given durable nature of product
Promotion vs advertising Reduced channel promotions in favour of end consumer advertisement
No such strategy yet
SKUs Reduced SKUs by ~20% Increased availability of SKUs with retailers
Source: Company, Industry, Ambit Capital research
Exhibit 23: Sensitivity analysis of our SOTP of `229/share to BJE’s consumer business’ EBIT margin and revenue growth
EBIT margin (%) over FY17-21
4.5% 5.5% 6.5% 7.5% 8.5% 9.5% 10.5%
Reve
nu
e C
AG
R o
ver
FY
16
-21
6% 98 136 170 206 242 278 314
8% 110 149 188 227 267 306 345
10% 123 166 208 251 293 336 378
12% 137 183 229 276 321 367 414
14% 152 202 252 302 353 402 452
16% 168 223 276 331 385 439 493
18% 187 244 303 361 420 478 537
Source: Ambit Capital research, Note our SOTP based TP of `229/share is highlighted in pink
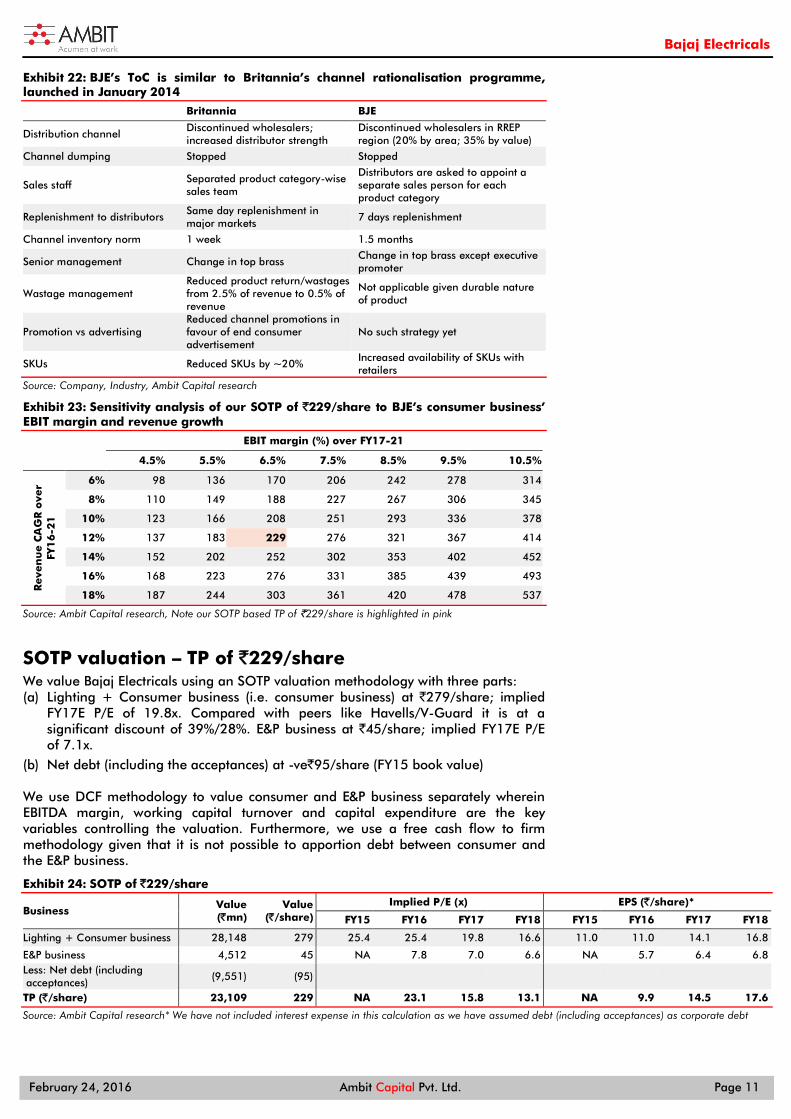
SOTP valuation – TP of `229/share We value Bajaj Electricals using an SOTP valuation methodology with three parts: (a) Lighting + Consumer business (i.e. consumer business) at `279/share; implied
FY17E P/E of 19.8x. Compared with peers like Havells/V-Guard it is at a significant discount of 39%/28%. E&P business at `45/share; implied FY17E P/E of 7.1x.
(b) Net debt (including the acceptances) at -ve`95/share (FY15 book value) We use DCF methodology to value consumer and E&P business separately wherein EBITDA margin, working capital turnover and capital expenditure are the key variables controlling the valuation. Furthermore, we use a free cash flow to firm methodology given that it is not possible to apportion debt between consumer and the E&P business.
Exhibit 24: SOTP of `229/share
Business Value (`mn)
Value (`/share)
Implied P/E (x) EPS (`/share)*
FY15 FY16 FY17 FY18 FY15 FY16 FY17 FY18
Lighting + Consumer business 28,148 279 25.4 25.4 19.8 16.6 11.0 11.0 14.1 16.8
E&P business 4,512 45 NA 7.8 7.0 6.6 NA 5.7 6.4 6.8 Less: Net debt (including acceptances)
(9,551) (95)
TP (`/share) 23,109 229 NA 23.1 15.8 13.1 NA 9.9 14.5 17.6
Source: Ambit Capital research* We have not included interest expense in this calculation as we have assumed debt (including acceptances) as corporate debt
Bajaj Electricals
February 24, 2016 Ambit Capital Pvt. Ltd. Page 12
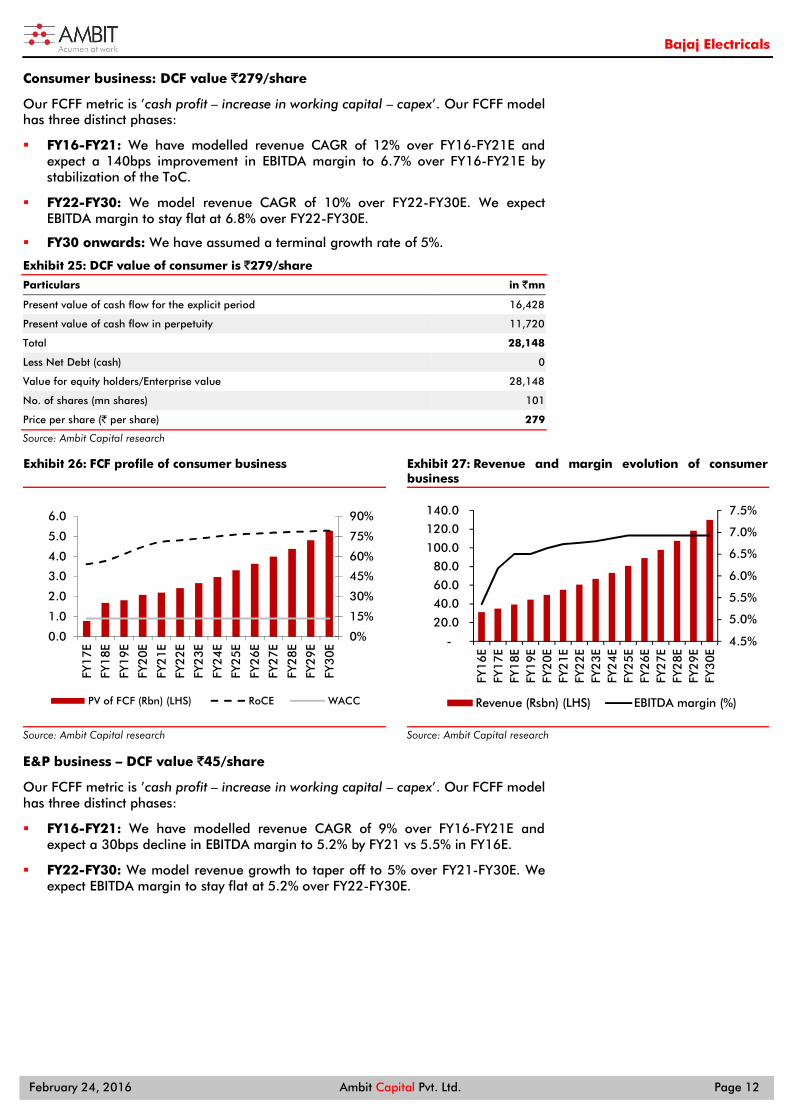
Consumer business: DCF value `279/share
Our FCFF metric is ’cash profit – increase in working capital – capex’. Our FCFF model has three distinct phases:
FY16-FY21: We have modelled revenue CAGR of 12% over FY16-FY21E and expect a 140bps improvement in EBITDA margin to 6.7% over FY16-FY21E by stabilization of the ToC.
FY22-FY30: We model revenue CAGR of 10% over FY22-FY30E. We expect EBITDA margin to stay flat at 6.8% over FY22-FY30E.
FY30 onwards: We have assumed a terminal growth rate of 5%.
Exhibit 25: DCF value of consumer is `279/share
Particulars in `mn
Present value of cash flow for the explicit period 16,428
Present value of cash flow in perpetuity 11,720
Total 28,148
Less Net Debt (cash) 0
Value for equity holders/Enterprise value 28,148
No. of shares (mn shares) 101
Price per share (` per share) 279
Source: Ambit Capital research
Exhibit 26: FCF profile of consumer business
Source: Ambit Capital research
Exhibit 27: Revenue and margin evolution of consumer business
Source: Ambit Capital research
E&P business – DCF value `45/share
Our FCFF metric is ’cash profit – increase in working capital – capex’. Our FCFF model has three distinct phases:
FY16-FY21: We have modelled revenue CAGR of 9% over FY16-FY21E and expect a 30bps decline in EBITDA margin to 5.2% by FY21 vs 5.5% in FY16E.
FY22-FY30: We model revenue growth to taper off to 5% over FY21-FY30E. We expect EBITDA margin to stay flat at 5.2% over FY22-FY30E.
0%
15%
30%
45%
60%
75%
90%
0.0
1.0
2.0
3.0
4.0
5.0
6.0
FY1
7E
FY1
8E
FY1
9E
FY2
0E
FY2
1E
FY2
2E
FY2
3E
FY2
4E
FY2
5E
FY2
6E
FY2
7E
FY2
8E
FY2
9E
FY3
0E
PV of FCF (Rbn) (LHS) RoCE WACC
4.5%
5.0%
5.5%
6.0%
6.5%
7.0%
7.5%
-
20.0
40.0
60.0
80.0
100.0
120.0
140.0
FY1
6EFY
17E
FY1
8EFY
19E
FY2
0EFY
21E
FY2
2EFY
23E
FY2
4EFY
25E
FY2
6EFY
27E
FY2
8EFY
29E
FY3
0ERevenue (Rsbn) (LHS) EBITDA margin (%)
Bajaj Electricals
February 24, 2016 Ambit Capital Pvt. Ltd. Page 13
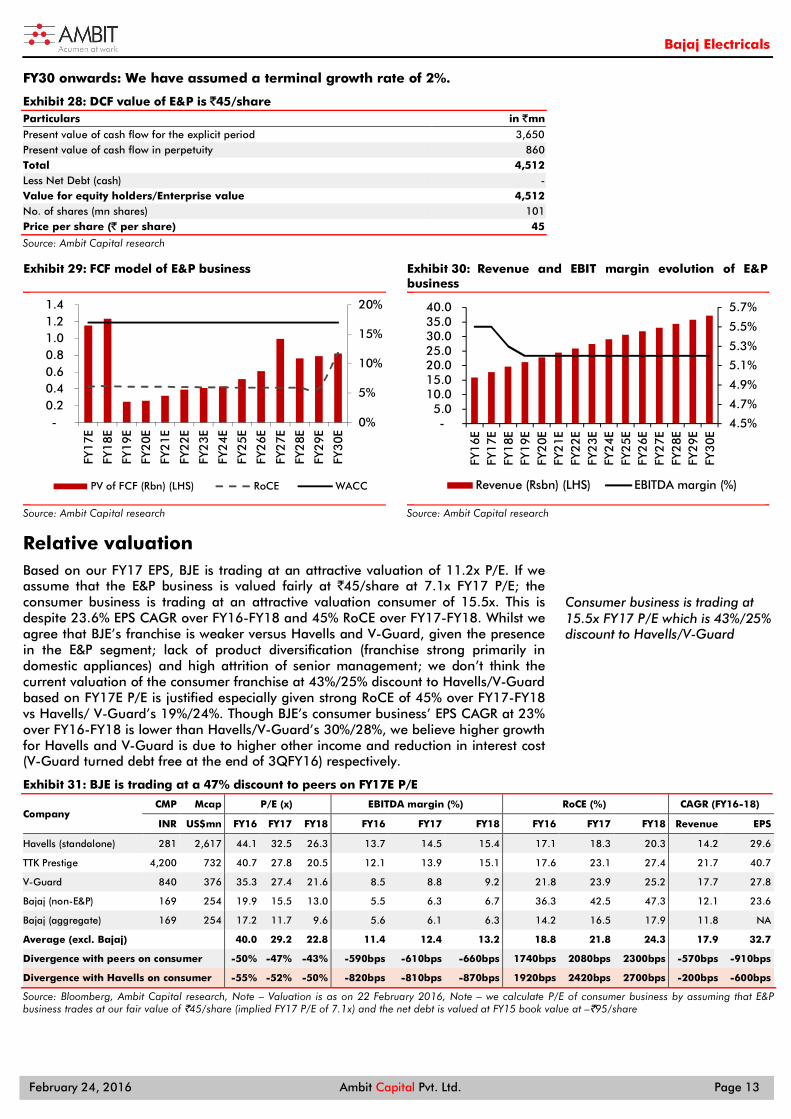
FY30 onwards: We have assumed a terminal growth rate of 2%.
Exhibit 28: DCF value of E&P is `45/share Particulars in `mn
Present value of cash flow for the explicit period 3,650 Present value of cash flow in perpetuity 860 Total 4,512 Less Net Debt (cash) - Value for equity holders/Enterprise value 4,512 No. of shares (mn shares) 101 Price per share (` per share) 45
Source: Ambit Capital research
Exhibit 29: FCF model of E&P business
Source: Ambit Capital research
Exhibit 30: Revenue and EBIT margin evolution of E&P business
Source: Ambit Capital research
Relative valuation Based on our FY17 EPS, BJE is trading at an attractive valuation of 11.2x P/E. If we assume that the E&P business is valued fairly at `45/share at 7.1x FY17 P/E; the consumer business is trading at an attractive valuation consumer of 15.5x. This is despite 23.6% EPS CAGR over FY16-FY18 and 45% RoCE over FY17-FY18. Whilst we agree that BJE’s franchise is weaker versus Havells and V-Guard, given the presence in the E&P segment; lack of product diversification (franchise strong primarily in domestic appliances) and high attrition of senior management; we don’t think the current valuation of the consumer franchise at 43%/25% discount to Havells/V-Guard based on FY17E P/E is justified especially given strong RoCE of 45% over FY17-FY18 vs Havells/ V-Guard’s 19%/24%. Though BJE’s consumer business’ EPS CAGR at 23% over FY16-FY18 is lower than Havells/V-Guard’s 30%/28%, we believe higher growth for Havells and V-Guard is due to higher other income and reduction in interest cost (V-Guard turned debt free at the end of 3QFY16) respectively.
Exhibit 31: BJE is trading at a 47% discount to peers on FY17E P/E
Company CMP Mcap P/E (x) EBITDA margin (%) RoCE (%) CAGR (FY16-18)
INR US$mn FY16 FY17 FY18 FY16 FY17 FY18 FY16 FY17 FY18 Revenue EPS
Havells (standalone) 281 2,617 44.1 32.5 26.3 13.7 14.5 15.4 17.1 18.3 20.3 14.2 29.6
TTK Prestige 4,200 732 40.7 27.8 20.5 12.1 13.9 15.1 17.6 23.1 27.4 21.7 40.7
V-Guard 840 376 35.3 27.4 21.6 8.5 8.8 9.2 21.8 23.9 25.2 17.7 27.8
Bajaj (non-E&P) 169 254 19.9 15.5 13.0 5.5 6.3 6.7 36.3 42.5 47.3 12.1 23.6
Bajaj (aggregate) 169 254 17.2 11.7 9.6 5.6 6.1 6.3 14.2 16.5 17.9 11.8 NA
Average (excl. Bajaj)
40.0 29.2 22.8 11.4 12.4 13.2 18.8 21.8 24.3 17.9 32.7
Divergence with peers on consumer -50% -47% -43% -590bps -610bps -660bps 1740bps 2080bps 2300bps -570bps -910bps
Divergence with Havells on consumer -55% -52% -50% -820bps -810bps -870bps 1920bps 2420bps 2700bps -200bps -600bps
Source: Bloomberg, Ambit Capital research, Note – Valuation is as on 22 February 2016, Note – we calculate P/E of consumer business by assuming that E&P business trades at our fair value of `45/share (implied FY17 P/E of 7.1x) and the net debt is valued at FY15 book value at –`95/share
0%
5%
10%
15%
20%
- 0.2 0.4 0.6 0.8 1.0 1.2 1.4
FY1
7E
FY1
8E
FY1
9E
FY2
0E
FY2
1E
FY2
2E
FY2
3E
FY2
4E
FY2
5E
FY2
6E
FY2
7E
FY2
8E
FY2
9E
FY3
0E
PV of FCF (Rbn) (LHS) RoCE WACC
4.5%
4.7%
4.9%
5.1%
5.3%
5.5%
5.7%
- 5.0
10.0 15.0 20.0 25.0 30.0 35.0 40.0
FY1
6EFY
17E
FY1
8EFY
19E
FY2
0EFY
21E
FY2
2EFY
23E
FY2
4EFY
25E
FY2
6EFY
27E
FY2
8EFY
29E
FY3
0E
Revenue (Rsbn) (LHS) EBITDA margin (%)
Consumer business is trading at 15.5x FY17 P/E which is 43%/25% discount to Havells/V-Guard
Bajaj Electricals
February 24, 2016 Ambit Capital Pvt. Ltd. Page 14
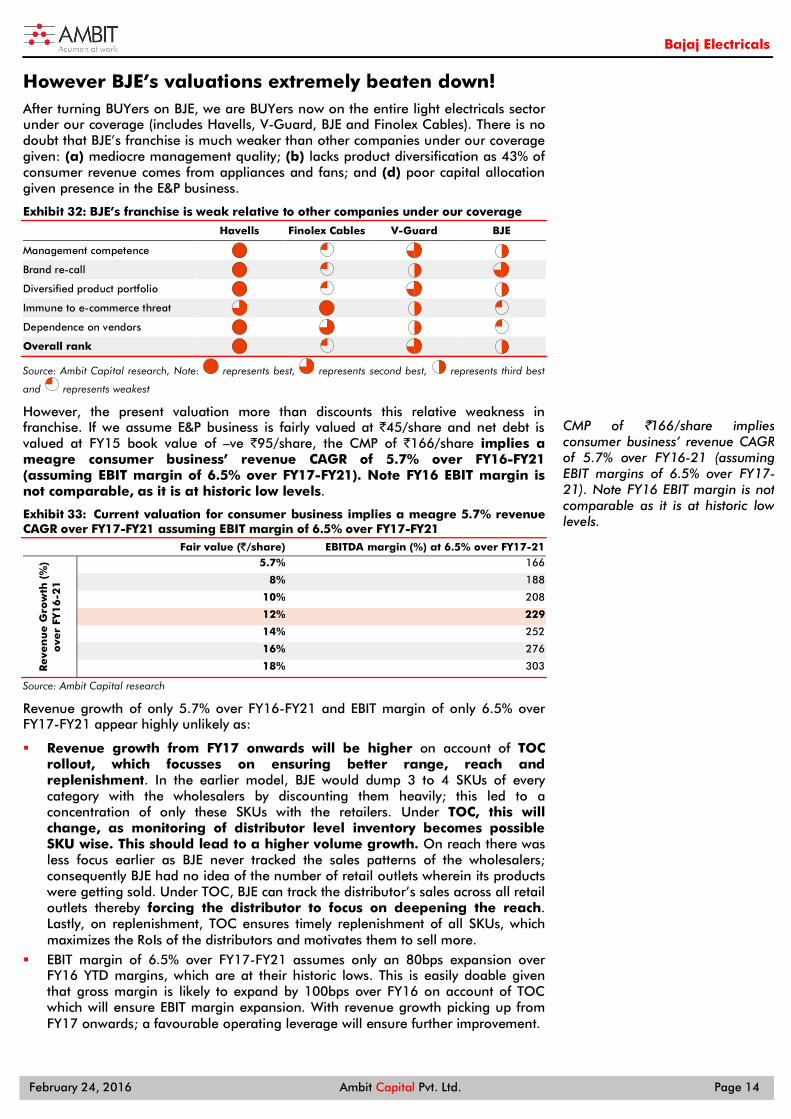
However BJE’s valuations extremely beaten down! After turning BUYers on BJE, we are BUYers now on the entire light electricals sector under our coverage (includes Havells, V-Guard, BJE and Finolex Cables). There is no doubt that BJE’s franchise is much weaker than other companies under our coverage given: (a) mediocre management quality; (b) lacks product diversification as 43% of consumer revenue comes from appliances and fans; and (d) poor capital allocation given presence in the E&P business.
Exhibit 32: BJE’s franchise is weak relative to other companies under our coverage
Havells Finolex Cables V-Guard BJE
Management competence
Brand re-call
Diversified product portfolio
Immune to e-commerce threat
Dependence on vendors
Overall rank
Source: Ambit Capital research, Note: represents best, represents second best, represents third best
and represents weakest
However, the present valuation more than discounts this relative weakness in franchise. If we assume E&P business is fairly valued at `45/share and net debt is valued at FY15 book value of –ve `95/share, the CMP of `166/share implies a meagre consumer business’ revenue CAGR of 5.7% over FY16-FY21 (assuming EBIT margin of 6.5% over FY17-FY21). Note FY16 EBIT margin is not comparable, as it is at historic low levels.
Exhibit 33: Current valuation for consumer business implies a meagre 5.7% revenue CAGR over FY17-FY21 assuming EBIT margin of 6.5% over FY17-FY21
Fair value (`/share) EBITDA margin (%) at 6.5% over FY17-21
Reve
nu
e G
row
th (
%)
ove
r FY
16
-21
5.7% 166
8% 188
10% 208
12% 229
14% 252
16% 276
18% 303
Source: Ambit Capital research
Revenue growth of only 5.7% over FY16-FY21 and EBIT margin of only 6.5% over FY17-FY21 appear highly unlikely as:
Revenue growth from FY17 onwards will be higher on account of TOC rollout, which focusses on ensuring better range, reach and replenishment. In the earlier model, BJE would dump 3 to 4 SKUs of every category with the wholesalers by discounting them heavily; this led to a concentration of only these SKUs with the retailers. Under TOC, this will change, as monitoring of distributor level inventory becomes possible SKU wise. This should lead to a higher volume growth. On reach there was less focus earlier as BJE never tracked the sales patterns of the wholesalers; consequently BJE had no idea of the number of retail outlets wherein its products were getting sold. Under TOC, BJE can track the distributor’s sales across all retail outlets thereby forcing the distributor to focus on deepening the reach. Lastly, on replenishment, TOC ensures timely replenishment of all SKUs, which maximizes the RoIs of the distributors and motivates them to sell more.
EBIT margin of 6.5% over FY17-FY21 assumes only an 80bps expansion over FY16 YTD margins, which are at their historic lows. This is easily doable given that gross margin is likely to expand by 100bps over FY16 on account of TOC which will ensure EBIT margin expansion. With revenue growth picking up from FY17 onwards; a favourable operating leverage will ensure further improvement.
CMP of `166/share implies consumer business’ revenue CAGR of 5.7% over FY16-21 (assuming EBIT margins of 6.5% over FY17-21). Note FY16 EBIT margin is not comparable as it is at historic low levels.

Bajaj Electricals
February 24, 2016 Ambit Capital Pvt. Ltd. Page 15
Exhibit 34: Though BJE is a mediocre franchise it is trading at an attractive valuation
Source: Ambit Capital research; Note – size of bubble represent ranking based on Mcap; for ranking on strength of franchise please refer exhibit 32
Catalyst: The catalysts are: (a) improving EBITDA margin in the consumer business on the back of the rollout of TOC; and (b) sustained profitability in the E&P business which will alleviate fear of recurrence of losses in the E&P business given exit of the HOD in Nov ’15.
EBITDA margin improvement in consumer business: Gross margin expanded by 100bps/240bps QoQ in consumer durables/lighting businesses in 3QFY16 despite TOC being rolled out only in 20% of the total area. As TOC gets rolled out in 100% of the area by FY17, gross margin will further improve, as price discounting will be discontinued. A favourable operating leverage riding on higher volumes alongside inventory rationalisation in the secondary market will likely lead to EBITDA margin expansion. We model 120bps improvement in EBITDA margin over FY16-FY18.
Sustained profitability in E&P: We model an E&P margin of 5.5% for FY17 and 5.2% over FY18-FY21. This run rate of profitability should serve as a favourable catalyst given there is a great deal of scepticism amongst investors of losses re-occurring after the recent exit of the HOD. As explained earlier, we do not believe losses will re-occur merely because the HOD has resigned in November ’15.
Risks The key risk to our thesis are: (a) sustenance of market share loss in the consumer business if the ‘pull based model’ does not take off; and (b) recurrence of losses in the E&P business, given exit of the HOD.
Market loss due to ToC implementation: In the market BJE is known as the brand for the masses and hence the push model worked as BJE was available at a discount to peers. Now with focus on the pull model under TOC, the risk is likely market share loss as the customers are accustomed to higher discounts. However, our interaction with the management suggests that in FY16, the ad spend has been stepped up (up 60% YoY) and employees have been hired to improve reach (employee cost up 16% YoY YTD). Alongside this the product portfolio should ramp up in FY17 as BJE has invested ~`2.5bn in setting up an integrated R&D centre which will be fully functional from April ’17.
Havells
Finolex
V-GuardBJE
0
1
2
3
4
5
10 12 14 16 18 20 22 24 26 28
FY17 P/E multiple (x)
Stre
ngth
of fr
anch
ise
Strong franchise;reasonable valuationMediocre franchise; cheap
valuation
Bajaj Electricals
February 24, 2016 Ambit Capital Pvt. Ltd. Page 16
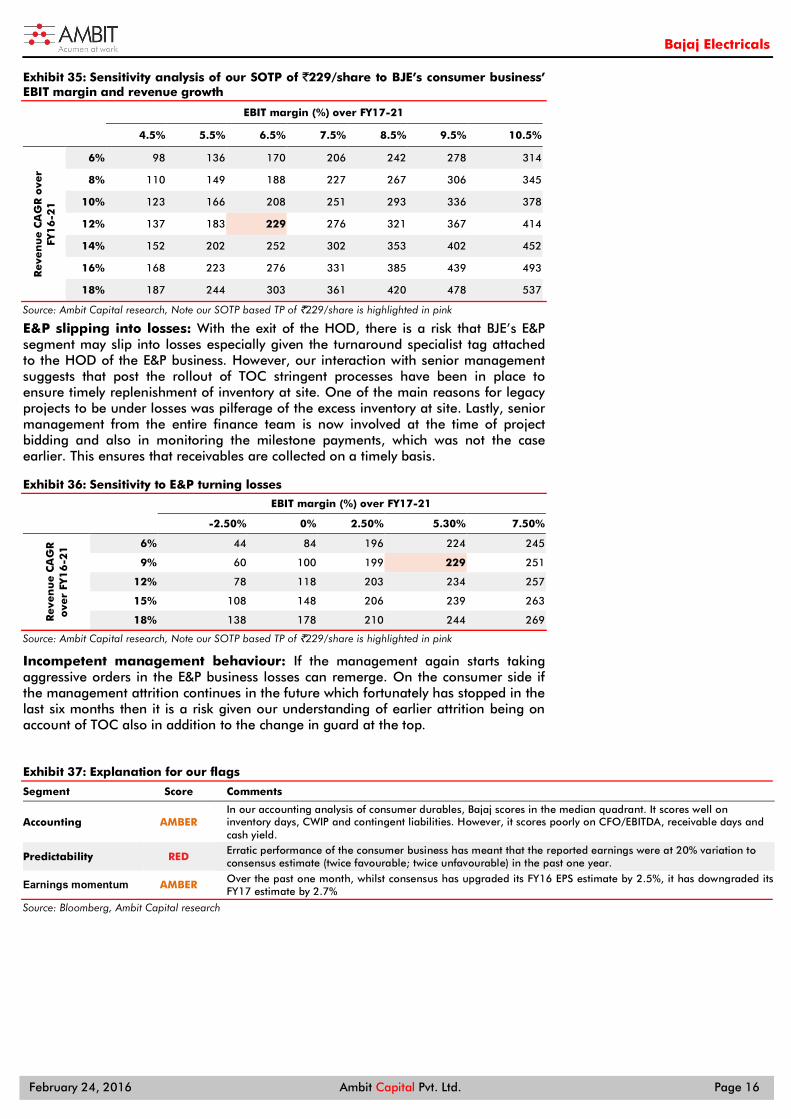
Exhibit 35: Sensitivity analysis of our SOTP of `229/share to BJE’s consumer business’ EBIT margin and revenue growth
EBIT margin (%) over FY17-21
4.5% 5.5% 6.5% 7.5% 8.5% 9.5% 10.5%
Reve
nu
e C
AG
R o
ver
FY
16
-21
6% 98 136 170 206 242 278 314
8% 110 149 188 227 267 306 345
10% 123 166 208 251 293 336 378
12% 137 183 229 276 321 367 414
14% 152 202 252 302 353 402 452
16% 168 223 276 331 385 439 493
18% 187 244 303 361 420 478 537
Source: Ambit Capital research, Note our SOTP based TP of `229/share is highlighted in pink
E&P slipping into losses: With the exit of the HOD, there is a risk that BJE’s E&P segment may slip into losses especially given the turnaround specialist tag attached to the HOD of the E&P business. However, our interaction with senior management suggests that post the rollout of TOC stringent processes have been in place to ensure timely replenishment of inventory at site. One of the main reasons for legacy projects to be under losses was pilferage of the excess inventory at site. Lastly, senior management from the entire finance team is now involved at the time of project bidding and also in monitoring the milestone payments, which was not the case earlier. This ensures that receivables are collected on a timely basis.
Exhibit 36: Sensitivity to E&P turning losses
EBIT margin (%) over FY17-21
-2.50% 0% 2.50% 5.30% 7.50%
Reve
nu
e C
AG
R
ove
r FY
16
-21
6% 44 84 196 224 245
9% 60 100 199 229 251
12% 78 118 203 234 257
15% 108 148 206 239 263
18% 138 178 210 244 269
Source: Ambit Capital research, Note our SOTP based TP of `229/share is highlighted in pink
Incompetent management behaviour: If the management again starts taking aggressive orders in the E&P business losses can remerge. On the consumer side if the management attrition continues in the future which fortunately has stopped in the last six months then it is a risk given our understanding of earlier attrition being on account of TOC also in addition to the change in guard at the top.
Exhibit 37: Explanation for our flags
Segment Score Comments
Accounting AMBER In our accounting analysis of consumer durables, Bajaj scores in the median quadrant. It scores well on inventory days, CWIP and contingent liabilities. However, it scores poorly on CFO/EBITDA, receivable days and cash yield.
Predictability RED Erratic performance of the consumer business has meant that the reported earnings were at 20% variation to consensus estimate (twice favourable; twice unfavourable) in the past one year.
Earnings momentum AMBER Over the past one month, whilst consensus has upgraded its FY16 EPS estimate by 2.5%, it has downgraded its FY17 estimate by 2.7%
Source: Bloomberg, Ambit Capital research
Bajaj Electricals
February 24, 2016 Ambit Capital Pvt. Ltd. Page 17
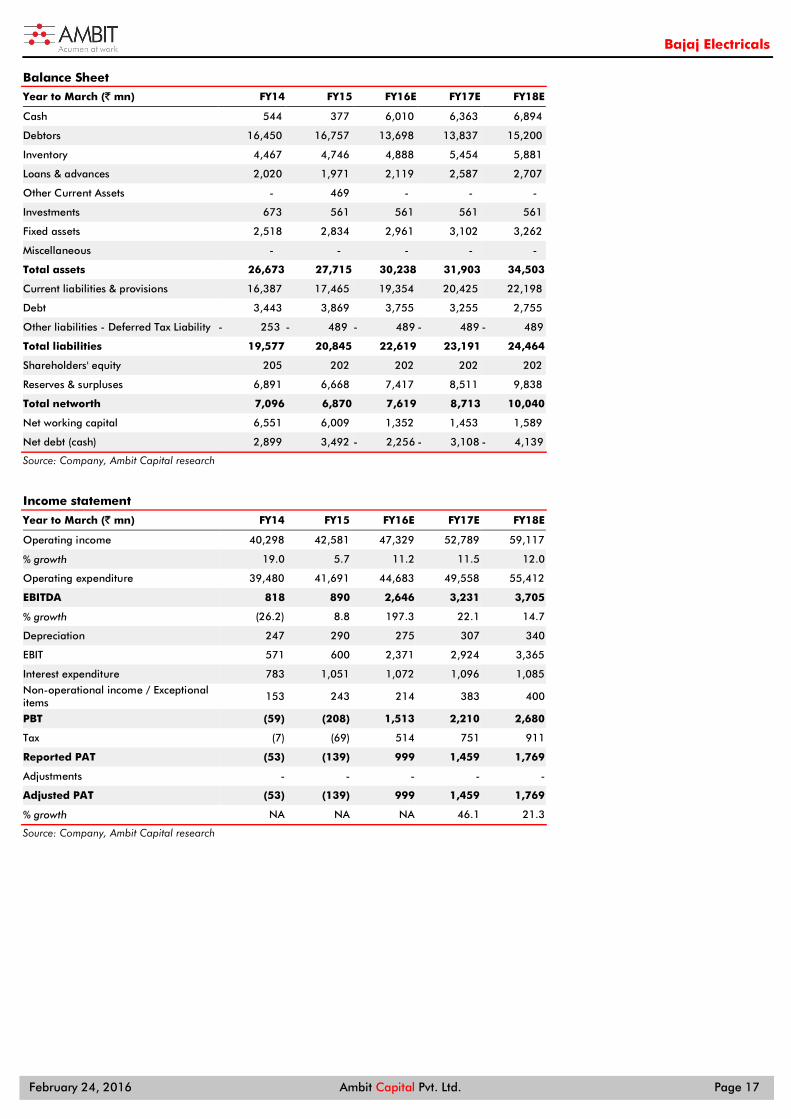
Balance Sheet
Year to March (` mn) FY14 FY15 FY16E FY17E FY18E
Cash 544 377 6,010 6,363 6,894
Debtors 16,450 16,757 13,698 13,837 15,200
Inventory 4,467 4,746 4,888 5,454 5,881
Loans & advances 2,020 1,971 2,119 2,587 2,707
Other Current Assets - 469 - - -
Investments 673 561 561 561 561
Fixed assets 2,518 2,834 2,961 3,102 3,262
Miscellaneous - - - - -
Total assets 26,673 27,715 30,238 31,903 34,503
Current liabilities & provisions 16,387 17,465 19,354 20,425 22,198
Debt 3,443 3,869 3,755 3,255 2,755
Other liabilities - Deferred Tax Liability - 253 - 489 - 489 - 489 - 489
Total liabilities 19,577 20,845 22,619 23,191 24,464
Shareholders' equity 205 202 202 202 202
Reserves & surpluses 6,891 6,668 7,417 8,511 9,838
Total networth 7,096 6,870 7,619 8,713 10,040
Net working capital 6,551 6,009 1,352 1,453 1,589
Net debt (cash) 2,899 3,492 - 2,256 - 3,108 - 4,139
Source: Company, Ambit Capital research
Income statement
Year to March (` mn) FY14 FY15 FY16E FY17E FY18E
Operating income 40,298 42,581 47,329 52,789 59,117
% growth 19.0 5.7 11.2 11.5 12.0
Operating expenditure 39,480 41,691 44,683 49,558 55,412
EBITDA 818 890 2,646 3,231 3,705
% growth (26.2) 8.8 197.3 22.1 14.7
Depreciation 247 290 275 307 340
EBIT 571 600 2,371 2,924 3,365
Interest expenditure 783 1,051 1,072 1,096 1,085
Non-operational income / Exceptional items
153 243 214 383 400
PBT (59) (208) 1,513 2,210 2,680
Tax (7) (69) 514 751 911
Reported PAT (53) (139) 999 1,459 1,769
Adjustments - - - - -
Adjusted PAT (53) (139) 999 1,459 1,769
% growth NA NA NA 46.1 21.3
Source: Company, Ambit Capital research
Bajaj Electricals
February 24, 2016 Ambit Capital Pvt. Ltd. Page 18
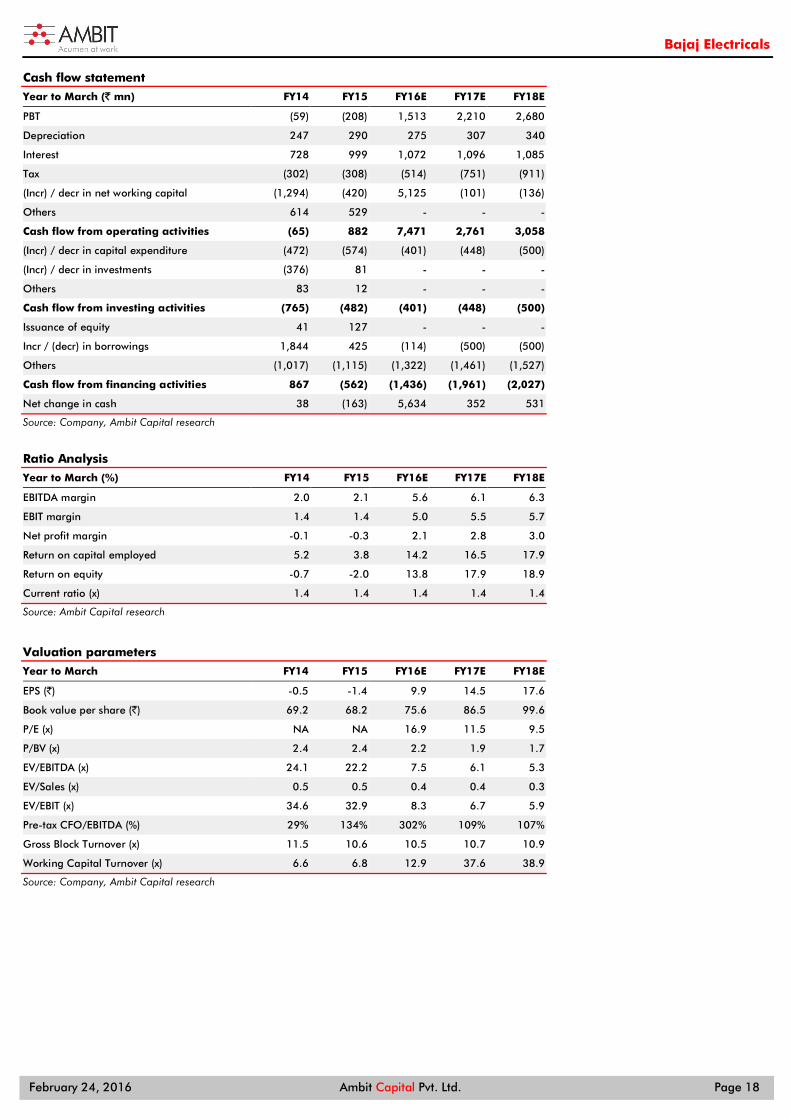
Cash flow statement
Year to March (` mn) FY14 FY15 FY16E FY17E FY18E
PBT (59) (208) 1,513 2,210 2,680
Depreciation 247 290 275 307 340
Interest 728 999 1,072 1,096 1,085
Tax (302) (308) (514) (751) (911)
(Incr) / decr in net working capital (1,294) (420) 5,125 (101) (136)
Others 614 529 - - -
Cash flow from operating activities (65) 882 7,471 2,761 3,058
(Incr) / decr in capital expenditure (472) (574) (401) (448) (500)
(Incr) / decr in investments (376) 81 - - -
Others 83 12 - - -
Cash flow from investing activities (765) (482) (401) (448) (500)
Issuance of equity 41 127 - - -
Incr / (decr) in borrowings 1,844 425 (114) (500) (500)
Others (1,017) (1,115) (1,322) (1,461) (1,527)
Cash flow from financing activities 867 (562) (1,436) (1,961) (2,027)
Net change in cash 38 (163) 5,634 352 531
Source: Company, Ambit Capital research
Ratio Analysis
Year to March (%) FY14 FY15 FY16E FY17E FY18E
EBITDA margin 2.0 2.1 5.6 6.1 6.3
EBIT margin 1.4 1.4 5.0 5.5 5.7
Net profit margin -0.1 -0.3 2.1 2.8 3.0
Return on capital employed 5.2 3.8 14.2 16.5 17.9
Return on equity -0.7 -2.0 13.8 17.9 18.9
Current ratio (x) 1.4 1.4 1.4 1.4 1.4
Source: Ambit Capital research
Valuation parameters
Year to March FY14 FY15 FY16E FY17E FY18E
EPS (`) -0.5 -1.4 9.9 14.5 17.6
Book value per share (`) 69.2 68.2 75.6 86.5 99.6
P/E (x) NA NA 16.9 11.5 9.5
P/BV (x) 2.4 2.4 2.2 1.9 1.7
EV/EBITDA (x) 24.1 22.2 7.5 6.1 5.3
EV/Sales (x) 0.5 0.5 0.4 0.4 0.3
EV/EBIT (x) 34.6 32.9 8.3 6.7 5.9
Pre-tax CFO/EBITDA (%) 29% 134% 302% 109% 107%
Gross Block Turnover (x) 11.5 10.6 10.5 10.7 10.9
Working Capital Turnover (x) 6.6 6.8 12.9 37.6 38.9
Source: Company, Ambit Capital research

Bajaj Electricals
February 24, 2016 Ambit Capital Pvt. Ltd. Page 19
Institutional Equities Team Saurabh Mukherjea, CFA CEO, Institutional Equities (022) 30433174 [email protected]
Research
Analysts Industry Sectors Desk-Phone E-mail
Nitin Bhasin - Head of Research E&C / Infra / Cement / Industrials (022) 30433241 [email protected]
Aadesh Mehta, CFA Banking / Financial Services (022) 30433239 [email protected]
Aakash Adukia Oil & Gas / Chemicals / Agri Inputs (022) 30433273 [email protected]
Abhishek Ranganathan, CFA Retail / Mid-caps (022) 30433085 [email protected]
Achint Bhagat, CFA Cement / Roads / Home Building (022) 30433178 [email protected]
Ashvin Shetty, CFA Automobile (022) 30433285 [email protected]
Bhargav Buddhadev Power Utilities / Capital Goods (022) 30433252 [email protected]
Deepesh Agarwal, CFA Power Utilities / Capital Goods (022) 30433275 [email protected] Dhiraj Mistry, CFA Consumer (022) 30433264 [email protected]
Gaurav Khandelwal, CFA Automobile (022) 30433132 [email protected] Girisha Saraf Mid-caps / Small-caps (022) 30433211 [email protected]
Karan Khanna, CFA Strategy (022) 30433251 [email protected]
Kushank Poddar Technology (022) 30433203 [email protected] Pankaj Agarwal, CFA Banking / Financial Services (022) 30433206 [email protected]
Paresh Dave, CFA Healthcare (022) 30433212 [email protected]
Parita Ashar, CFA Metals & Mining (022) 30433223 [email protected]
Prashant Mittal, CFA Derivatives (022) 30433218 [email protected]
Rahil Shah Banking / Financial Services (022) 30433217 [email protected]
Rakshit Ranjan, CFA Consumer (022) 30433201 [email protected]
Ravi Singh Banking / Financial Services (022) 30433181 [email protected]
Ritesh Gupta, CFA Oil & Gas / Chemicals / Agri Inputs (022) 30433242 [email protected]
Ritesh Vaidya, CFA Consumer (022) 30433246 [email protected] Ritika Mankar Mukherjee, CFA Economy / Strategy (022) 30433175 [email protected]
Ritu Modi Automobile (022) 30433292 [email protected]
Sagar Rastogi Technology (022) 30433291 [email protected]
Sumit Shekhar Economy / Strategy (022) 30433229 [email protected]
Utsav Mehta, CFA E&C / Industrials (022) 30433209 [email protected]
Vivekanand Subbaraman, CFA Media (022) 30433261 [email protected]
Sales
Name Regions Desk-Phone E-mail
Sarojini Ramachandran - Head of Sales UK +44 (0) 20 7614 8374 [email protected]
Dharmen Shah India / Asia (022) 30433289 [email protected]
Dipti Mehta India / USA (022) 30433053 [email protected]
Hitakshi Mehra India (022) 30433204 [email protected]
Krishnan V India / Asia (022) 30433295 [email protected]
Nityam Shah, CFA USA / Europe (022) 30433259 [email protected]
Parees Purohit, CFA UK / USA (022) 30433169 [email protected]
Praveena Pattabiraman India / Asia (022) 30433268 [email protected]
Shaleen Silori India (022) 30433256 [email protected]
Singapore
Pramod Gubbi, CFA – Director Singapore +65 8606 6476 [email protected]
Shashank Abhisheik Singapore +65 6536 1935 [email protected]
USA / Canada
Ravilochan Pola - CEO Americas +1(646) 361 3107 [email protected]
Production
Sajid Merchant Production (022) 30433247 [email protected]
Sharoz G Hussain Production (022) 30433183 [email protected]
Nikhil Pillai Database (022) 30433265 [email protected]
E&C = Engineering & Construction

Bajaj Electricals
February 24, 2016 Ambit Capital Pvt. Ltd. Page 20
Bajaj Electricals Ltd (BJE IN, BUY)
Source: Bloomberg, Ambit Capital research
050
100150200250300350400
Feb-
13
Apr
-13
Jun-
13
Aug
-13
Oct
-13
Dec
-13
Feb-
14
Apr
-14
Jun-
14
Aug
-14
Oct
-14
Dec
-14
Feb-
15
Apr
-15
Jun-
15
Aug
-15
Oct
-15
Dec
-15
BAJAJ ELECTRICALS LTD
Bajaj Electricals
February 24, 2016 Ambit Capital Pvt. Ltd. Page 21
Explanation of Investment Rating
Investment Rating Expected return (over 12-month)
BUY >10%
SELL <10%
NO STANCE We have forward looking estimates for the stock but we refrain from assigning valuation and recommendation
UNDER REVIEW We will revisit our recommendation, valuation and estimates on the stock following recent events
NOT RATED We do not have any forward looking estimates, valuation or recommendation for the stock
Disclaimer
This report or any portion hereof may not be reprinted, sold or redistributed without the written consent of Ambit Capital. AMBIT Capital Research is disseminated and available primarily electronically, and, in some cases,
in printed form.
Additional information on recommended securities is available on request.
Disclaimer
1. AMBIT Capital Private Limited (“AMBIT Capital”) and its affiliates are a full service, integrated investment banking, investment advisory and brokerage group. AMBIT Capital is a Stock Broker, Portfolio Manager and Depository Participant registered with Securities and Exchange Board of India Limited (SEBI) and is regulated by SEBI
2. AMBIT Capital makes best endeavours to ensure that the research analyst(s) use current, reliable, comprehensive information and obtain such information from sources which the analyst(s) believes to be reliable. However, such information has not been independently verified by AMBIT Capital and/or the analyst(s) and no representation or warranty, express or implied, is made as to the accuracy or completeness of any information obtained from third parties. The information, opinions, views expressed in this Research Report are those of the research analyst as at the date of this Research Report which are subject to change and do not represent to be an authority on the subject. AMBIT Capital may or may not subscribe to any and/ or all the views expressed herein.
3. This Research Report should be read and relied upon at the sole discretion and risk of the recipient. If you are dissatisfied with the contents of this complimentary Research Report or with the terms of this Disclaimer, your sole and exclusive remedy is to stop using this Research Report and AMBIT Capital or its affiliates shall not be responsible and/ or liable for any direct/consequential loss howsoever directly or indirectly, from any use of this Research Report.
4. If this Research Report is received by any client of AMBIT Capital or its affiliate, the relationship of AMBIT Capital/its affiliate with such client will continue to be governed by the terms and conditions in place between AMBIT Capital/ such affiliate and the client.
5. This Research Report is issued for information only and the 'Buy', 'Sell', or ‘Other Recommendation’ made in this Research Report such should not be construed as an investment advice to any recipient to acquire, subscribe, purchase, sell, dispose of, retain any securities and should not be intended or treated as a substitute for necessary review or validation or any professional advice. Recipients should consider this Research Report as only a single factor in making any investment decisions. This Research Report is not an offer to sell or the solicitation of an offer to purchase or subscribe for any investment or as an official endorsement of any investment.
6. This Research Report is being supplied to you solely for your information and may not be reproduced, redistributed or passed on, directly or indirectly, to any other person or published, copied in whole or in part, for any purpose. Neither this Research Report nor any copy of it may be taken or transmitted or distributed, directly or indirectly within India or into any other country including United States (to US Persons), Canada or Japan or to any resident thereof. The distribution of this Research Report in other jurisdictions may be strictly restricted and/ or prohibited by law or contract, and persons into whose possession this Research Report comes should inform themselves about such restriction and/ or prohibition, and observe any such restrictions and/ or prohibition.
7. Ambit Capital Private Limited is registered as a Research Entity under the SEBI (Research Analysts) Regulations, 2014. SEBI Reg.No.- INH000000313. Conflict of Interests
8. In the normal course of AMBIT Capital’s business circumstances may arise that could result in the interests of AMBIT Capital conflicting with the interests of clients or one client’s interests conflicting with the interest of another client. AMBIT Capital makes best efforts to ensure that conflicts are identified and managed and that clients’ interests are protected. AMBIT Capital has policies and procedures in place to control the flow and use of non-public, price sensitive information and employees’ personal account trading. Where appropriate and reasonably achievable, AMBIT Capital segregates the activities of staff working in areas where conflicts of interest may arise. However, clients/potential clients of AMBIT Capital should be aware of these possible conflicts of interests and should make informed decisions in relation to AMBIT Capital’s services.
9. AMBIT Capital and/or its affiliates may from time to time have or solicit investment banking, investment advisory and other business relationships with companies covered in this Research Report and may receive compensation for the same.
Additional Disclaimer for U.S. Persons
10. The research report is solely a product of AMBIT Capital 11. AMBIT Capital is the employer of the research analyst(s) who has prepared the research report 12. Any subsequent transactions in securities discussed in the research reports should be effected through Enclave Capital LLC. (“Enclave”). 13. Enclave does not accept or receive any compensation of any kind for the dissemination of the AMBIT Capital research reports. 14. The research analyst(s) preparing the email / Research Report/ attachment is resident outside the United States and is/are not associated persons of any U.S. regulated broker-dealer and that therefore the analyst(s)
is/are not subject to supervision by a U.S. broker-dealer, and is/are not required to satisfy the regulatory licensing requirements of FINRA or required to otherwise comply with U.S. rules or regulations regarding, among other things, communications with a subject company, public appearances and trading securities held by a research analyst account.
15. This report is prepared, approved, published and distributed by the Ambit Capital located outside of the United States (a non-US Group Company”). This report is distributed in the U.S.by Enclave Capital LLC, a U.S. registered broker dealer, on behalf of Ambit Capital only to major U.S. institutional investors (as defined in Rule 15a-6 under the U.S. Securities Exchange Act of 1934 (the “Exchange Act”)) pursuant to the exemption in Rule 15a-6 and any transaction effected by a U.S. customer in the securities described in this report must be effected through Enclave Capital LLC (19 West 44th Street, suite 1700, New York, NY 10036).
16. As of the publication of this report Enclave Capital LLC, does not make a market in the subject securities. 17. This document does not constitute an offer of, or an invitation by or on behalf of Ambit Capital or its affiliates or any other company to any person, to buy or sell any security. The information contained herein has
been obtained from published information and other sources, which Ambit Capital or its Affiliates consider to be reliable. None of Ambit Capital accepts any liability or responsibility whatsoever for the accuracy or completeness of any such information. All estimates, expressions of opinion and other subjective judgments contained herein are made as of the date of this document. Emerging securities markets may be subject to risks significantly higher than more established markets. In particular, the political and economic environment, company practices and market prices and volumes may be subject to significant variations. The ability to assess such risks may also be limited due to significantly lower information quantity and quality. By accepting this document, you agree to be bound by all the foregoing provisions.
Additional Disclaimer for Canadian Persons
18. AMBIT Capital is not registered in the Province of Ontario and /or Province of Québec to trade in securities and/or to provide advice with respect to securities. 19. AMBIT Capital's head office or principal place of business is located in India. 20. All or substantially all of AMBIT Capital's assets may be situated outside of Canada. 21. It may be difficult for enforcing legal rights against AMBIT Capital because of the above. 22. Name and address of AMBIT Capital's agent for service of process in the Province of Ontario is: Torys LLP, 79 Wellington St. W., 30th Floor, Box 270, TD South Tower, Toronto, Ontario M5K 1N2 Canada. 23. Name and address of AMBIT Capital's agent for service of process in the Province of Montréal is Torys Law Firm LLP, 1 Place Ville Marie, Suite 1919 Montréal, Québec H3B 2C3 Canada. Additional Disclaimer for Singapore Persons 24. This Report is prepared and distributed by Ambit Capital Private Limited and distributed as per the approved arrangement under Paragraph 9 of Third Schedule of Securities and Futures Act (CAP 289) and Paragraph
11 of the First Schedule to the Financial Advisors Act (CAP 110) provided to Ambit Singapore Pte. Limited by Monetary Authority of Singapore. 25. This Report is only available to persons in Singapore who are institutional investors (as defined in section 4A of the Securities and Futures Act (Cap. 289) of Singapore (the “SFA”).” Accordingly, if a Singapore Person is
not or ceases to be such an institutional investor, such Singapore Person must immediately discontinue any use of this Report and inform Ambit Singapore Pte. Limited. Disclosures 26. The analyst (s) has/have not served as an officer, director or employee of the subject company. 27. There is no material disciplinary action that has been taken by any regulatory authority impacting equity research analysis activities. 28. All market data included in this report are dated as at the previous stock market closing day from the date of this report. Analyst Certification Each of the analysts identified in this report certifies, with respect to the companies or securities that the individual analyses, that (1) the views expressed in this report reflect his or her personal views about all of the subject companies and securities and (2) no part of his or her compensation was, is or will be directly or indirectly dependent on the specific recommendations or views expressed in this report. © Copyright 2015 AMBIT Capital Private Limited. All rights reserved.
Ambit Capital Pvt. Ltd. Ambit House, 3rd Floor. 449, Senapati Bapat Marg, Lower Parel, Mumbai 400 013, India. Phone: +91-22-3043 3000 | Fax: +91-22-3043 3100 CIN: U74140MH1997PTC107598 www.ambitcapital.com


![VE] BJE@E - Latin Offroad · 2019. 4. 14. · mo`e spasiti bijeg u Kremnu ve} samo u Amazoniju PAMETNI SRBI VE] BJE@E U D@UNGLU ISKORAK U ISKON ALEKSANDAR BILANOVI] (36) ZEMLJANIN](https://img.pdfslide.net/doc/110x75/6065469fce88ce23cc6a51d8/ve-bjee-latin-offroad-2019-4-14-moe-spasiti-bijeg-u-kremnu-ve-samo-u.jpg)