Embed Size (px)
Citation preview
Ambit Capital and / or its affiliates do and seek to do business including investment banking with companies covered in its research reports. As a result, investors should be aware that Ambit Capital may have a conflict of interest that could affect the objectivity of this report. Investors should not consider this report as the only factor in making their investment decision.
Not a bad deal!
Pricing recovery in South/West India (+15% in last month) will drive improvement of Orient’s current business’ profitability; however, investors are apprehensive on the company’s recent acquisition of Jaypee’s East India assets (4.2 mn tonnes). Although weak pricing in East India will keep unitary EBITDA low in the initial years, yet we believe the deal is likely to be NPV positive in three out of four scenarios and do not think that leverage will jeopardise its balance sheet (FY19E net D/E: 0.6x). Also, concerns around SAIL’s approval/support for future expansions are unfounded, since it is in SAIL’s best interests to support the acquisition. We expect 9-50% increase in Orient’s current valuation (`216/share), in three out of four scenarios; the worst-case outcome is likely to dilute value by marginal 2%. Reinstate BUY from UNDER REVIEW.
Competitive position: MODERATE Changes to this position: POSITIVE East India: Low unitary EBITDA in initial years Whilst low-cost clinker production advantages at Devapur (̀ 300/tonne lower-than-industry average) will keep cost competitive in East India, low realisation will keep EBITDA/tonne low (blended `467/tonne) in FY18. As the pace of capacity expansion decelerates in East, pricing will improve thereby improving unitary EBITDA. Our scenario analysis suggests that 2%/3.5% realisation CAGR (net of cost increase) could increase FY20 unitary EBITDA to `607/724 tonne.
Not much to lose even in the worst case A well-negotiated price (>US$100/tonne) and limestone security in Central India (where limestone reserves are depleting), makes us believe that the deal will enhance shareholder value in the long term. Assuming prices improve by 3.5% CAGR over FY18-22E and SAIL agrees to support expansion at Satna, we expect 50% value enhancement. In the worst case, with none of the above going in Orient’s favour, the value dilution is likely to be 2%. Lastly, we expect net D/E of 0.6x in the worst case in FY19, which is not excessive in our view.
Concerns abating on the current operations Pricing recovery in core markets and better fixed cost recovery (`771/tonne in FY16 as against `515/tonne in FY14), as Karnataka operations scale up, will lead to a sharp uptick unitary EBITDA/tonne (`900 in FY18E vs `400 in FY16). Our estimates imply 19% volume and 8% unitary EBITDA CAGR over FY15-18.
Near-term valuation parameters do not paint the right picture The deal appears optically expensive on earnings-based valuation tools, such as EV/EBITDA, since the acquired assets are not likely to generate any significant EBITDA in the first few years. With capacity utilisation ramp-up, investor perception for the stock will change from a leveraged player to a high-quality mid-sized company with scope to play operating and financial leverage akin to Dalmia Cement is recent past. On current operations, the stock trades at 7.5x FY18 EV/EBITDA, against our implied valuation of 8.7x.
COMPANY INSIGHT ORCMNT IN EQUITY November 01, 2016
Orient CementBUY
Cement
Recommendation Mcap (bn): `34/US$0.5 6M ADV (mn): `36.8/US$0.6 CMP: `173 TP (12 mths): `216 Upside (%): 25
Flags Accounting: GREEN Predictability: AMBER Earnings Momentum: RED
Catalyst Demand/pricing recovery in
Maharashtra in 2HFY17 Approvals from SAIL for the
acquisition Unitary EBITDA improvement in
3QFY17
Performance (%)
Source: Bloomberg, Ambit Capital Research
75 85 95
105 115 125 135
Oct
-15
Dec
-15
Jan-
16
Ma
r-16
Apr
-16
Jun
-16
Jul-
16
Sep-
16
Oct
-16
SENSEX ORCMNT
Research Analysts
Nitin Bhasin
+91 22 3043 3241
Achint Bhagat, CFA
+91 22 3043 3178 [email protected]
Parita Ashar, CFA +91 22 3043 3223
Key financials
Year to March FY15 FY16 FY17E FY18E FY19E Net Revenues (` mn) 15,470 15,092 21,079 26,787 27,590 EBITDA (` mn) 3,067 1,834 3,795 6,427 7,381 PAT (` mn) 19.8 12.2 18.0 24.0 26.8 EPS (`) 9.5 3.0 4.0 12.4 15.6 RoE (%) 11.8 3.4 6.9 13.0 14.3 EV/EBITDA 15.6 25.8 12.5 7.4 6.4 EV/tonne 9,593 5,907 5,907 5,907 5,907 Source: Company, Ambit Capital research

Orient Cement
November 01, 2016 Ambit Capital Pvt. Ltd. Page 2
What’s the big deal? Orient Cement’s operations in South and West India are one of the most cost efficient amongst cement companies in India; recent price uptick in core markets (AP and Maharashtra) will improve unitary EBITDA from 2HFY17 onwards. In line with its vision of becoming a 15mn tonne cement manufacturer by 2020, Orient has acquired (subject to requisite approvals) Jaypee’s clinker and grinding units in Central and East India. Although the acquisition cost of ~US$100/tonne for the integrated Jaypee-SAIL Bhillai and Satna cement plants and ~US$40/tonne for the grinding unit at Nigrie appears well negotiated, investors worry that:
The company is trying to become too big too soon, which will have an adverse impact on its balance sheet (excess leverage).
East India is not a lucrative market anymore (post significant increase in installed capacities). Moreover, will Orient Cement be cost competitive as against other players with integrated cement plants in the same location?
With SAIL maintaining its 26% share in the business, isn’t there too much uncertainty around future expansions?
In this note, we assess the above mentioned investor concerns and believe that: (a) even the worst-case outcome, the deal will be 2% value dilutive; and (b) it is in SAIL’s own interest to come on board with Orient Cement.
We highlight that in the best-case scenario, there is a 51% upside possibility to our ex-deal TP of `216/share (considering a dilution of 15% to raise `7bn at `200/share).
A well-negotiated deal Orient Cement has entered into an agreement to acquire Jaypee’s cement assets, including: (a) 74% stake in Bhilai-Jaypee Cement Limited (BJCL) – this includes a 2.2mn tonne grinding unit in Bhilai (Chhattisgarh) and a 1.1mn tonne clinker unit in Satna (MP); and (b) acquisition of 2mt grinding unit at Nigrie (MP). We believe that the acquisition price of ~US100/tonne (lowest in the last decade as depicted in Exhibit 1 below) seems to be already discounting the uncertainty that comes with a JV partner being on board.
Exhibit 1: Orient-Jaypee valuation is one of the lowest in the last decade
Source: Company, Ambit Capital research
200
140 128 127 125 119 115 98 8565
0
50
100
150
200
250
Hol
cim
-AC
C
Bcor
p-Re
lianc
e
CRH
-MH
I
UTC
EM-J
PA (
Guj
)
Lafa
rge-
Nir
ma
HEI
D-M
ysor
e
UTC
EM-J
PA
Ori
ent-
JPA
DBL
-Cal
com
DBL
-Adh
unik
Valuation (USD/tonne)

Orient Cement
November 01, 2016 Ambit Capital Pvt. Ltd. Page 3
Exhibit 2: Basic details of the plant
Plant Type Clinker Grinding Grinding
Location Satna, MP Bhilai, Chattisgarh Nigrie, MP
Capacity (mtpa) 1.1 (can be increased to 1.3) 2.2 2.0
Seller BJCL for both Satna and Bhillai Jaypee Power Ventures
EV `14,500mn for Satna and Bhillai together `5,000mn
EV/tonne US$100/t US$40/tonne
Orient Cement's Stake 74% (26% with SAIL) 100%
CPP No No
Railway Siding Yes Yes
Type of Cement - PSC PPC
Power Source Grid
(~`6-7/unit) Bhillai Steel Plant JP Power Plant
Fly Ash / Slag - Slag from Bhilai Steel Plant at ~`700/t, minimal transportation cost
Fly Ash from JP Power at minimal transportation cost
Source: Company, Ambit Capital research
Architecture of the East India operations Inward logistics: Post the acquisition, Orient Cement plans to follow the below logistics structure to the following:
Clinker for Bhillai will be procured from Devapur instead of Satna: Orient Cement’s management realised that taking clinker from Satna to Bhillai was not attractive as; (a) clinker production cost at Satna is ~`2,000/tonne whereas at Devapur it is ~`1,500/tonne; and (b) distance from Devapur to Bhillai is 470km, lesser than that of Satna to Bhillai (550km). Hence, Orient Cement will be taking clinker from Devapur to Bhilai, which will reduce the landed cost of clinker by ~`500/t of clinker (~15-17%). This would also improve the utilisation of the Gulbarga unit (in the near term) as the company will now supply cement from Gulbarga to the markets of Central or Eastern Maharashtra, which were previously served by Devapur (similar distance). Eventually, the company ay have to increase the clinker capacity at Devapur to ensure optimum utilization of all grinding units (Jalgoan, Devapur and Bhillai).
Clinker for Nigrie will be procured from Satna: The clinker capacity at Satna would be utilised to provide clinker to the Nigrie grinding unit, which is at a distance of merely ~200km. The Nigrie grinding unit will give Orient Cement access to Bihar and Jharkhand, which are better markets then MP (Satna cluster).
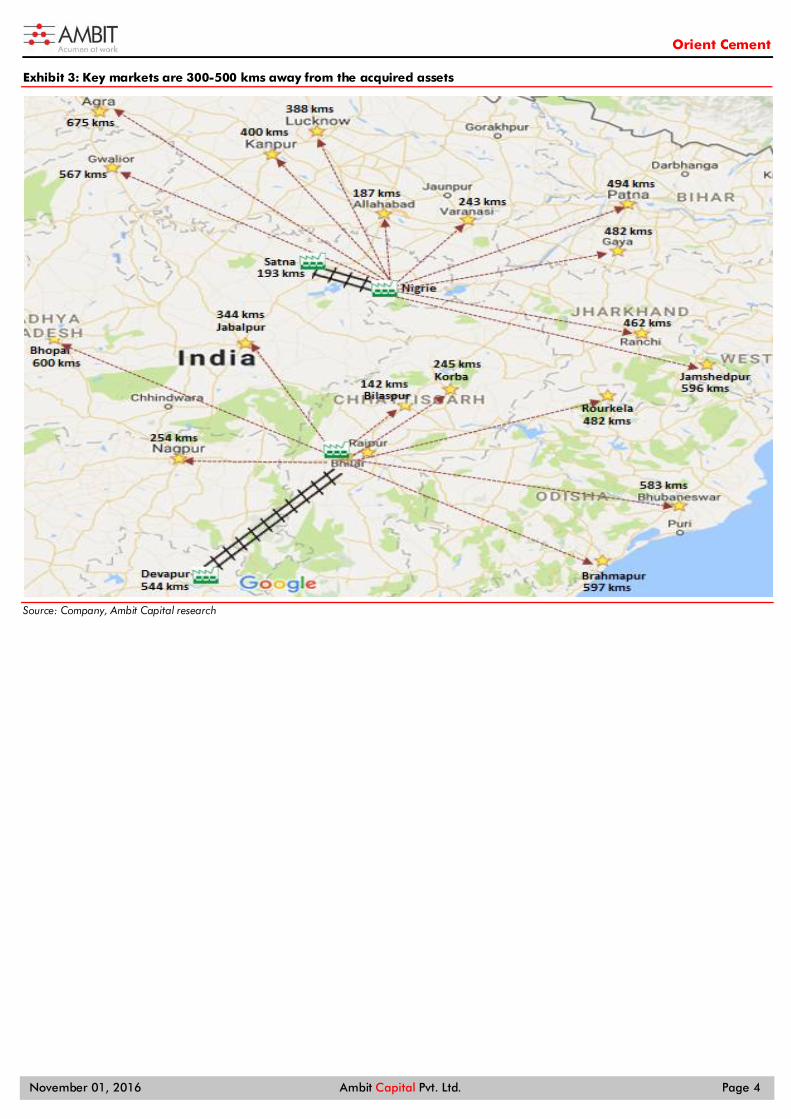
Outward logistics: We believe that Orient Cement will have to travel ~500kms to reach the target markets:
Bhillai grinding unit: Key markets that the Bhillai unit would be servicing are Chattisgarh, Odisha, Eastern Maharashtra and Southern MP. As depicted in Exhibit 3 below, most of the key markets are ~300-500kms away from Bhillai.
Nigrie grinding unit: Key markets that the Nigrie unit would be servicing are Bihar, Jharkhand, Uttar Pradesh and Madhya Pradesh. As depicted in Exhibit 3 below, even for the Nigrie unit, most of the key markets are ~300-500kms away from Nigrie.
For our scenario analysis, we assume an average lead distance of ~500km from each plant and hence, outward freight of ~800/tonne (~`1.6/km).
Orient Cement
November 01, 2016 Ambit Capital Pvt. Ltd. Page 4
Exhibit 3: Key markets are 300-500 kms away from the acquired assets
Source: Company, Ambit Capital research

Orient Cement
November 01, 2016 Ambit Capital Pvt. Ltd. Page 5
Exhibit 4: Key markets for the acquired plants
Market Distance from plant
(km) Comments on recent pricing trends
Nigrie Cement Plant (2MTPA)
Bihar
A premium market but entry of Shree Cement has diluted the pricing premium. However, growth remains strong and it is largely a slag cement-based market.
Patna, Gaya, Muzaffarpur, Arrah 400-500
Jharkhand
Top-3 brands account for ~70% of the overall sales, hence prices remain steady here. Jharkhand also has a high proportion of slag cement use.
Ranchi 400-500
Jamshedpur, Bokaro, Ranchi, Dhanbad
600-700
Madhya Pradesh
Whilst pricing was affected in the last few years, Jaypee's exit has improved pricing discipline. A highly consolidated market.
Jabalpur 200-300
Satna 200-300
Bhopal 500-600
Gwalior 500-600
Uttar Pradesh
Much like MP, prices in UP improved post exit of Jaypee. Pick-up in rural income will benefit the state disproportionately as the state is highly rural-dependent.
Allahabad 100-200
Varanasi 200-300
Lucknow, Kanpur 300-400
Jhansi 400-500
Agra 600-700
Bhilai Cement Plant (2MTPA)
Market Distance from plant Comments
Orissa
Pricing remains stable despite entry of new players, however no major demand improvement. Largely a slag cement market.
Rourkela 400-500
Brahmapur, Bhubaneshwar, Cuttack
500-600
Chhattisgarh Pricing has been affected since multiple players have entered the market. Largely a PPC
cement market. Korba, Bilaspur 0-100
Raipur, Bhilai, Durg 200-300
Source: Company, Ambit Capital research

Orient Cement
November 01, 2016 Ambit Capital Pvt. Ltd. Page 6
East India – A premium market losing its sheen… East India has historically been one of the most favoured markets for cement companies, given that it has been a cement deficit market, which helped the companies command premium pricing. However, over the last five years, large capacity additions by several manufacturers from other regions (Shree, JK Lakshmi) and new entrants, such as Emami Cement, have resulted in capacity CAGR of 9% over FY10-15. Demand growth (of 7% CAGR) however could not match capacity growth, resulting in declining utilisations, especially in Chhattisgarh.
Exhibit 5: Capacity utilisation down from 85% in FY10 to 77% in FY15
Source: Ambit Capital research
Although demand growth in East India has been higher than most other regions, the rising prominence of volume-focused players, such as Shree, JK Lakshmi and now Orient Cement will lead to weak pricing in the market. Pricing growth in East will be the lowest amongst Indian regions. As a result, the premium pricing of the market has started to wane and has dropped sharply in states, such as Chhattisgarh.
Exhibit 6: Entry of new players…
Source: Company, Ambit Capital research
Exhibit 7: …has increased…
Source: Company, Ambit Capital research
Exhibit 8: …fragmentation
Source: Company, Ambit Capital research. Lafarge’s assets have been acquired by Nirma
Exhibit 9: East India (ex-Chhattisgarh) – volatile prices, barely crossing past highs
Source: Ambit Capital research
70%
75%
80%
85%
90%
0
10
20
30
40
50
60
FY10 FY11 FY12 FY13 FY14 FY15
Capacity Volumes Utilisation - RHS
UTCEM, 23.5%
Lafarge, 18.4%
ACEM, 14.6%OCL,
6.4%
ACC, 17.3%
Shree, 0.0% Others,
19.8%
Capacity share:FY09UTCEM, 23.3%
Lafarge, 19.0%
ACEM, 12.9%OCL,
12.7%
ACC, 12.1%
Shree, 9.5%
Others, 10.5%
Capacity share:FY16UTCEM, 20.0%
Nirma*, 14.0%
ACEM, 9.6%
OCL, 11.7%ACC,
14.2%
Shree, 14.0%
Others, 16.5%
Capacity share:FY18
250
270
290
310
330
350
370
390
Apr
-14
Jun-
14
Aug
-14
Oct
-14
Dec
-14
Feb-
15
Apr
-15
Jun-
15
Aug
-15
Oct
-15
Dec
-15
Feb-
16
Apr
-16
Jun-
16
Aug
-16
Oct
-16
East Cement prices (`/50kg bag)

Orient Cement
November 01, 2016 Ambit Capital Pvt. Ltd. Page 7
..but, structurally a good market to be in: Orient will largely be servicing the East and Central markets from these plants.
East India is currently grappling with a sharp rise in installed capacities, which has led to a decline in the premium realisations. However, we believe that the capacity expansion in the region will decelerate post FY18 (once Shree and JK Lakshmi’s expansions are complete). Moreover, given that the region’s cement consumption is significantly lower than other Indian states, we expect East Indian states, such as Bihar and Jharkhand to continue growing at a fast pace (Bihar and Jharkhand have been the fastest growing cement markets in India in the last five years). We expect ~10mt of capacity additions in East (Chattisgarh) over FY17-18E, but only ~2mt in WB is announced thereafter.
Central India: The two Central Indian states, Uttar Pradesh and Madhya Pradesh, have historically lagged most other Indian states in terms of economic prosperity. They are classified as Bimaru states (alongside Rajasthan and Bihar) due to slow economic growth. The per capita income of Central India is the lowest in India (see table below) due to lack of industrial development, poor public infrastructure, such as roads/power and poor governance. A pick-up in infrastructure construction and real estate development (due to development of NCR) pushed up volume growth in Central India significantly higher that India’s average (6.5% CAGR over FY10-15 vs 4.3% for India) is in line with other fast growing regions, such as North and East India.
Exhibit 10: Per capita cement consumption in Central and East India is significantly lower than other markets
Region Agri GDP Construction GSDP GSDP
Per Capita GSDP
PCCC (Kgs)
FY15 CAGR FY10-15 FY15 CAGR
FY10-15 FY15 CAGR FY10-15 FY15* FY15*
North 19% 5.2% 17% 3.0% 19% 7.0% 57,633 296
West 16% 7.7% 24% 10.4% 25% 7.6% 74,429 293
Central 24% 8.2% 12% 4.6% 13% 6.8% 23,931 162
East 22% 3.9% 23% 9.5% 19% 7.0% 28,458 135
South 18% 1.8% 24% 5.6% 24% 6.7% 47,775 243
Source: RBI Docs, Ambit capital research * we use population as per the census document of 2011. PCCC- per capita cement consumption
Exhibit 11: States such as Bihar and Jharkhand are amongst the fastest growing cement markets
Source: RBI Docs, Ambit Capital research.
0%
2%
4%
6%
8%
10%
12%
Biha
r
Jhar MP
Raj.
Guj
.
TN
Mah
.
Del
hi
Har
.
Kar,
WB
Ker
UP
CH
TG AP
Pun.
Odi
.
FY10-15 GSDP CAGR

Orient Cement
November 01, 2016 Ambit Capital Pvt. Ltd. Page 8
SAIL unlikely to create a hurdle Our interactions with industry participants suggest that despite the BJCL assets being in the market for a couple of years now, Jaypee was unable to sell as the potential bidders wanted to acquire a 100% stake (Jaypee + SAIL) whereas SAIL was unwilling to sell as SAIL owns the limestone mines. In the case of this acquisition, SAIL remains a 26% JV partner in BJCL, which in our view has its pros and cons. We discuss below that, whilst investor concerns are understandable, we believe the downside is limited.
Contract renewals by SAIL: BJCL is dependent on SAIL for: (a) limestone for the Satna clinker (since SAIL owns the mines); (b) slag for blending at the Bhillai grinding unit (from SAIL’s Bhillai Steel plant); and (c) power for Bhillai grinding unit (from Bhillai Steel plant). In our view, given these cement plants are non-operational at the moment, it would be SAIL’s interest to renew the contracts as a new JV partner would revive these assets and improve SAIL’s return on these investments.
Transfer price of clinker: Whilst convincing SAIL to renew the raw material supply contracts is a relatively easier task, the key variable remains the price at which these are transferred. Orient would have to negotiate the following prices with SAIL:
(a) Price of clinker sold by BJCL to Nigrie grinding unit (as SAIL has a 26% stake in BJCL but no stake in Nigrie unit. For our scenario analysis, we assume clinker transfer price of `2,000/tonne from Satna to Nigrie.
(b) Price of slag and power supplied to Bhillai grinding unit by Bhillai Steel plant. We note that SAIL currently sells slag to BJCL at ~`700/tonne, which in our view is higher than the market and could be renegotiated by Orient. For our scenario analysis, we conservatively assume slag sale price to continue at `700/tonne and power price of `7/unit.
(c) Price of clinker sold by Orient’s Devapur plant to Bhillai grinding unit. For our scenario analysis, we assume clinker transfer price of `1,500/tonne from Devapur to Bhillai units.
SAIL’s approval required for all future acquisition: We are cognizant of the fact that despite large limestone reserves with SAIL, the expansion prospects of these assets would require SAIL’s consent (by way of either equity infusion or equity dilution). We believe it is difficult to judge whether and how SAIL would come on board and hence, we do a scenario analysis assuming: (a) no capacity expansion; and (b) 2.5x capacity expansion of the Satna clinker unit and a set-up of a new grinding unit linked to Satna over FY18-22E.
Orient is at a locational disadvantage… Nigrie – Orient not as competitive as local players in demand markets
Bihar is currently a ~9mt cement market (15% of east India). Due to the lack of limestone reserves in Bihar, it has been a cement deficit market. However, in the last 3 years, capacity has grown from ~1mt to 5mt post capacity additions by Shree and UltraTech. Although Bihar still remains in deficit (9mt demand vs 5mt production) and has better pricing than Chattisgarh, Orient will be at a disadvantage compared to peers Shree and UltraTech whose grinding units are closer to the market. Jharkhand is also a cement surplus market (9mt capacity vs 5mt demand) and hence, Orient would have to compete with local players with large capacities, such as Lafarge (4.6mt grinding unit), Dalmia (2.1mt grinding unit in Bokaro) and ACC (1.8mt capacity). Moreover, Jharkhand and Bihar are slag-based cement markets and hence, Orient’s fly ash based Nigrie unit will be at a cost disadvantage compared to local players in Jharkhand due to lower blending.

Orient Cement
November 01, 2016 Ambit Capital Pvt. Ltd. Page 9
Exhibit 12: Supply structure in East and Central India
Source: Ambit Capital research
Bhillai – Demand market faces severe pricing pressures
The Bhillai grinding unit is a Chhattisgarh-based slag cement unit which would be running on clinker from Orient’s Devapur plant. As depicted in exhibit above, Chhattisgarh and Odisha have significant integrated cement plants that are based on locally produced clinker and hence, Orient will be at a disadvantage. Higher clinker cost in the case of Orient will be partially offset by higher blending ratio (~35% in case of the other plants in Chhattisgarh as most are based on fly ash vs ~65% for Orient as Bhillai is slag based). We highlight that whilst pricing in Orissa is healthy (balance between capacity and demand), pricing in Chhattisgarh is severely depressed (`220/50kg bag in Chhattisgarh vs `330/50kg bag in Bihar/Jharkhand and Odisha) given high surplus – 7mt demand vs 23t capacity.
…yet the deal is not value dilutive Whilst Orient will incur additional freight (~`300/tonne) to transport clinker from Devapur to Bhilai, we believe that the low-cost advantage at Devapur (clinker production cost of `1,500/tonne as against `1,800-1,900 for most other players), will offset the cost disadvantage. Whilst we have limited data around the economics of the plants, we work out the likely unitary EBITDA based on the basic cost details:
Devapur – Bhilai Unit – Assuming clinker transfer from the Devapur plant, building in all the related overheads and assuming that the price per bag is similar to the current market price, we expect unitary EBITDA of `225/tonne.
Capacities in East and Central India No Company
Capa-city Place State
1 Kalyanpur Cement 1.0 Banjari Bihar
2 Shree Cement 2.0 Aurangabad Bihar
3 Ultratech (G) 1.6 Pataliputra Bihar
4 Lafarge India (G) 4.6 Singhbhum JHK
5 Bokaro Jaypee (G) 2.1 Bokaro JHK
6 ACC Ltd. 0.9 Chaibasa JHK
7 ACC Ltd. (G) 0.9 Sindri JHK
8 UltraTech Cement Ltd (G)
1.0 Jharsuguda Orissa
9 OCL India 4.0 Rajgangpur Orissa
10 OCL India (G) 0.1 Kapilas Orissa
11 ACC - Bargarg Cement Works
2.1 Bargarh Orissa
12 Shiva Cement 0.6 Kutra(SunderGarh)
Orissa
13 Birla Corpn. Ltd. (G) 2.3 Durgapur WB
14 UltraTech Cmt. Ltd. (G)
1.2 Durgapur WB
15 Lafarge India (P) Ltd. (G) 1.0 Mejia WB
16 Ramco Cement (G) 1.0 Kolaghat WB
17 ACC Ltd (G) 0.5 Purulia WB
18 Ambuja Cement (G) 1.0 Sankrail WB
19 Ambuja Cement (G) 1.3 Farakka WB
20 OCL india 1.4 Medinipur WB
21 Sonar Bangla-B.K.Birla (G) 1.5 Sagardighi WB
22 Century Cement 2.1 Raipur CHG
23 UltraTech Cement 2.5 Raipur CHG
24 UltraTech Cement 1.9 Hirmi CHG
25 CCI Ltd. 0.4 Akaltara CHG
26 CCI Ltd. 0.4 Mandhar CHG
27 Lafarge India (P) Ltd. 1.6 Bilaspur CHG
28 Lafarge India (P) Ltd 0.6 Sonadih CHG
29 Bhilai Jaypee (G) 2.2 Bhilai CHG
30 ACC Ltd. 1.6 Jamul CHG
31 Ambuja Cement 3.2 Bhatapara CHG
32 Grasim 4.8 Raipur CHG
33 Shree Cement 2.0 Raipur CHG
34 JK Lakshmi 2.7 Durg CHG
35 Birla Cement 0.6 Raebareli UP
36 Heidelberg Cement 0.5 Jhansi UP
37 Jaypee Cement 0.5 Dalla UP
38 Jaypee Cement (G) 2.5 Chunar UP
39 Jaypee Cement (G) 0.6 Sadva Khurd UP
40 Jaypee Cement (G) 1.0 Tanda UP
41 Jaypee Cement (G) 1.1 Sikandrabad UP
42 UltraTech Cement (G) 1.3 Dadri UP
43 UltraTech Cement (G) 1.3 Koil UP
44 ACC Ltd (G) 2.3 Tikaria UP
45 Ambuja Cement (G) 1.5 Dadri UP
46 Birla Vikas 1.6
Satna MP
47 Satna Cement Satna MP
48 Maihar Cement 3.8 Maihar MP
49 UltraTech Cement 3.0 Jawad Road MP
50 Heidelberg Cement 1.0 Damoh MP
51 CCI Ltd. 0.4 Neemuch MP
52 Jaypee Cement 3.0 Rewa MP
53 Jaypee Cement 4.9 Bela MP
54 Jaypee Cement 1.5 Sidhi MP
55 Prism Cement 5.6 Satna MP
56 ACC Ltd 2.2 Kymore MP
57 Emami Cement 2.5 Risda CHG
58 Jaypee 2.1 Nigrie MP
Source: Ambit Capital Research

Orient Cement
November 01, 2016 Ambit Capital Pvt. Ltd. Page 10
Exhibit 13: Expect unitary EBITDA of ̀ 225/tonne
Cost head Cost Multiple Cost/tonne Comments
Clinker cost 1500 0.33 495 Assuming 3:1 clinker to cement conversion
Transportation 1000 0.33 330 Assuming 3:1 clinker to cement conversion
Slag 700 0.7 490 Cost/tonne of slag agreed with SAIL
Gypsum 1000 0.05 50 Power 210 1 210 Cost for grinding assumimg 30 units for grinding at
`7/unit
Freight 800 1 800 Assuming 500kms lead distance at `1.6 per tonne km
Others 600 1 600 Assuming fixed costs based on current operations
Employee 200 1 200 Assuming employee costs based on current operations
Total costs 3,175 Spot Realisation 3400 Assuming realisation of `220/bag
EBITDA 225 Source: Company, Ambit Capital research
Satna-Nigrie unit – Assuming clinker transfer from the Satna plant at `2,000/tonne (current manufacturing cost), building in all the related overheads and assuming that the price per bag is similar to the current market price, we expect unitary EBITDA of `675/tonne
Exhibit 14: Expect unitary EBITDA of `675/tonne Cost head Cost Multiple Cost/tonne Comments
Clinker cost 2000 0.7 1,400 Assuming clinker:cement conversion ratio of 1.4
Transportation 320 0.7 225 Assuming clinker:cement conversion ratio of 1.4
Fly Ash 300 0.3 90 Based on current price of fly ash
Power 210 1 210 Cost for grinding assumimg 30 units for grinding at `7/unit
Freight 800 1 800 Assuming 500kms lead distance at `1.6 per tonne km
Others 600 1 600 Assuming fixed costs based on current operations
Employee 200 1 200 Assuming employee costs based on current operations
Total costs 3370 3,525 Spot Realisation 4,200 Assuming realisation of `320/bag
EBITDA 675 Source: Company, Ambit Capital research
What are we not building in?
We are not assuming efficiency benefits at Devapur, given that the plant will be operating at full utilisation (as against ~85% utilisation currently). Moreover, the fixed overheads assumptions are based on a reasonable utilisation level of 70-75%, if the utilisation is lower fixed costs per tonne will increase.
We build in four scenarios, assuming two key uncertainties:
Capacity expansion is dependent on SAIL: As discussed above (page 8), whilst it is highly likely that SAIL will come on board to renew the limestone, slag and power supply agreement, it remains unpredictable whether it would support Orient in future expansions.
Profitability in East India: Our analysis of East India markets (page 6-7) and Orient’s position relative to peers in the region suggests that although Orient is worse off compared to its peers, the East India market per se is better placed relative to rest of the country. Although pricing is depressed currently, there is demand potential and profitability of Orient’s acquired assets would depend on competitive intensity in the region two years from now.
Orient Cement
November 01, 2016 Ambit Capital Pvt. Ltd. Page 11
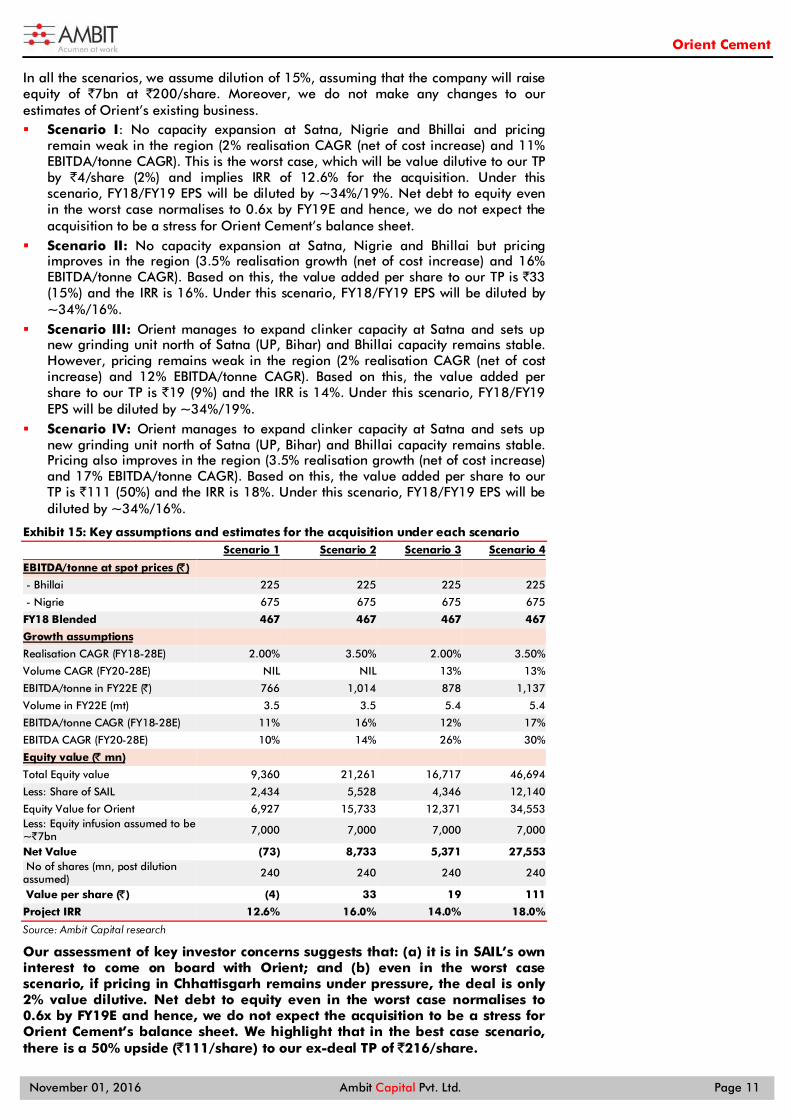
In all the scenarios, we assume dilution of 15%, assuming that the company will raise equity of `7bn at `200/share. Moreover, we do not make any changes to our estimates of Orient’s existing business. Scenario I: No capacity expansion at Satna, Nigrie and Bhillai and pricing
remain weak in the region (2% realisation CAGR (net of cost increase) and 11% EBITDA/tonne CAGR). This is the worst case, which will be value dilutive to our TP by `4/share (2%) and implies IRR of 12.6% for the acquisition. Under this scenario, FY18/FY19 EPS will be diluted by ~34%/19%. Net debt to equity even in the worst case normalises to 0.6x by FY19E and hence, we do not expect the acquisition to be a stress for Orient Cement’s balance sheet.
Scenario II: No capacity expansion at Satna, Nigrie and Bhillai but pricing improves in the region (3.5% realisation growth (net of cost increase) and 16% EBITDA/tonne CAGR). Based on this, the value added per share to our TP is `33 (15%) and the IRR is 16%. Under this scenario, FY18/FY19 EPS will be diluted by ~34%/16%.
Scenario III: Orient manages to expand clinker capacity at Satna and sets up new grinding unit north of Satna (UP, Bihar) and Bhillai capacity remains stable. However, pricing remains weak in the region (2% realisation CAGR (net of cost increase) and 12% EBITDA/tonne CAGR). Based on this, the value added per share to our TP is `19 (9%) and the IRR is 14%. Under this scenario, FY18/FY19 EPS will be diluted by ~34%/19%.
Scenario IV: Orient manages to expand clinker capacity at Satna and sets up new grinding unit north of Satna (UP, Bihar) and Bhillai capacity remains stable. Pricing also improves in the region (3.5% realisation growth (net of cost increase) and 17% EBITDA/tonne CAGR). Based on this, the value added per share to our TP is `111 (50%) and the IRR is 18%. Under this scenario, FY18/FY19 EPS will be diluted by ~34%/16%.
Exhibit 15: Key assumptions and estimates for the acquisition under each scenario
Scenario 1 Scenario 2 Scenario 3 Scenario 4
EBITDA/tonne at spot prices (̀ ) - Bhillai 225 225 225 225
- Nigrie 675 675 675 675
FY18 Blended 467 467 467 467
Growth assumptions
Realisation CAGR (FY18-28E) 2.00% 3.50% 2.00% 3.50%
Volume CAGR (FY20-28E) NIL NIL 13% 13%
EBITDA/tonne in FY22E (̀ ) 766 1,014 878 1,137
Volume in FY22E (mt) 3.5 3.5 5.4 5.4
EBITDA/tonne CAGR (FY18-28E) 11% 16% 12% 17%
EBITDA CAGR (FY20-28E) 10% 14% 26% 30%
Equity value (̀ mn) Total Equity value 9,360 21,261 16,717 46,694
Less: Share of SAIL 2,434 5,528 4,346 12,140
Equity Value for Orient 6,927 15,733 12,371 34,553 Less: Equity infusion assumed to be ~`7bn 7,000 7,000 7,000 7,000
Net Value (73) 8,733 5,371 27,553 No of shares (mn, post dilution assumed) 240 240 240 240
Value per share (̀ ) (4) 33 19 111
Project IRR 12.6% 16.0% 14.0% 18.0%
Source: Ambit Capital research
Our assessment of key investor concerns suggests that: (a) it is in SAIL’s own interest to come on board with Orient; and (b) even in the worst case scenario, if pricing in Chhattisgarh remains under pressure, the deal is only 2% value dilutive. Net debt to equity even in the worst case normalises to 0.6x by FY19E and hence, we do not expect the acquisition to be a stress for Orient Cement’s balance sheet. We highlight that in the best case scenario, there is a 50% upside (`111/share) to our ex-deal TP of `216/share.

Orient Cement
November 01, 2016 Ambit Capital Pvt. Ltd. Page 12
Proforma financials under each Scenario Scenario I: No capacity expansion at Satna, Nigrie and Bhillai and pricing remain weak in the region (2% realisation CAGR (net of cost increase) and 11% EBITDA/tonne CAGR). This is the worst case, which will be value dilutive to our TP by `4/share (2%) and IRR of 12.6%. Under this scenario, FY18/FY19 EPS will be diluted by ~34%/19%. Net debt to equity even in the worst case normalizes to 0.6x by FY19 and hence, we do not expect the acquisition to be a stress for Orient Cement’s balance sheet.
Exhibit 16: Scenario 1 - 2% realisation growth (net of cost increase), 11% EBITDA/t CAGR over FY18-28E and no capacity expansion
Particulars Jaypee's assets Existing operations Consolidated
FY18 FY19 FY20 FY21 FY22 FY18 FY19 FY20 FY21 FY22 FY18 FY19 FY20 FY21 FY22
P&L drivers
Capacity (mtpa) 4.2 4.2 4.2 4.2 4.2 8 8 8 11 11 12.2 12.2 12.2 15.2 15.2
Utilisation (%) 41% 64% 83% 83% 83% 88% 88% 89% 80% 85% 109% 121% 133% 154% 161%
Volumes (mt) 1.7 2.7 3.5 3.5 3.5 7.0 7.0 7.2 8.8 9.4 8.7 9.7 10.6 12.3 12.9
EBITDA/tonne (̀ ) 561 606 658 717 776 907 1,043 1,158 1,285 1,388 847 929 1,002 1,131 1,229
EBITDA (` mn) 971 1,638 2,293 2,497 2,704 6,427 7,381 8,360 11,394 13,133 7,398 9,019 10,653 13,891 15,837 Less: Depreciation (` mn) 586 604 623 642 662 1,523 1,546 1,569 2,077 2,591 2,110 2,151 2,192 2,719 3,254
EBIT (̀ mn) 385 1,034 1,670 1,855 2,042 4,904 5,835 6,791 9,317 10,542 5,288 6,869 8,461 11,172 12,584 Less:Interest (` mn) 1,011 1,039 1,040 1,021 1,018 1,176 1,124 1,023 922 895 2,187 2,163 2,063 1,942 1,913
PBT (̀ mn) (627) (6) 630 834 1,024 3,728 4,711 5,768 8,395 9,647 3,101 4,705 6,398 9,230 10,671
Less: Taxes (̀ mn) - - - - - 1,193 1,507 1,788 2,603 2,990 1,193 1,507 1,788 2,603 2,990 Less: Minority (` mn) (163) (1) 110 145 178 PAT (` mn) (464) (4) 520 689 846 2,535 3,203 3,980 5,793 6,656 1,908 3,198 4,610 6,627 7,680
No of Shares (mn) 35 35 35 35 35 205 205 205 205 205 240 240 240 240 240
EPS (`) (13.3) (0.1) 14.9 19.7 24.2 12.4 15.6 19.4 28.3 32.5 8.0 13.3 19.2 27.6 32.0
Balance Sheet
Equity 20,037 23,077 27,264 33,397 40,521
Net Debt 19,239 14,821 9,395 1,891 (8,068)
Ratios
Net Debt /Equity 1.0 0.6 0.3 0.1 (0.2)
Net Debt/EBITDA 2.7 1.7 0.9 0.1 (0.5)
Pre-tax RoCE 12.5% 16.6% 21.2% 29.3% 35.0%
Post-tax RoCE 9.6% 12.8% 16.3% 21.8% 25.8%
Valuation
EV/EBITDA (X) 9.2 7.6 6.4 4.8 4.2
EV/tonne (`) 5,472 5,472 5,472 5,472 5,472
EV/tonne (USD) 82 82 82 82 82
Source: Company, Ambit Capital research

Orient Cement
November 01, 2016 Ambit Capital Pvt. Ltd. Page 13
Scenario II: No capacity expansion at Satna, Nigrie and Bhillai but pricing improves in the region (3.5% realisation growth (net of cost increase) and 16% EBITDA/tonne CAGR). Based on this, the value added per share to our TP is `33 (15%) and the IRR is 16%. Under this scenario, FY18/ FY19 EPS will be diluted by ~34%/16%.
Exhibit 17: Scenario 2 – 3.5% realisation growth (net of cost increase), 16% EBITDA/t CAGR over FY18-28E and no capacity expansion
Particulars Jaypee's assets Existing operations Consolidated
FY18 FY19 FY20 FY21 FY22 FY18 FY19 FY20 FY21 FY22 FY18 FY19 FY20 FY21 FY22
P&L drivers
Capacity (mtpa) 4.2 4.2 4.2 4.2 4.2 8 8 8 11 11 12.2 12.2 12.2 15.2 15.2
Utilisation (%) 41% 64% 83% 83% 83% 88% 88% 89% 80% 85% 72% 80% 87% 81% 85%
Volumes (mt) 1.7 2.7 3.5 3.5 3.5 7.0 7.0 7.2 8.8 9.4 8.7 9.7 10.6 12.3 12.9
EBITDA/tonne (̀ ) 467 590 724 867 1,014 907 1,043 1,158 1,285 1,388 829 925 1,023 1,173 1,294
EBITDA (` mn) 807 1,596 2,523 3,020 3,534 6,427 7,381 8,360 11,394 13,133 7,234 8,978 10,883 14,413 16,668 Less: Depreciation (` mn) 586 604 623 642 662 1,523 1,546 1,569 2,077 2,591 2,109 2,150 2,192 2,719 3,254
EBIT (̀ mn) 221 992 1,900 2,377 2,872 4,904 5,835 6,791 9,317 10,542 5,125 6,827 8,690 11,695 13,414 Less:Interest (` mn) 1,017 1,053 1,052 1,017 983 1,176 1,124 1,023 922 895 2,193 2,177 2,075 1,939 1,878
PBT (̀ mn) (796) (61) 847 1,360 1,889 3,728 4,711 5,768 8,395 9,647 2,932 4,650 6,615 9,756 11,536
Less: Taxes (̀ mn) - - 280 449 623 1,193 1,507 1,788 2,603 2,990 1,193 1,507 2,068 3,051 3,614 Less: Minority (` mn) (207) (16) 148 237 329 (207) (16) 148 237 329
PAT (` mn) (589) (45) 420 674 937 2,535 3,203 3,980 5,793 6,656 1,946 3,158 4,400 6,467 7,593
No of Shares (mn) 35 35 35 35 35 205 205 205 205 205 240 240 240 240 240
EPS (`) (16.8) (1.3) 12.0 19.3 26.8 12.4 15.6 19.4 28.3 32.5 8.1 13.2 18.3 27.0 31.7
Balance Sheet
Equity 20,037 23,195 27,595 34,062 41,655
Net Debt 19,239 14,667 8,971 1,034 (9,539)
Ratios
Net Debt /Equity 1.0 0.6 0.3 0.0 (0.2)
Net Debt/EBITDA 2.7 1.6 0.8 0.1 (0.6)
Pre-tax RoCE 12.5% 16.9% 22.3% 30.9% 37.4%
Post-tax RoCE 9.6% 13.2% 17.0% 22.9% 27.3%
Valuation
EV/EBITDA (X) 9.2 7.4 6.1 4.6 4.0
EV/tonne (`) 5,472 5,472 5,472 4,392 4,392
EV/tonne (USD) 82 82 82 66 66
Source: Company, Ambit Capital research

Orient Cement
November 01, 2016 Ambit Capital Pvt. Ltd. Page 14
Scenario III: Orient manages to expand clinker capacity at Satna and sets up new grinding unit north of Satna (UP, Bihar) and Bhillai capacity remains stable. However, pricing remains weak in the region (2% realization CAGR (net of cost increase) and 12% EBITDA/tonne CAGR). Based on this, the value added per share to our TP is `19 (9%) and the IRR is 14%. Under this scenario, FY18/FY19 EPS will be diluted by ~34%/19%.
Exhibit 18: Scenario 3 - 2% realisation growth (net of cost increase), 12% EBITDA/t CAGR over FY18-28E and 13% volume CAGR over FY20-28E
Particulars Jaypee's assets Existing operations Consolidated
FY18 FY19 FY20 FY21 FY22 FY18 FY19 FY20 FY21 FY22 FY18 FY19 FY20 FY21 FY22
P&L drivers
Capacity (mtpa) 4.2 4.2 4.2 4.2 4.2 8 8 8 11 11 12.2 12.2 12.2 15.2 15.2
Utilisation (%) 41% 64% 83% 104% 129% 88% 88% 89% 80% 85% 72% 80% 87% 87% 97%
Volumes (mt) 1.7 2.7 3.5 4.4 5.4 7.0 7.0 7.2 8.8 9.4 8.7 9.7 10.6 13.2 14.8
EBITDA/tonne (̀ ) 467 533 607 797 878 907 1,043 1,158 1,285 1,388 829 909 985 1,129 1,208
EBITDA (` mn) 807 1,442 2,114 3,489 4,748 6,427 7,381 8,360 11,394 13,133 7,234 8,823 10,474 14,883 17,881 Less: Depreciation (` mn) 586 604 1,245 1,283 1,323 1,523 1,546 1,569 2,077 2,591 2,109 2,150 2,814 3,360 3,914
EBIT (̀ mn) 221 837 869 2,206 3,425 4,904 5,835 6,791 9,317 10,542 5,125 6,673 7,660 11,523 13,967 Less:Interest (` mn) 1,017 1,059 1,819 2,591 2,646 1,176 1,124 1,023 922 895 2,193 2,183 2,842 3,513 3,542
PBT (̀ mn) (796) (221) (950) (385) 778 3,728 4,711 5,768 8,395 9,647 2,932 4,490 4,818 8,010 10,425
Less: Taxes (̀ mn) - - (313) (127) 257 1,193 1,507 1,788 2,603 2,990 1,193 1,507 1,475 2,476 3,247 Less: Minority (` mn) (207) (58) (165) (67) 136 (207) (58) (165) (67) 136
PAT (` mn) (589) (164) (471) (191) 386 2,535 3,203 3,980 5,793 6,656 1,946 3,040 3,509 5,602 7,042
No of Shares (mn) 35 35 35 35 35 205 205 205 205 205 240 240 240 240 240
EPS (`) (16.8) (4.7) (13.5) (5.5) 11.0 12.4 15.6 19.4 28.3 32.5 8.1 12.7 14.6 23.4 29.4
Balance Sheet
Equity 20,037 23,077 26,586 32,188 39,230
Net Debt 19,239 14,821 9,690 2,444 (7,697)
Ratios
Net Debt /Equity 1.0 0.6 0.4 0.1 (0.2)
Net Debt/EBITDA 2.7 1.7 0.9 0.2 (0.4)
Pre-tax RoCE 12.5% 16.6% 19.8% 31.2% 40.4%
Post-tax RoCE 9.6% 12.8% 16.0% 24.5% 31.0%
Valuation
EV/EBITDA (X) 9.2 7.6 6.4 4.5 3.7
EV/tonne (`) 5,472 5,472 5,472 4,392 4,392
EV/tonne (USD) 82 82 82 66 66
Source: Company, Ambit Capital research

Orient Cement
November 01, 2016 Ambit Capital Pvt. Ltd. Page 15
Scenario IV: Orient manages to expand clinker capacity at Satna and sets up new grinding unit north of Satna (UP, Bihar) and Bhillai capacity remains stable. Pricing also improves in the region (3.5% realisation growth (net of cost increase) and 17% EBITDA/tonne CAGR). Based on this, the value added per share to our TP is `111 (50%) and the IRR is 18%. Under this scenario, FY18/FY19 EPS will be diluted by ~34%/16%.
Exhibit 19: Scenario 4 – 3.5% realisation growth (net of cost increase), 17% EBITDA/t CAGR over FY18-28E and 13% volume CAGR over FY20-28E
Particulars Jaypee's assets Existing operations Consolidated
FY18 FY19 FY20 FY21 FY22 FY18 FY19 FY20 FY21 FY22 FY18 FY19 FY20 FY21 FY22
P&L drivers
Capacity (mtpa) 4.2 4.2 4.2 4.2 4.2 8 8 8 11 11 12.2 12.2 12.2 15.2 15.2
Utilisation (%) 41% 64% 83% 104% 129% 88% 88% 89% 80% 85% 72% 80% 87% 87% 97%
Volumes (mt) 1.7 2.7 3.5 4.4 5.4 7.0 7.0 7.2 8.8 9.4 8.7 9.7 10.6 13.2 14.8
EBITDA/tonne (̀ ) 467 590 724 986 1,137 907 1,043 1,158 1,285 1,388 829 925 1,023 1,192 1,302
EBITDA (` mn) 807 1,596 2,523 4,318 6,148 6,427 7,381 8,360 11,394 13,133 7,234 8,978 10,883 15,711 19,281 Less: Depreciation (` mn) 586 604 1,245 1,283 1,323 1,523 1,546 1,569 2,077 2,591 2,109 2,150 2,814 3,360 3,914
EBIT (̀ mn) 221 992 1,278 3,035 4,825 4,904 5,835 6,791 9,317 10,542 5,125 6,827 8,069 12,352 15,367 Less:Interest (` mn) 1,017 1,053 1,794 2,527 2,523 1,176 1,124 1,023 922 895 2,193 2,177 2,817 3,448 3,419
PBT (̀ mn) (796) (61) (516) 508 2,301 3,728 4,711 5,768 8,395 9,647 2,932 4,650 5,252 8,903 11,948
Less: Taxes (̀ mn) - - - 168 759 1,193 1,507 1,788 2,603 2,990 1,193 1,507 1,788 2,770 3,750 Less: Minority (` mn) (207) (16) (134) 88 401 (207) (16) (134) 88 401
PAT (` mn) (589) (45) (382) 252 1,141 2,535 3,203 3,980 5,793 6,656 1,946 3,158 3,598 6,045 7,797
No of Shares (mn) 35 35 35 35 35 205 205 205 205 205 240 240 240 240 240
EPS (`) (16.8) (1.3) (10.9) 7.2 32.6 12.4 15.6 19.4 28.3 32.5 8.1 13.2 15.0 25.2 32.5
Balance Sheet
Equity 20,037 23,195 26,793 32,838 40,635
Net Debt 19,239 14,667 9,433 1,616 (9,505)
Ratios
Net Debt /Equity 1.0 0.6 0.4 0.0 (0.2)
Net Debt/EBITDA 2.7 1.6 0.9 0.1 (0.5)
Pre-tax RoCE 12.5% 16.9% 20.8% 33.4% 44.3%
Post-tax RoCE 9.6% 13.2% 16.2% 25.9% 33.5%
Valuation
EV/EBITDA (X) 9.2 7.4 6.1 4.2 3.5
EV/tonne (`) 5,472 5,472 5,472 4,392 4,392
EV/tonne (USD) 82 82 82 66 66
Source: Company, Ambit Capital research

Orient Cement
November 01, 2016 Ambit Capital Pvt. Ltd. Page 16
We maintain our assumptions for the existing business For the purposes of our estimates and valuation, we do not factor in the acquisition (as it is yet to be closed) but depict the impact of the acquisition on our estimates and valuation in the scenario analysis above. We maintain our assumptions and estimates for the existing business (detailed below).
Volumes: We expect strong volume growth in FY17 and FY18, driven by scale-up of capacities in Karnataka – we expect 50% capacity utilisation in FY17 and 75% in FY18. Moreover, we expect the sharp demand recover in AP-Telangana to sustain, driven by ramp-up in government spending, especially in irrigation.
Realisation: Pricing discipline has improved in Maharashtra as fight for market share receded and demand recovered post monsoon. We estimate 3% realisation growth in FY17 and 9% growth in FY18.
Costs: We estimate a 4% reduction in unitary operating costs in FY17, driven by operating leverage benefits and better fixed recovery at the Karnataka plant. Moreover, we expect power and fuel costs to reduce led by higher adoption of petcoke and logistics costs to grow only marginally given adoption of SAP and improved IT systems for logistics.
EBITDA/tonne: We expect EBITDA/tonne to increase to `620 and `908 in FY17 and FY18, respectively, as against `399 in FY16. Most of the gains in unitary EBITDA are likely to be driven by improved pricing in Maharashtra/AP.
Exhibit 20: Financial assumptions – expect strong EBITDA recovery over the next two years
Particulars (̀ mn unless mentioned)
Assumptions YoY growth Comments
FY15 FY16 FY17E FY18E FY17E FY18E
Cement sales 4.1 4.4 6.0 7.0 35.8% 16.7% Strong volume growth over the next two years driven by ramp up of the Karnataka plant
Capacity utilisation 82% 55% 75% 88% - -
Per tonne analysis
Cement Realisation 3,736 3,400 3,502 3,817 3.0% 9.0% Marginal realisation increase in the FY17 but a step jump in FY18 driven by improved discipline
Operating costs 3,018 3,002 2,882 2,910 -4.0% 1.0% Operating costs likely to decline in FY17 as efficiencies of Karnataka capacities improve alongside better fixed cost recovery
EBITDA 718 399 620 908 55.6% 46.3% Sharp improvement in unitary EBITDA driven by improved pricing and lower costs
Financials (` mn unless specified)
Net Revenues 15,470 15,092 21,088 26,799 39.7% 27.1% Change in revenue is on account of above-mentioned change in realisation and volume estimates
EBITDA 3,067 1,834 3,798 6,431 107.1% 69.3% Strong EBITDA growth led by improvement in unitary profitability (albeit on a low base of last year)
EBITDA margin (%) 19.8 12.2 18.0 24.0 586 bps 599 bps
Adjusted PBT 2512 603 1222 3732 102.7% 205.5% PBT growth driven by higher EBITDA and better absorption of depreciation and interest
Adjusted PBT margin (%) 16.2 4.0 5.8 13.9 180 bps 813 bps
Tax 564 (20) 391 1,194 44.3% -101.7%
Adjusted PAT 1,948 623 831 2,538 134.5% -75.5%
Adjusted PAT margin (%) 12.6 4.1 3.9 9.5 865 bps -534 bps
EPS (`) 9.5 3.0 4.1 12.4 134.5% -75.5%
Capex 9,222 3,697 497 3,635 1757.3% 1.7%
We build in capex for further expansions of 1.5-2mn tonnes GB Turnover 1.2 0.7 0.7 0.8 49 bps -5 bps
FCF (7,664) (1,121) 1,755 1,380 -536.6% -181.2%
Source: Company, Ambit Capital research

Orient Cement
November 01, 2016 Ambit Capital Pvt. Ltd. Page 17
Exhibit 21: Ambit vs Consensus
Particulars Ambit Consensus Divergence Comments
Revenue (̀ mn)
FY2017 21,079 20,418 3% Our sales estimates are higher than consensus since we expect a sharp realisation up-tick as pricing discipline improves FY2018 26,787 25,380 6%
EBITDA (̀ mn)
FY2017 3,795 3,310 15% Our EBITDA estimates are higher than consensus, mainly due to higher than consensus realisation estimates; consensus EBITDA saw significant downgrades due to weak pricing in Maharashtra but we believe improved pricing discipline will lead to strong unitary EBITDA expansion in 2HFY17 and FY18
FY2018 6,427 5,485 17%
PAT (̀ mn) FY2017 829 813 2% Despite higher EBITDA estimates, our PAT estimates are lower than consensus, which
could be on account of a higher tax estimate FY2018 2,535 2,380 7%
Source: Company, Ambit capital research
Exhibit 22: Explanation for flags highlighted on the first page
Segment Score Comments
Accounting GREEN The company is in the second quartile of Ambit's forensic accounting screener of BSE-500 companies. Moreover in the last two years, the company delivered cumulative CFO/EBITDA of 100%. On our accounting checks too, we do not find any major red-flags.
Predictability AMBER Orient Cement has made timely announcements in terms of expansions and has not misguided on growth expectations. However, EBITDA/tonne is a function of realisations, which is volatile and difficult to predict given the fragmented and low growth nature of the market it operates in.
Earnings Momentum RED FY17/FY18 EBITDA estimates have seen sharp downgrades in the past three months, which are not a cause for concern.
Source: Company, Ambit Capital research

Orient Cement
November 01, 2016 Ambit Capital Pvt. Ltd. Page 18
Valuations – when expectations are down Since the announcement of the acquisition, Orient Cement stock has underperformed the Sensex by ~20% on the back of poor earnings visibility of the acquired assets and expected balance sheet stress for the next two years. Now the stock trades at attractive 7.4x FY18 EV/EBITDA (on our estimates, which are 15-17% higher than consensus) at the start of the demand upcycle. We believe the stock will re-rate closer to its mid-cap peers (currently at 10-30% discount) as: (a) pricing and demand recover in its core markets; and (b) visibility towards earnings potential of the recent acquisition improves. On one-year forward EV/tonne, the stock trades at ~`6,000, in line with five-year average.
Our target price of `216/share implies 8.7x FY18E EV/EBITDA, given that we expect the company to sustain strong EBITDA growth for the next two-three years after FY18 as the demand super-cycle commences.
After a sharp run up in the recent past, stock lost most of the gain as skepticism around the acquisition set in.
Exhibit 23: Orient is trading at a marginal premium to its average EV/EBITDA…
Source: Bloomberg, Company, Ambit Capital research
Exhibit 24: …and in-line with its average EV/tonne
Source: Bloomberg, Company, Ambit Capital research
Trading at a discount to other good quality mid-cap names
Orient Cement is trading at a 10-30% discount to comparable mid-cap cement names, such as Ramco Cement, JK Lakshmi and Heidelberg.
The recent re-rating in some mid-cap names was driven by improved pricing and earnings visibility whereas the de-rating in Orient Cement’s case has been driven by the overhang of its recent acquisition. We believe that Orient Cement can chart the same path as other mid-cap cement names as: (a) pricing and demand recovers in its core markets; and (b) visibility towards earnings potential of the recent acquisition improves.
Note that the table below is based on consensus estimates for uniform comparison amongst the companies, hence Orient’s EV/EBITDA multiples are 8.8x on FY18 estimates as against 7.4x based on our higher-than-consensus estimates.
6
8
10
12
14
16
Apr
-14
Jun-
14A
ug-1
4
Oct
-14
Dec
-14
Feb-
15A
pr-1
5Ju
n-15
Aug
-15
Oct
-15
Dec
-15
Feb-
16A
pr-1
6Ju
n-16
Aug
-16
Oct
-16
(x) One-yr fwd EV/EBITDA
One-yr fwd EV/EBITDA Average EV/EBITDA
3,000
4,000
5,000
6,000
7,000
8,000A
pr-1
4Ju
n-14
Aug
-14
Oct
-14
Dec
-14
Feb-
15A
pr-1
5Ju
n-15
Aug
-15
Oct
-15
Dec
-15
Feb-
16A
pr-1
6Ju
n-16
Aug
-16
Oct
-16
(`/tonne) One-yr fwd EV/Tonne
One-yr fwd EV/Tonne Average EV/Tonne

Orient Cement
November 01, 2016 Ambit Capital Pvt. Ltd. Page 19
Exhibit 25: Relative valuation summary – mid-cap cement companies
Capacity Mcap Advt 6m EV/EBITDA EV/tonne CAGR (FY16-18) ROE
(mn tonnes) (̀ bn) US$ mn US$ mn
(x) ̀ Sales EBITDA EPS
(%)
FY17 FY18 FY17 FY18 FY17 FY18 FY17 FY18
Orient Cement 8.0 8.0 36 537 0.6 14.6 8.8 6,049 6,049 30 73 95 9 19 Ramco Cements ** 13.5 13.5 147 2,193 2.0 14.2 12.3 12,430 12,430 12 12 15 18 19
Dalmia Bharat #@ 21.0 21.0 184 2,736 1.8 12.9 11.1 11,834 11,834 16 19 72 10 14
Century Tex# 12.8 12.8 102 1,520 14.1 16.0 NA 12,391 12,391 NA NA NA 6 NA
Prism Cement # 8.0 8.0 54 799 0.7 13.1 9.3 9,228 9,228 12 43 NA 12 24
JK Cement 10.8 10.8 67 990 0.4 13.2 10 8,712 8,712 15 31 152 12 20 Jk Lakshmi Cement 11.0 11.0 58 858 0.8 13.8 9.5 6,458 6,458 22 66 NA 10 18
Birla Corp # 10.5 10.5 60 895 1.3 10.9 8.2 5,398 5,398 16 55 64 11 13
Heidelberg India 6.0 6.0 33 496 0.6 12.6 9.8 6,773 6,773 12 28 115 11 16 Mangalam Cement 3.5 3.5 9 139 0.4 9.6 7.0 3,788 3,788 20 107 NA 10 15
Sagar Cement 3.5 3.5 13 190 0.3 7.9 7.0 4,145 4,145 32 47 61 9 17
Source: Bloomberg, Company, Ambit Capital research

Orient Cement
November 01, 2016 Ambit Capital Pvt. Ltd. Page 20
Key catalysts and risks Catalysts Demand and pricing recovery in South/West India: Cement demand has been extremely weak in Maharashtra due to the weak monsoon. We note early signs of demand recovery in AP-Telangana led by government impetus on irrigation. An above-average monsoon should improve rural income, driving volume improvement in East Maharashtra – Orient’s target market. Improved demand amid no major capacity addition will support pricing, driving expansion in unitary EBITDA for Orient.
Approvals by SAIL: For the acquisition to go through, approval by SAIL and renewal of critical raw material supply agreements by SAIL is critical. Once SAIL vets the deal, we expect the acquisition-related uncertainty and resultant overhang to subside.
Risks Acquisition-led dilution risk: The company’s debt/equity has increased to 1.1x in FY16-end post commissioning of the Karnataka plant. If the acquisition of Jaypee’s assets goes through in the next 6 months, debt/equity will rise to 1.2-1.3x.
Teething problems and dilution of cost efficiencies in Karnataka plant: Whilst management claims that the inefficiencies of power and fuel at the Karnataka plant have been addressed, if such problems sustain cost savings will fail to come through.
Increase in petcoke prices: Orient Cement has adopted 50% petcoke at its AP plant and the new plant in Karnataka will be largely run on petcoke. Petcoke prices are up 50% from the lows of Mar-16 and are now only at a 10-12% discount to coal. Further increase in petcoke prices could dilute cost savings.

Orient Cement
November 01, 2016 Ambit Capital Pvt. Ltd. Page 21
Balance Sheet
Year to March (Rs Mn) FY15 FY16 FY17E FY18E FY19E
Share capital 205 205 205 205 205
Reserves and surplus 9,551 9,958 10,886 13,273 16,227
Total Networth 9,755 10,163 11,091 13,478 16,432
Loans 11,057 12,898 12,898 11,898 11,898
Deferred tax liability (net) 1,250 1,228 1,228 1,228 1,228
Sources of funds 22,064 24,289 25,217 26,604 29,558
Net block 7,981 21,497 26,268 25,248 24,214
Capital work-in-progress 13,194 2,391 - 3,131 7,306
Cash and bank balances 428 378 1,086 288 320
Sundry debtors 832 921 1,019 1,221 1,216
Inventories 1,099 1,410 1,155 1,468 1,555
Loans and advances 1,802 1,771 2,310 2,936 3,110
Total Current Assets 4,482 4,744 5,974 6,426 6,744
Current Liabilities 3,130 3,906 3,465 4,403 4,665
Provisions 464 438 245 336 579
Current liabilities and provisions 3,594 4,344 3,710 4,739 5,243
Net current assets 888 400 2,264 1,687 1,501
Application of funds 22,064 24,289 25,217 26,604 29,558
Source: Company, Ambit Capital research
Profit and Loss
Year to March (Rs Mn) FY15 FY16 FY17E FY18E FY19E
Revenue 15,470 15,092 21,079 26,787 28,376
yoy growth 8% -2% 40% 27% 6%
Total expenses 12,403 13,258 17,283 20,360 20,786
EBITDA 3,067 1,834 3,795 6,427 7,590
yoy growth 37% -40% 111% 69% 18%
Net depreciation 473 763 1,374 1,523 1,546
EBIT 2,594 1,071 2,422 4,904 6,044
Interest 141 544 1,290 1,240 1,190
Other income 59 75 87 64 66
Adj PBT 2,512 603 1,219 3,728 4,920
Provision for taxation 564 (20) 390 1,193 1,574
Adj PAT 1,948 623 829 2,535 3,345
yoy growth 93% -68% 33% 206% 32%
Reported PAT 1,948 623 829 2,535 3,345
EPS (Rs) 9.5 3.0 4.0 12.4 16.3
EPS diluted (Rs) 9.5 3.0 4.0 12.4 16.3
DPS (Rs) 1.4 0.2 0.2 0.6 1.6
Source: Company, Ambit Capital research

Orient Cement
November 01, 2016 Ambit Capital Pvt. Ltd. Page 22
Cash Flow Statement
Year to March (Rs Mn) FY15 FY16 FY17E FY18E FY19E
PBT 2,512 602 1,219 3,728 4,920
Depreciation 473 763 1,374 1,523 1,546
Others 107 (23) (87) (64) (66)
Interest paid (net) 5 544 1,290 1,240 1,190
CFO before change in WC 3,097 1,886 3,795 6,427 7,590
Change in working capital (1,005) 824 (1,155) (222) 218
Direct taxes paid (534) (134) (390) (1,193) (1,574)
CFO 1,558 2,576 2,250 5,012 6,234
Net capex (9,222) (3,697) (497) (3,635) (4,686)
Interest received 7 6 87 64 66
CFI (9,223) (3,691) (409) (3,571) (4,621)
Proceeds from borrowings 7,771 1,841 - (1,000) -
Change in share capital - - 158 (0) (0)
Interest & finance charges paid (134) (519) (1,290) (1,240) (1,190)
Dividends paid (57) (42) - - (391)
CFF 7,268 1,065 (1,132) (2,240) (1,581)
Net increase in cash (397) (50) 709 (798) 32
Opening cash balance 815 418 378 1,086 288
Closing cash balance 418 368 1,086 288 320
FCF (7,664) (1,121) 1,754 1,377 1,547
Source: Company, Ambit Capital research
Ratio Analysis
Particulars FY15 FY16 FY17E FY18E FY19E
Revenue growth 7.5 (2.4) 39.7 27.1 5.9
EBITDA growth 37.4 (40.3) 111.3 69.3 18.1
PAT growth 92.8 (68.0) 33.1 205.8 32.0
EPS norm (dil) growth 92.8 (68.0) 33.1 205.8 32.0
EBITDA margin 19.8 12.2 18.0 24.0 26.7
EBIT margin 16.8 7.1 11.5 18.3 21.3
Net margin 12.6 4.1 3.9 9.5 11.8
RoCE 11.8 3.4 6.9 13.0 14.8
RoIC 24.1 5.2 7.5 14.3 18.4
RoE 21.6 6.3 7.8 20.6 22.4
Debt/Equity(x) 1.1 1.3 1.2 0.9 0.7
Net debt/Equity(x) 1.1 1.2 1.1 0.9 0.7
Source: Company, Ambit Capital research.
Valuation Parameters Particulars FY15 FY16 FY17E FY18E FY19E
P/E (x) 18.2 56.9 42.8 14.0 10.6
P/B(x) 3.6 3.5 3.2 2.6 2.2
EV/Sales(x) 3.1 3.1 2.2 1.8 1.7
EV/EBITDA(x) 15.6 25.8 12.5 7.4 6.2
EV/ tonne (Rs) 9,593 5,907 5,907 5,907 5,907
EV/tonne (US$) 152 94 94 98 98
Source: Company, Ambit Capital research.

Orient Cement
November 01, 2016 Ambit Capital Pvt. Ltd. Page 23
Institutional Equities Team Saurabh Mukherjea, CFA CEO, Institutional Equities (022) 30433174 [email protected]
Research Analysts
Name Industry Sectors Desk-Phone E-mail
Nitin Bhasin - Head of Research E&C / Infra / Cement / Industrials (022) 30433241 [email protected] Aadesh Mehta, CFA Banking / Financial Services (022) 30433239 [email protected] Abhishek Ranganathan, CFA Retail (022) 30433085 [email protected] Achint Bhagat, CFA Cement / Home Building (022) 30433178 [email protected] Anuj Bansal Mid-caps (022) 30433122 [email protected] Aditi Singh Economy / Strategy (022) 30433284 [email protected] Ashvin Shetty, CFA Automobile (022) 30433285 [email protected] Bhargav Buddhadev Power Utilities / Capital Goods (022) 30433252 [email protected] Deepesh Agarwal, CFA Power Utilities / Capital Goods (022) 30433275 [email protected] Dhiraj Mistry, CFA Consumer (022) 30433264 [email protected] Gaurav Khandelwal, CFA Automobile (022) 30433132 [email protected] Girisha Saraf Mid-caps / Small-caps (022) 30433211 [email protected] Karan Khanna, CFA Strategy (022) 30433251 [email protected] Mayank Porwal Retail (022) 30433214 [email protected] Pankaj Agarwal, CFA Banking / Financial Services (022) 30433206 [email protected] Paresh Dave, CFA Healthcare (022) 30433212 [email protected] Parita Ashar, CFA Metals & Mining / Aviation (022) 30433223 [email protected] Prashant Mittal, CFA Strategy / Derivatives (022) 30433218 [email protected] Rahil Shah Banking / Financial Services (022) 30433217 [email protected] Rakshit Ranjan, CFA Consumer (022) 30433201 [email protected] Ravi Singh Banking / Financial Services (022) 30433181 [email protected] Ritesh Gupta, CFA Oil & Gas / Chemicals / Agri Inputs (022) 30433242 [email protected] Ritesh Vaidya, CFA Consumer (022) 30433246 [email protected] Ritika Mankar Mukherjee, CFA Economy / Strategy (022) 30433175 [email protected] Ritu Modi Automobile (022) 30433292 [email protected] Sagar Rastogi Technology (022) 30433291 [email protected] Sudheer Guntupalli Technology (022) 30433203 [email protected] Sumit Shekhar Economy / Strategy (022) 30433229 [email protected] Utsav Mehta, CFA E&C / Industrials (022) 30433209 [email protected] Vivekanand Subbaraman, CFA Media (022) 30433261 [email protected]
Sales
Name Regions Desk-Phone E-mail
Sarojini Ramachandran - Head of Sales UK +44 (0) 20 7886 2740 [email protected] Dharmen Shah India / Asia (022) 30433289 [email protected] Dipti Mehta India / USA (022) 30433053 [email protected] Hitakshi Mehra India (022) 30433204 [email protected] Krishnan V India / Asia (022) 30433295 [email protected] Nityam Shah, CFA USA / Europe (022) 30433259 [email protected] Parees Purohit, CFA UK / USA (022) 30433169 [email protected] Praveena Pattabiraman India / Asia (022) 30433268 [email protected] Punitraj Mehra, CFA India / Asia (022) 30433198 [email protected] Shaleen Silori India (022) 30433256 [email protected]
Singapore
Pramod Gubbi, CFA – Director Singapore +65 8606 6476 [email protected] Shashank Abhisheik Singapore +65 6536 1935 [email protected]
USA / Canada
Ravilochan Pola - CEO Americas +1(646) 361 3107 [email protected]
Production
Sajid Merchant Production (022) 30433247 [email protected] Sharoz G Hussain Production (022) 30433183 [email protected] Jestin George Editor (022) 30433272 [email protected] Richard Mugutmal Editor (022) 30433273 [email protected] Nikhil Pillai Database (022) 30433265 [email protected]

Orient Cement
November 01, 2016 Ambit Capital Pvt. Ltd. Page 24
Orient Cement Ltd (ORCMNT IN, BUY)
Source: Bloomberg, Ambit Capital research
0
50
100
150
200
250
Oct
-13
Dec
-13
Feb-
14
Apr
-14
Jun-
14
Aug
-14
Oct
-14
Dec
-14
Feb-
15
Apr
-15
Jun-
15
Aug
-15
Oct
-15
Dec
-15
Feb-
16
Apr
-16
Jun-
16
Aug
-16
Orient Cement Ltd

Orient Cement
November 01, 2016 Ambit Capital Pvt. Ltd. Page 25
Explanation of Investment Rating
Investment Rating Expected return (over 12-month)
BUY >10%
SELL <10%
NO STANCE We have forward looking estimates for the stock but we refrain from assigning valuation and recommendation
UNDER REVIEW We will revisit our recommendation, valuation and estimates on the stock following recent events
NOT RATED We do not have any forward looking estimates, valuation or recommendation for the stock POSITIVE We have a positive view on the sector and most of stocks under our coverage in the sector are BUYs
NEGATIVE We have a negative view on the sector and most of stocks under our coverage in the sector are SELLs
Disclaimer This report or any portion hereof may not be reprinted, sold or redistributed without the written consent of Ambit Capital. AMBIT Capital Research is disseminated and available primarily electronically, and, in some cases, in printed form.
Additional information on recommended securities is available on request.
Disclaimer
1. AMBIT Capital Private Limited (“AMBIT Capital”) and its affiliates are a full service, integrated investment banking, investment advisory and brokerage group. AMBIT Capital is a Stock Broker, Portfolio Manager and Depository Participant registered with Securities and Exchange Board of India Limited (SEBI) and is regulated by SEBI
2. AMBIT Capital makes best endeavours to ensure that the research analyst(s) use current, reliable, comprehensive information and obtain such information from sources which the analyst(s) believes to be reliable. However, such information has not been independently verified by AMBIT Capital and/or the analyst(s) and no representation or warranty, express or implied, is made as to the accuracy or completeness of any information obtained from third parties. The information, opinions, views expressed in this Research Report are those of the research analyst as at the date of this Research Report which are subject to change and do not represent to be an authority on the subject. AMBIT Capital may or may not subscribe to any and/ or all the views expressed herein.
3. This Research Report should be read and relied upon at the sole discretion and risk of the recipient. If you are dissatisfied with the contents of this complimentary Research Report or with the terms of this Disclaimer, your sole and exclusive remedy is to stop using this Research Report and AMBIT Capital or its affiliates shall not be responsible and/ or liable for any direct/consequential loss howsoever directly or indirectly, from any use of this Research Report.
4. If this Research Report is received by any client of AMBIT Capital or its affiliate, the relationship of AMBIT Capital/its affiliate with such client will continue to be governed by the terms and conditions in place between AMBIT Capital/ such affiliate and the client.
5. This Research Report is issued for information only and the 'Buy', 'Sell', or ‘Other Recommendation’ made in this Research Report such should not be construed as an investment advice to any recipient to acquire, subscribe, purchase, sell, dispose of, retain any securities and should not be intended or treated as a substitute for necessary review or validation or any professional advice. Recipients should consider this Research Report as only a single factor in making any investment decisions. This Research Report is not an offer to sell or the solicitation of an offer to purchase or subscribe for any investment or as an official endorsement of any investment.
6. This Research Report is being supplied to you solely for your information and may not be reproduced, redistributed or passed on, directly or indirectly, to any other person or published, copied in whole or in part, for any purpose. Neither this Research Report nor any copy of it may be taken or transmitted or distributed, directly or indirectly within India or into any other country including United States (to US Persons), Canada or Japan or to any resident thereof. The distribution of this Research Report in other jurisdictions may be strictly restricted and/ or prohibited by law or contract, and persons into whose possession this Research Report comes should inform themselves about such restriction and/ or prohibition, and observe any such restrictions and/ or prohibition.
7. Ambit Capital Private Limited is registered as a Research Entity under the SEBI (Research Analysts) Regulations, 2014. SEBI Reg.No.- INH000000313.
Conflict of Interests 8. In the normal course of AMBIT Capital’s business circumstances may arise that could result in the interests of AMBIT Capital conflicting with the interests of clients or one client’s interests conflicting
with the interest of another client. AMBIT Capital makes best efforts to ensure that conflicts are identified and managed and that clients’ interests are protected. AMBIT Capital has policies and procedures in place to control the flow and use of non-public, price sensitive information and employees’ personal account trading. Where appropriate and reasonably achievable, AMBIT Capital segregates the activities of staff working in areas where conflicts of interest may arise. However, clients/potential clients of AMBIT Capital should be aware of these possible conflicts of interests and should make informed decisions in relation to AMBIT Capital’s services.
9. AMBIT Capital and/or its affiliates may from time to time have or solicit investment banking, investment advisory and other business relationships with companies covered in this Research Report and may receive compensation for the same.
Additional Disclaimer for U.S. Persons
10. The research report is solely a product of AMBIT Capital 11. AMBIT Capital is the employer of the research analyst(s) who has prepared the research report 12. Any subsequent transactions in securities discussed in the research reports should be effected through Enclave Capital LLC. (“Enclave”). 13. Enclave does not accept or receive any compensation of any kind for the dissemination of the AMBIT Capital research reports.
14. The research analyst(s) preparing the email / Research Report/ attachment is resident outside the United States and is/are not associated persons of any U.S. regulated broker-dealer and that therefore the analyst(s) is/are not subject to supervision by a U.S. broker-dealer, and is/are not required to satisfy the regulatory licensing requirements of FINRA or required to otherwise comply with U.S. rules or regulations regarding, among other things, communications with a subject company, public appearances and trading securities held by a research analyst account.
15. This report is prepared, approved, published and distributed by the Ambit Capital located outside of the United States (a non-US Group Company”). This report is distributed in the U.S.by Enclave Capital LLC, a U.S. registered broker dealer, on behalf of Ambit Capital only to major U.S. institutional investors (as defined in Rule 15a-6 under the U.S. Securities Exchange Act of 1934 (the “Exchange Act”)) pursuant to the exemption in Rule 15a-6 and any transaction effected by a U.S. customer in the securities described in this report must be effected through Enclave Capital LLC (19 West 44th Street, suite 1700, New York, NY 10036). In order to receive any additional information about or to effect a transaction in any security or financial instrument mentioned herein, please contact a registered representative of Enclave Capital LLC., by phone at 646 361 3107.
16. As of the publication of this report Enclave Capital LLC, does not make a market in the subject securities. 17. This document does not constitute an offer of, or an invitation by or on behalf of Ambit Capital or its affiliates or any other company to any person, to buy or sell any security. The information
contained herein has been obtained from published information and other sources, which Ambit Capital or its Affiliates consider to be reliable. None of Ambit Capital accepts any liability or responsibility whatsoever for the accuracy or completeness of any such information. All estimates, expressions of opinion and other subjective judgments contained herein are made as of the date of this document. Emerging securities markets may be subject to risks significantly higher than more established markets. In particular, the political and economic environment, company practices and market prices and volumes may be subject to significant variations. The ability to assess such risks may also be limited due to significantly lower information quantity and quality. By accepting this document, you agree to be bound by all the foregoing provisions.
Additional Disclaimer for Canadian Persons
18. AMBIT Capital is not registered in the Province of Ontario and /or Province of Québec to trade in securities and/or to provide advice with respect to securities. 19. AMBIT Capital's head office or principal place of business is located in India. 20. All or substantially all of AMBIT Capital's assets may be situated outside of Canada. 21. It may be difficult for enforcing legal rights against AMBIT Capital because of the above. 22. Name and address of AMBIT Capital's agent for service of process in the Province of Ontario is: Torys LLP, 79 Wellington St. W., 30th Floor, Box 270, TD South Tower, Toronto, Ontario M5K 1N2
Canada. 23. Name and address of AMBIT Capital's agent for service of process in the Province of Montréal is Torys Law Firm LLP, 1 Place Ville Marie, Suite 1919 Montréal, Québec H3B 2C3 Canada.
Additional Disclaimer for Singapore Persons
24. This Report is prepared and distributed by Ambit Capital Private Limited and distributed as per the approved arrangement under Paragraph 9 of Third Schedule of Securities and Futures Act (CAP 289) and Paragraph 11 of the First Schedule to the Financial Advisors Act (CAP 110) provided to Ambit Singapore Pte. Limited by Monetary Authority of Singapore.
25. This Report is only available to persons in Singapore who are institutional investors (as defined in section 4A of the Securities and Futures Act (Cap. 289) of Singapore (the “SFA”).” Accordingly, if a Singapore Person is not or ceases to be such an institutional investor, such Singapore Person must immediately discontinue any use of this Report and inform Ambit Singapore Pte. Limited.

Orient Cement
November 01, 2016 Ambit Capital Pvt. Ltd. Page 26
Additional Disclaimer for UK Persons
26. All of the recommendations and views about the securities and companies in this report accurately reflect the personal views of the research analyst named on the cover. No part of this research analyst’s compensation was, is, or will be directly or indirectly related to the specific recommendations or views expressed by the research analyst in this research report. This report may not be reproduced, redistributed or copied in whole or in part for any purpose.
27. This report is a marketing communication and has been prepared by Ambit Capital Pvt Ltd of Mumbai, India (“Ambit”) and has been approved in the UK by Ambit Capital (UK) Limited (“ACUK”) solely for the purposes of section 21 of the Financial Services and Markets Act 2000. Ambit is regulated by the Securities and Exchange Board of India and is registered as a Research Entity under the SEBI (Research Analysts) Regulations, 2014. ACUK is regulated by the UK Financial Services Authority and has registered office at C/o Panmure Gordon & Co PL, One New Change, London, EC4M9AF.
28. In the UK, this report is directed at and is for distribution only to persons who (i) fall within Article 19(1) (persons who have professional experience in matters relating to investments) or Article 49(2)(a) to (d) (high net worth companies, unincorporated associations etc) of the Financial Services and Markets Act 2000 (Financial Promotions) Order 2005 (as amended) or (ii) are professional customers or eligible counterparties of ACUK (all such persons together being referred to as "relevant persons"). This report must not be acted on or relied upon by persons in the UK who are not relevant persons.
29. Neither Ambit nor ACUK is a US registered broker-dealer. Transactions undertaken in the US in any security mentioned herein must be effected through a US-registered broker-dealer, in conformity with SEC Rule 15a-6.
30. Neither this report nor any copy or part thereof may be distributed in any other jurisdictions where its distribution may be restricted by law and persons into whose possession this report comes should inform themselves about, and observe, any such restrictions. Distribution of this report in any such other jurisdictions may constitute a violation of UK or US securities laws, or the law of any such other jurisdictions.
31. This report does not constitute an offer or solicitation to buy or sell any securities referred to herein. It should not be so construed, nor should it or any part of it form the basis of, or be relied on in connection with, any contract or commitment whatsoever. The information in this report, or on which this report is based, has been obtained from publicly available sources that Ambit believes to be reliable and accurate. However, it has not been prepared in accordance with legal requirements designed to promote the independence of investment research. It has also not been independently verified and no representation or warranty, express or implied, is made as to the accuracy or completeness of any information obtained from third parties.
32. The information or opinions are provided as at the date of this report and are subject to change without notice. The information and opinions provided in this report take no account of the investors’ individual circumstances and should not be taken as specific advice on the merits of any investment decision. Investors should consider this report as only a single factor in making any investment decisions. Further information is available upon request. No member or employee of Ambit or ACUK accepts any liability whatsoever for any direct or consequential loss howsoever arising, directly or indirectly, from any use of this report or its contents.
33. The value of any investment made at your discretion based on this Report, or income therefrom, maybe affected by changes in economic, financial and/or political factors and may go down as well as go up and you may not get back the original amount invested. Some securities and/or investments involve substantial risk and are not suitable for all investors.
34. Ambit and its affiliates and their respective officers directors and employees may hold positions in any securities mentioned in this Report (or in any related investment) and may from time to time add to or dispose of any such securities (or investment). Ambit and ACUK may from time to time render advisory and other services to companies referred to in this Report and may receive compensation for the same.
35. Ambit and its affiliates may act as a market maker or risk arbitrator or liquidity provider or may have assumed an underwriting commitment in the securities of companies discussed in this Report (or in related investments) or may sell them or buy them from clients on a principal to principal basis or may be involved in proprietary trading and may also perform or seek to perform investment banking or underwriting services for or relating to those companies.
36. Ambit and ACUK may sell or buy any securities or make any investment which may be contrary to or inconsistent with this Report and are not subject to any prohibition on dealing. By accepting this report you agree to be bound by the foregoing limitations. In the normal course of Ambit and its affiliates’ business, circumstances may arise that could result in the interests of Ambit conflicting with the interests of clients or one client’s interests conflicting with the interest of another client. Ambit makes best efforts to ensure that conflicts are identified, managed and clients’ interests are protected. However, clients/potential clients of Ambit should be aware of these possible conflicts of interests and should make informed decisions in relation to Ambit services.
Disclosures
37. The analyst (s) has/have not served as an officer, director or employee of the subject company. 38. There is no material disciplinary action that has been taken by any regulatory authority impacting equity research analysis activities. 39. All market data included in this report are dated as at the previous stock market closing day from the date of this report.
Analyst Certification Each of the analysts identified in this report certifies, with respect to the companies or securities that the individual analyses, that (1) the views expressed in this report reflect his or her personal views about all of the subject companies and securities and (2) no part of his or her compensation was, is or will be directly or indirectly dependent on the specific recommendations or views expressed in this report. © Copyright 2015 AMBIT Capital Private Limited. All rights reserved.
Ambit Capital Pvt. Ltd. Ambit House, 3rd Floor. 449, Senapati Bapat Marg, Lower Parel, Mumbai 400 013, India. Phone: +91-22-3043 3000 | Fax: +91-22-3043 3100 CIN: U74140MH1997PTC107598 www.ambitcapital.com