Embed Size (px)
Citation preview

ScinoPharm Management Presentation TWSE 1789
March 14-15, 2012

DisclaimerThis material has been prepared by ScinoPharm Taiwan, Ltd. (“ScinoPharm”).
Any opinions expressed in this material are subject to change without notice as a result of usingdifferent assumptions. ScinoPharm is under no obligation to update or keep current the informationcontained herein. The information contained in this presentation is ScinoPharm’s confidentialinformation.
Any disclosure, copying, distribution or any action taken or omitted to be taken in reliance on it isprohibited and may be unlawful.
No representation or warranty, express or implied, is or will be made in or in relation to, and noresponsibility or liability is or will be accepted by the Company as to, the accuracy or completenessof this material and any liability therefore is hereby expressly disclaimed.
Statements made in this material include forward-looking statements, which include, withoutlimitation, statements about the issues, plans and expectations of ScinoPharm. Without limiting theforegoing, statements including the words “believes”, “anticipates”, “plans”, “expects” and similarexpressions are also forward-looking statements. Forward-looking statements reflect, among otherthings, management’s plans and objectives for future operations, current views with respect to futureevents and future economic performances and projections of various financial items. These forward-looking statements involve known and unknown risks, uncertainties and other factors whichmay cause actual results to differ materially from those implied by such forward-lookingstatements.
Confidential
2

Confidential
Table of Content
3
Overview of ScinoPharm
Business Outlook
Financial & Operation Results
Q&A
India – Passage to US/EU
Overview of ScinoPharm
4

� Maintain dominant position in Specialty API for generic market
� Developed more than 50 generic APIs with 16 launched, provided to around 300 customers
� Filed 41 DMF in US FDA (587 DMF worldwide), kept leading position in oncology injectable APIs with 19 US DMF, far exceeding other API companies
� CRO/CMO business served 70+ NCE projects, out of which 3 already approved and launched, 5 in phase III, which NDA are expected to be filed in the next 2-3 years
5
Confidential
Company Overview
Confidential
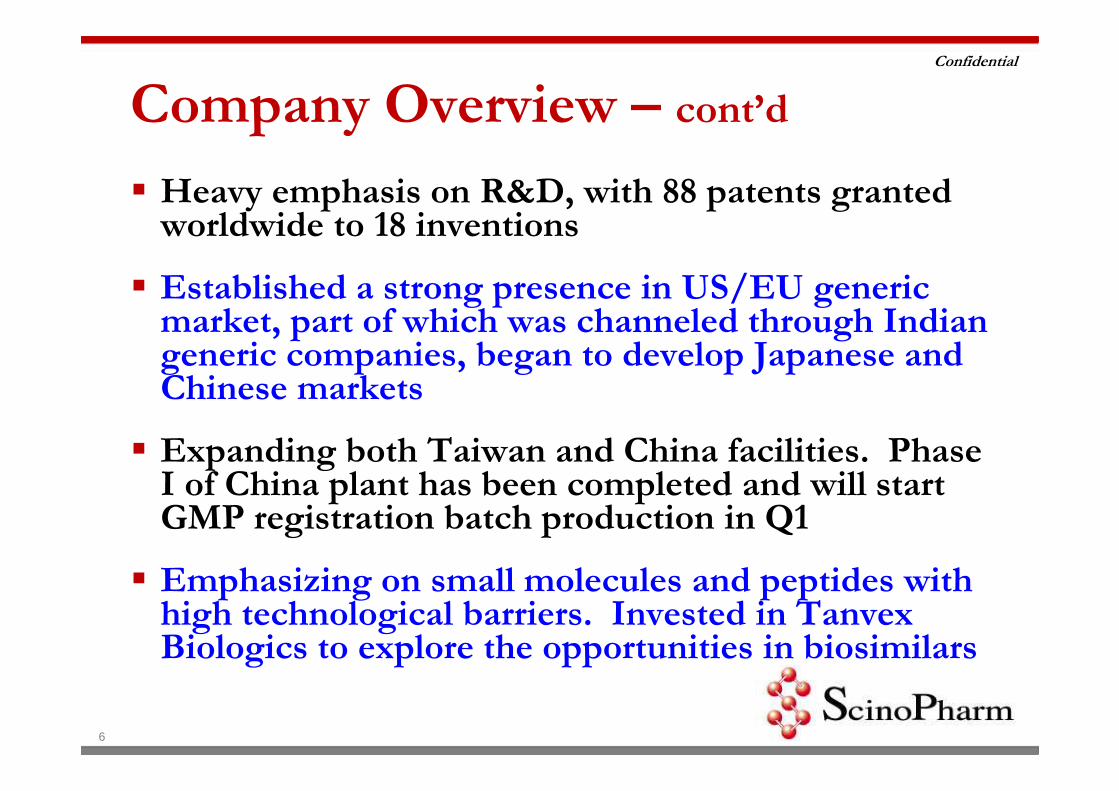
Company Overview – cont’d
� Heavy emphasis on R&D, with 88 patents granted worldwide to 18 inventions
� Established a strong presence in US/EU generic market, part of which was channeled through Indian generic companies, began to develop Japanese and Chinese markets
� Expanding both Taiwan and China facilities. Phase I of China plant has been completed and will start GMP registration batch production in Q1
� Emphasizing on small molecules and peptides with high technological barriers. Invested in Tanvex Biologics to explore the opportunities in biosimilars
6

Confidential
� 6.6 hectares of land, 330K sqft facilities with >200M3 reactor volume after 2 large product lines expansion
� Six of our production lines are equipped with the special capability to produce APIs used in high-potency sterile injections
� US FDA approved & >200 GMP audits by customers
� Provides comprehensive contract research services for brand drug companies
� Global Market
World Class FacilitiesTaiwan China
7
� With nearly 250M3 reactor volume
� The first phase completed by the end of 2011. The second phase completed by the end of the 2012
� cGMP designed facility for intermediates & high potent API
� Complete capabilities in API development, and manufacturing from small to large scale to aim for global and China generic as well as CRAM (Contract Research And Mfg) markets
� Global market including China

Confidential
8
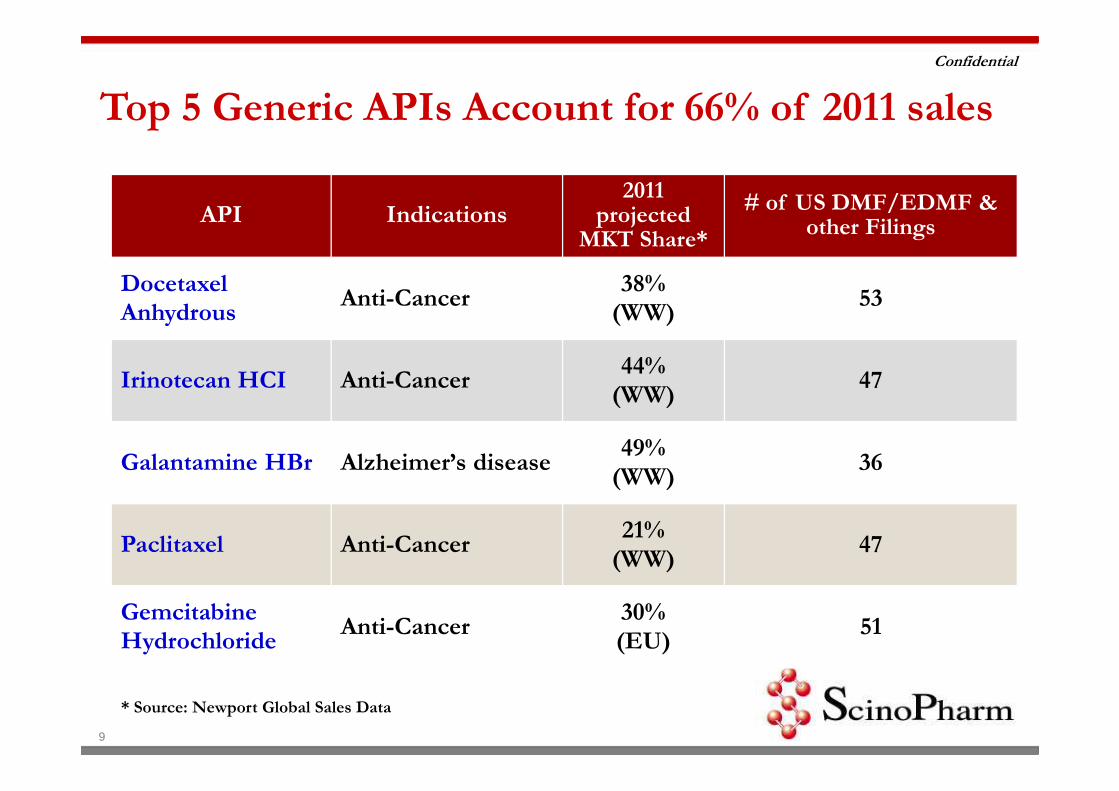
ScinoPharm – Top Ranking in Oncology DMF among API companies
Confidential
API Indications2011
projected MKT Share*
# of US DMF/EDMF & other Filings
Docetaxel Anhydrous
Anti-Cancer38%
(WW)53
Irinotecan HCI Anti-Cancer44%
(WW)47
Galantamine HBr Alzheimer’s disease49%
(WW)36
Paclitaxel Anti-Cancer21%
(WW)47
Gemcitabine Hydrochloride
Anti-Cancer30%(EU)
51
* Source: Newport Global Sales Data
Top 5 Generic APIs Account for 66% of 2011 sales
9

Financial & Operation Results
10
Confidential
11
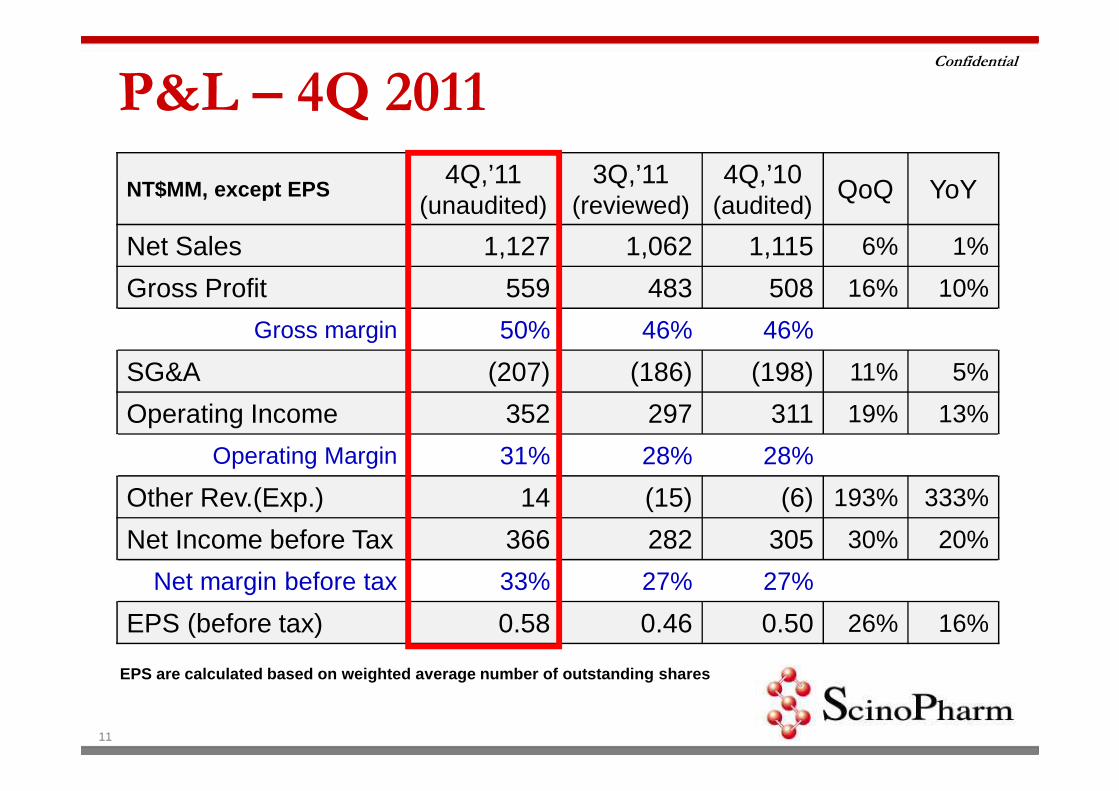
P&L – 4Q 2011
NT$MM, except EPS4Q,’11
(unaudited)3Q,’11
(reviewed)4Q,’10
(audited)QoQ YoY
Net Sales 1,127 1,062 1,115 6% 1%
Gross Profit 559 483 508 16% 10%
Gross margin 50% 46% 46%
SG&A (207) (186) (198) 11% 5%
Operating Income 352 297 311 19% 13%
Operating Margin 31% 28% 28%
Other Rev.(Exp.) 14 (15) (6) 193% 333%
Net Income before Tax 366 282 305 30% 20%
Net margin before tax 33% 27% 27%
EPS (before tax) 0.58 0.46 0.50 26% 16%
EPS are calculated based on weighted average number of outstanding shares

Confidential
P&L - FY2011
12
NT$MM, except EPSFY 2011
(unaudited)FY 2010(audited)
YoY
Net Sales 3,948 3,887 2%
Gross Profit 1,885 1,940 -3%
Gross margin 48% 50%
SG&A (742) (744) -0%
Operating Income 1,144 1,196 -4%
Operating margin 29% 31%
Other Rev.(Exp.) (20) (11) 81%
Net Income before Tax 1,124 1,185 -5%
Net margin before tax 29% 31%
EPS (before tax) 1.82 2.06 -12%
EPS are calculated based on weighted average number of outstanding shares
Confidential
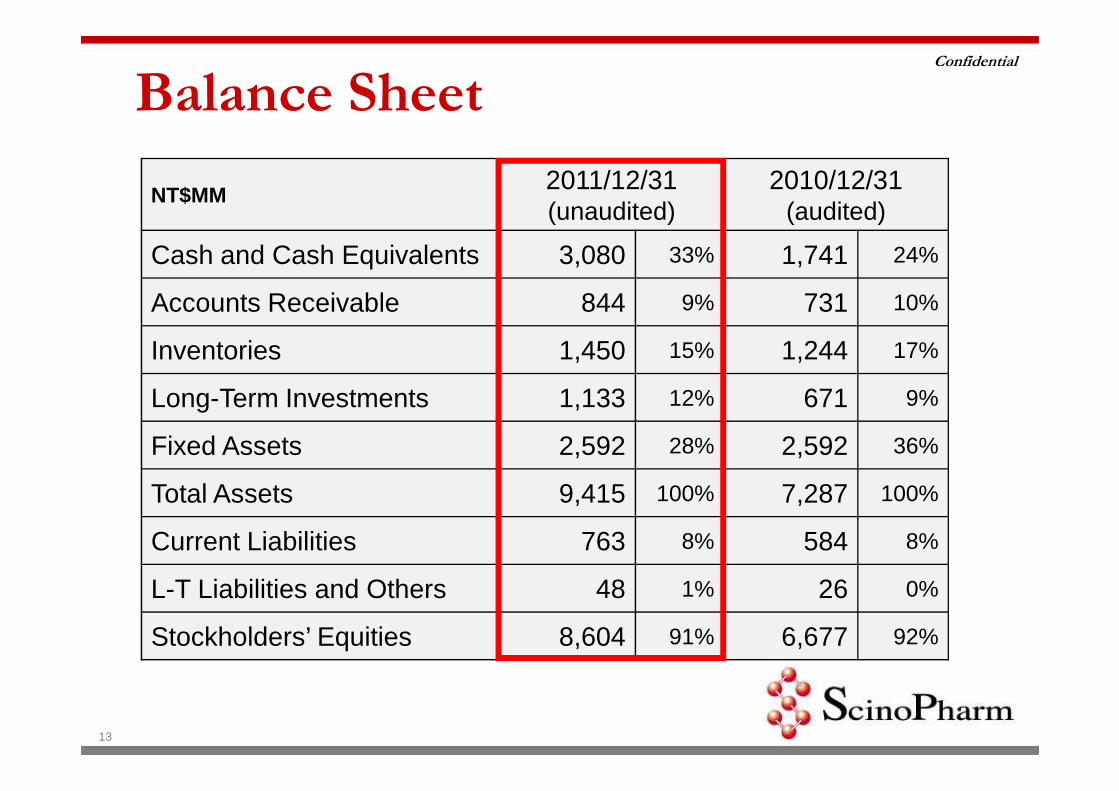
Balance Sheet
13
NT$MM2011/12/31(unaudited)
2010/12/31(audited)
Cash and Cash Equivalents 3,080 33% 1,741 24%
Accounts Receivable 844 9% 731 10%
Inventories 1,450 15% 1,244 17%
Long-Term Investments 1,133 12% 671 9%
Fixed Assets 2,592 28% 2,592 36%
Total Assets 9,415 100% 7,287 100%
Current Liabilities 763 8% 584 8%
L-T Liabilities and Others 48 1% 26 0%
Stockholders’ Equities 8,604 91% 6,677 92%
Confidential
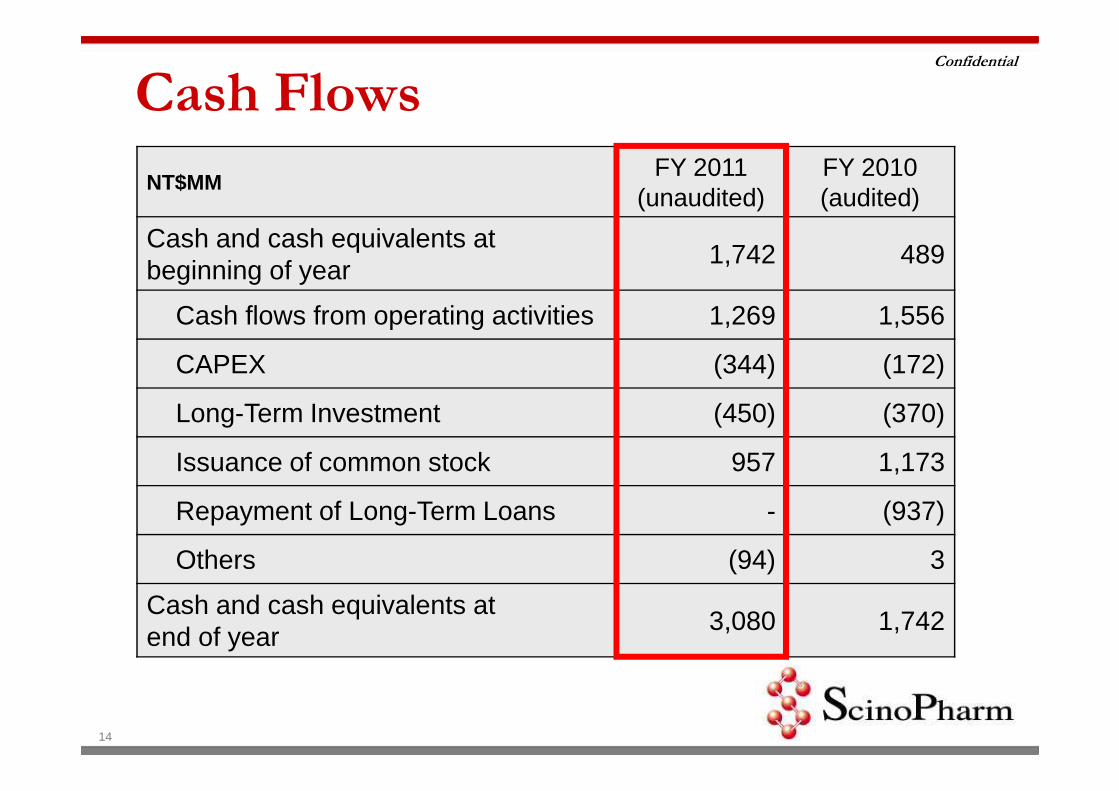
Cash Flows
14
NT$MMFY 2011
(unaudited)FY 2010(audited)
Cash and cash equivalents atbeginning of year
1,742 489
Cash flows from operating activities 1,269 1,556
CAPEX (344) (172)
Long-Term Investment (450) (370)
Issuance of common stock 957 1,173
Repayment of Long-Term Loans - (937)
Others (94) 3
Cash and cash equivalents at end of year
3,080 1,742
Confidential
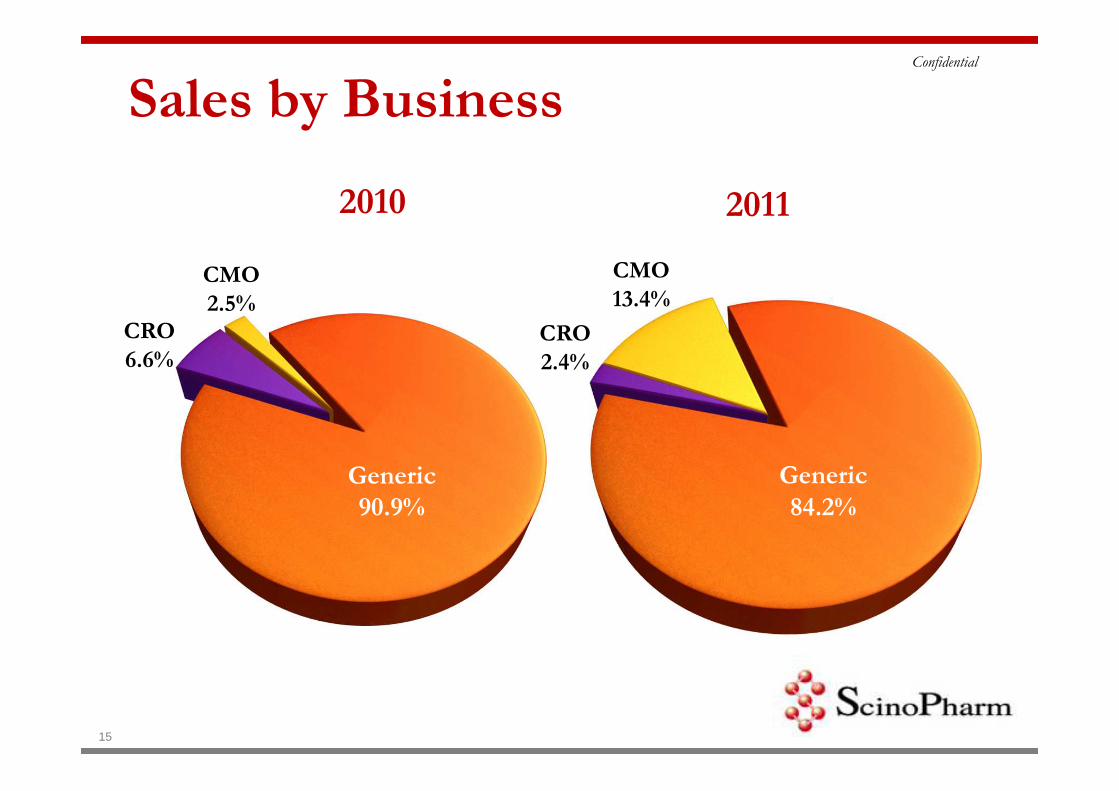
2010
CMO
2.5%CRO
6.6%
Generic
90.9%
CMO
13.4%
CRO
2.4%
Generic
84.2%
Sales by Business
2011
15
Confidential
學名藥90.91%
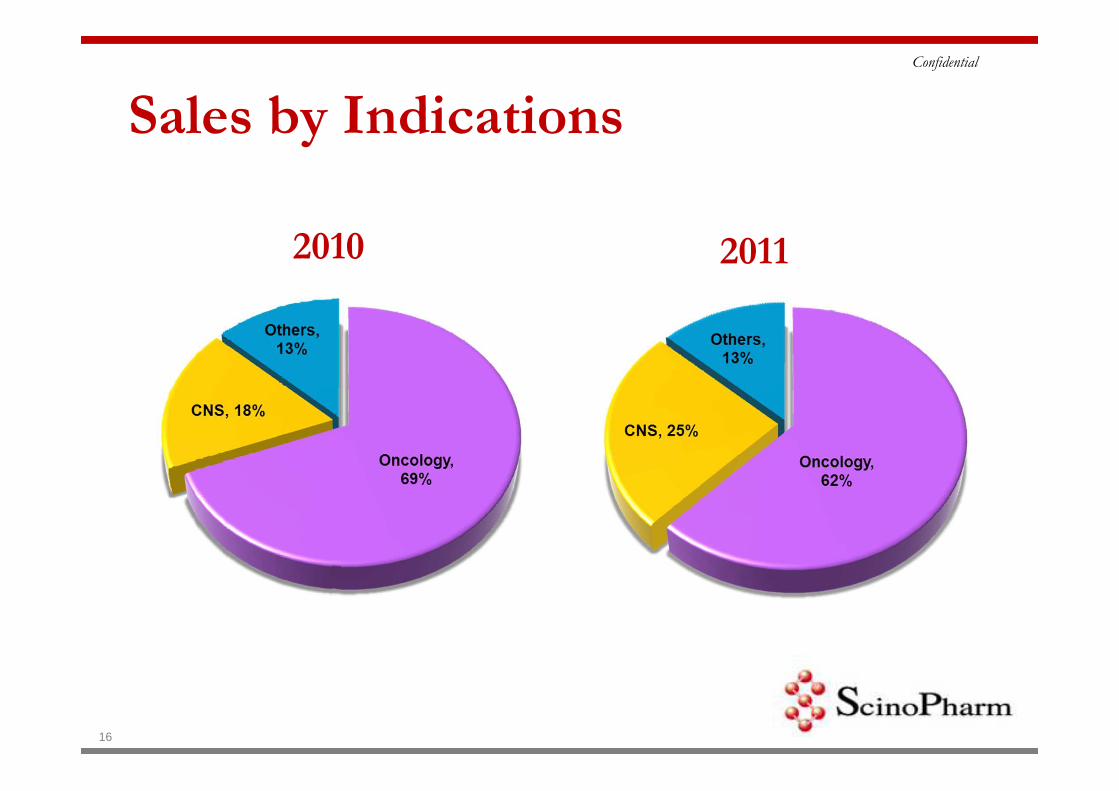
2010 2011
Others29.6%
Others37.8%
Sales by Indications
16
Confidential
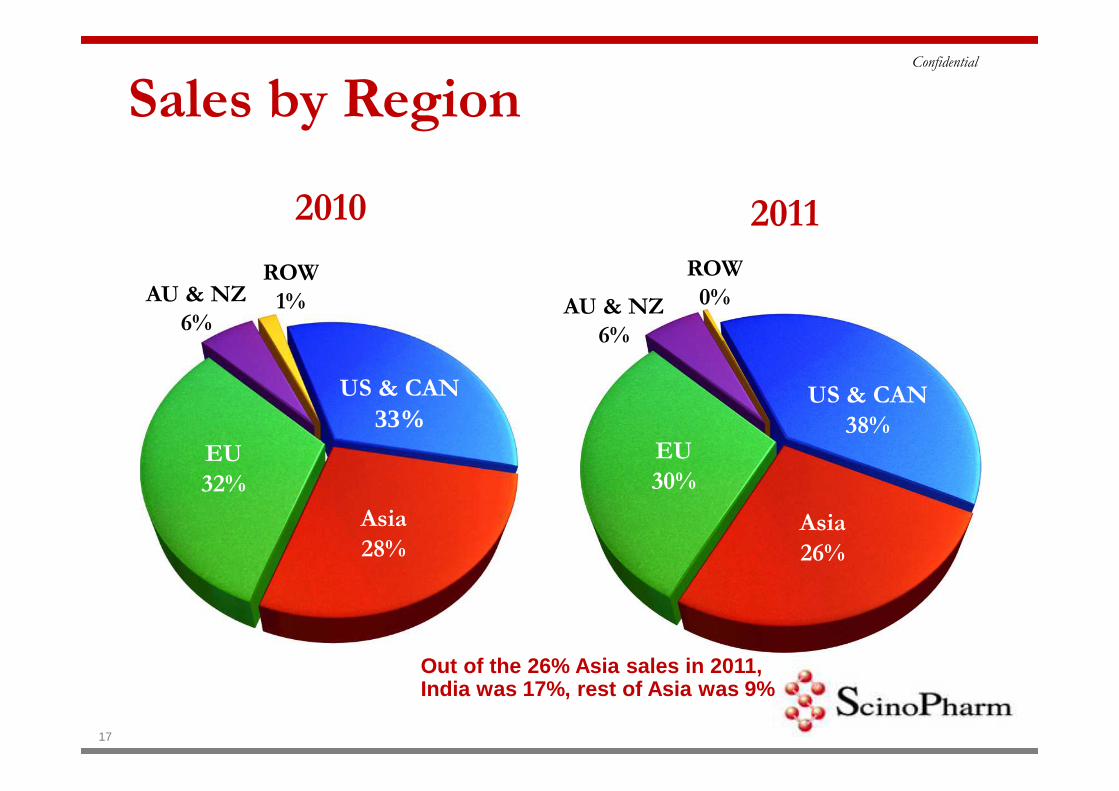
Sales by Region
EU
32%
2010
Asia
28%
AU & NZ
6%
US & CAN
33%
ROW
1%
EU
30%
Asia
26%
AU & NZ
6%
US & CAN
38%
ROW
0%
2011
17
Out of the 26% Asia sales in 2011, India was 17%, rest of Asia was 9%
18
India – A Passage to US/EU markets
19
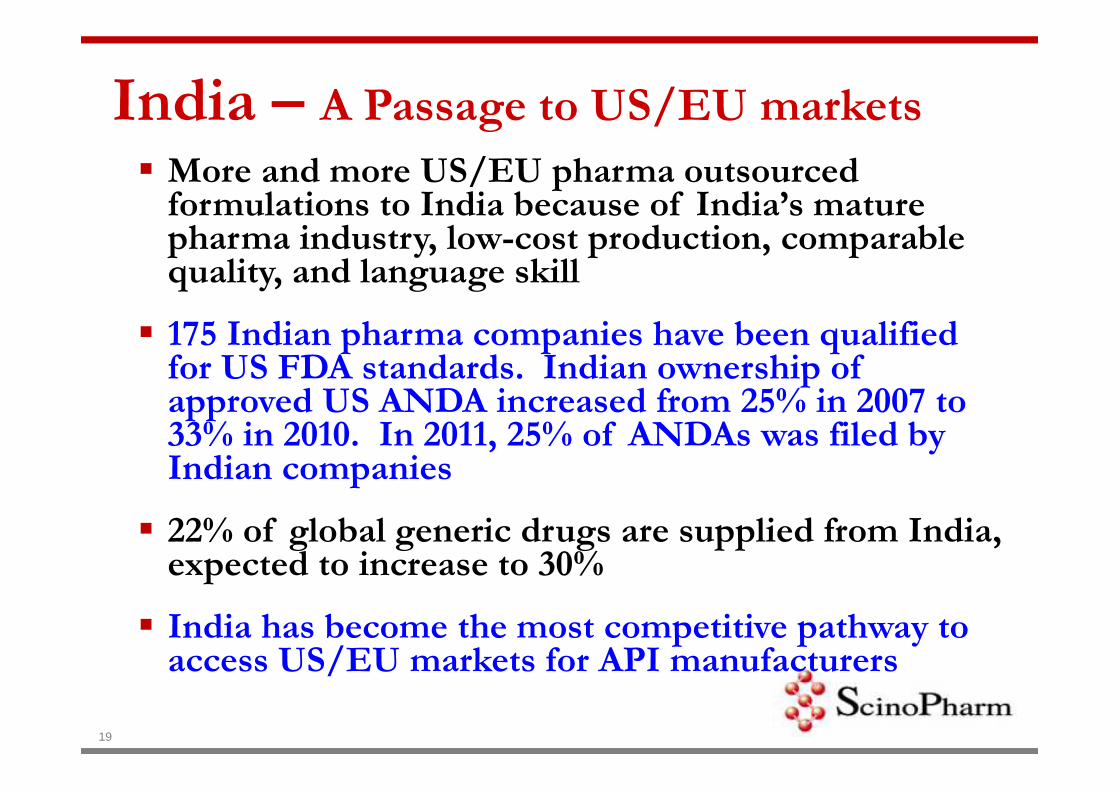
India – A Passage to US/EU markets
� More and more US/EU pharma outsourced formulations to India because of India’s mature pharma industry, low-cost production, comparable quality, and language skill
� 175 Indian pharma companies have been qualified for US FDA standards. Indian ownership of approved US ANDA increased from 25% in 2007 to 33% in 2010. In 2011, 25% of ANDAs was filed by Indian companies
� 22% of global generic drugs are supplied from India, expected to increase to 30%
� India has become the most competitive pathway to access US/EU markets for API manufacturers
20
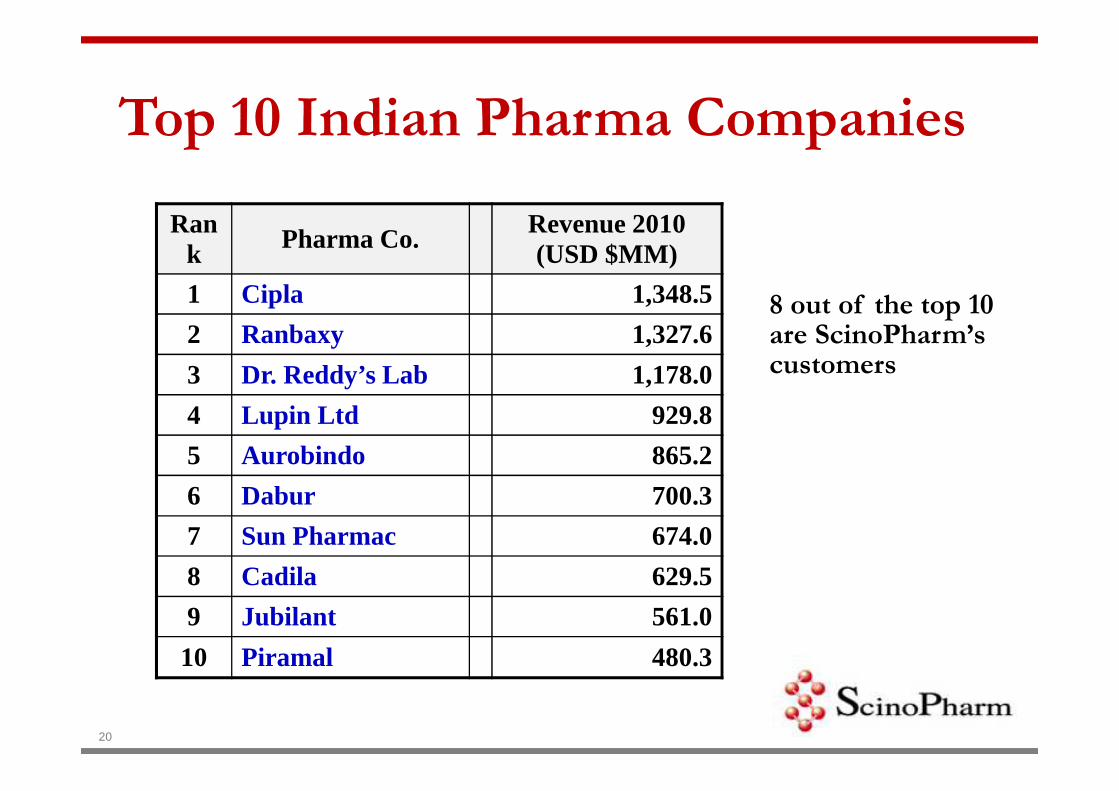
Rank Pharma Co. Revenue 2010
(USD $MM)
1 Cipla 1,348.5
2 Ranbaxy 1,327.6
3 Dr. Reddy’s Lab 1,178.0
4 Lupin Ltd 929.8
5 Aurobindo 865.2
6 Dabur 700.3
7 Sun Pharmac 674.0
8 Cadila 629.5
9 Jubilant 561.0
10 Piramal 480.3
Top 10 Indian Pharma Companies
8 out of the top 10 are ScinoPharm’s customers
21
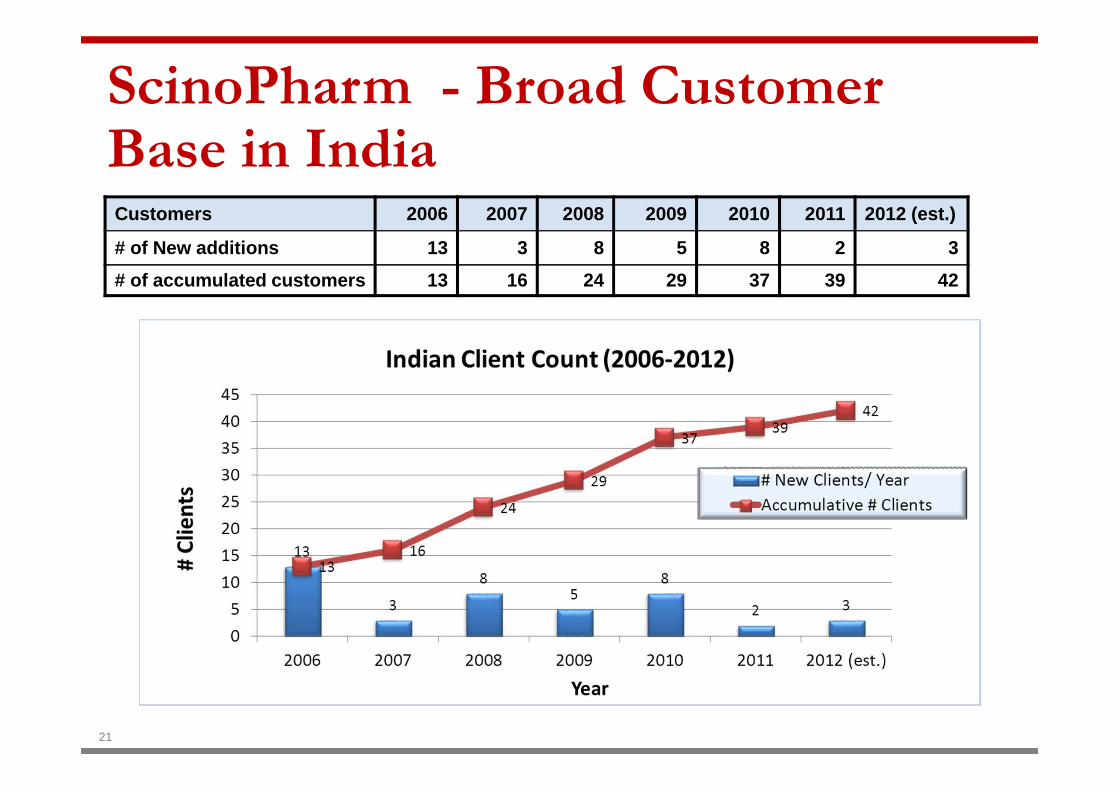
ScinoPharm - Broad Customer Base in IndiaCustomers 2006 2007 2008 2009 2010 2011 2012 (est.)
# of New additions 13 3 8 5 8 2 3
# of accumulated customers 13 16 24 29 37 39 42

22
ScinoPharm Successfully Penetrated US/EU Markets Through India
� ScinoPharm’s Business via India (2006 - 2012)

Business Outlook
23

Source: * Newport & IMS Data
** Thomson Reuter
2012 Product Launch PlanAPI Region Indications Brand Marketer Regional
SalesWW Sales
ArgatrobanUS
Antithrombotic, Anticoagulant GSK
$US 139MM*
$US 205MM*
Galantamine HBr
EUAlzheimer’s disease Janssen $US
314MM*$US 527MM*
Modafinil US Antinarcolepsy Cephalon $US 1,078MM*
$US 1,182MM*
Riluzole EU ALS Sanofi Aventis
$US 100MM*
$US 224MM*
Anastrozole JP Breast Cancer AstraZeneca
$US 270MM*
$US 1,109MM*
Levonorgestrel JPOral Contraceptive Bayer AG
$US 85MM*
$US 2,326MM*
SPT 1024US + EU
Obesity Confidential$US 633MM** NDA
24
25
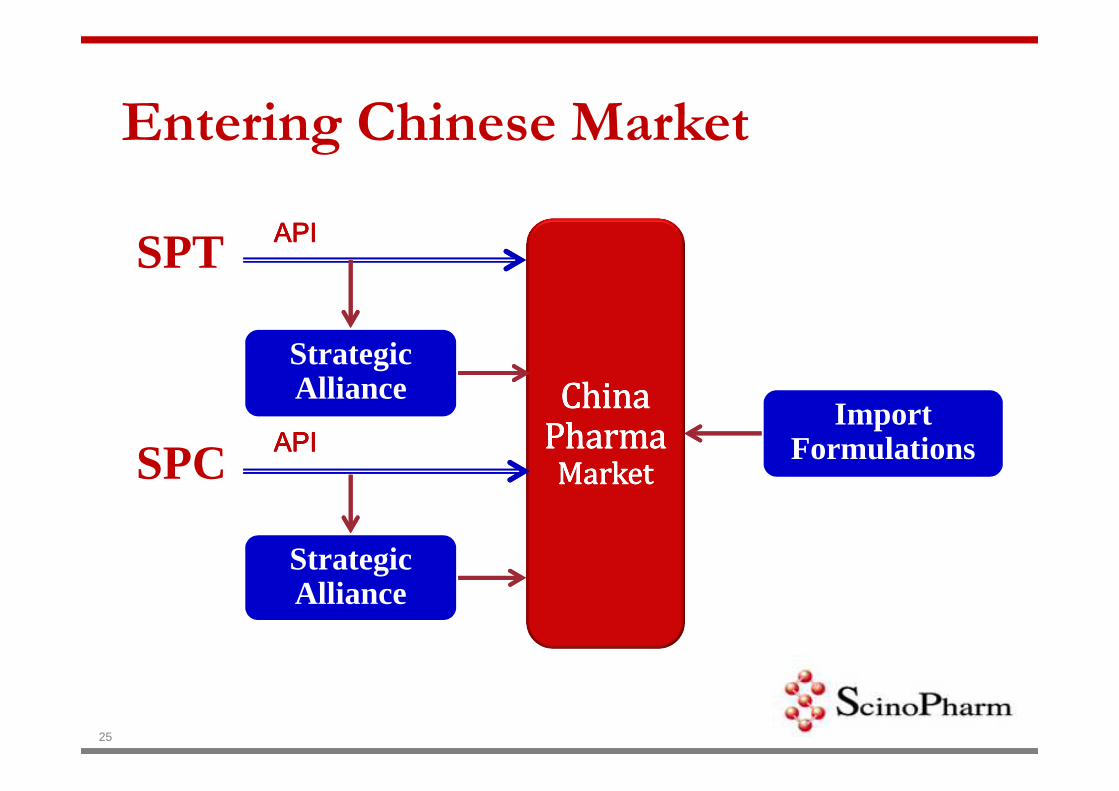
China China China China
PharmaPharmaPharmaPharma
MarketMarketMarketMarket
Strategic Alliance
Strategic Alliance
Import Formulations
SPT
SPC
APIAPIAPIAPI
APIAPIAPIAPI
Entering Chinese Market
Confidential
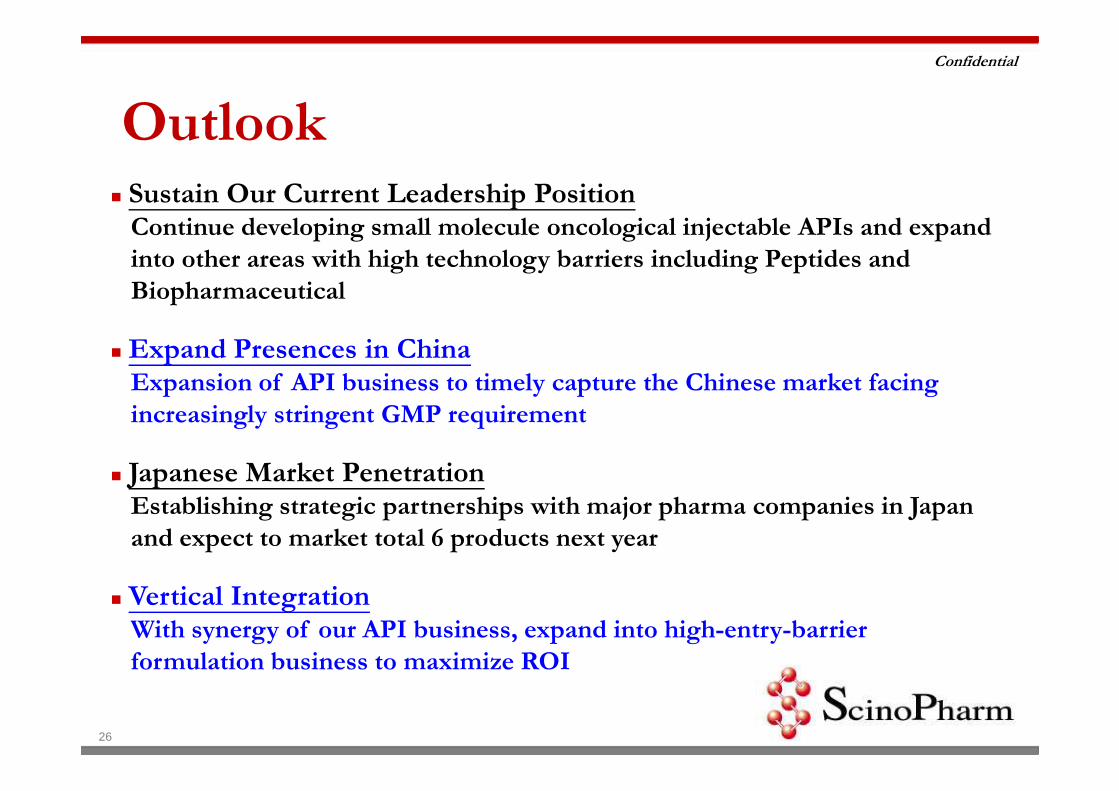
Outlook
26
� Sustain Our Current Leadership PositionContinue developing small molecule oncological injectable APIs and expand
into other areas with high technology barriers including Peptides and
Biopharmaceutical
� Expand Presences in ChinaExpansion of API business to timely capture the Chinese market facing
increasingly stringent GMP requirement
� Japanese Market PenetrationEstablishing strategic partnerships with major pharma companies in Japan
and expect to market total 6 products next year
� Vertical IntegrationWith synergy of our API business, expand into high-entry-barrier
formulation business to maximize ROI
Brand Quality with Asian Advantages
www.scinopharm.com
Confidential
27


![[Crut charitable remainderunittrust][crat_charitableremainderannuitytrust][michael f fernon][provincetown][merrill lynch trust company][ubs]](https://img.pdfslide.net/doc/110x75/557a7a5fd8b42aa30b8b4c02/crut-charitable-remainderunittrustcratcharitableremainderannuitytrustmichael-f-fernonprovincetownmerrill-lynch-trust-companyubs.jpg)


![[대학내일20대연구소]201203 2012년총학생회는대학생에게무슨의미인가(20120314)](https://img.pdfslide.net/doc/110x75/55adc3c21a28ab0c548b4862/20201203-201220120314.jpg)

![[대학내일20대연구소]2012년총학생회는대학생에게무슨의미인가 20120314](https://img.pdfslide.net/doc/110x75/559cc8ec1a28abf04b8b479a/202012-20120314.jpg)
