Embed Size (px)
Citation preview
INTERRA RESOURCES LIMITED Company Registration No. 197300166Z
SGX ANNOUNCEMENT
SGX Code: Interra Res (5GI)
Interra Resources Limited 1 Grange Road #05-04 Orchard Building Singapore 239693 Tel (65) 6732 1711 Fax (65) 6738 1170 www.interraresources.com
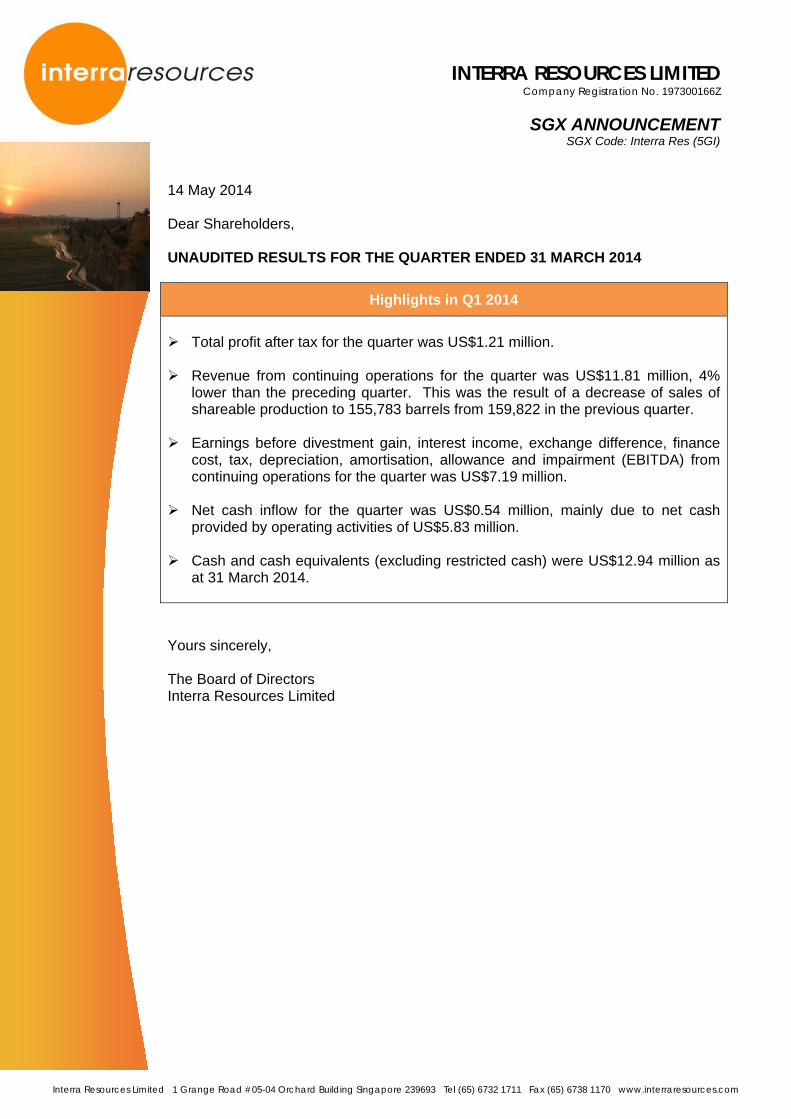
14 May 2014 Dear Shareholders, UNAUDITED RESULTS FOR THE QUARTER ENDED 31 MARCH 2014
Highlights in Q1 2014
Total profit after tax for the quarter was US$1.21 million.
Revenue from continuing operations for the quarter was US$11.81 million, 4%
lower than the preceding quarter. This was the result of a decrease of sales of shareable production to 155,783 barrels from 159,822 in the previous quarter.
Earnings before divestment gain, interest income, exchange difference, finance
cost, tax, depreciation, amortisation, allowance and impairment (EBITDA) from continuing operations for the quarter was US$7.19 million.
Net cash inflow for the quarter was US$0.54 million, mainly due to net cash provided by operating activities of US$5.83 million.
Cash and cash equivalents (excluding restricted cash) were US$12.94 million as
at 31 March 2014. Yours sincerely, The Board of Directors Interra Resources Limited
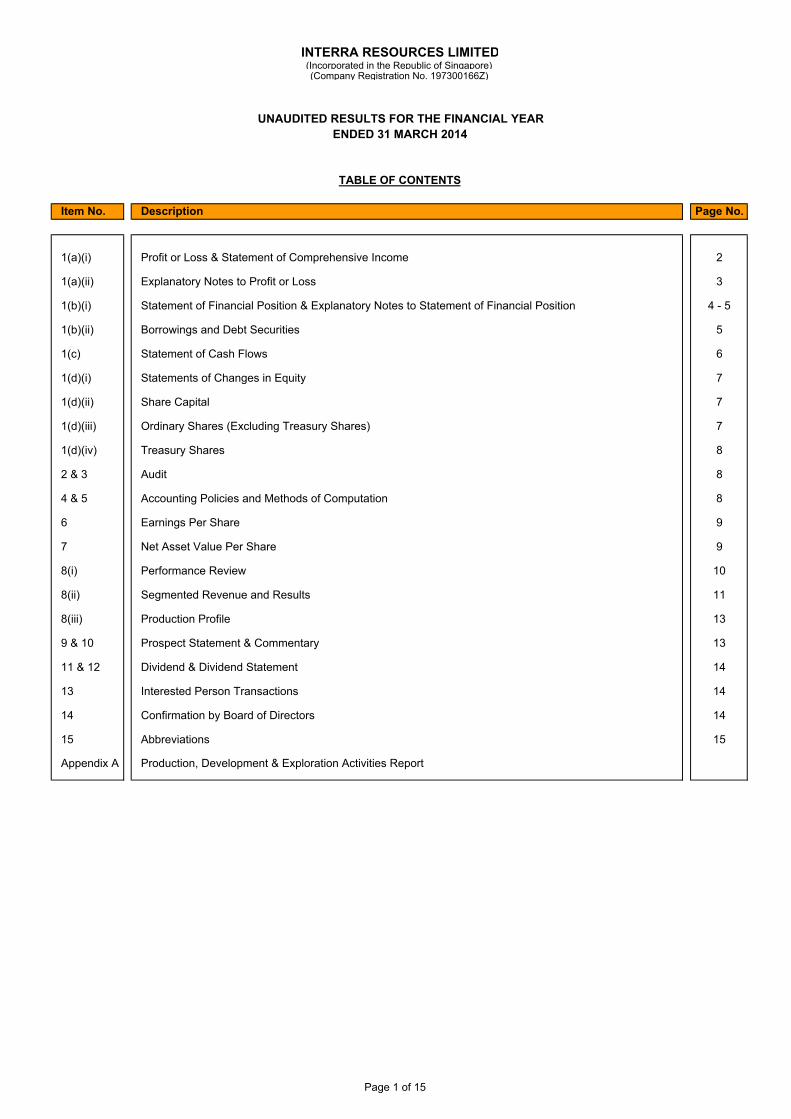
Item No. Description Page No.
Profit or Loss & Statement of Comprehensive Income 2
Explanatory Notes to Profit or Loss 3
Statement of Financial Position & Explanatory Notes to Statement of Financial Position 4 - 5
Borrowings and Debt Securities 5
Statement of Cash Flows 6
Statements of Changes in Equity 7
Share Capital 7
Ordinary Shares (Excluding Treasury Shares) 7
Treasury Shares 8
Audit 8
Accounting Policies and Methods of Computation 8
Earnings Per Share 9
Net Asset Value Per Share 9
Performance Review 10
Segmented Revenue and Results 11
Production Profile 13
Prospect Statement & Commentary 13
Dividend & Dividend Statement 14
Interested Person Transactions 14
Confirmation by Board of Directors 14
Abbreviations 15
Production, Development & Exploration Activities ReportAppendix A
ENDED 31 MARCH 2014UNAUDITED RESULTS FOR THE FINANCIAL YEAR
(Company Registration No. 197300166Z)(Incorporated in the Republic of Singapore)
INTERRA RESOURCES LIMITED
TABLE OF CONTENTS
1(a)(i)
1(a)(ii)
1(b)(i)
1(b)(ii)
8(iii)
1(c)
1(d)(i)
1(d)(ii)
1(d)(iii)
1(d)(iv)
2 & 3
4 & 5
6
7
8(i)
8(ii)
15
9 & 10
11 & 12
13
14
Page 1 of 15
1(a)(i) PROFIT OR LOSS
Group Note Q1 2014 Q1 2013 ChangeUS$'000 US$'000 %
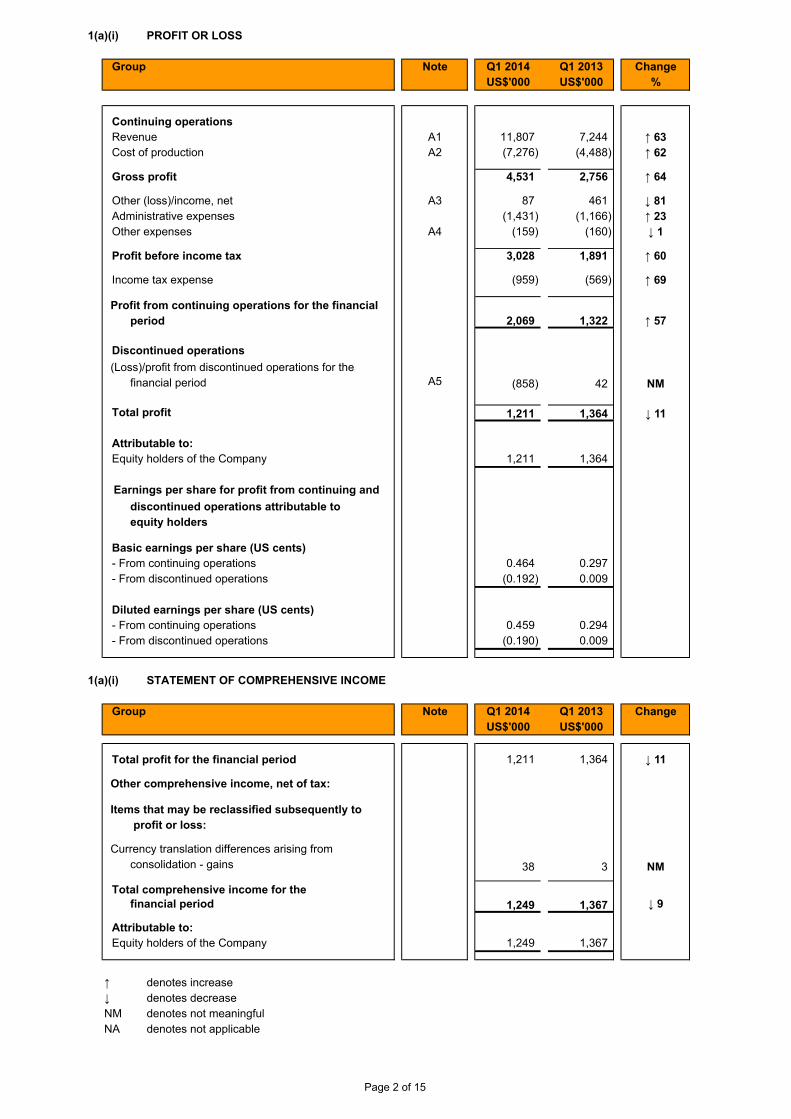
Continuing operationsRevenue A1 11,807 7,244 ↑ 63Cost of production A2 (7,276) (4,488) ↑ 62
Gross profit 4,531 2,756 ↑ 64
Other (loss)/income, net A3 87 461 ↓ 81Administrative expenses (1,431) (1,166) ↑ 23Other expenses A4 (159) (160) ↓ 1
3,028 1,891 ↑ 60
(959) (569) ↑ 69
2,069 1,322 ↑ 57
Discontinued operations
A5 (858) 42 NM
Total profit 1,211 1,364 ↓ 11
1,211 1,364
0.464 0.297 - From discontinued operations (0.192) 0.009
0.459 0.294 - From discontinued operations (0.190) 0.009
1(a)(i) STATEMENT OF COMPREHENSIVE INCOME
Group Note Q1 2014 Q1 2013 ChangeUS$'000 US$'000
1,211 1,364 ↓ 11
38 3 NM
1,249 1,367 ↓ 9
1,249 1,367
↑ denotes increase↓ denotes decreaseNM denotes not meaningfulNA denotes not applicable
Items that may be reclassified subsequently to profit or loss:
Currency translation differences arising from consolidation - gains
financial period
Equity holders of the CompanyAttributable to:
Total comprehensive income for the
Total profit for the financial period
- From continuing operations
Diluted earnings per share (US cents)- From continuing operations
Other comprehensive income, net of tax:
Attributable to:Equity holders of the Company
Basic earnings per share (US cents)
Profit before income tax
Income tax expense
Profit from continuing operations for the financialperiod
financial period (Loss)/profit from discontinued operations for the
Earnings per share for profit from continuing anddiscontinued operations attributable to equity holders
Page 2 of 15
1(a)(ii) EXPLANATORY NOTES TO PROFIT OR LOSS
Group Q1 2014 Q1 2013barrels barrels
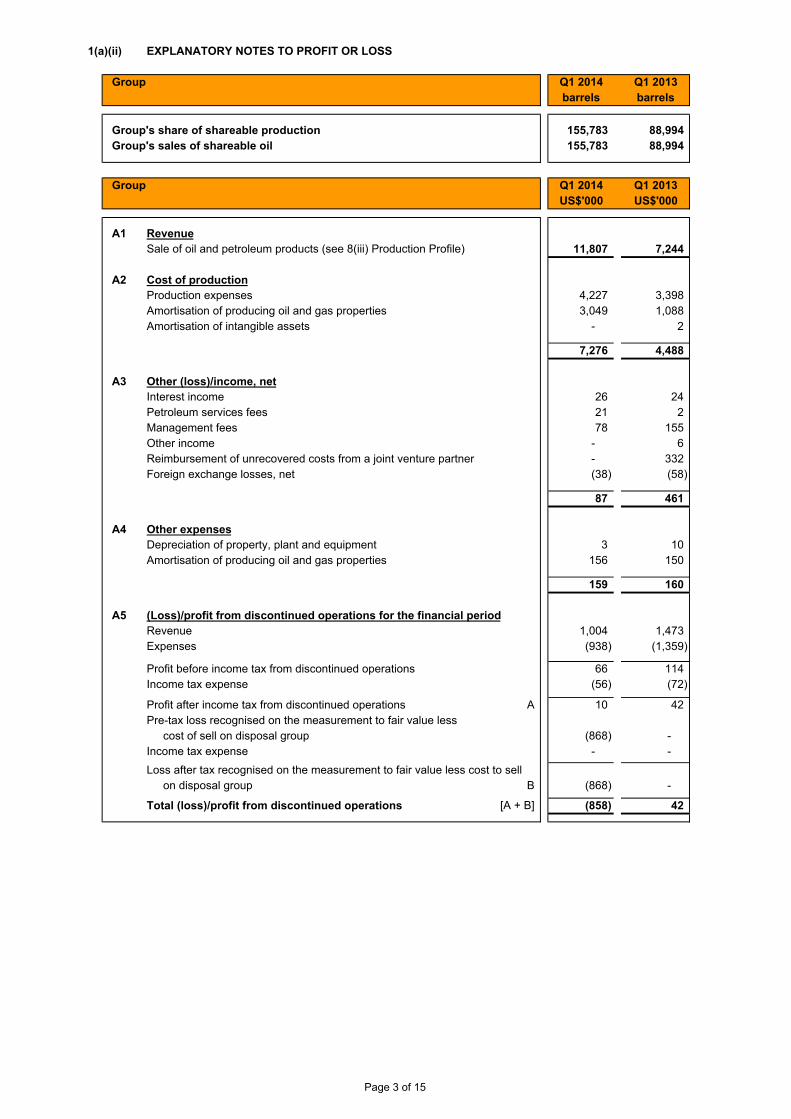
Group's share of shareable production 155,783 88,994 Group's sales of shareable oil 155,783 88,994
Group Q1 2014 Q1 2013US$'000 US$'000
A1 RevenueSale of oil and petroleum products (see 8(iii) Production Profile) 11,807 7,244
A2 Cost of productionProduction expenses 4,227 3,398 Amortisation of producing oil and gas properties 3,049 1,088 Amortisation of intangible assets - 2
7,276 4,488
A3 Other (loss)/income, netInterest income 26 24 Petroleum services fees 21 2 Management fees 78 155 Other income - 6 Reimbursement of unrecovered costs from a joint venture partner - 332 Foreign exchange losses, net (38) (58)
87 461
A4 Other expensesDepreciation of property, plant and equipment 3 10 Amortisation of producing oil and gas properties 156 150
159 160
A5 (Loss)/profit from discontinued operations for the financial periodRevenue 1,004 1,473 Expenses (938) (1,359)
Profit before income tax from discontinued operations 66 114 Income tax expense (56) (72)
Profit after income tax from discontinued operations A 10 42 Pre-tax loss recognised on the measurement to fair value less
cost of sell on disposal group (868) - Income tax expense - - Loss after tax recognised on the measurement to fair value less cost to sell
on disposal group B (868) -
Total (loss)/profit from discontinued operations [A + B] (858) 42
Page 3 of 15
1(b)(i) STATEMENT OF FINANCIAL POSITION
CompanyNote 31-Mar-14 31-Dec-13 31-Mar-14 31-Dec-13
US$'000 US$'000 US$'000 US$'000
Assets
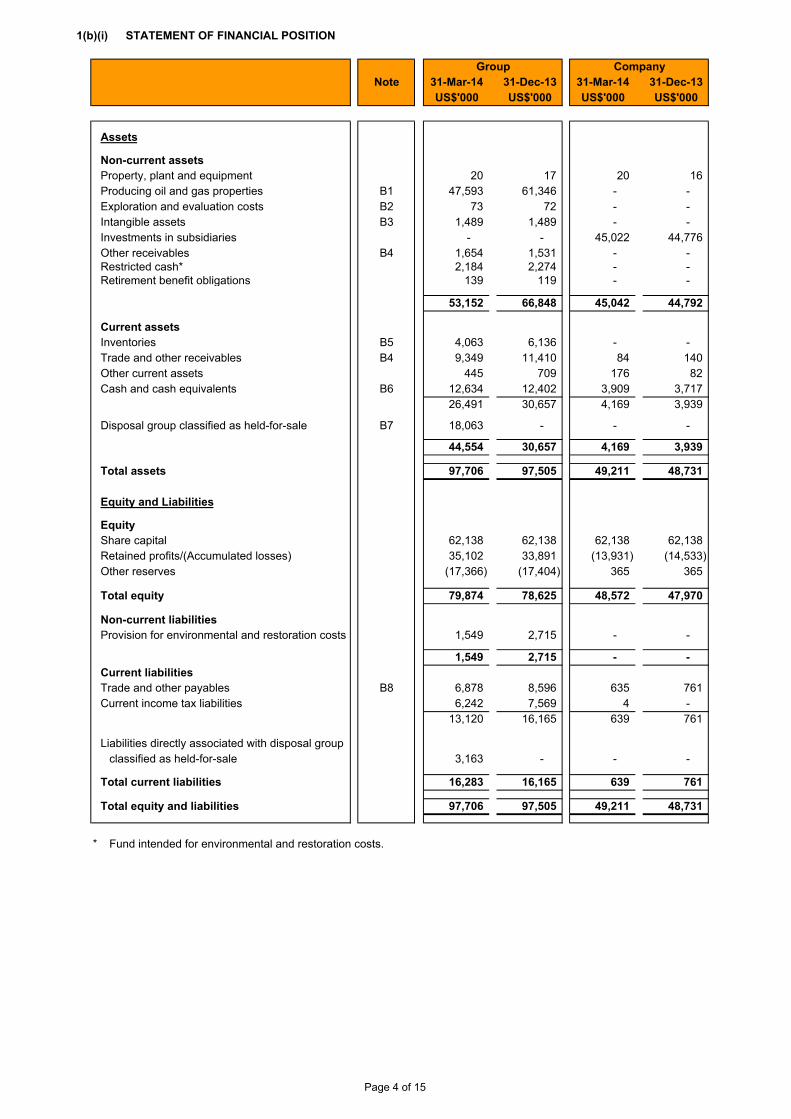
Non-current assetsProperty, plant and equipment 20 17 20 16 Producing oil and gas properties B1 47,593 61,346 - - Exploration and evaluation costs B2 73 72 - - Intangible assets B3 1,489 1,489 - - Investments in subsidiaries - - 45,022 44,776 Other receivables B4 1,654 1,531 - - Restricted cash* 2,184 2,274 - - Retirement benefit obligations 139 119 - -
53,152 66,848 45,042 44,792
Current assetsInventories B5 4,063 6,136 - - Trade and other receivables B4 9,349 11,410 84 140 Other current assets 445 709 176 82 Cash and cash equivalents B6 12,634 12,402 3,909 3,717
26,491 30,657 4,169 3,939
Disposal group classified as held-for-sale B7 18,063 - - -
44,554 30,657 4,169 3,939
Total assets 97,706 97,505 49,211 48,731
Equity and Liabilities
EquityShare capital 62,138 62,138 62,138 62,138 Retained profits/(Accumulated losses) 35,102 33,891 (13,931) (14,533) Other reserves (17,366) (17,404) 365 365
Total equity 79,874 78,625 48,572 47,970
Non-current liabilitiesProvision for environmental and restoration costs 1,549 2,715 - -
1,549 2,715 - - Current liabilitiesTrade and other payables B8 6,878 8,596 635 761 Current income tax liabilities 6,242 7,569 4 -
13,120 16,165 639 761
Liabilities directly associated with disposal groupclassified as held-for-sale 3,163 - - -
Total current liabilities 16,283 16,165 639 761
Total equity and liabilities 97,706 97,505 49,211 48,731
* Fund intended for environmental and restoration costs.
Group
Page 4 of 15
EXPLANATORY NOTES TO STATEMENT OF FINANCIAL POSITION
Group 31-Mar-14 31-Dec-13US$'000 US$'000
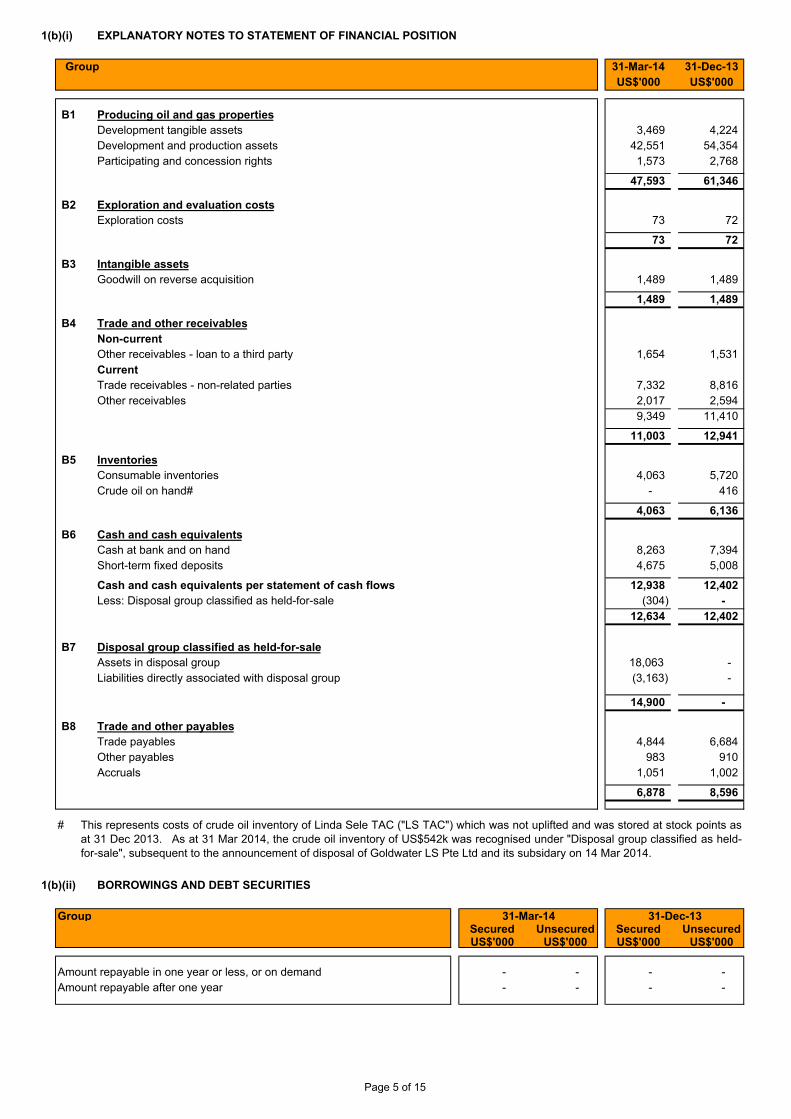
B1 Producing oil and gas propertiesDevelopment tangible assets 3,469 4,224 Development and production assets 42,551 54,354 Participating and concession rights 1,573 2,768
47,593 61,346
B2 Exploration and evaluation costsExploration costs 73 72
73 72
B3 Intangible assetsGoodwill on reverse acquisition 1,489 1,489
1,489 1,489
B4 Trade and other receivablesNon-currentOther receivables - loan to a third party 1,654 1,531 CurrentTrade receivables - non-related parties 7,332 8,816 Other receivables 2,017 2,594
9,349 11,410
11,003 12,941
B5 InventoriesConsumable inventories 4,063 5,720 Crude oil on hand# - 416
4,063 6,136
B6 Cash and cash equivalentsCash at bank and on hand 8,263 7,394 Short-term fixed deposits 4,675 5,008
Cash and cash equivalents per statement of cash flows 12,938 12,402 Less: Disposal group classified as held-for-sale (304) -
12,634 12,402
B7Assets in disposal group 18,063 - Liabilities directly associated with disposal group (3,163) -
14,900 -
B8 Trade and other payablesTrade payables 4,844 6,684 Other payables 983 910 Accruals 1,051 1,002
6,878 8,596
#
BORROWINGS AND DEBT SECURITIES
GroupSecured Unsecured Secured UnsecuredUS$'000 US$'000 US$'000 US$'000
Amount repayable in one year or less, or on demand - - - - Amount repayable after one year - - - -
This represents costs of crude oil inventory of Linda Sele TAC ("LS TAC") which was not uplifted and was stored at stock points asat 31 Dec 2013. As at 31 Mar 2014, the crude oil inventory of US$542k was recognised under "Disposal group classified as held-for-sale", subsequent to the announcement of disposal of Goldwater LS Pte Ltd and its subsidary on 14 Mar 2014.
31-Mar-14 31-Dec-13
1(b)(i)
1(b)(ii)
Disposal group classified as held-for-sale
Page 5 of 15
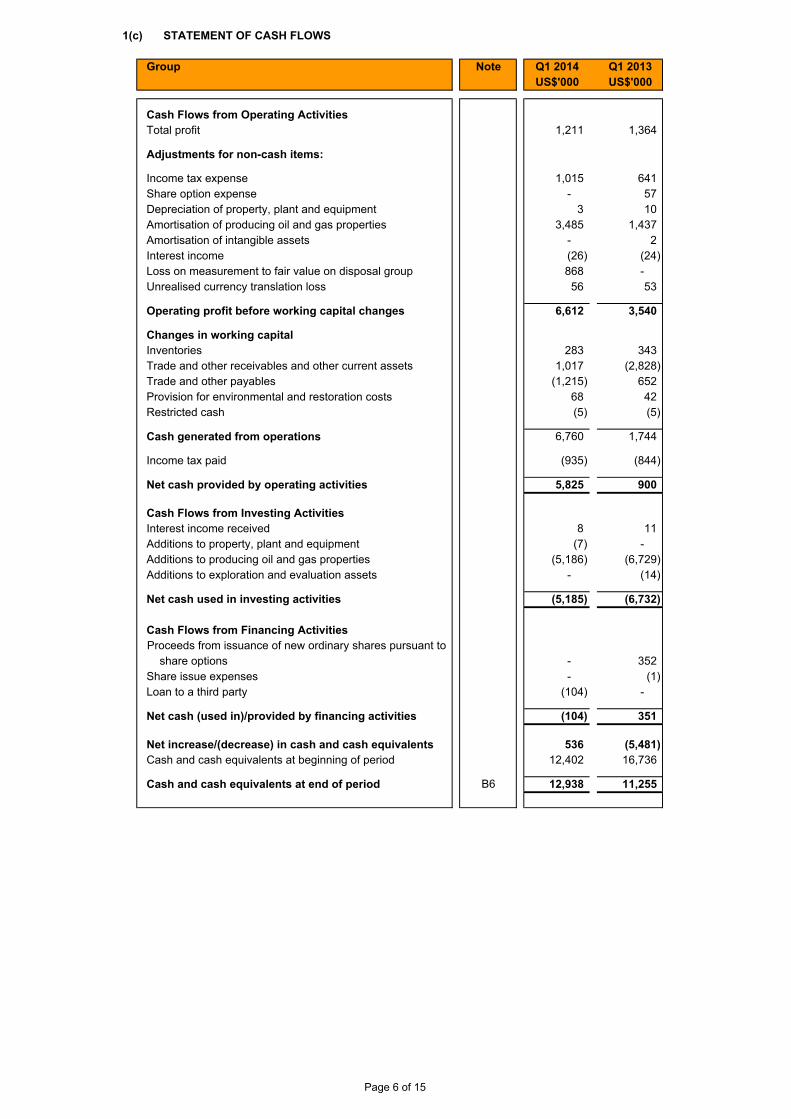
STATEMENT OF CASH FLOWS
Group Note Q1 2014 Q1 2013US$'000 US$'000
Cash Flows from Operating ActivitiesTotal profit 1,211 1,364
Adjustments for non-cash items:
Income tax expense 1,015 641 Share option expense - 57 Depreciation of property, plant and equipment 3 10 Amortisation of producing oil and gas properties 3,485 1,437 Amortisation of intangible assets - 2 Interest income (26) (24) Loss on measurement to fair value on disposal group 868 - Unrealised currency translation loss 56 53
Operating profit before working capital changes 6,612 3,540
Inventories 283 343 Trade and other receivables and other current assets 1,017 (2,828) Trade and other payables (1,215) 652 Provision for environmental and restoration costs 68 42 Restricted cash (5) (5)
Cash generated from operations 6,760 1,744
Income tax paid (935) (844)
Net cash provided by operating activities 5,825 900
Cash Flows from Investing ActivitiesInterest income received 8 11 Additions to property, plant and equipment (7) - Additions to producing oil and gas properties (5,186) (6,729) Additions to exploration and evaluation assets - (14)
Net cash used in investing activities (5,185) (6,732)
Cash Flows from Financing Activities
- 352 Share issue expenses - (1) Loan to a third party (104) -
Net cash (used in)/provided by financing activities (104) 351
Net increase/(decrease) in cash and cash equivalents 536 (5,481) Cash and cash equivalents at beginning of period 12,402 16,736
Cash and cash equivalents at end of period B6 12,938 11,255
share options
Changes in working capital
1(c)
Proceeds from issuance of new ordinary shares pursuant to
Page 6 of 15
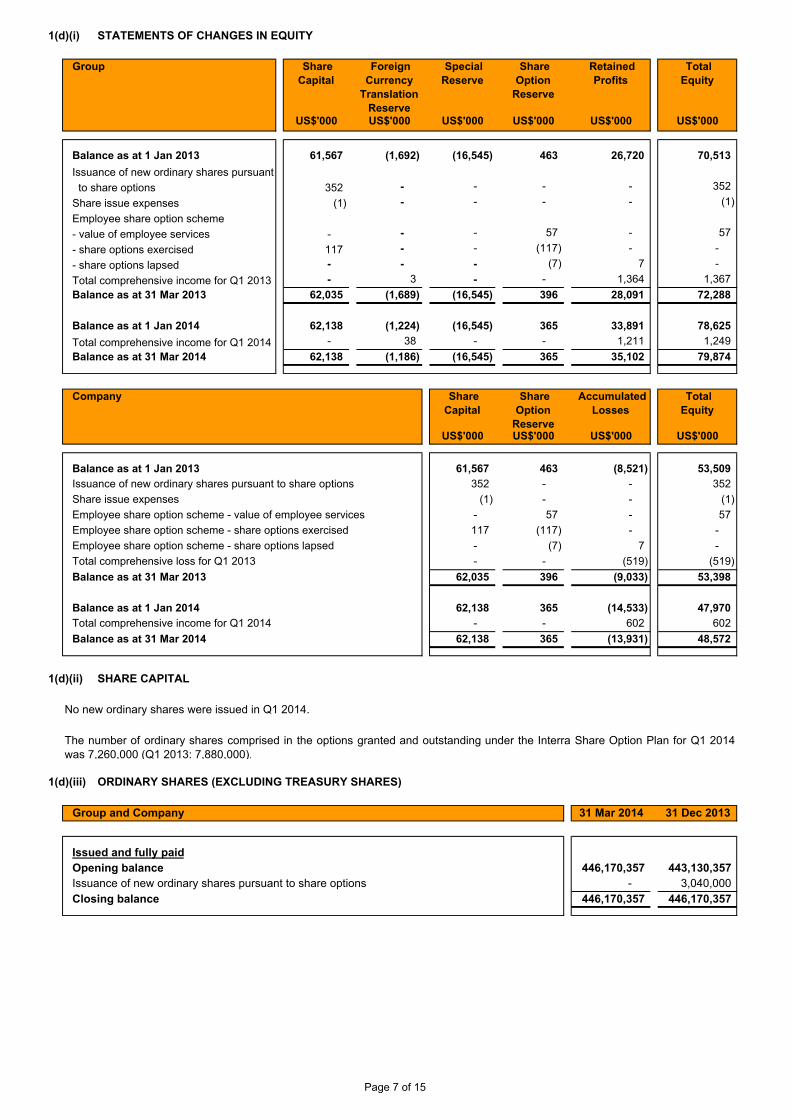
STATEMENTS OF CHANGES IN EQUITY
Group
US$'000 US$'000 US$'000 US$'000 US$'000 US$'000
Balance as at 1 Jan 2013 61,567 (1,692) (16,545) 463 26,720 70,513 Issuance of new ordinary shares pursuant to share options 352 - - - - 352 Share issue expenses (1) - - - - (1) Employee share option scheme- value of employee services - - - 57 - 57 - share options exercised 117 - - (117) - - - share options lapsed - - - (7) 7 - Total comprehensive income for Q1 2013 - 3 - - 1,364 1,367 Balance as at 31 Mar 2013 62,035 (1,689) (16,545) 396 28,091 72,288
Balance as at 1 Jan 2014 62,138 (1,224) (16,545) 365 33,891 78,625 Total comprehensive income for Q1 2014 - 38 - - 1,211 1,249 Balance as at 31 Mar 2014 62,138 (1,186) (16,545) 365 35,102 79,874
Company
US$'000 US$'000 US$'000 US$'000
Balance as at 1 Jan 2013 61,567 463 (8,521) 53,509 Issuance of new ordinary shares pursuant to share options 352 - - 352 Share issue expenses (1) - - (1) Employee share option scheme - value of employee services - 57 - 57 Employee share option scheme - share options exercised 117 (117) - - Employee share option scheme - share options lapsed - (7) 7 - Total comprehensive loss for Q1 2013 - - (519) (519) Balance as at 31 Mar 2013 62,035 396 (9,033) 53,398
Balance as at 1 Jan 2014 62,138 365 (14,533) 47,970 Total comprehensive income for Q1 2014 - - 602 602 Balance as at 31 Mar 2014 62,138 365 (13,931) 48,572
SHARE CAPITAL
ORDINARY SHARES (EXCLUDING TREASURY SHARES)
31 Mar 2014 31 Dec 2013
Issued and fully paidOpening balance 446,170,357 443,130,357 Issuance of new ordinary shares pursuant to share options - 3,040,000 Closing balance 446,170,357 446,170,357
Total Equity
1(d)(i)
Share Capital
Retained Profits
Share Option
Reserve
Special Reserve
Foreign Currency
Translation Reserve
No new ordinary shares were issued in Q1 2014.
Group and Company
Share Capital
Share Option
Reserve
Accumulated Losses
Total Equity
1(d)(ii)
1(d)(iii)
The number of ordinary shares comprised in the options granted and outstanding under the Interra Share Option Plan for Q1 2014was 7,260,000 (Q1 2013: 7,880,000).
Page 7 of 15
2
3
4
5
-----------
The Group has adopted all the new and revised Singapore Financial Reporting Standards (FRS) and Interpretations of FRS (INTFRS) that are relevant to its operations and effective for annual periods beginning on or after 1 Jan 2014. Consequentialamendments made to these new or revised standards.
The new or amended FRS that are relevant to the Group and the Company are as follows:
A STATEMENT SHOWING ALL SALES, DISPOSAL, CANCELLATION AND/OR USE OF TREASURY SHARES AS AT THEEND OF THE CURRENT FINANCIAL PERIOD REPORTED ON
The adoption of the new or revised FRS and INT FRS does not result in any changes to the Group's and the Company'saccounting policies and has no material effect on the amounts reported for the current period or prior years.
WHETHER THE FIGURES HAVE BEEN AUDITED OR REVIEWED, AND IN ACCORDANCE WITH WHICH AUDITINGSTANDARD OR PRACTICE
WHERE THE FIGURES HAVE BEEN AUDITED OR REVIEWED, THE AUDITORS’ REPORT (INCLUDING ANYQUALIFICATIONS OR EMPHASIS OF A MATTER)
WHETHER THE SAME ACCOUNTING POLICIES AND METHODS OF COMPUTATION AS IN THE ISSUER’S MOSTRECENTLY AUDITED ANNUAL FINANCIAL STATEMENTS HAVE BEEN APPLIED
IF THERE ARE ANY CHANGES IN THE ACCOUNTING POLICIES AND METHODS OF COMPUTATION, INCLUDING ANYREQUIRED BY AN ACCOUNTING STANDARD, WHAT HAS CHANGED, AS WELL AS THE REASONS FOR, AND THEEFFECT OF, THE CHANGE
Except as disclosed in Note 5 below, the Group has applied the same accounting policies and methods of computation in thefinancial statements for the current reporting period compared with the audited financial statements for the financial year ended 31Dec 2013.
The figures have not been audited or reviewed by the independent auditor, Nexia TS Public Accounting Corporation.
Amendments to FRS 36 - Recoverable Amount Disclosures for Non-Financial Assets
NA.
FRS 27 (revised 2011) - Separate Financial StatementsFRS 28 (revised 2011) - Investments in Associates and Joint VenturesAmendments to FRS 32 - Offsetting Financial Assets and Financial Liabilities
1(d)(iv)
NA.
Amendments to FRS 110, FRS 111, FRS 112, FRS 27 (2011) and FRS 28 (2011) - Mandatory Effective Date
Amendments to FRS 110, FRS 111, FRS 112 and FRS 27 - Investment EntitiesAmendments to FRS 110, FRS 111, FRS 112 and FRS 27 - Transition Guidance
Amendments to FRS 39 - Novation of Derivatives and Continuation of Hedge Accounting FRS 110 - Consolidated Financial StatementsFRS 111 - Joint ArrangementsFRS 112 - Disclosure of Interests in Other Entities
Page 8 of 15
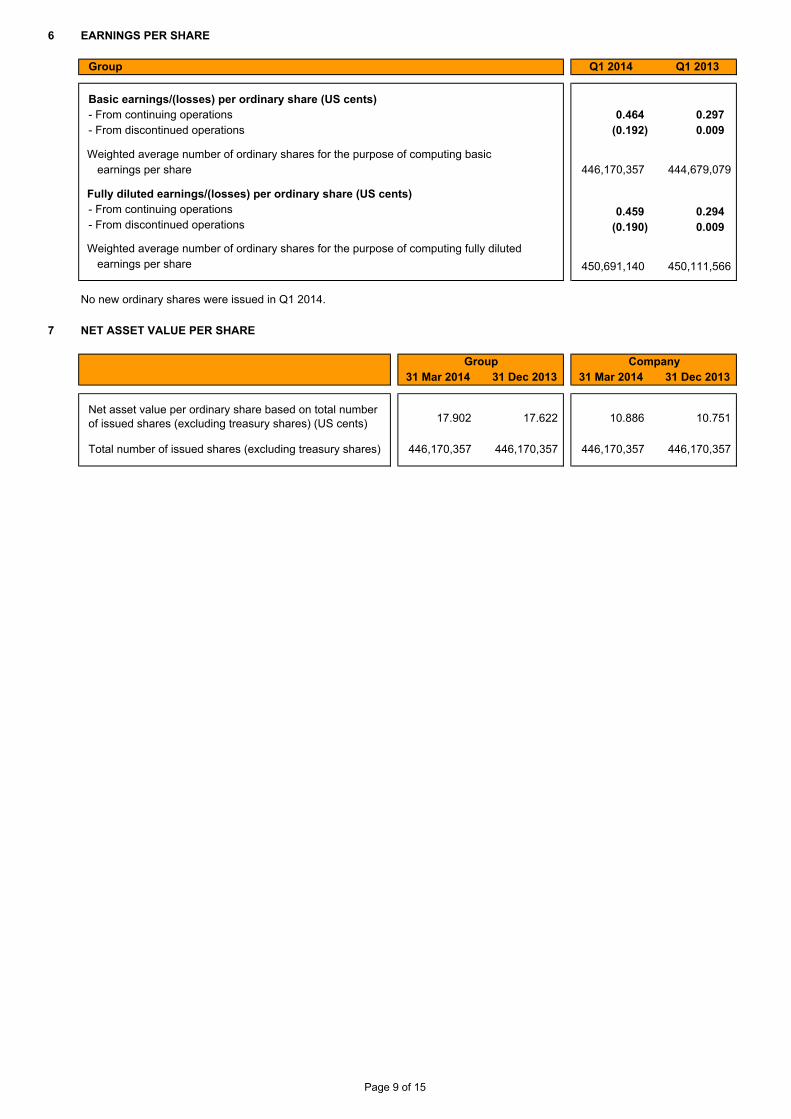
6 EARNINGS PER SHARE
Group Q1 2014 Q1 2013
0.464 0.297 (0.192) 0.009
446,170,357 444,679,079
0.459 0.294 (0.190) 0.009
450,691,140 450,111,566
7 NET ASSET VALUE PER SHARE
Group Company31 Mar 2014 31 Dec 2013 31 Mar 2014 31 Dec 2013
17.902 17.622 10.886 10.751
446,170,357 446,170,357 446,170,357 446,170,357
Net asset value per ordinary share based on total number of issued shares (excluding treasury shares) (US cents)
Total number of issued shares (excluding treasury shares)
No new ordinary shares were issued in Q1 2014.
Basic earnings/(losses) per ordinary share (US cents)
earnings per share
Weighted average number of ordinary shares for the purpose of computing basicearnings per share
- From continuing operations- From discontinued operations
- From continuing operations- From discontinued operations
Weighted average number of ordinary shares for the purpose of computing fully diluted
Fully diluted earnings/(losses) per ordinary share (US cents)
Page 9 of 15
PERFORMANCE REVIEW
(A) SIGNIFICANT FACTORS THAT AFFECT THE TURNOVER, COSTS AND EARNINGS OF THE GROUP
Revenue & Production
Cost of Production
Net Profit After Tax
8(i)
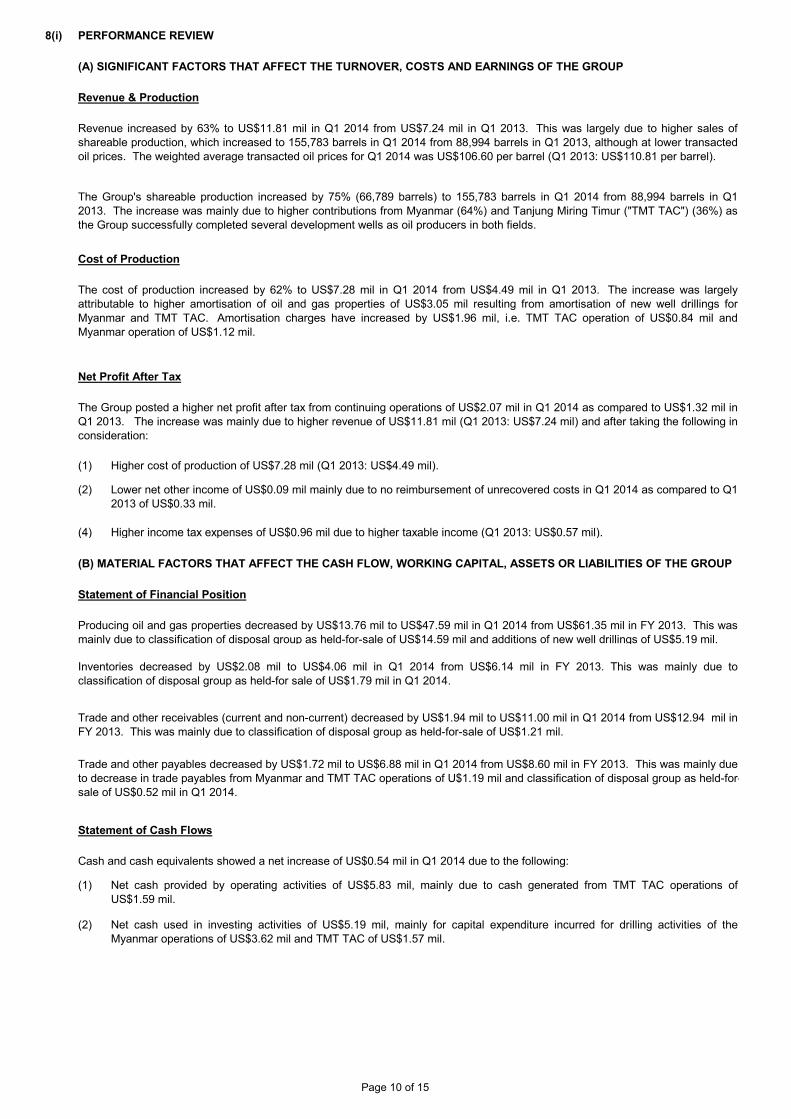
(1) Higher cost of production of US$7.28 mil (Q1 2013: US$4.49 mil).
Revenue increased by 63% to US$11.81 mil in Q1 2014 from US$7.24 mil in Q1 2013. This was largely due to higher sales ofshareable production, which increased to 155,783 barrels in Q1 2014 from 88,994 barrels in Q1 2013, although at lower transactedoil prices. The weighted average transacted oil prices for Q1 2014 was US$106.60 per barrel (Q1 2013: US$110.81 per barrel).
The Group posted a higher net profit after tax from continuing operations of US$2.07 mil in Q1 2014 as compared to US$1.32 mil inQ1 2013. The increase was mainly due to higher revenue of US$11.81 mil (Q1 2013: US$7.24 mil) and after taking the following inconsideration:
The cost of production increased by 62% to US$7.28 mil in Q1 2014 from US$4.49 mil in Q1 2013. The increase was largelyattributable to higher amortisation of oil and gas properties of US$3.05 mil resulting from amortisation of new well drillings forMyanmar and TMT TAC. Amortisation charges have increased by US$1.96 mil, i.e. TMT TAC operation of US$0.84 mil andMyanmar operation of US$1.12 mil.
The Group's shareable production increased by 75% (66,789 barrels) to 155,783 barrels in Q1 2014 from 88,994 barrels in Q12013. The increase was mainly due to higher contributions from Myanmar (64%) and Tanjung Miring Timur ("TMT TAC") (36%) asthe Group successfully completed several development wells as oil producers in both fields.
(4) Higher income tax expenses of US$0 96 mil due to higher taxable income (Q1 2013: US$0 57 mil)
(2) Lower net other income of US$0.09 mil mainly due to no reimbursement of unrecovered costs in Q1 2014 as compared to Q12013 of US$0.33 mil.
(B) MATERIAL FACTORS THAT AFFECT THE CASH FLOW, WORKING CAPITAL, ASSETS OR LIABILITIES OF THE GROUP
Statement of Financial Position
Statement of Cash Flows
Producing oil and gas properties decreased by US$13.76 mil to US$47.59 mil in Q1 2014 from US$61.35 mil in FY 2013. This wasmainly due to classification of disposal group as held-for-sale of US$14.59 mil and additions of new well drillings of US$5.19 mil.
Inventories decreased by US$2.08 mil to US$4.06 mil in Q1 2014 from US$6.14 mil in FY 2013. This was mainly due toclassification of disposal group as held-for sale of US$1.79 mil in Q1 2014.
(4) Higher income tax expenses of US$0.96 mil due to higher taxable income (Q1 2013: US$0.57 mil).
Trade and other receivables (current and non-current) decreased by US$1.94 mil to US$11.00 mil in Q1 2014 from US$12.94 mil inFY 2013. This was mainly due to classification of disposal group as held-for-sale of US$1.21 mil.
Cash and cash equivalents showed a net increase of US$0.54 mil in Q1 2014 due to the following:
(1) Net cash provided by operating activities of US$5.83 mil, mainly due to cash generated from TMT TAC operations ofUS$1.59 mil.
(2) Net cash used in investing activities of US$5.19 mil, mainly for capital expenditure incurred for drilling activities of theMyanmar operations of US$3.62 mil and TMT TAC of US$1.57 mil.
Trade and other payables decreased by US$1.72 mil to US$6.88 mil in Q1 2014 from US$8.60 mil in FY 2013. This was mainly dueto decrease in trade payables from Myanmar and TMT TAC operations of U$1.19 mil and classification of disposal group as held-for-sale of US$0.52 mil in Q1 2014.
Page 10 of 15
SEGMENTED REVENUE AND RESULTS
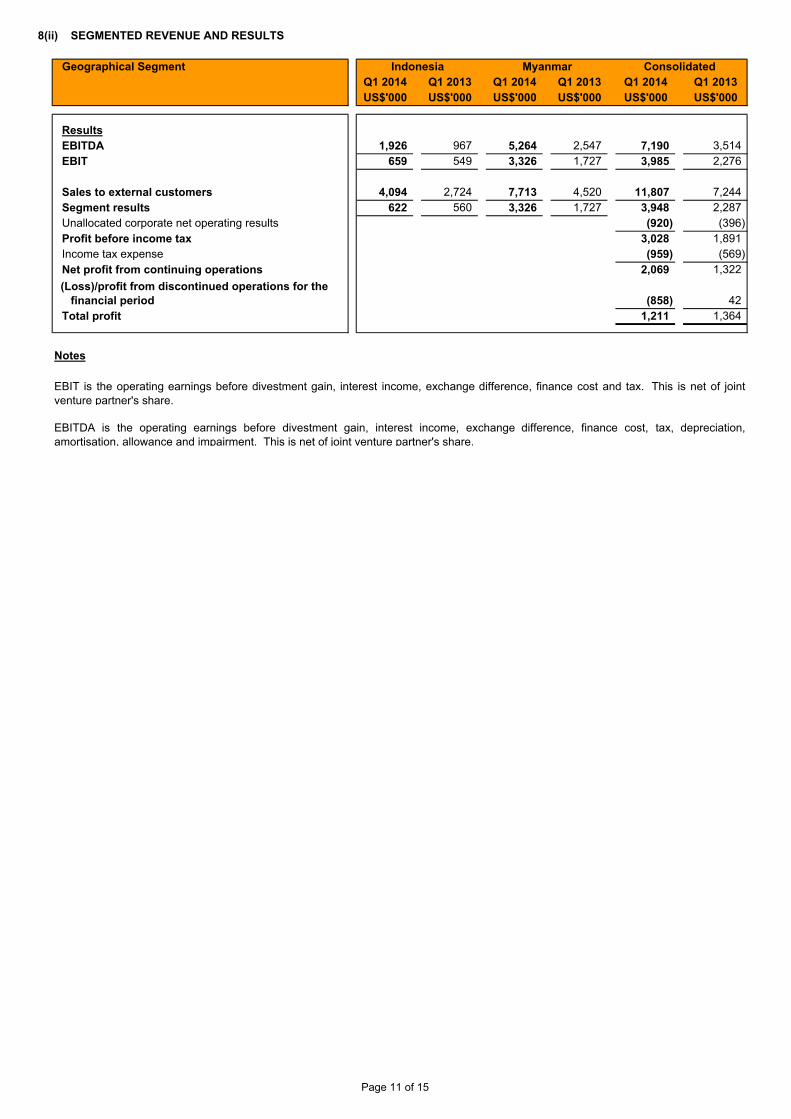
Geographical Segment Indonesia Myanmar ConsolidatedQ1 2014 Q1 2013 Q1 2014 Q1 2013 Q1 2014 Q1 2013US$'000 US$'000 US$'000 US$'000 US$'000 US$'000
ResultsEBITDA 1,926 967 5,264 2,547 7,190 3,514 EBIT 659 549 3,326 1,727 3,985 2,276
Sales to external customers 4,094 2,724 7,713 4,520 11,807 7,244 Segment results 622 560 3,326 1,727 3,948 2,287 Unallocated corporate net operating results - - (101) 214 (920) (396) Profit before income tax 3,028 1,891 Income tax expense - - (706) (414) (959) (569) Net profit from continuing operations - - (706) (414) 2,069 1,322
financial period (858) 42 Total profit 1,211 1,364
Notes
8(ii)
EBIT is the operating earnings before divestment gain, interest income, exchange difference, finance cost and tax. This is net of jointventure partner's share.
EBITDA is the operating earnings before divestment gain, interest income, exchange difference, finance cost, tax, depreciation,amortisation, allowance and impairment. This is net of joint venture partner's share.
(Loss)/profit from discontinued operations for the
Page 11 of 15
8(iii) PRODUCTION PROFILE
Q1 2014 Q1 2013barrels barrels
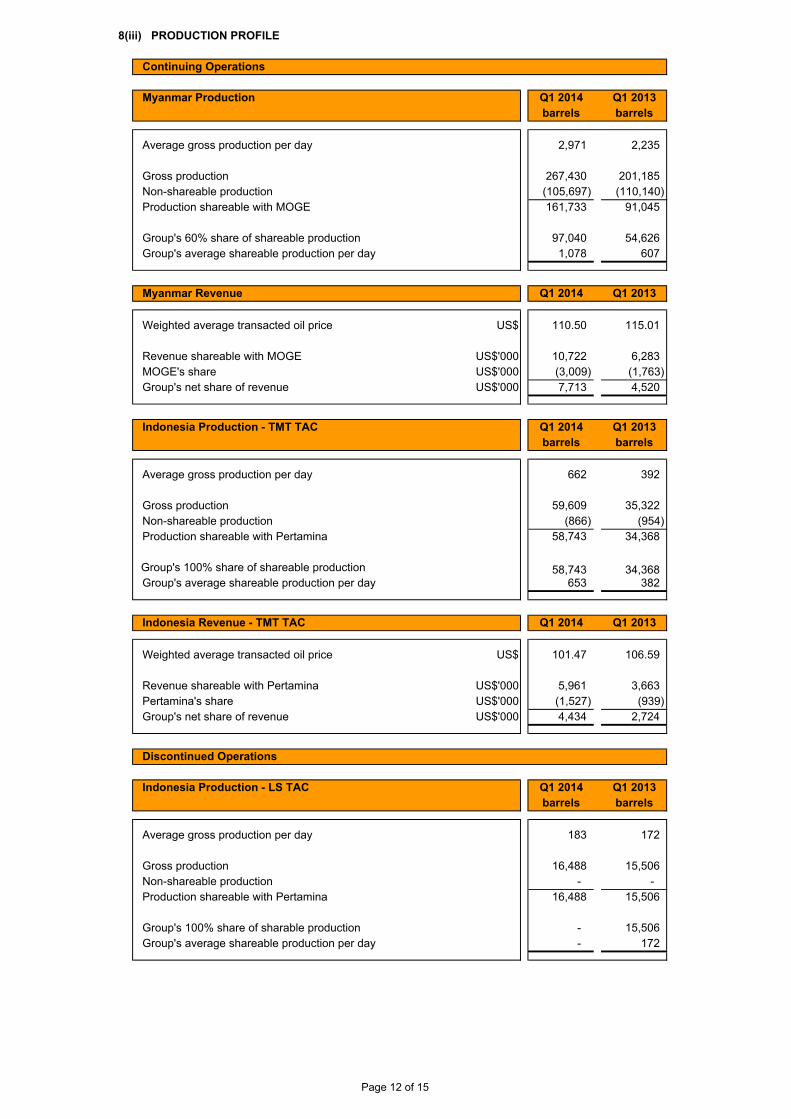
Average gross production per day 2,971 2,235
Gross production 267,430 201,185 Non-shareable production (105,697) (110,140)Production shareable with MOGE 161,733 91,045
Group's 60% share of shareable production 97,040 54,626 Group's average shareable production per day 1,078 607
Q1 2014 Q1 2013
Weighted average transacted oil price US$ 110.50 115.01
Revenue shareable with MOGE US$'000 10,722 6,283 MOGE's share US$'000 (3,009) (1,763)Group's net share of revenue US$'000 7,713 4,520
Q1 2014 Q1 2013barrels barrels
Average gross production per day 662 392
Gross production 59,609 35,322 Non-shareable production (866) (954)Production shareable with Pertamina 58,743 34,368
58,743 34,368 Group's average shareable production per day 653 382
Q1 2014 Q1 2013
Weighted average transacted oil price US$ 101.47 106.59
Revenue shareable with Pertamina US$'000 5,961 3,663 Pertamina's share US$'000 (1,527) (939)Group's net share of revenue US$'000 4,434 2,724
Q1 2014 Q1 2013barrels barrels
Average gross production per day 183 172
Gross production 16,488 15,506 Non-shareable production - - Production shareable with Pertamina 16,488 15,506
Group's 100% share of sharable production - 15,506 Group's average shareable production per day - 172
Group's 100% share of shareable production
Indonesia Revenue - TMT TAC
Continuing Operations
Discontinued Operations
Myanmar Production
Myanmar Revenue
Indonesia Production - TMT TAC
Indonesia Production - LS TAC
Page 12 of 15
8(iii) PRODUCTION PROFILE (CONT'D)
Q1 2014 Q1 2013barrels barrels
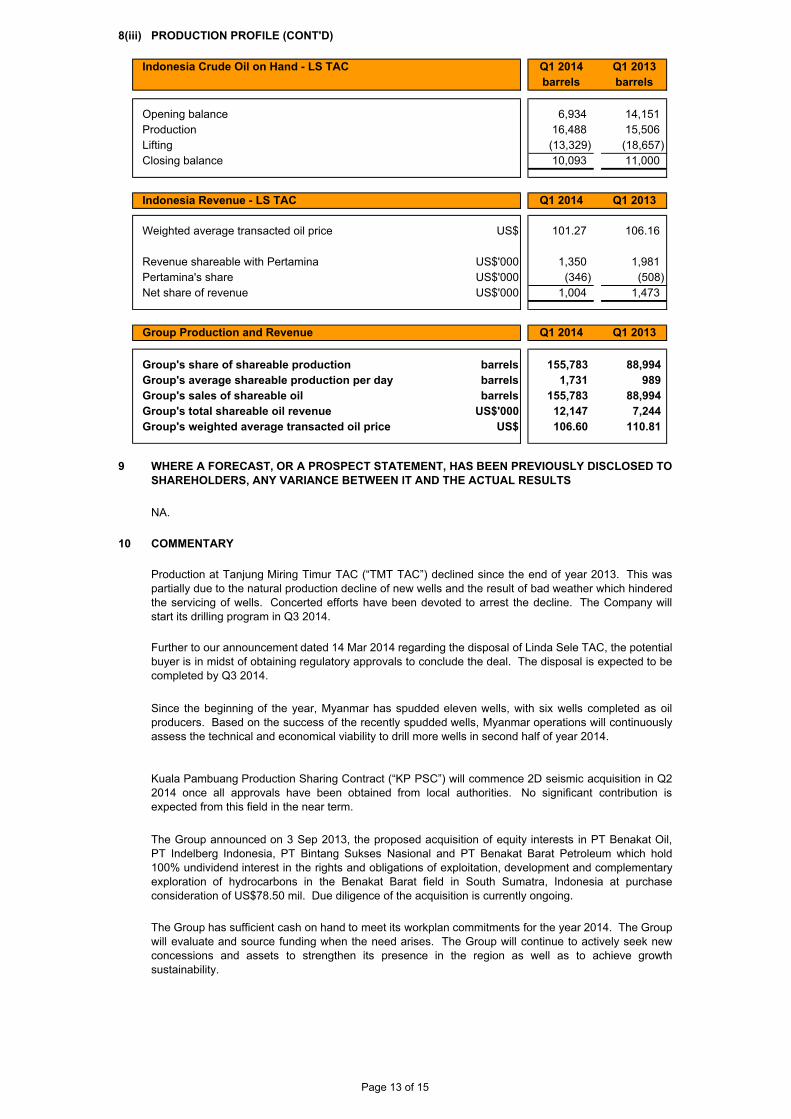
Opening balance 6,934 14,151 Production 16,488 15,506 Lifting (13,329) (18,657)Closing balance 10,093 11,000
Q1 2014 Q1 2013
Weighted average transacted oil price US$ 101.27 106.16
Revenue shareable with Pertamina US$'000 1,350 1,981 Pertamina's share US$'000 (346) (508)Net share of revenue US$'000 1,004 1,473
Q1 2014 Q1 2013
Group's share of shareable production barrels 155,783 88,994 Group's average shareable production per day barrels 1,731 989 Group's sales of shareable oil barrels 155,783 88,994 Group's total shareable oil revenue US$'000 12,147 7,244 Group's weighted average transacted oil price US$ 106.60 110.81
9
The Group announced on 3 Sep 2013, the proposed acquisition of equity interests in PT Benakat Oil,PT Indelberg Indonesia, PT Bintang Sukses Nasional and PT Benakat Barat Petroleum which hold100% undividend interest in the rights and obligations of exploitation, development and complementaryexploration of hydrocarbons in the Benakat Barat field in South Sumatra, Indonesia at purchaseconsideration of US$78.50 mil. Due diligence of the acquisition is currently ongoing.
Since the beginning of the year, Myanmar has spudded eleven wells, with six wells completed as oilproducers. Based on the success of the recently spudded wells, Myanmar operations will continuouslyassess the technical and economical viability to drill more wells in second half of year 2014.
Indonesia Revenue - LS TAC
10
WHERE A FORECAST, OR A PROSPECT STATEMENT, HAS BEEN PREVIOUSLY DISCLOSED TOSHAREHOLDERS, ANY VARIANCE BETWEEN IT AND THE ACTUAL RESULTS
NA.
COMMENTARY
Production at Tanjung Miring Timur TAC (“TMT TAC”) declined since the end of year 2013. This waspartially due to the natural production decline of new wells and the result of bad weather which hinderedthe servicing of wells. Concerted efforts have been devoted to arrest the decline. The Company willstart its drilling program in Q3 2014.
Further to our announcement dated 14 Mar 2014 regarding the disposal of Linda Sele TAC, the potentialbuyer is in midst of obtaining regulatory approvals to conclude the deal. The disposal is expected to becompleted by Q3 2014.
The Group has sufficient cash on hand to meet its workplan commitments for the year 2014. The Groupwill evaluate and source funding when the need arises. The Group will continue to actively seek newconcessions and assets to strengthen its presence in the region as well as to achieve growthsustainability.
Kuala Pambuang Production Sharing Contract (“KP PSC”) will commence 2D seismic acquisition in Q22014 once all approvals have been obtained from local authorities. No significant contribution isexpected from this field in the near term.
Indonesia Crude Oil on Hand - LS TAC
Group Production and Revenue
Page 13 of 15
DIVIDEND
(a) Any dividend recommended for the current financial period reported onNo.
(b) Any dividend declared for the corresponding period of the immediately preceding financial yearNo.
(c) Whether the dividend is before tax, net of tax or tax exemptNA.
(d) Date payableNA.
(e) Books closure dateNA.
IF NO DIVIDEND HAS BEEN DECLARED (RECOMMENDED), A STATEMENT TO THAT EFFECT
The Company has not declared a dividend for the current financial period reported on.
INTERESTED PERSON TRANSACTIONS
CONFIRMATION BY THE BOARD OF DIRECTORS PURSUANT TO RULE 705(5)
By Order of the Board of Directors ofINTERRA RESOURCES LIMITEDMarcel TjiaChief Executive Officer14-May-14
The Company has not obtained any general mandate pursuant to Rule 920(1)(a)(ii) of the Listing Rules.
The board of directors of the Company hereby confirms to the best of their knowledge that nothing has come to the attention of theBoard of Directors which may render the interim financial statements for the quarter ended 31 Mar 2014 to be false or misleading inany material respect.
11
12
13
14
Page 14 of 15
ABBREVIATIONS
Q1 2013 denotes First calendar quarter of the year 2013Q1 2014 denotes First calendar quarter of the year 2014FY 2013 denotes Full year ended 31 December 2013FY 2014 denotes Full year ended 31 December 2014bopd denotes barrels of oil per dayCompany denotes Interra Resources LimitedDMO denotes Domestic Market ObligationEED denotes Exploration, evaluation and developmentFRS denotes Financial Reporting StandardsGoldpetrol denotes Goldpetrol Joint Operating Company Inc.Goldwater denotes Goldwater Company LimitedGroup denotes Interra Resources Limited and its subsidiary companies and joint venturesGKP denotes Goldwater KP Pte. Ltd.GLS denotes Goldwater LS Pte. Ltd.GTMT denotes Goldwater TMT Pte. Ltd.IBN denotes IBN Oil Holdico LtdIPRC denotes Improved Petroleum Recovery ContractIRA denotes Interra Resources (Australia) Pte. Ltd.IRT denotes Interra Resources (Thailand) Limitedk denotes thousandKP denotes Kuala Pambuang blockLS denotes Linda Sele fieldsmil denotes millionMOGE denotes Myanma Oil and Gas EnterpriseNA denotes Not applicableNM denotes Not meaningfulPertamina denotes Perusahaan Pertambangan Minyak Dan Gas Bumi NegaraPSC denotes Production Sharing ContractTAC denotes Technical Assistance ContractTMT denotes Tanjung Miring Timur field
This release may contain forward-looking statements that are subject to risk factors associated with oil and gas businesses. Actualfuture performance, outcomes and results may differ materially from those expressed in forward-looking statements as a result of anumber of risks, uncertainties and assumptions including but not limited to: oil and gas price fluctuations, actual demand, currencyfluctuations, drilling and production results, reserve estimates, loss of market, industry competition, environmental risks, physical risks,legislative, fiscal and regulatory developments, general industry conditions, economic and financial market conditions in variouscountries and regions, political risks, project delay or advancement, approvals, cost estimates, changes in operating expenses, cost ofcapital and capital availability, interest rate trends and the continued availability of financing in the amounts and the terms necessary tosupport future business. You are cautioned not to place undue reliance on these forward looking statements, which are based on thecurrent view of management on future events.
15
Page 15 of 15
Appendix A
Interra Resources Limited 1 Grange Road #05-04 Orchard Building Singapore 239693 Tel (65) 6732 1711 Fax (65) 6738 1170 www.interraresources.com
14 May 2014
PRODUCTION, DEVELOPMENT & EXPLORATION ACTIVITIES
FOR THE QUARTER ENDED 31 MARCH 2014 (“Q1 2014”)
Production Profile
(barrels) Myanmar Indonesia (TMT)
Indonesia (LS)
Q4 2013 Q1 2014 Q4 2013 Q1 2014 Q4 2013 Q1 2014
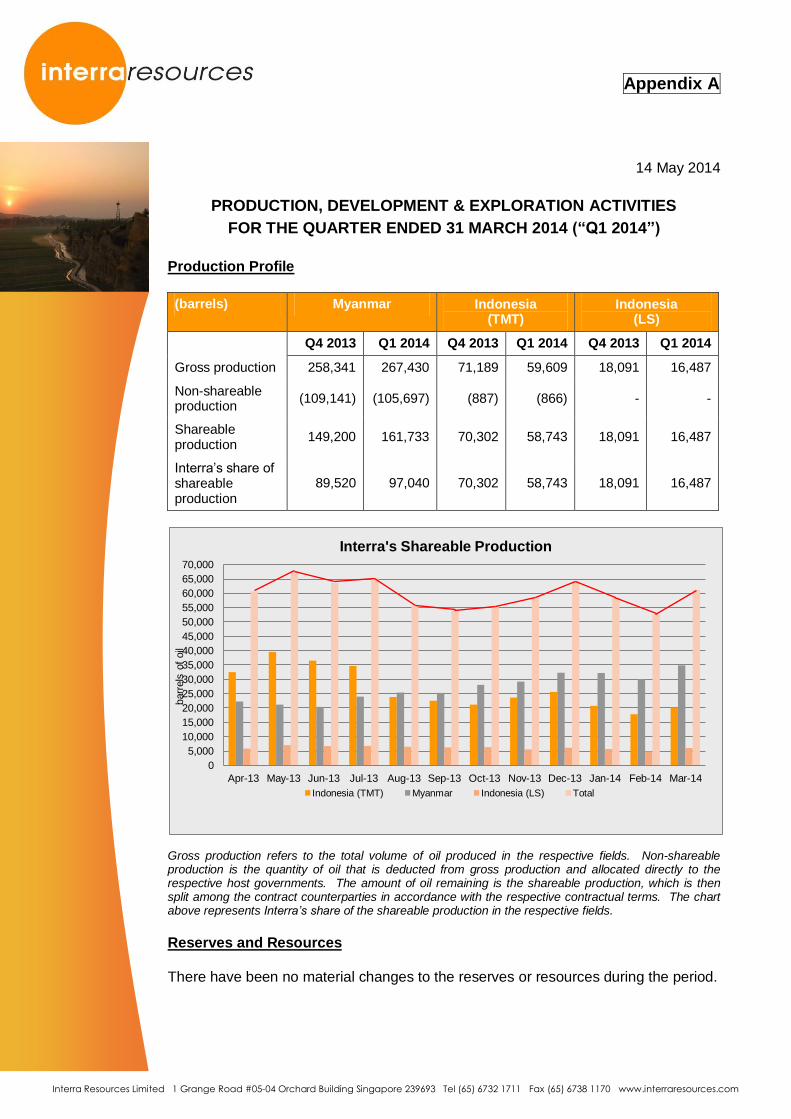
Gross production 258,341 267,430 71,189 59,609 18,091 16,487
Non-shareable production
(109,141) (105,697) (887) (866) - -
Shareable production
149,200 161,733 70,302 58,743 18,091 16,487
Interra’s share of shareable production
89,520 97,040 70,302 58,743 18,091 16,487
Gross production refers to the total volume of oil produced in the respective fields. Non-shareable production is the quantity of oil that is deducted from gross production and allocated directly to the respective host governments. The amount of oil remaining is the shareable production, which is then split among the contract counterparties in accordance with the respective contractual terms. The chart above represents Interra’s share of the shareable production in the respective fields.
Reserves and Resources
There have been no material changes to the reserves or resources during the period.
0
5,000
10,000
15,000
20,000
25,000
30,000
35,000
40,000
45,000
50,000
55,000
60,000
65,000
70,000
Apr-13 May-13 Jun-13 Jul-13 Aug-13 Sep-13 Oct-13 Nov-13 Dec-13 Jan-14 Feb-14 Mar-14
barr
els
of
oil
Interra's Shareable Production
Indonesia (TMT) Myanmar Indonesia (LS) Total
Production, Development & Exploration Activities
For the Quarter Ended 31 March 2014
Page 2 of 4
Development and Production Activities
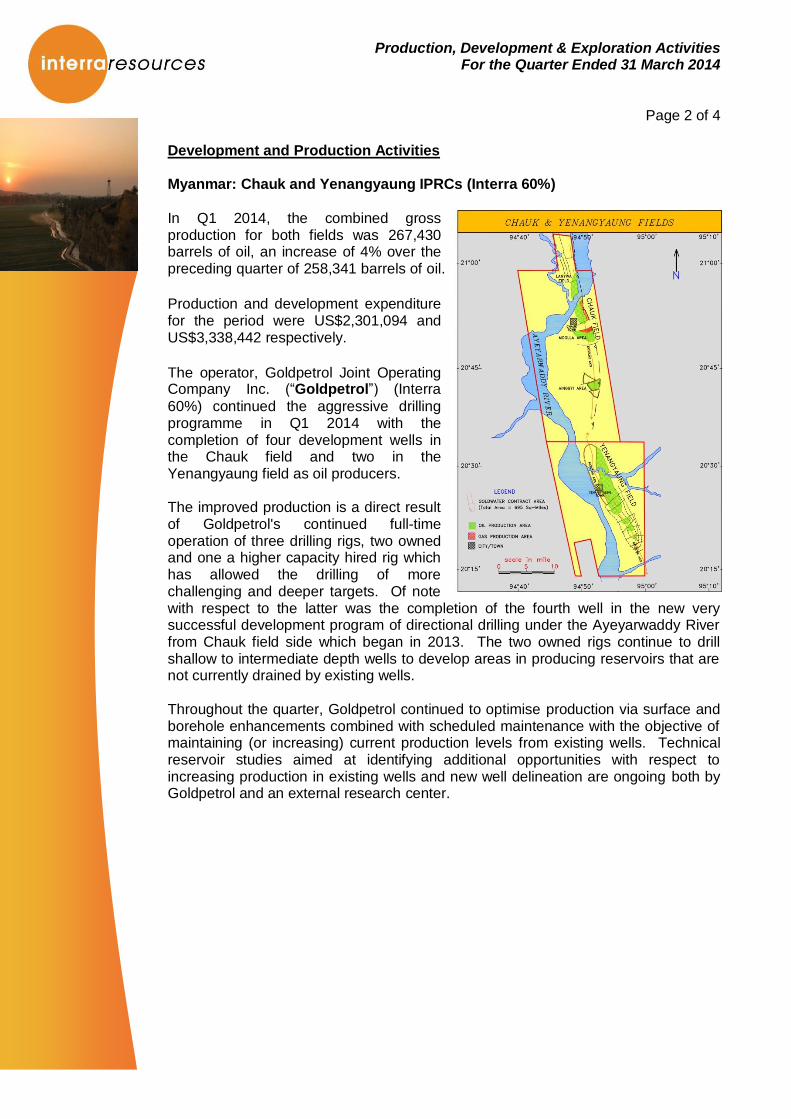
Myanmar: Chauk and Yenangyaung IPRCs (Interra 60%)
In Q1 2014, the combined gross production for both fields was 267,430 barrels of oil, an increase of 4% over the preceding quarter of 258,341 barrels of oil.
Production and development expenditure for the period were US$2,301,094 and US$3,338,442 respectively. The operator, Goldpetrol Joint Operating Company Inc. (“Goldpetrol”) (Interra
60%) continued the aggressive drilling programme in Q1 2014 with the completion of four development wells in the Chauk field and two in the Yenangyaung field as oil producers. The improved production is a direct result of Goldpetrol's continued full-time operation of three drilling rigs, two owned and one a higher capacity hired rig which has allowed the drilling of more challenging and deeper targets. Of note with respect to the latter was the completion of the fourth well in the new very successful development program of directional drilling under the Ayeyarwaddy River from Chauk field side which began in 2013. The two owned rigs continue to drill shallow to intermediate depth wells to develop areas in producing reservoirs that are not currently drained by existing wells. Throughout the quarter, Goldpetrol continued to optimise production via surface and borehole enhancements combined with scheduled maintenance with the objective of maintaining (or increasing) current production levels from existing wells. Technical reservoir studies aimed at identifying additional opportunities with respect to increasing production in existing wells and new well delineation are ongoing both by Goldpetrol and an external research center.
Production, Development & Exploration Activities
For the Quarter Ended 31 March 2014
Page 3 of 4
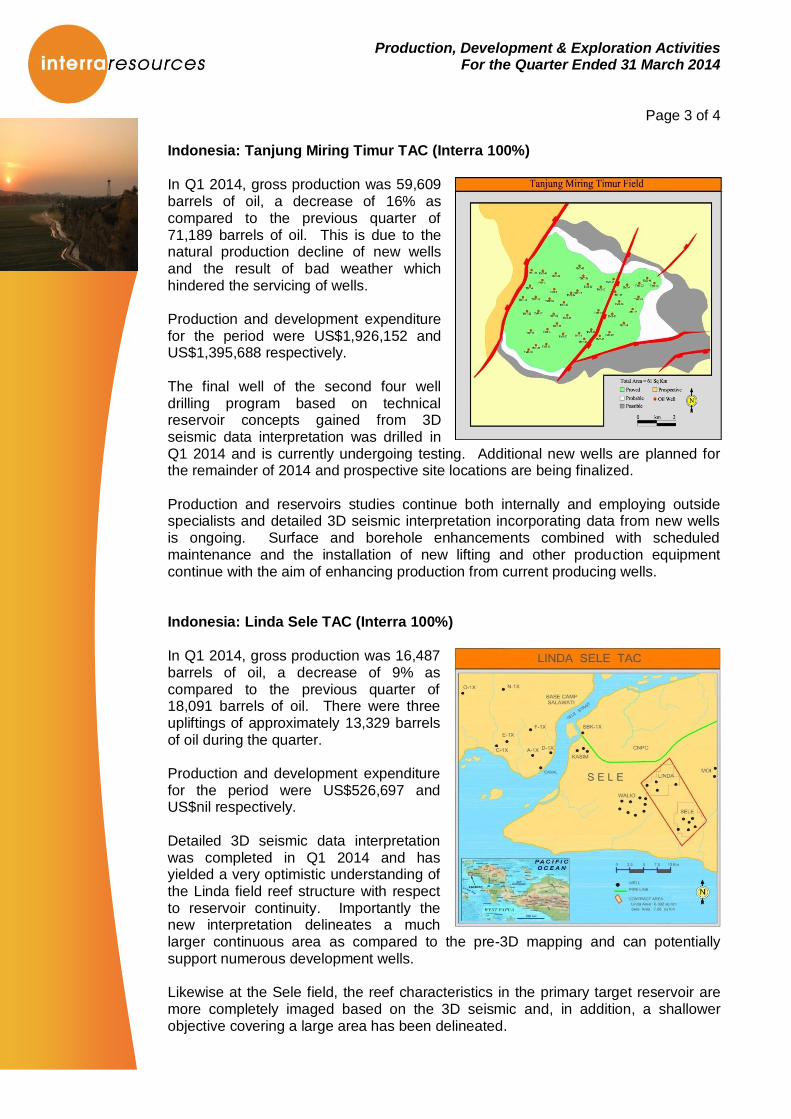
Indonesia: Tanjung Miring Timur TAC (Interra 100%)
In Q1 2014, gross production was 59,609 barrels of oil, a decrease of 16% as compared to the previous quarter of 71,189 barrels of oil. This is due to the natural production decline of new wells and the result of bad weather which hindered the servicing of wells. Production and development expenditure for the period were US$1,926,152 and US$1,395,688 respectively. The final well of the second four well drilling program based on technical reservoir concepts gained from 3D seismic data interpretation was drilled in Q1 2014 and is currently undergoing testing. Additional new wells are planned for the remainder of 2014 and prospective site locations are being finalized. Production and reservoirs studies continue both internally and employing outside specialists and detailed 3D seismic interpretation incorporating data from new wells is ongoing. Surface and borehole enhancements combined with scheduled maintenance and the installation of new lifting and other production equipment continue with the aim of enhancing production from current producing wells. Indonesia: Linda Sele TAC (Interra 100%) In Q1 2014, gross production was 16,487 barrels of oil, a decrease of 9% as compared to the previous quarter of 18,091 barrels of oil. There were three upliftings of approximately 13,329 barrels of oil during the quarter. Production and development expenditure for the period were US$526,697 and US$nil respectively. Detailed 3D seismic data interpretation was completed in Q1 2014 and has yielded a very optimistic understanding of the Linda field reef structure with respect to reservoir continuity. Importantly the new interpretation delineates a much larger continuous area as compared to the pre-3D mapping and can potentially support numerous development wells. Likewise at the Sele field, the reef characteristics in the primary target reservoir are more completely imaged based on the 3D seismic and, in addition, a shallower objective covering a large area has been delineated.
Production, Development & Exploration Activities
For the Quarter Ended 31 March 2014
Page 4 of 4
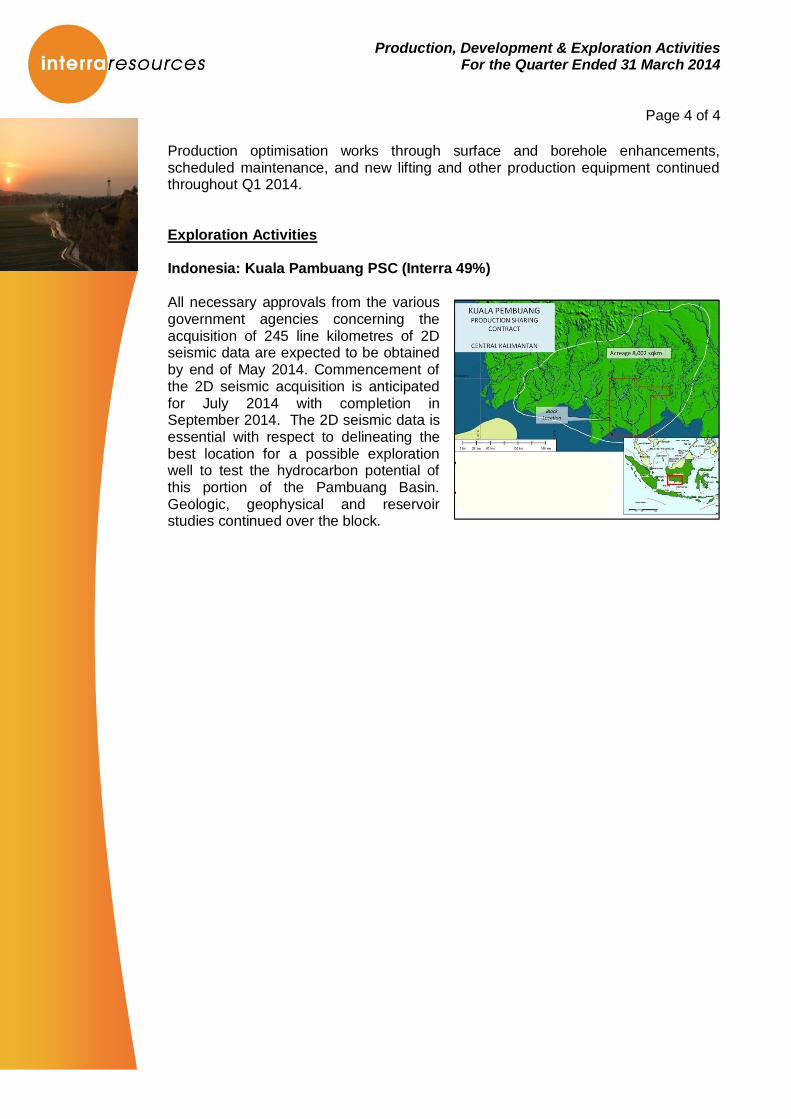
Production optimisation works through surface and borehole enhancements, scheduled maintenance, and new lifting and other production equipment continued throughout Q1 2014. Exploration Activities Indonesia: Kuala Pambuang PSC (Interra 49%)
All necessary approvals from the various government agencies concerning the acquisition of 245 line kilometres of 2D seismic data are expected to be obtained by end of May 2014. Commencement of the 2D seismic acquisition is anticipated for July 2014 with completion in September 2014. The 2D seismic data is essential with respect to delineating the best location for a possible exploration well to test the hydrocarbon potential of this portion of the Pambuang Basin. Geologic, geophysical and reservoir studies continued over the block.