Embed Size (px)
Citation preview

Grocery Outlet Business Overview
1
August 2020

Disclaimer
2
Forward-Looking Statements
This presentation contains forward-looking statements within the meaning of the U.S. securities laws about our current expectations and projections relating to our financial condition, results of operations, plans, objectives, future performance and business, all of which are subject to risks and uncertainties. All statements other than statements of historical fact or relating to present facts or current conditions included in this presentation are forward-looking statements. You can identify forward-looking statements by the fact that they do not relate strictly to historical or current facts. These statements may include words such as “anticipate,” “estimate,” “expect,” “project,” “seek,” “plan,” “intend,” “believe,” “will,” “may,” “could,” “continue,” “likely,” “should,” and other words and terms of similar meaning in connection with any discussion of the timing or nature of future operating or financial performance or other events but not all forward-looking statements contain these identifyingwords.
The forward-looking statements contained in this presentation are based on assumptions that we have made in light of our industry experience and our perceptions of historical trends, current conditions, expected future developments and other factors that we believe are appropriate under the circumstances. Although we believe the expectations reflected in these forward-looking statements are reasonable, we cannot provide any assurance that these expectations will prove to be correct. As you consider this presentation, you should understand that these statements are not guarantees of performance or results. These assumptions and our future performance or results involve risks and uncertainties (many of which are beyond our control).These risks and uncertainties include, but are not limited to, our access to products and qualified independent operators, the duration and impact of the outbreak of COVID-19, the success of our independent operators and the market in which we will operate in the future.
Such risks and uncertainties, as well as other factors or events that may emerge from time to time, could cause our actual performance to differ from these forward-looking statements, and it is notpossible for us to predict all of them. Should one or more of these risks or uncertainties materialize, or should any of our assumptions prove incorrect, our actual financial condition, results of operations,future performance and business may vary in material respects from the performance projected in these forward-looking statements, whether express or implied.
Any forward-looking statement made by us in this presentation speaks only as of the date on which it is made. We undertake no obligation to update any forward-looking statement, whether as a result of new information, future developments or otherwise that we become aware of subsequent to the date of this presentation, except as may be required by law.
Industry Information
Market data and industry information used throughout this presentation are based on management’s knowledge of the industry and the good faith estimates of management. We also relied, to the extent available, upon management’s review of independent industry surveys and publications and other publicly available information prepared by a number of third-party sources. All of the market data and industry information used in this presentation involves a number of assumptions and limitations, and you are cautioned not to give undue weight to such estimates. Although we believe that these sources are reliable, we cannot guarantee the accuracy or completeness of this information, and we have not independently verified this information. While we believe the estimated market position, market opportunity and market size information included in this presentation are generally reliable, such information, which is derived in part from management’s estimates and beliefs, is inherently uncertain and imprecise. Projections, assumptions and estimates of our future performance and the future performance of the industry in which we operate are necessarily subject to a high degree of uncertainty and risk due to a variety of factors, including those described above. These and other factors could cause results to differ materially from those expressed in our estimates and beliefs and in the estimates prepared by independent parties.
Non-GAAP Financial Measures
We present Adjusted EBITDA and Adjusted EBITDA margin to help us describe our operating performance. Our presentation of Adjusted EBITDA and Adjusted EBITDA margin is intended as a supplemental measure of our performance that is not required by, or presented in accordance with, U.S. generally accepted accounting principles (“GAAP”). Adjusted EBITDA and Adjusted EBITDA margin should not be considered as an alternative to operating income (loss), net income (loss), earnings per share or any other performance measures derived in accordance with U.S. GAAP as measures of operating performance or operating cashflows or as measures of liquidity. Our presentation of Adjusted EBITDA and Adjusted EBITDA margin should not be construed to imply that our future results will be unaffected by these items. See the supplemental materials to this presentation for a reconciliation of Adjusted EBITDA and Adjusted EBITDA margin to net income (loss).
Data in this presentation are generally as of, or for the fiscal year ended, December 28, 2019, unless otherwise noted

COMPANY OVERVIEW

Our Positioning & COVID-19 Response
Our Business Model is Well Positioned… …And We have Acted Decisively to Support Customers, IOs and Partners
We Are Proud of Our IOs & Their Employees, Who Have Stepped Up in These Extraordinary Times
Enacted comprehensive safety measures in observance of CDC & public health guidelines
Worked closely with supplier partners to keep pace with demand, purchasing opportunistic & everyday products
Focused customer communications on local product availability, safety precautions and community outreach
Maintained a strong liquidity position with $80mm of cash and over $90mm available on our revolving credit facility
Supported our IOs by providing financial support & guidance on local operating requirements
We have a flexible supply chain, logistics network and merchandising to respond to demand spikes
We provide our customers with extreme value at a time when they are seeking to maximize savings
We offer an assortment of familiar & trusted high-quality, name-brand consumables along with fresh products
We serve as pillars of our local communities with personalized service
We are deemed an essential business – our stores generally remain open and have witnessed a surge in demand
4

(1) As of June 27, 2020.(2) Source:eSite.(3) Fiscal years 2004-2019.
Grocery Outlet Is a Differentiated, High-Growth, Off-Price Retailer
16Consecutive Years of Positive
Comparable Store Sales Growth (3)
$2.9bnQ2 ’20 LTMNet Sales
$203mmQ2 ’20 LTM
AdjustedEBITDA
Strong Financial Performance
5.1%Average Comparable Store Sales
Growth Over Past 16 Years (3)
1,900In-Market and Neighboring
States Potential Stores (2)
Attractive Store Base
10%Store Count CAGR FY 2015 to FY 2019
362 Stores Across 6 States(1)
206
64
568
9 19
40% - 70%Prices Below ConventionalRetailers
On Our BestDeals
~50%Opportunistically Sourced Products
5,000Ever-Changing SKUs Per Store
Promote Treasure HuntExperience
Differentiated Model
340+Independent Operators
Create Local Shopping Experience
~14,000Square Foot
Average Store Size
40%+Year 4 Cash-on-Cash Returns
Historically
$80mmCash Balance as of Q2’20 End(1)
5

We Have Continued to Make Significant Progress Since Our IPO
Compelling value and treasure hunt experience from strong opportunisticpurchasing
Continued Solid Broad-based growth with Natural, Organic, Specialty, Healthy (NOSH), fresh categories, and beer and wine as standoutsProduct, IO
Performance, and Marketing
Execution
Continued growth of newly introduced fresh seafood and grass-fed meat
Improvements in ordering and distribution systems that enhance IO localized assortment decisions
GO brand refresh supported by new Bargain Bliss marketing campaign
Continued growth in email subscriber database to drive engagement
Opened 34 new stores (3 closures) in FY 2019 and 17 new stores (2 closures) in H1’20 with a balanced mix between mature and developingmarkets
New stores are performing well and in-line with expectations
Started delivering from Southern California refrigeratedwarehouse
Developing the East infrastructure with hiring of new EVP of East Region
Expanded Footprint and
Growth Initiatives
Reduced net leverage (3) from 5.5x pre-IPO to 1.9x LTM as of Q2 2020
Flexible credit facility with no principal payments due until 2025 and ample capacity vs. 7x leverage covenant
Recently repaid in full the $90mm drawn on the revolving credit facility of its first lien credit agreement
Cash balance of $80mm as of Q2’20 end
Improved Balance Sheet
(1) Defined as (Total Debt – Cash) / LTM Adj. EBITDA.
Delivered Solid Business
Performance
Comparable stores sales growth of 17.4%
Net Sales grew 25.4% to $760.3mm
Adjusted EBITDA grew 45.8% to $57.0mm
Q2 2020 Results
Comparable stores sales growth of 16.7%
Net Sales growth of 24.5%
Adjusted EBITDA of $60.6mm, a 34.7% increaserelative to Q2 ’19
Q1 2020 Results
6

The WOW! Shopping Experience
• Extreme value• ~40% average basket
savings (1)
• ~40% - 70% savings on best deals (1)
• Distinct and proven buying model
• Locally owned and operated• Friendly, high-touch service• Active in community• Family-run stores• Easy-to-shop stores
• Name-brand products• Fresh• Natural Organic Specialty
Healthy (NOSH)• Quality guarantee• Clean, well-merchandised
stores
PRICE SERVICEQUALITY
TREASURE HUNT DISCOVERY= FUN!
• Unexpected deals
• Ever-changing assortment
• Curated and localized merchandise
(1) Compared to conventional grocers.7

OpportunisticSourcing
Treasure HuntExperience
E-Commerce asa % of Sales
✓ ✓ 0%
✓ ✓ 0%
✓ ✓ <5%
✓ ✓ <2%
✓ ✓ 0%
✓ ✓ <1%
Grocery Outlet’s Model Is Well-Positioned Against Other Off-Price / Discount Retailers
Source: Company filings available as of 12/31/19.
8

Consistent Track Record of Earnings Growth
Strong Comp Performance
Disciplined Store Growth
Consistent Margins
Track Record of Earnings
Growth
2019 was our 16th Consecutive Year of Positive Comparable Store Sales Growth
TotalStores
Gross Margin %
Adjusted EBITDA ($mm)
Average: 6.5%
Strong and Consistent Annual Gross Margins Between 30.1% and 30.8% since 2010
9
8.4%4.9%
0.8% 0.6%
12.3% 14.7%
2.6%5.4% 5.0%
0.2%5.2% 4.2% 3.6% 5.3% 3.9% 5.2%
17.4% 16.7%
2004 2005 2006 2007 2008 2009 2010 2011 2012 2013 2014 2015 2016 2017 2018 2019 Q1 20 Q2 20
237 265 293 316 347 362
2015 2016 2017 2018 2019 Q2 20
$108 $123 $136 $154 $170$203
2015 2016 2017 2018 2019 LTM Q2 20
30.2% 30.6% 30.4% 30.4% 30.8% 31.6%
2015 2016 2017 2018 2019 Q2 20

While Each Recession is Unique, Grocery Outlet Had Strong Comparable Store Sales Growth Performance in 2008-2009
Source: Company filings, company projections, publicly available information and FactSet. n = 184(1) Reflects 2008 and 2009 comparable store sales growth stack for all U.S. retailers that were public during 2008 and 2009 and have reported comparable store sales growth figures for these years on FactSet.
(15%)
Recessionary Conditions (2008 – 2009)
27%
(9%) (5%) 3% 7%
2-year stack Comparable Store Sales Growth of selected public retailers (1)
19%8%4%(3%) (2%)(6%)
10

Grocery Outlet Evolution: Over 70 Years of Delivering The WOW!
AcquiresAmelia’s andexpands to EastCoast
Expands to Southern California market
Berkshire Partners invests
Hellman & Friedman invests
Opens 300th
store in Inglewood
Reaches $2billion in sales
$2bn
Eric Lindberg and MacGregor Read become Co-CEOs
Jim Readopens“Cannery Sales”
Signs first IO Agreement in Redmond, OR
19731946 2006
2011
2012
2009
2014
2018
2017
Publicly-listedCompany
2019
11

Strong Commitment To Corporate Culture
Grocery Outlet is driven by family values that are reflected throughout the organization
Integrity Collaboration Performance
Our Mission:
Touching Lives For The Better
Entrepreneurship
12

INVESTMENT HIGHLIGHTS ANDGROWTH STRATEGIES

Growth Strategies
Investment Highlights & Growth Strategies
FLEXIBLE SOURCING AND DISTRIBUTION MODEL THAT IS DIFFICULT TO REPLICATE
INDEPENDENT OPERATORS: OUR“SMALL BUSINESS AT SCALE” MODEL
ATTRACTIVE AND CONSISTENT NEW STORE ECONOMICS SUPPORT WHITESPACE
STRONG CONSUMER ENGAGEMENT AND ALIGNMENT WITH MACRO TRENDS
POWERFUL CUSTOMER VALUE PROPOSITION SUPPORTED BY A “WOW!” EXPERIENCE
Investment Highlights
III
IV
V
II
I
DRIVE COMPARABLE STORE SALES GROWTH
Be the First Choice for Bargain-Minded Customers Across the Country
EXECUTE ON STORE EXPANSION PLANS
IMPROVE PRODUCTIVITY AND REINVESTIN THE VALUE PROPOSITION
14

Our Fundamentally Different Approach To Buying and Selling
Opportunistic sourcing of quality, name-brand, fresh products
Large, centralized purchasing team
Long-standing, actively managedsupplier relationships
Proactive sourcing of on-trend products and brands
Everyday core staples to complement ourWOW! offerings
Independently operated, local, small-box stores
Personalized customer service
High community involvement
IOs control store operations and oversee:
Product selection
Hiring, training and managingtheir store workers
Local marketing
Small Business at Scale
How We SellHow We Buy
“Out Chain the Locals, Out Local the Chains”
15

Flexible Sourcing and Distribution Model Anchored by Purchasing Team and Relationships
Long-Standing Suppliers…
…And New Emerging Suppliers
…Who Make Us One ofTheir First Calls
RELATIONSHIP
BRAND PROTECTION
EXECUTION
SCALE
16

Substantial Opportunity to Further Grow Opportunistic Supply
SecondaryMarket
Significant Share Gain Opportunity Ongoing Secondary Market Growth
17

Opportunistic purchasesrepresent CPG excessinventory
GO is a preferred CPGpartner for a non-disruptive, brand-protected sales channel
Allows GO to pass along significant savings to customers while making a healthy margin
When staples, such as milk or sugar, cannot be sourced opportunistically, GO buys from suppliers
Provides customer convenience via a more complete product assortment
Products priced at or below conventional supermarkets’ and discount competitors’ everyday prices
Grocery Outlet’s Differentiated SourcingModel Delivers Great Value To Customers
Opportunistic Everyday Core Staples
Two Primary Methods
~50% of Purchases ~50% of Purchases
18

~20%
~40%
Favorable Value Proposition vs. Other Retailers
% Savings Across Store Relative to Competitors(1)
(1) Savings vs. Conventional/Discount derived from Grocery Outlet’s pricing research as of June 2019 based on a blended basket of items from Safeway and Walmart for 5,000+ SKUs from multiple regions.
Conventional Grocery
Discount Grocery
Basket Savings Further Differentiation
AND IN AN EASY-TO-SHOP STORE!
AND WE PROVIDEEXTREME VALUE!
BUT WITH NO MEMBERSHIP FEE
OR BULK SIZES!
BUT OFFERS LEADINGNATIONAL BRANDS!
ACROSS A FULL GROCERY ASSORTMENT!
BUT WITH FRIENDLY, HIGH-TOUCHSERVICE!
CLUB STORES
DEEPDISCOUNTERS
DOLLAR STORES
ONLINE
19

Unique Independent Operator Model Fuels Success
Merchandising Managing inventory Modifypricing Hiring and trainingstore
employees Community and
customer service
Operational
IO BENEFITS
Wages Local marketing Storeoperating
expenses Operating
working capital Operatingassets
Financial
Operational
Financial
Sourcing Initial Pricing Recruiting and
trainingIOs Real estate Distribution and
logistics
Own inventory (consigned to IOs)
Regional marketing Rent Capex Corporate SG&A
Autonomy
Scale benefits
Significant incomeopportunity
Aligned economic interests
Reduced fixed costs
Locally driven loyalty
GROCERY OUTLETBENEFITS
Collaboration with and amongst IOs enables real-time feedback and best-practice sharing for continual improvement
Independent Operators
20
“Out Chain the Locals, Out Local the Chains”

Compelling Store Economics For Both Grocery Outlet and Our Independent Operators
IO Model Reduces GO’s Fixed Cost Burden
Illustrative Expense Split
"Traditional" Model IO Model
VariableCosts Fixed Costs
Note: Dollars in millions.
21
Fixed Costs
Fixed Costs IOCommission
COGS ex. Rent
IO model
COGS ex. Rent
reducesfixed costburden$6.9
$2.1
GO IO
Upfront Investment
CapEx Buildout
Inventory / Pre-Opening
IO Assets / Working Capital
Illustrative Year-4 P&L
SalesGross Profit
Share of Gross Profit 50% 50%
Wages, Taxes, Benefits
Occupancy

Selective Independent Operator Recruiting And Rigorous Training
Annual Leads: 20,000+
First Contact: Phone Screen & Initial Review
Considered: On-Site Executive Interviews
Selected:
70+
22
Enter 6 – 9 Month Aspiring Operator In Training Program

Centralized Marketing Coupled With Local IO Marketing Efforts
In-Store Localization
Targeted Promotions
Active Social Media
Presence
Community Involvement
Local Marketing Driven By IOsEnterprise Marketing Driven By Grocery Outlet
Digital
Social Media Digital Ads WOW! Alerts
Radio / Connected TV Influencer
Print Radio Television
Traditional
23

Significant Whitespace Opportunity
Opportunity to establish additional ~1,500 “In-Market” and neighboring state locations Long term market potential to establish ~4,800 stores nationally
206
64
568
919
Source:eSite.Note: Map figures as of June 27, 2020.
362
~1,900
As of 6/27/2020
In-Market and Neighboring State
Potential
+5x Potential
24

Market Expansion Strategy and Success
Market entry in 2012
79 stores in Southern CA(1)
Strong Presence in Southern CA Foundation For Growth in The Mid-Atlantic
Acquired Amelia's Grocery Outlet in 2011
Goal: to accommodate supplier partners more effectively
25 (1) As of June 27, 2020.
Bakersfield
San Diego
Los Angeles
HarrisburgPhiladelphia

Attractive and Historically Consistent New Store Economics
Note: Dollars in thousands. Cash-on-cash return defined as four-wall EBITDA divided by total initial net cash investment.
Sales
Year4
~$6,875
GO Four Wall EBITDAContribution ~$680
% Four Wall EBITDA Margin ~10%
Cash-on-CashReturn ~35%
Overview
We employ a blended underwriting model reflecting average economics across all urbanicities, geographies and store types
New stores require average net cash investment of ~$2mm
4 – 5 year store ramp until maturity
Payback period of less than 4 years
Recent cohorts have outperformed the new store model
Model Assumptions
26
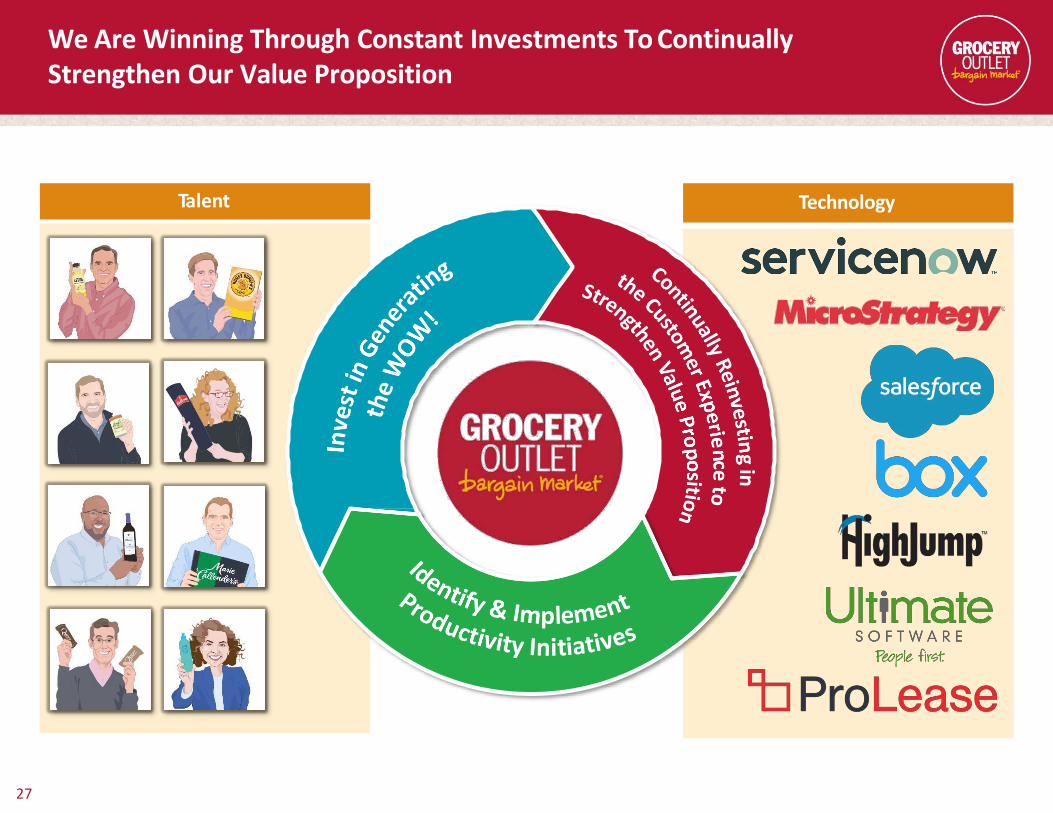
Technology
We Are Winning Through Constant Investments To Continually Strengthen Our Value Proposition
Talent
27

FINANCIAL PERFORMANCE AND OUTLOOK

Historical Financial Performance
29
Strong and Disciplined Net Sales Growth
6.7%
Track Record of Adjusted EBITDA Growth
Note: Dollars in millions.
(1) Reflects growth relative to Q2’19 store count of 330 units(2) Represents average comp over prior 4 quarters as of Q2’20
Stores 237 265 293 316 347 362
Unit Growth 9% 12% 11% 8% 10% 10%(1)
Comp 4.2% 3.6% 5.3% 3.9% 5.2% 11.3%(2)
$1,627
$1,832
$2,075
$2,288
$2,560
$2,872
2015 2016 2017 2018 2019 LTM Q2 2020
$108
$123
$136
$154
$168
$203
6.7% 6.7% 6.6% 6.7% 6.7% 7.1%
2015 2016 2017 2018 2019 LTM Q2 2020

4.9% 5.9% 5.3% 5.1% 4.5%2.7%
4.2% 4.1% 4.2% 5.8% 5.8% 5.1%
17.4% 16.7%
Q1'17 Q2'17 Q3'17 Q4'17 Q1'18 Q2'18 Q3'18 Q4'18 Q1'19 Q2'19 Q3'19 Q4'19 Q1'20 Q2'20
8.4%
4.9%
0.8% 0.6%
12.3% 14.7%
2.6%
5.4% 5.0%
0.2%
5.2%4.2% 3.6%
5.3%
3.9%
5.2%
2004 2005 2006 2007 2008 2009 2010 2011 2012 2013 2014 2015 2016 2017 2018 2019
FY 2017 – Q2 2020 Quarterly Comparable Store Sales Growth
16 Consecutive Years of Positive Comparable Store Sales Growth
Recessionary Economic Conditions 2004 – 2019 Average: 5.1%
2017 – 2019 Average: 4.8%
30
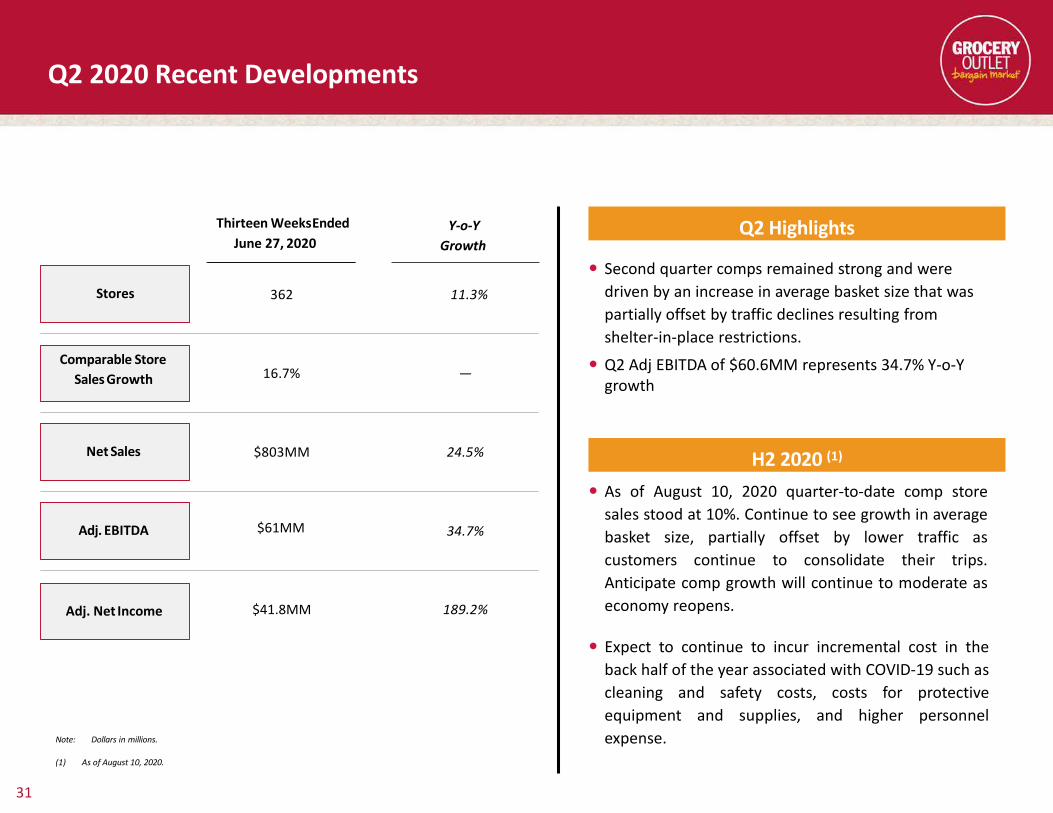
189.2%$41.8MM
Q2 2020 Recent Developments
Thirteen WeeksEnded June 27, 2020
Y-o-YGrowth
Stores 362 11.3%
Comparable Store Sales Growth 16.7%
Net Sales $803MM 24.5%
Adj. EBITDA 34.7%$61MM
31
Note: Dollars in millions.
(1) As of August 10, 2020.
—
Adj. Net Income
Q2 Highlights
Second quarter comps remained strong and were driven by an increase in average basket size that was partially offset by traffic declines resulting from shelter-in-place restrictions.
Q2 Adj EBITDA of $60.6MM represents 34.7% Y-o-Ygrowth
As of August 10, 2020 quarter-to-date comp storesales stood at 10%. Continue to see growth in averagebasket size, partially offset by lower traffic ascustomers continue to consolidate their trips.Anticipate comp growth will continue to moderate aseconomy reopens.
Expect to continue to incur incremental cost in theback half of the year associated with COVID-19 such ascleaning and safety costs, costs for protectiveequipment and supplies, and higher personnelexpense.
H2 2020 (1)

Capital Structure
Capitalization
Note: Dollars in millions.(1)(2)
Defined as Adj, EBITDA / Net Interest Expense Defined as (Total Debt – Cash) / LTM Adj. EBITDA.
● Used IPO proceeds to repay in full its second lien term loan (~$150mm) and prepay~$250mm of its outstanding first lien term loan
● In October 2019, the Company prepaid additional $15mm of its outstanding first lien term loan
● In January 2020, repriced its first lien term loan at L+275bps, down from L+375bps originally
● In March 2020, the Company drew down$90mm from its revolving credit facility as a precautionary measure in light of COVID-19
● During the second quarter of fiscal 2020, the Company repaid in full the $90.0 million drawn on the revolving credit facility of its First Lien Credit Agreement
● No required principal payments until 2025
Net Leverage (2)Interest Coverage(1)
32
FY 2019Revolver
Draw Q2’20
Cash & Cash Equivalents $28 $90 $80
First Lien 460
Total Gross Debt $460 $90 $460
Net Debt $432 $0 $380
LTM Adj. EBITDA $170 — $203
Net Debt / Adj. EBITDA 2.6x — 1.9x
3.7x
8.1x
2019 LTM Q2 2020
5.5x
2.9x 2.6x1.9x
Pre-IPO Post-IPO FY 2019 LTM Q2 2020

Long-Term Targets
Annual Unit Growth ~10%
Comparable Store Sales Growth 1 – 3% annually
Adjusted EBITDA Stable as a % of Sales
Adjusted Net Income Growth Mid-teens %
33

APPENDIX

2015A 2016A 2017A 2018A 2019A Location onP&L
Net Income $5 $10 $21 $16 $15
Interest expense, net 46 47 50 55 46 Interest Expense
Taxes 3 7 5 6 1 Income Tax
Depreciation and amortization 31 37 43 47 50 COGS / D&A
EBITDA $85 $101 $119 $124 $113
Stock-based compensation (1) 0 3 2 10 31 SBC
Debt extinguishment and modification costs (2) 5 — 1 5 6Debt Extinguishment &Modification Expense
Non-cash rent (3) 10 8 8 8 11 SG&A
Asset impairment and gain or loss on disposition (4) 1 1 1 1 2 SG&A
New store pre-opening expenses (5) 2 3 2 2 2 SG&A
Rent for acquired leases (6) 2 2 0 — — SG&A
Provision for accounts receivable reserves (7) 1 4 3 1 3 SG&A
Other (8) 1 1 1 2 3 SG&A
AdjustedEBITDA $108 $123 $136 $154 $170
35
FY 2019 Adjusted EBITDA Reconciliation
Note: Dollars in millions.(1) Includes $3.6 million, $10.0 million, and $1.3 million of cash dividends paid in fiscal 2019, 2018, and 2017 respectively, in respect of vested options as a result of dividends declared in connection with our recapitalizations in fiscal 2018 and
2016.(2) Represents the write-off of debt issuance costs and debt discounts related to the repricing and/or repayment of our first and second lien credit facilities. See NOTE 6—Long-term Debt to our Consolidated Financial Statements in the
Company’s Annual Report on Form 10-K for the fiscal year ended December 28, 2019 for additional information.(3) Consists of the non-cash portion of rent expense, which represents the difference between our straight-line rent expense recognized under GAAP and cash rent payments. The adjustment can vary depending on the average age of our
lease portfolio, which has been impacted by our significant growth in recent years. Non-cash rent was impacted by the adoption of ASC 842, Leases, which moved approximately $3.2 million out of amortization expense and into non-cash rent expense.
(4) Represents impairment charges with respect to planned store closures and gains or losses on dispositions of assets in connection with store transitions to new IOs.(5) Includes marketing, occupancy and other expenses incurred in connection with store grand openings, including costs that will be the IO’s responsibility after store opening.(6) Represents cash occupancy costs on leases acquired from Fresh & Easy, Inc. in 2015 for the periods prior to opening new stores on such sites (commonly referred to as “dead rent”).(7) Represents non-cash changes in reserves related to our IO notes and accounts receivable.(8) Other non-recurring, non-cash or discrete items as determined by management, including transaction related costs, personnel-related costs, store closing costs, legal expenses, strategic project costs, and miscellaneous costs.

FY 2019 Adjusted Net Income Reconciliation
36Note: Dollars in millions.
FY 2018 FY 2019
Net Income $15.9 $15.4
Stock-based compensationexpenses 10.4 31.4
Debt extinguishment and modification costs 5.3 5.6
Non-cashrent 7.9 10.6
Asset impairment and gain or loss ondisposition 1.3 2.0
New store pre-openingexpenses 1.6 1.5
Provision for accounts receivablereserves 0.7 2.6
Other 2.1 3.3
Amortization of purchase accounting assets and deferred financingcosts 16.7 11.9
Tax effect of total adjustments (12.6) (19.4)
Adjusted Net Income $49.3 $65.0

LTM Adjusted EBITDA Reconciliation
37
Note:
(a) Includes depreciation related to our distribution centers which is included within the cost of sales line item in our condensed consolidated statements of operations and comprehensive income (loss).
(b) Includes non-cash share-based compensation expense and immaterial cash dividends paid on vested share-based awards for cash dividends declared in connection with our recapitalizations in fiscal2018 and 2016.
(c) Represents the write-off of debt issuance costs and debt discounts related to the repricing and/or repayment of our credit facilities.
(d) Consists of the non-cash portion of rent expense, which represents the difference between our straight-line rent expense recognized under GAAP and cash rent payments. The adjustment can varydepending on the average age of our lease portfolio, which has been impacted by our significant growth in recent years.
(e) Represents impairment charges with respect to planned store closures and gains or losses on dispositions of assets in connection with store transitions to new IOs.
(f) Includes marketing, occupancy and other expenses incurred in connection with store grand openings, including costs that will be the IO’s responsibility after store opening.
(g) Represents non-cash changes in reserves related to our IO notes and accounts receivable. The 26 weeks ended June 27, 2020 reflects the adoption of ASU 2016-13.
(h) Other non-recurring, non-cash or discrete items as determined by management, such as transaction related costs including costs related to secondary offerings, personnel-related costs, store closingcosts, legal expenses, strategic project costs, and miscellaneous costs.
September 28, 2019
December 28, 2019
March 28, 2020
June 27, 2020
Net income $ 12,445 $ 9,832 $ 12,642 $ 29,333 Interest expense, net 7,342 6,695 5,834 5,270 Income tax benefit 3,689 477 (1,801) (2,244)Depreciation and amortization expenses(a) 13,782 10,356 13,570 13,887 EBITDA 37,258 27,360 30,245 46,246 Share-based compensation expenses (b) 2,892 5,586 20,277 10,175
Debt extinguishment and modification costs (c) 472 — 198 —
Non-cash rent (d) 1,629 5,275 2,214 2,759
Asset impairment and gain or loss on disposition (e) 85 1,457 975 (22)
New store pre-opening expenses (f) 294 473 406 337
Provision for accounts receivable reserves (g) 309 202 848 (899)
Other (h) 1,237 1,183 1,864 2,048 Adjusted EBITDA $ 44,176 $ 41,536 $ 57,027 $ 60,644
13 Weeks Ended

LTM Adjusted Net Income Reconciliation
38
Note:
(a) Includes non-cash share-based compensation expense and immaterial cash dividends paid on vested share-based awards for cash dividends declared in connection with our recapitalizations in fiscal 2018 and 2016.
(b) Represents the write-off of debt issuance costs and debt discounts related to the repricing and/or repayment of our credit facilities.
(c) Consists of the non-cash portion of rent expense, which represents the difference between our straight-line rent expense recognized under GAAP and cash rent payments. The adjustment can vary depending on theaverage age of our lease portfolio, which has been impacted by our significant growth in recent years.
(d) Represents impairment charges with respect to planned store closures and gains or losses on dispositions of assets in connection with store transitions to new IOs.
(e) Includes marketing, occupancy and other expenses incurred in connection with store grand openings, including costs that will be the IO’s responsibility after store opening.
(f) Represents non-cash changes in reserves related to our IO notes and accounts receivable. The 26 weeks ended June 27, 2020 reflects the adoption of ASU 2016-13.
(g) Other non-recurring, non-cash or discrete items as determined by management, such as transaction related costs including costs related to secondary offerings, personnel-related costs, store closing costs, legal expenses,strategic project costs, and miscellaneous costs.
(h) Represents the amortization of debt issuance costs and incremental amortization of an asset step-up resulting from purchase price accounting related to our acquisition in 2014 by an investment fund affiliated withHellman & Friedman LLC, which included trademarks, customer lists, and below-market leases.
(i) Represents the tax effect of the total adjustments. Because of the increased impact of discrete items on our effective tax rate including the excess tax benefits from the exercise of stock options and vesting of RSU share-based awards, beginning in the fourth quarter of fiscal 2019, we changed our methodology to calculate the tax effect of the total adjustments on a discrete basis excluding any non-recurring and unusual tax items. Prior tothe fourth quarter of fiscal 2019, the methodology we used was to calculate the tax effect of the total adjustments using our quarterly effective tax rate.
September 28, 2019
December 28, 2019
March 28, 2020
June 27, 2020
Net income $ 12,445 $ 9,832 $ 12,642 $ 29,333 Share-based compensation expenses (a) 2,892 5,586 20,277 10,175 Debt extinguishment and modification costs (b) 472 — 198 —Non-cash rent (c) 1,629 5,275 2,214 2,759 Asset impairment and gain or loss on disposition (d) 85 1,457 975 (22)New store pre-opening expenses (e) 294 473 406 337 Provision for accounts receivable reserves (f) 309 202 848 (899)Other (g) 1,237 1,183 1,864 2,048 Amortization of purchase accounting assets and deferred financing costs (h) 3,705 461 2,936 2,944 Tax effect of total adjustments (i) 2,429 (4,553) (8,321) (4,856)Adjusted net income $ 20,639 $ 19,916 $ 34,039 $ 41,819
13 Weeks Ended