Embed Size (px)
Citation preview

Comparative Analysis of Cybersecurity Metrics
to Develop New Hypotheses
Stuart Madnick
Nazli Choucri
Xitong Li
Jeremy Ferwerda
Working Paper CISL# 2011-08
November 2011
Composite Information Systems Laboratory (CISL)
Sloan School of Management, Room E62-422
Massachusetts Institute of Technology
Cambridge, MA 02142

1
Comparative Analysis of Cybersecurity Metrics to Develop New Hypotheses Stuart Madnick Sloan School of
Management Massachusetts
Institute of Technology
Cambridge, MA 02139 USA
Nazli Choucri Political Science
Department Massachusetts
Institute of Technology
Cambridge, MA 02139 USA
Xitong Li Sloan School of
Management Massachusetts
Institute of Technology
Cambridge, MA 02139 USA
Jeremy Ferwerda Political Science
Department Massachusetts
Institute of Technology
Cambridge, MA 02139 USA
Abstract Few Internet security organizations provide comprehensive, detailed, and reliable quantitative metrics, especially in the international perspective across multiple countries, multiple years, and multiple categories. As common refrain to justify this situation, organizations ask why they should spend valuable time and resources collecting and standardizing data. This report aims to provide an encouraging answer to this question by demonstrating the value that even limited metrics can provide in a comparative perspective. We present some findings generated through the use of a research tool, the Explorations in Cyber Internet Relations (ECIR) Data Dashboard. In essence, this dashboard consists of a simple graphing and analysis tool, coupled with a database consisting of data from disparate national-level cyber data sources provided by governments, Computer Emergency Response Teams (CERTs), and international organizations. Users of the dashboard can select relevant security variables, compare various countries, and scale information as needed. In this paper, using this tool, we present an example of observations concerning the fight against cybercrime, along with several hypotheses attempting to explain the findings. We believe that these preliminary results suggest valuable ways in which such data could be used and we hope this research will help provide the incentives for organizations to increase the quality and quantity of standardized quantitative data available. . Keywords: Cybersecurity, Cybercrime, Computer Emergency Response Teams, Data Dashboard, Country Comparisons 1. Introduction Few Internet security organizations provide comprehensive, detailed, and reliable quantitative metrics, especially in the international perspective across multiple countries, multiple years, and multiple categories. A common refrain to justify this situation is that the Internet is changing too rapidly for such metrics to be useful; organizations ask why they should spend valuable time and resources collecting and standardizing data when the security sphere is

2
engaged in a continuous and rapidly-evolving battle against threats such as cyber crime and cyber warfare. This report aims to provide an encouraging answer to this question by demonstrating the value that even limited metrics can provide in a comparative perspective. Although we recognize that Internet data can have a short shelf life and that attack vectors and methods are always changing, we are confident that careful data analysis can reveal insights useful for improving organizational competence and fostering accurate awareness of cyber threat trends. We present some findings generated through the use of a research tool, the Explorations in Cyber Internet Relations (ECIR)1 Data Dashboard. In essence, this dashboard consists of a simple graphing and analysis tool, coupled with a database consisting of data from disparate national-level cyber data sources provided by governments, Computer Emergency Response Teams (CERTs), and international organizations. Users of the dashboard can select relevant security variables, compare various countries, and scale information as needed. Using this tool, we have identified several distinct examples of observations concerning the fight against various types of cyber threat, along with hypotheses to explain each trend. In this paper, we present the analysis related to software piracy losses differences across multiple countries. We believe that this analysis demonstrates valuable ways in which such data could be used and we hope this research will help provide the incentives for organizations to increase the quality and quantity of standardized quantitative data available. 2. ECIR Data Dashboard 2.1 Purpose of the ECIR Data Dashboard
The ECIR Data Dashboard was developed to provide historical trend data and news to policymakers, academics, IT professionals and other stakeholders. By consulting the Dashboard, the user can compare trends in various categories in national-level cybersecurity threats and vulnerabilities among several countries and/or regions over time. Also, the user can use the Dashboard to compare these trends against other relevant national-level statistics to find patterns and correlations. The Dashboard provides data in five categories:
• Demographic Data: Basic data about a country’s population, economy, education level, and other attributes that may affect the development of the country’s Internet services or IT security sectors. (Sources: World Development Indicators Database)
• IT Data: Data outlining the state of the country’s IT infrastructure, usage, and security, including Internet bandwidth, users, services, etc. (Sources: ITU, World Development Indicators, CIA World Factbook)
• Political Attributes: Data outlining the political environment in the country. (Sources: World Bank Governance Indicators, Polity IV, Stockholm International Peace Research Institute)
• Cybersecurity Data: Data that reflect chronological trends of threat/vulnerability
1 The Exploration in Cyber International Relations (ECIR) project is a collaboration consisting of the MIT Political Science department, the MIT Sloan School of Management, the MIT Elelectrical Engineering and Computer Sciemce (EECS) department, the Harvard Law School and the Harvard Kennedy School of Government.

3
statistics, such as Virus, worms, malware. (Sources: national CERTs.) • Cybercrime Attributes: Data indicating the degree of cybercrime in the country, such
as Cybercrime Damage Dollar Loss, Cybercrime Arrests, Cybercrimes reported to police. (Sources: National police agencies and justice departments and BSA & IDC Global Software Piracy Study.)
The specific attributes available for each of these categories in listed in Table 1 below.
Table 1. Categories and attributes of data available in the ECIR Data Dashboard.
The choice of categories was dictated by theoretical and empirical considerations.
Theoretically, the choice is influenced by the theory of lateral pressure in international relations, which highlights the internal determinants of external behavior and the intermediating factors that shape various activities and outcomes. This choice will allow us in subsequent research to explore the relative influence of various internal factors and mediating variables upon final outcomes. In this paper we present the baseline inquiry, the basic platform and select – physical, political, and perceptual – that would be likely to relate to or influence behavioral factors, in this case cyber crimes. In the current exploration we consider threat attitudes as intervening or intermediary variables.
The Dashboard allows the user to select any number of countries (and/or regions) with which to compare the data. The X-axis measurement is time (currently in years), and any of the data mentioned above can be selected for the Y-axis, allowing the user to compare correlations in multiple strands of data, each of which is for one country or region. Also, the Dashboard allows the user to divide one strand of data into another. This allows the user to compare the data in new ways. For example: dividing population into any measurement creates a “per capita” measurement. Likewise, the user can compare the viruses reported per number of Internet users. Additionally, the user can select to graph the data on a linear or logarithmic scale, which can be very helpful in studying trends when comparing data, say from a large country with that of a small country (the small country data might appear as a straight line at zero on a linear scale).
4
The Dashboard thus provides the user with a great amount of flexibility and power in finding exactly what data to compare, how to compare it, and how to illustrate it, so that multinational cybersecurity data can be deeply and robustly investigated.
2.2 Data Dashboard Technology and Operation
The Dashboard technology has three primary parts: Web user interface, database system, and recent news headlines. The details of these employed technologies and the operation of the ECIR Data Dashboard have been described a previous publication (Madnick et al, 2009), the current version of which can be accessed at http://coin.mit.edu:8080/Dashboard/ . Brief instructions on its operation can be found at http://coin.mit.edu:8080/Dashboard/resources/instruction.pdf .
3. Analysis of Cybercrime related data and the development and exploration of hypotheses Much of the information in the ECIR Data Dashboard is gathered from national organizations such as CERTs and police agencies. A primary advantage of having these sources in the Dashboard is that it enables cross-national analyses of organizational effectiveness; however, national organizations may suffer from reporting discrepencies that can bias results. Although careful research can mitigate some of these concerns, it is also advantageous to leverage survey data in which these biases have already been eliminated. For analysis of software piracy rates across countries, we can also use data provided by the BSA & IDC Global Software Piracy Study. This study uses survey methods that determine the total dollar value of software deployed in a given year versus the volume of legally acquired software in a given year. The difference between these two metrics provides a rough approximation of the degree of software piracy in a country. While the data is still subject to potential survey error, the fact that the survey is centrally administered and vetted removes the possibility of capturing substantial national reporting discrepancies. By pairing this data with national level demographic and political variables within the dashboard, we can provide a nuanced analysis of software piracy trends across a variety of key countries. Hypotheses and Analyses The following set of charts plots software piracy levels for seven countries: the United States, China, Japan, Brazil, South Korea, Germany, and Malaysia. These particular nations were selected in order to provide a mix of developed and less developed countries as well as a wide range of population levels and regime types. The selection of these countries was based on the need to include a diverse set of states, with different attributes and potentially different intervening variables. Accordingly, this would allow us to avoid a built in regression toward the mean in drawing inferences. At first glance, the United States and China possess the highest levels of software piracy (see Figure 1). However, these totals are not necessarily indicative of piracy rates, as they may simply reflect the large number of computer users within each country.
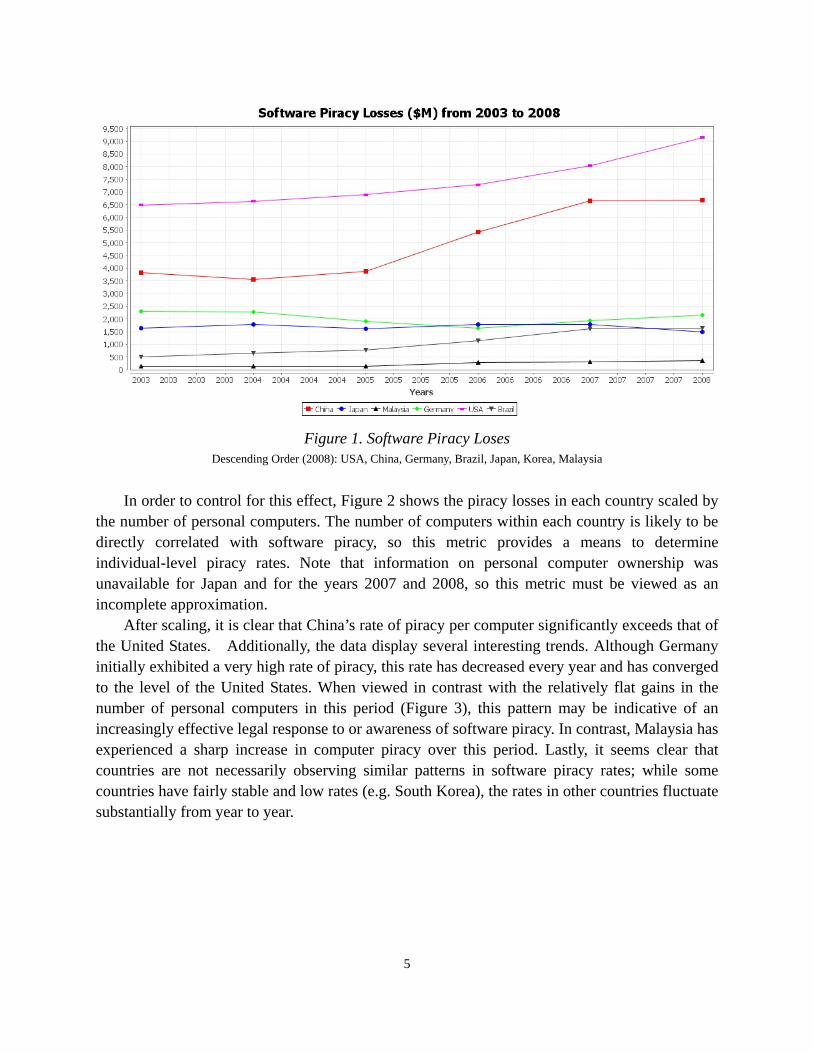
5
Figure 1. Software Piracy Loses
Descending Order (2008): USA, China, Germany, Brazil, Japan, Korea, Malaysia
In order to control for this effect, Figure 2 shows the piracy losses in each country scaled by the number of personal computers. The number of computers within each country is likely to be directly correlated with software piracy, so this metric provides a means to determine individual-level piracy rates. Note that information on personal computer ownership was unavailable for Japan and for the years 2007 and 2008, so this metric must be viewed as an incomplete approximation. After scaling, it is clear that China’s rate of piracy per computer significantly exceeds that of the United States. Additionally, the data display several interesting trends. Although Germany initially exhibited a very high rate of piracy, this rate has decreased every year and has converged to the level of the United States. When viewed in contrast with the relatively flat gains in the number of personal computers in this period (Figure 3), this pattern may be indicative of an increasingly effective legal response to or awareness of software piracy. In contrast, Malaysia has experienced a sharp increase in computer piracy over this period. Lastly, it seems clear that countries are not necessarily observing similar patterns in software piracy rates; while some countries have fairly stable and low rates (e.g. South Korea), the rates in other countries fluctuate substantially from year to year.

6
Figure 2. Software Piracy Losses per Personal Computer
Descending Order (2006): China, Malaysia, USA, Germany , Brazil, Japan, Korea
Figure 3. Number of Personal Computers
One alternate method to derive the rate of piracy within each country involves scaling piracy
losses by the number of Internet users, as can be seen in Figure 4. Clearly, this is a less direct proxy for software piracy than the number of scaled computers; for instance, in many less developed countries, users may have extensive access to Internet cafes, libraries, and corporate computers without owning a personal computer. Despite this potential difference in scaling, data are more widely available for this metric and one could make a strong case that software piracy

7
is increasingly correlated with Internet usage, illustrating that this proxy might be an appropriate metric to observe comparative trends. With this revised metric, the United States and Germany possess the highest rates of piracy, followed by developing countries such as China and Brazil. Interestingly, China’s rate exhibits a sharp drop after 2006. this may either reflect a sharp rise in Internet users or an increase in effective enforcement on a per user basis. While the data on piracy per computer seem to contradict this trend, this metric is unavailable from 2006-2008, so it is impossible to compare each metric directly. As in the previous chart, Germany shows a strong improvement, while the record of the United States is mixed.
Figure 4. Software Piracy Losses per User with Internet Access
Descending Order (2008): USA, Germany, China, Brazil, Malaysia, Japan, Korea
Although the BSA & IDC Global Software Piracy Study is centrally administered and we would not expect significant reporting discrepancies among countries with regard to reported levels of piracy, it is reasonable to expect that different nations would have different levels of enforcement vis-à-vis piracy that may affect the volume of illegal activity. One candidate method to measure this variation is the Rule of Law index, compiled by the World Bank and illustrated in Figure 5. Nations with higher Rule of Law should theoretically display lower rates of cyber crime versus countries with less developed legal systems.

8
Figure 5. Rule of Law Index Descending Order (2008): Germany, USA, Japan, Korea, Malaysia, Brazil, China
When software piracy losses are scaled by Rule of Law, the United States is the clear underperformer, as can be seen in Figure 6. The reasoning behind this ranking is easily apparent – for a country with extensive rule of law, the United States exhibits an unually high volume of software piracy. However, in a similar fashion to Figure 1, this scaled variable still references the absolute number of piracy losses and is not necessarily indicative of the rate of piracy. In order to achieve an unbiased ratio, it is necessary to scale this variable by the the number of personal computers and Internet users (Figures 7 & 8).

9
Figure 6. Software Piracy Losses adjusted for Rule of Law Index
Descending Order (2008): USA, Germany, Japan, South Korea, Malaysia, Brazil, China
(Piracy Losses * Rule of Law) / # of Internet Users
Figure 7. Software Piracy Losses adjusted for Rule of Law per Internet User
Descending Order (2007): Germany, USA, Japan, South Korea, China, Malaysia, Brazil

10
(Piracy Losses * Rule of Law) / # of Personal Computers
Figure 8. Software Piracy Losses adjusted for Rule of Law per Personal Computer
Descending Order (2007): Germany, USA, China, Malaysia, South Korea
Several caveats apply to the preceding figures. Metrics that are scaled by rule of law effectively penalize developed states relative to underdeveloped states. Alternatively, they point to the incomplete institutional structure and design in developing countries. It remains an open question whether this is appropriate – while we naturally would expect these countries to display less piracy due to more effective legal systems, it remains an open question whether the level of software piracy is directly correlated with a country’s legal climate. Since software piracy is a relatively new phenomenon, it may not be viewed as ‘illegal’ by many individuals and, as a result, enforcement may be weak. Further, given the novelty of the phenomenon, societies may have different ways of informing citizens and different instruments and tools for enforcing regulations. Due to this possible trend, these estimates may overstate the effect that a shift on the Rule of Law index may be expected to have on piracy rates. Despite these possible sources of inference error – perhaps capturing different influences at the same time – there is a corresponding advantage to using these metrics. By controlling for the rule of law in a given country as well as the country’s size, we can reduce variation across states and produce rough estimates of ‘natural’ piracy rates. In short, these metrics allow us to test what the level of piracy would be if each country possessed identical legal systems as well as similar endowments in technological infrastructure. The results show that Germany and the United States are relative underperformers. Although this result may be unsurprising given the level of technological development in each country, it is interesting to note the comparatively low piracy rates for South Korea and Japan across a variety of metrics. There might even be a sociological explanation, namely that high conformity is valued in Asian societies, whereas in the United States, and perhaps less in Germany, individual initiative dominates, and is often rewarded. These cases suggest that piracy levels may not necessarily be conditional on technological development, but may stem from cultural or legal factors that vary from country to country. In conclusion, the results suggest that the absolute volume of software piracy has risen over

11
the past decade, with the bulk of activity in a few nations such as the United States and China. The trends affecting piracy rates are more ambiguous, however, with different countries exhibiting different levels and trends. Surprisingly, a country’s rate of piracy does not seem to be conditional on whether it is a developed or a less developed country. In almost all of the metrics examined here, Korea and Japan have outperformed, while the United States and Germany have exhibited less positive results. Although isolating the national events that lead to these different trends is difficult, this analysis suggests fruitful avenues for further research should data remain consistently available for the selected countries. 4. Conclusions
This analysis has sought to accomplish two distinct tasks. First, although Internet security data is scant and scattered across the Internet, we were nevertheless able to identify and illustrate several interesting trends from existing data that shed light on how different nations and organizations are coping with the global rise of cyber crime. Second, our results highlight several inconsistencies and ambiguities in data provided by different organizations, and we believe that relying on these published statistics without the benefit of a rigorous comparative analysis could lead to fundamentally misleading conclusions regarding the international efforts to improve cybersecurity and fight against cybercrime.
Although the data challenges may be interpreted as an argument against using such data sources, our research implies that the dilemmas could be ameliorated through careful analysis and by promoting a minimum level of standardization across Internet security statistics and the contexts within which they are collected.. If stronger data provisions are enacted, we are confident that the international community would improve the odds of learning from other organizations, identifying rising threats, and stemming the tide of cybercrime. Lastly, it is clear through our analysis that an increase in data availability – be it from governments, CERTs, or international organizations – could yield positive effects in both supporting existing scholarship and the expansion into new fields of knowledge related to cyber crime.
With the increasing global interconnection of computer networks and sophistication of cyber attacks, the need for collective and cooperative cybersecurity measures have been drawing more attention, so that cybersecurity emergencies can be prevented or efficiently addressed. This paper first introduces the various organizations that produce quantitative and qualitative cybersecurity data. Although much information is freely shared and non-confidential, few organizations provide standardized or reliable metrics and where data exists, it usually limited in scope and rarely aggregated. This paper introduces the ECIR Data Dashboard Project developed to gather the cybersecurity data that are publicly provided by national and international organizations and provide stakeholders with a comprehensive set of data, across multiple countries, multiple data categories, and multiple years on nation-level cybersecurity, cybercrime, IT characteristics, political environment, and demographics. In spite of the identified shortcomings of the data, it is possible to learn and identify interesting trends using the Data Dashboard.
In the future, as part of the ECIR project, more data sources will be identified and incorporated to increase the effectiveness of the Dashboard project, so that further interesting

12
international cybersecurity relations can be investigated. Also, existing and advanced techniques, such as the utilization of semantic integration technologies, will be applied to address and improve the data inconsistency problems among different organizations.
One important aspect of our research is to explore and promote the economic and social incentives of gathering and sharing the nation-level cybersecurity data among the national and international organizations (e.g., CERTs) as well as the data of other organizations, both public and private, that gather relevant cybersecurity data.
Acknowledgements The work reported herein was supported, in part, by the Explorations in Cyber International Relations (ECIR) project funded by the Office of Naval Research (ONR) contract number N00014-09-1-0597. Any opinions, findings, and conclusions or recommendations expressed in this paper are those of the authors and do not necessarily reflect the views of the Office of Naval Research. References Choucri, N. Cyberpolitics in International Relations. (MIT Press: in press) Gal-Or, E., and Ghose, A. 2005. “The economic incentives for sharing security information,” Information
Systems Research (16:2), pp. 186-208. Kimberland, K. 2003. "U.S. Department of Homeland Security Announces Partnership with Carnegie
Mellon's CERT Coordination Center," Carnegie Mellon University Press Release (available from http://www.sei.cmu.edu/newsitems/uscert.cfm).
Madnick, S., Firat, A., and Siegel, M. "The Caméléon Web Wrapper Engine," in Proceedings of the VLDB Workshop on Technologies for E-Services [SWP #4128, CISL #00-03], Cairo, Egypt, 2000, pp. 269–283.
Madnick, S., Li, X., and Choucri, N., “Experiences and Challenges with using CERT Data to Analyze International Cyber Security,” Proceedings of the AIS SIGSEC Workshop on Information Security & Privacy (WISP 2009), Phoenix, Arizona, December 2009, pp. 6-16.
Raue, K., Barczaitis, H., Wolff, T. et al. 2009. "Palo Manual," Jedox AG, 2009. Rubin, A.D. and Geer Jr, D.E. 1998. "A survey of Web security," Computer (31:9), pp. 34-41. Software Engineering Institute. 2008. "Meet CERT," Carnegie Mellon University, July 21, 2008 (available
from http://www.cert.org/meet_cert/). US-CERT. 2008. "US-CERT Quarterly Trends and Analysis Report," (available from
http://www.us-cert.gov/press_room/trendsanalysisQ408.pdf).