Embed Size (px)
Citation preview
Comparative Analysis of Software Network and CK Metrics: Implications for Pre- and Post-
release Faults
Fangjun Wu School of Information Technology,Jiangxi University of Finance and Economics, NanChang, 330013, China
Jiangxi Key Laboratory of Data and Knowledge Engineering, Jiangxi University of Finance and Economics, Nanchang, 330013, China
Email: [email protected]
Abstract—The research on open source software has attracted a great deal of attention during the past decades for its wide applications in both academia and industry. Among the research topics related to open source software, the usefulness of software network metrics for fault prediction has been received much attention recently. In order to verify the importance of software network metrics in the performance of fault prediction models, this study mixes software network and Chidamber & Kemerer (CK) metrics to predict pre- and post-release fault-proneness of Eclipse version 2.0. The "small world" and "scale-free" characteristics and Spearman correlation have been analyzed in detail. In addition, we employed10 classifiers, 2 weak classifiers, and 5 performance evaluation criteria to conduct three sets of experiments. Experimental results have demonstrated that the software network metrics can only provide little overall performance improvement. Based on the comprehensive study, the effect of software network metrics can be ignored. Index Terms—software network metrics, Chidamber & Kemerer (CK) metrics, fault prediction, classification, scale-free characteristic
I. INTRODUCTION
With the rapid development of open source software, the "small world" and "scale-free" characteristics have been discovered successively in lots of real world systems such as J2SE SDK, Eclipse, Smalltalk system, OpenOffice, BEA WebLogic, MS-Windows binaries, TEX, FreeBSD system calls, and Perl CPAN [1-5]. The epoch-making finding attracts attention of numerous researchers and software developers in both academia and industry, which contributes much to the development of software network metrics. Up to now, there are several graph-level metrics proposed in the research community, including In-Degree, Out-Degree, average shortest path length, clustering coefficient, betweenness centrality, etc. These metrics are useful in evaluating the quality of software design, and thus can help developers to design better and more robust large-scale open source software.
Although there has been a significant amount of work done relating to predicate faults on the basis of software network metrics [5-12], full exhaustively comprehensive
empirical analysis is still lacking, which provided suggestions on metric choice for software network researchers and practitioners. Moreover, almost all of existing studies can only predict post-release faults. In this study, the goal is to predict both pre- and post- release faults. In this study, we try to answer the following four questions through the comprehensive analysis of software network and CK metrics. Does software network metrics improve the performance of fault prediction models beyond that obtained by previous fault prediction models? Does the effect of software network metrics differ with different classifiers? Does the effect of software network metrics differ with different base classifiers? Can software network metrics accelerate the convergence of classifiers? In this study, Eclipse version 2.0 was adopted to conduct the experiments.
The remainder of this paper is organized as follows. Following the introduction section, section 2 provides an overview on related works. Section 3 analyzes “small-world” and “scale-free” characteristics of software network and CK metrics. In section 4, we analyze Spearman correlations among the number of faults, software network and CK metrics. In section 5, we combine software network and CK metrics into a whole framework to predict pre- and post-release fault-proneness. Experimental results are analyzed in section 6. The final section concludes this study.
II. RELATED WORKS
In software networks, the software measurement problem is a traditional problem and has attracted much attention in literature. A large variety of metrics have been proposed in the past decades and their usefulness has been experimentally demonstrated, creating diverse choices. Recently, many researchers have been trying to address the issue of fault prediction based on software network metrics [6-13].
Zimmermann et al. [6] compared the ability of network and complexity metrics on Windows Server 2003. They found that the recall of models built from network metrics was 10% points higher than that of models built from complexity metrics, and thus concluded that network
JOURNAL OF SOFTWARE, VOL. 9, NO. 3, MARCH 2014 541
© 2014 ACADEMY PUBLISHERdoi:10.4304/jsw.9.3.541-552
metrics were able to predict faults better than those complexity metrics did.
Bird et al. [7] showed the influence of combined socio-technical software networks on the fault-proneness of individual software components within Windows Vista and six releases of Eclipse.
Tosun et al. [8] examined three small-scale embedded software and two releases of Eclipse to compare fault prediction performance of complexity and Social Network Analysis (SNA) metrics from function level and source-file level. They found that network metrics were important indicators of fault modules for large and complex systems, whereas they did not have significant effects on small-scale systems.
Concas et al. [10] reported the correlations among SNA metrics, CK metrics and faults on two large Java systems, of Eclipse and Netbeans. They pointed out that SNA metrics generally showed a moderate correlation with faults and were comparable to those of CK metrics.
Tonelli et al. [11] analyzed 9 metrics borrowed from Social Network Analysis (SNA) and 3 traditional software metrics, such as Loc, Fan-in and Fan-out, on 96 software systems of the Java Qualitas Corpus. For Eclipse and Netbeans, they found that some SNA metrics (such as Size, Ties, Brokerage and effSize) were highly correlated with faults, while others were strongly anti-correlated.
Tonelli et al. [12] presented an empirical and exploratory study on the joint application of CK metrics, SNA metrics, and other network metrics to analyze evolution of 7 releases of Eclipse in time. They concluded that the joint application of traditional and network software metrics could be used to identify sub-projects with similar functionality and scopes.
Almost all existing research in software network metrics related to fault prediction considered only post-release fault prediction and did not consider pre-release fault prediction issues. Moreover, the SNA metrics were computed on undirected graphs. To overcome the drawbacks of these existing studies, this study proposes a
novel algorithm to predict not only pre-release faults, but also post-release faults, which can be understood as an extension of previous works. Furthermore, the SNA metrics were computed on directed graphs. We believe that this work represents a significant step forward to empirically understanding software network metrics and their impacts on fault prediction.
III. THE ANALYSIS OF "SMALL WORLD" AND “SCALE-FREE” CHARACTERISTICS
The “small world” and “scale-free” properties are deemed as the most important statistical characteristics of complex networks, which have been observed in a host of complex networks, including some large-scale software, World Wide Web (WWW), Internet, metabolic networks, telephone call graphs, network of human sexual contacts, and protein interaction networks [14, 15]. The "small world" (also known as six degrees of separation) is known for average shortest path length and high (average) clustering coefficient, while the "scale-free" is famous for power-law degree distribution.
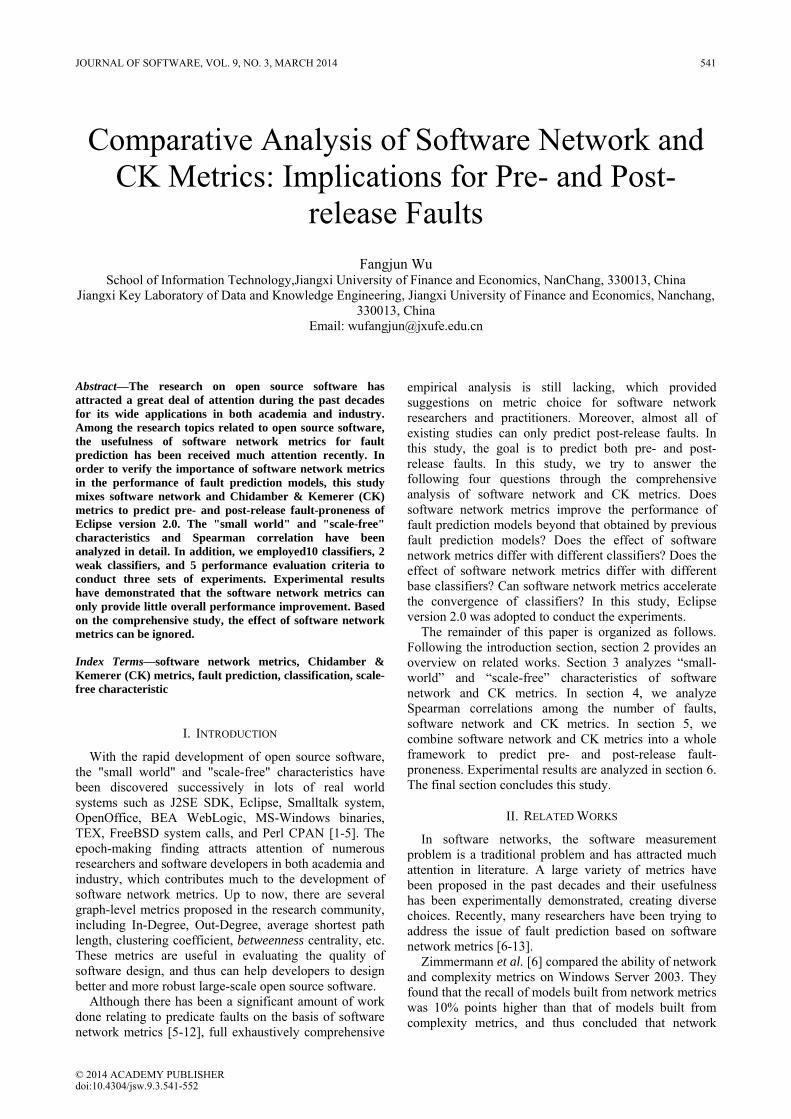
The used dataset in this study was obtained from three resources. The first were pre- and post-release faults of Eclipse version 2.0, which can be downloaded from PROMISE software engineering repository (http://www.st.cs.uni-saarland.de/softevo/bug-data/eclipse/). Eclipse version 2.0 contains 6729 classes, among which 4203 were selected randomly. In pre-release version, there were 2433 classes with no-fault, and other 1770 with faults, referred as pre-release fault dataset; while in post-release version, there were 3498 classes with no-fault, and other 705 with faults, referred as post-release fault dataset. The second part include their CK metrics data, which can be computed by the software metric tool Understand (http://www.scitools.com/). The last one include software network metrics, which can be computed by the open-source library JUNG (http://jung.sourceforge.net/).
TABLE I.
DESCRIPTIVE STATISTICS OF PRE-RELEASE OF ECLIPSE 2.0
Metrics LOC CBO NOC DIT LCOM WMC In-Degree Out-Degree Dijkstra shortest path
Betweenness Centrality (edge)
Betweenness Centrality (vertex)
Min 8 0 0 1 0 0 0 0 0 1 0
Max 5200 149 94 8 100 1234 5373 1 8 404 400
Percentile (25%) 24 2 0 1 0 5 0 1 0 1 0
Percentile (75%) 125 15 0 3 80 26 0 1 0 3 0
Median 53 7 0 2 60 12 0 1 0 1 0
Mean 116.644 11.039 0.2722.358 48.564 24.145 0.953707 0.953707 0.000334736 3.4800127 1.5372668
Variance 50660.234166.3203.4911.9701269.2792207.1532919.292491 0.04415486 0.000877067 155.16808 144.63213
Std Dev 225.078 12.897 1.8681.403 35.627 46.980 28941865.75437.7512859 86221.98493 1467114.2 1433883
Std Error 3.439 0.197 0.0290.021 0.544 0.718 54.02775 0.21012 0.02961531 12.455989 12.025704
Mode 5 0 0 1 0 3 0 1 0 1 0
542 JOURNAL OF SOFTWARE, VOL. 9, NO. 3, MARCH 2014
© 2014 ACADEMY PUBLISHER
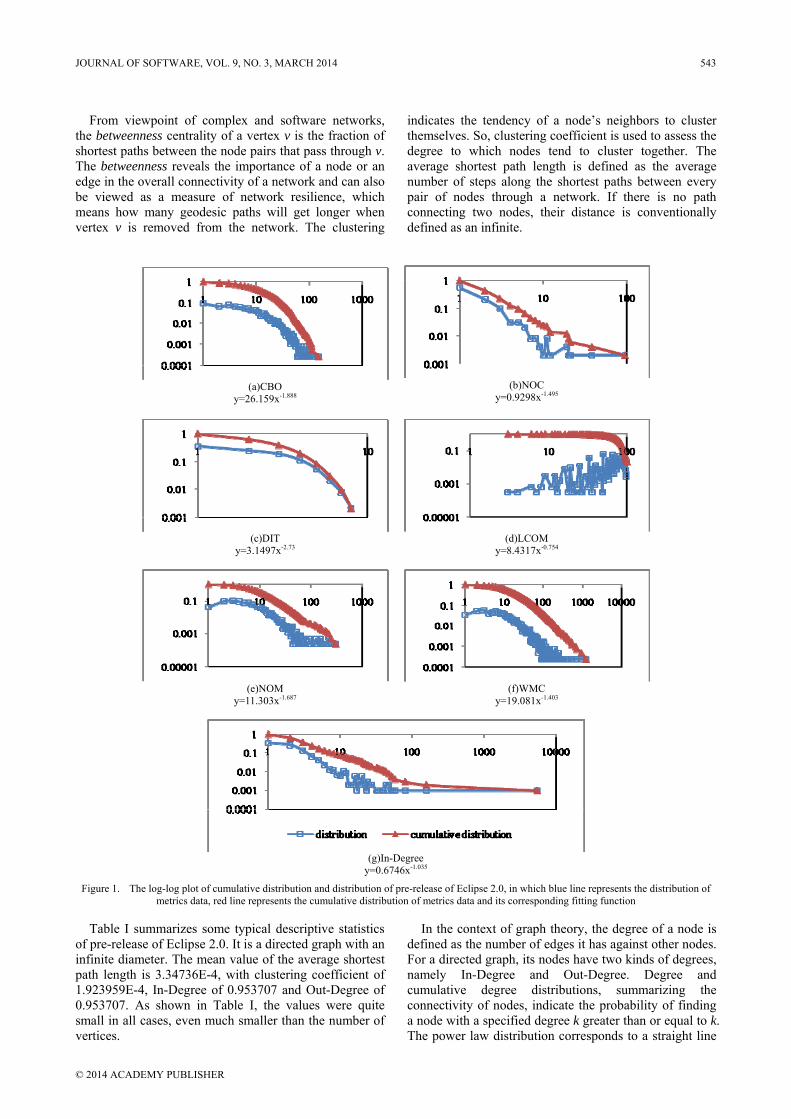
From viewpoint of complex and software networks, the betweenness centrality of a vertex v is the fraction of shortest paths between the node pairs that pass through v. The betweenness reveals the importance of a node or an edge in the overall connectivity of a network and can also be viewed as a measure of network resilience, which means how many geodesic paths will get longer when vertex v is removed from the network. The clustering
indicates the tendency of a node’s neighbors to cluster themselves. So, clustering coefficient is used to assess the degree to which nodes tend to cluster together. The average shortest path length is defined as the average number of steps along the shortest paths between every pair of nodes through a network. If there is no path connecting two nodes, their distance is conventionally defined as an infinite.
(a)CBO y=26.159x-1.888
(b)NOC
y=0.9298x-1.495
(c)DIT y=3.1497x-2.73
(d)LCOM
y=8.4317x-0.754
(e)NOM y=11.303x-1.687
(f)WMC
y=19.081x-1.403
(g)In-Degree
y=0.6746x-1.035
Figure 1. The log-log plot of cumulative distribution and distribution of pre-release of Eclipse 2.0, in which blue line represents the distribution of metrics data, red line represents the cumulative distribution of metrics data and its corresponding fitting function
Table I summarizes some typical descriptive statistics of pre-release of Eclipse 2.0. It is a directed graph with an infinite diameter. The mean value of the average shortest path length is 3.34736E-4, with clustering coefficient of 1.923959E-4, In-Degree of 0.953707 and Out-Degree of 0.953707. As shown in Table I, the values were quite small in all cases, even much smaller than the number of vertices.
In the context of graph theory, the degree of a node is defined as the number of edges it has against other nodes. For a directed graph, its nodes have two kinds of degrees, namely In-Degree and Out-Degree. Degree and cumulative degree distributions, summarizing the connectivity of nodes, indicate the probability of finding a node with a specified degree k greater than or equal to k. The power law distribution corresponds to a straight line
JOURNAL OF SOFTWARE, VOL. 9, NO. 3, MARCH 2014 543
© 2014 ACADEMY PUBLISHER
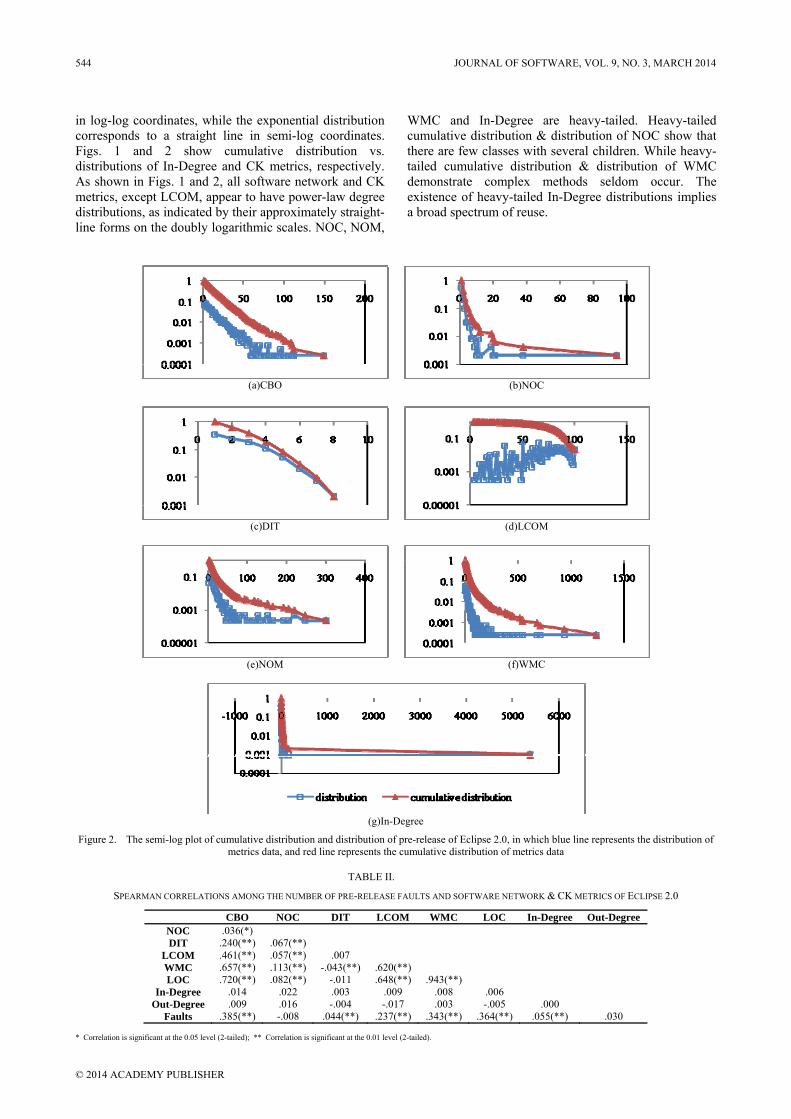
in log-log coordinates, while the exponential distribution corresponds to a straight line in semi-log coordinates. Figs. 1 and 2 show cumulative distribution vs. distributions of In-Degree and CK metrics, respectively. As shown in Figs. 1 and 2, all software network and CK metrics, except LCOM, appear to have power-law degree distributions, as indicated by their approximately straight-line forms on the doubly logarithmic scales. NOC, NOM,
WMC and In-Degree are heavy-tailed. Heavy-tailed cumulative distribution & distribution of NOC show that there are few classes with several children. While heavy-tailed cumulative distribution & distribution of WMC demonstrate complex methods seldom occur. The existence of heavy-tailed In-Degree distributions implies a broad spectrum of reuse.
(a)CBO
(b)NOC
(c)DIT
(d)LCOM
(e)NOM
(f)WMC
(g)In-Degree
Figure 2. The semi-log plot of cumulative distribution and distribution of pre-release of Eclipse 2.0, in which blue line represents the distribution of metrics data, and red line represents the cumulative distribution of metrics data
TABLE II.
SPEARMAN CORRELATIONS AMONG THE NUMBER OF PRE-RELEASE FAULTS AND SOFTWARE NETWORK & CK METRICS OF ECLIPSE 2.0
CBO NOC DIT LCOM WMC LOC In-Degree Out-Degree NOC .036(*) DIT .240(**) .067(**)
LCOM .461(**) .057(**) .007 WMC .657(**) .113(**) -.043(**) .620(**) LOC .720(**) .082(**) -.011 .648(**) .943(**)
In-Degree .014 .022 .003 .009 .008 .006 Out-Degree .009 .016 -.004 -.017 .003 -.005 .000
Faults .385(**) -.008 .044(**) .237(**) .343(**) .364(**) .055(**) .030 * Correlation is significant at the 0.05 level (2-tailed); ** Correlation is significant at the 0.01 level (2-tailed).
544 JOURNAL OF SOFTWARE, VOL. 9, NO. 3, MARCH 2014
© 2014 ACADEMY PUBLISHER
IV. SPEARMAN CORRELATION ANALYSIS
To analyze the correlations between the number of faults, and software network metrics or between the number of faults and CK metrics, we set the Spearman correlation values as constant values. Here take In-Degree and Out-Degree as examples of software network metrics, and the number of pre-release faults as faults of Eclipse version 2.0. The experimental results are shown in Table II. As indicated by the moderate values in the last row of Table II, there are moderate even weak correlations between the number of pre-release faults and software network metrics, and similar conclusion is found with the correlations between the number of pre-release faults and CK metrics. Furthermore, the Spearman rank correlation order of software network and CK metrics is as follows: CBO, LOC, WMC, LCOM, In-Degree, DIT, Out-Degree and NOC. Although the Spearman correlation values between the number of faults and CK metrics are not relative high, experimental results have shown CK metrics are good indicators of fault prediction [16,17]. Therefore, low Spearman correlation values do not necessarily lead to low performance of prediction.
V. FAULT PREDICTION BY MIXING SOFTWARE NETWORK AND CK METRICS
This section provides a detailed comparative analysis of software network and CK metrics on fault prediction. Among those software network metrics mentioned in Section 3, the degree metrics are taken as the example. Additionally, the experimental design is given, including base classifiers, compared techniques considered in this study, criteria used to assess classification performance and parameter choice. For the purpose of prediction, pre- and post-release faults of Eclipse version 2.0 are transferred into two labels, namely fault-proneness and no-fault-proneness, thus the used datasets are pre- and post-release fault-proneness datasets correspondingly.
A. “Simple”and “Weak” Classifiers In this study, we use two types of classifiers, namely
J48 and Naïve Bayes as weak classifiers for the following reasons [18]: (1) they are well-known and commonly-used in the communities of machine learning and classification. (2) They are standard statistical techniques for classification.
B. Comparison Techniques In this study, we use 10 classification algorithms
including AdaC1 [19], AdaC2 [19], AdaC3 [19], weak classifiers (J48 or Naïve Bayes), AdaBoost [20] on the former two parts of datasets, and their variances on the whole datasets, denoted by Degree-AdaC1, Degree-AdaC2, Degree-AdaC3, Degree-weak classifiers (Degree-J48 or Degree-Naïve Bayes), and Degree-AdaBoost respectively. Previous experimental studies have shown that the impact of varying parameters is insignificant. Thus we adopt the default parameters, as recommended by Weka. The default parameters of the J48 are set as [18]: -C 0.25 -M 2.
C. Evaluation Criteria A large number of evaluation criteria have been used
in the literature, among which we use precision, F-Measure, Geometric mean (G-mean) [21], GMPR and AUC [22] in this study. The first criterion is for fault-prone classes, while the latter four are measures of the discrimination power of a classifier with respect to each class, providing balanced viewpoints.
D. Experimental Parameters The ultimate goal of this study is to check whether the
use of software network metrics can improve the performance of fault prediction models beyond that obtained by previous fault prediction models. In this study, three sets of experiments were conducted for pre- and post-release fault-proneness datasets to try to answer the following four questions (proposed in Section 1). (1) The first set of experiments is conducted to check the effect of the degree metrics on different classifiers. (2) The second set of experiments is conducted to examine whether the degree metrics can accelerate convergence of classifiers or not. (3) The third one is conducted to investigate the effect of the degree metrics on base classifiers.
All learners were implemented in Java within the framework of Weka toolkit [18], which is commonly used in machine learning research community. The default parameters are set as discussed in Section 5.2. All the experimental results are always generated by 10-fold cross-validation of classification to avoid sampling bias. The performances is evaluated by the average results of 50 repeated times randomly.
TABLE III.
EXPERIMENTAL PARAMETER SETUPS
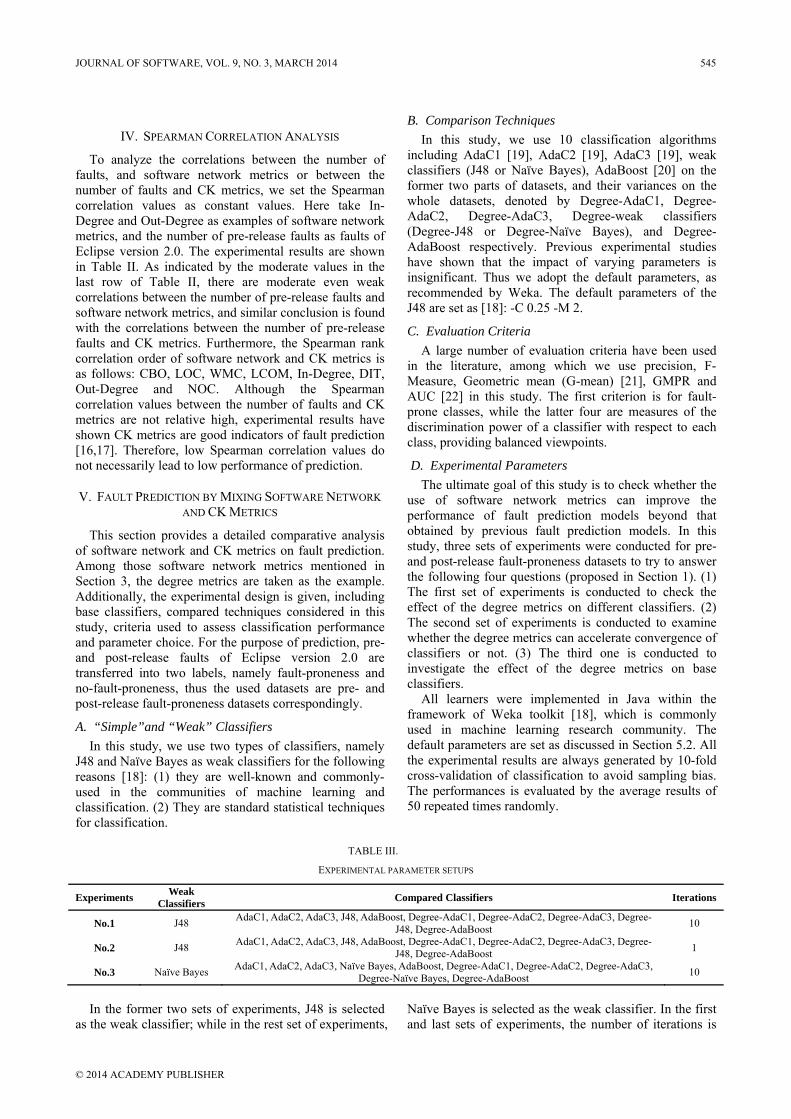
Experiments Weak Classifiers Compared Classifiers Iterations
No.1 J48 AdaC1, AdaC2, AdaC3, J48, AdaBoost, Degree-AdaC1, Degree-AdaC2, Degree-AdaC3, Degree-J48, Degree-AdaBoost 10
No.2 J48 AdaC1, AdaC2, AdaC3, J48, AdaBoost, Degree-AdaC1, Degree-AdaC2, Degree-AdaC3, Degree-J48, Degree-AdaBoost 1
No.3 Naïve Bayes AdaC1, AdaC2, AdaC3, Naïve Bayes, AdaBoost, Degree-AdaC1, Degree-AdaC2, Degree-AdaC3, Degree-Naïve Bayes, Degree-AdaBoost 10
In the former two sets of experiments, J48 is selected
as the weak classifier; while in the rest set of experiments, Naïve Bayes is selected as the weak classifier. In the first and last sets of experiments, the number of iterations is
JOURNAL OF SOFTWARE, VOL. 9, NO. 3, MARCH 2014 545
© 2014 ACADEMY PUBLISHER
set as 10; while in the second set of experiments, the number of iterations is set as 1. For the sake of clarity, a detailed description of experimental parameters is given in Table III.
Lastly, we conducted a collection of experiments over Eclipse employing 10 classifiers, 2 weak classifiers, and
5 performance evaluation criteria on pre- and post-release fault-proneness datasets.
VI. RESULTS AND DISCUSSION
This section provides a detailed report and discussion of the experimental results. As stated in Section 5.4, they are described separately.
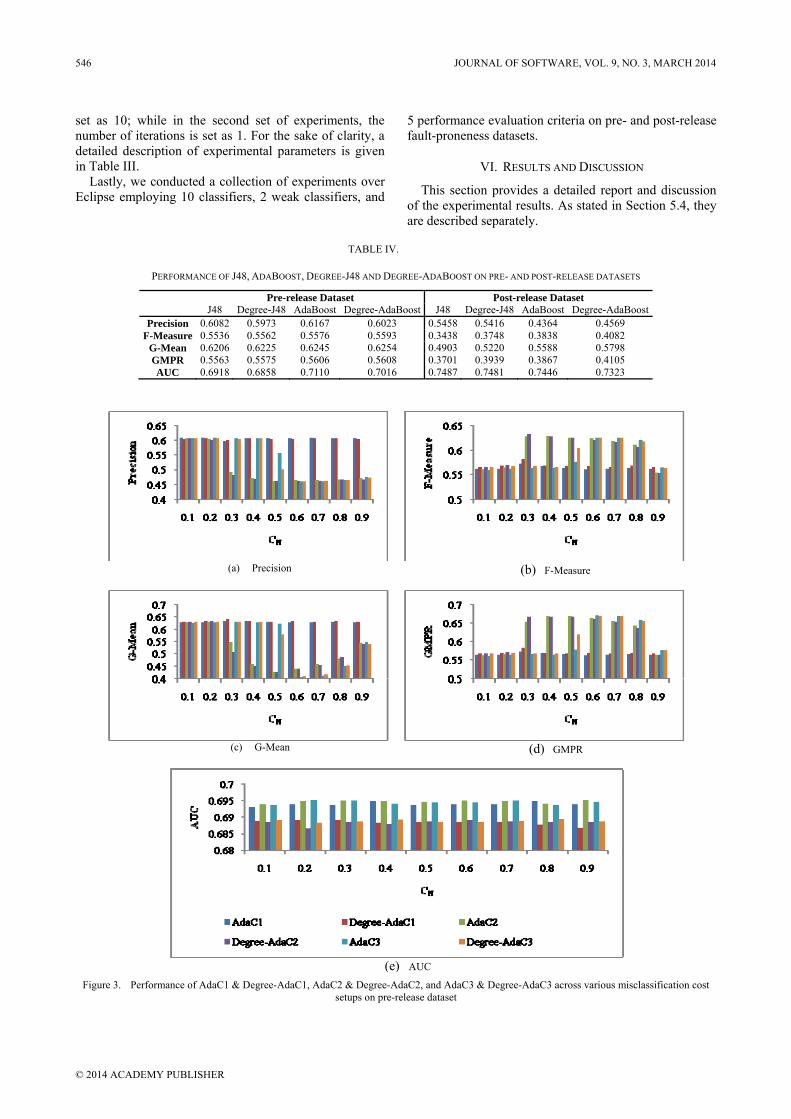
TABLE IV.
PERFORMANCE OF J48, ADABOOST, DEGREE-J48 AND DEGREE-ADABOOST ON PRE- AND POST-RELEASE DATASETS
Pre-release Dataset Post-release Dataset J48 Degree-J48 AdaBoost Degree-AdaBoost J48 Degree-J48 AdaBoost Degree-AdaBoost
Precision 0.6082 0.5973 0.6167 0.6023 0.5458 0.5416 0.4364 0.4569 F-Measure 0.5536 0.5562 0.5576 0.5593 0.3438 0.3748 0.3838 0.4082
G-Mean 0.6206 0.6225 0.6245 0.6254 0.4903 0.5220 0.5588 0.5798 GMPR 0.5563 0.5575 0.5606 0.5608 0.3701 0.3939 0.3867 0.4105 AUC 0.6918 0.6858 0.7110 0.7016 0.7487 0.7481 0.7446 0.7323
(a) Precision
(b) F-Measure
(c) G-Mean
(d) GMPR
(e) AUC
Figure 3. Performance of AdaC1 & Degree-AdaC1, AdaC2 & Degree-AdaC2, and AdaC3 & Degree-AdaC3 across various misclassification cost setups on pre-release dataset
546 JOURNAL OF SOFTWARE, VOL. 9, NO. 3, MARCH 2014
© 2014 ACADEMY PUBLISHER
(a) Precision
(b) F-Measure
(c) G-Mean
(d) GMPR
(e) AUC
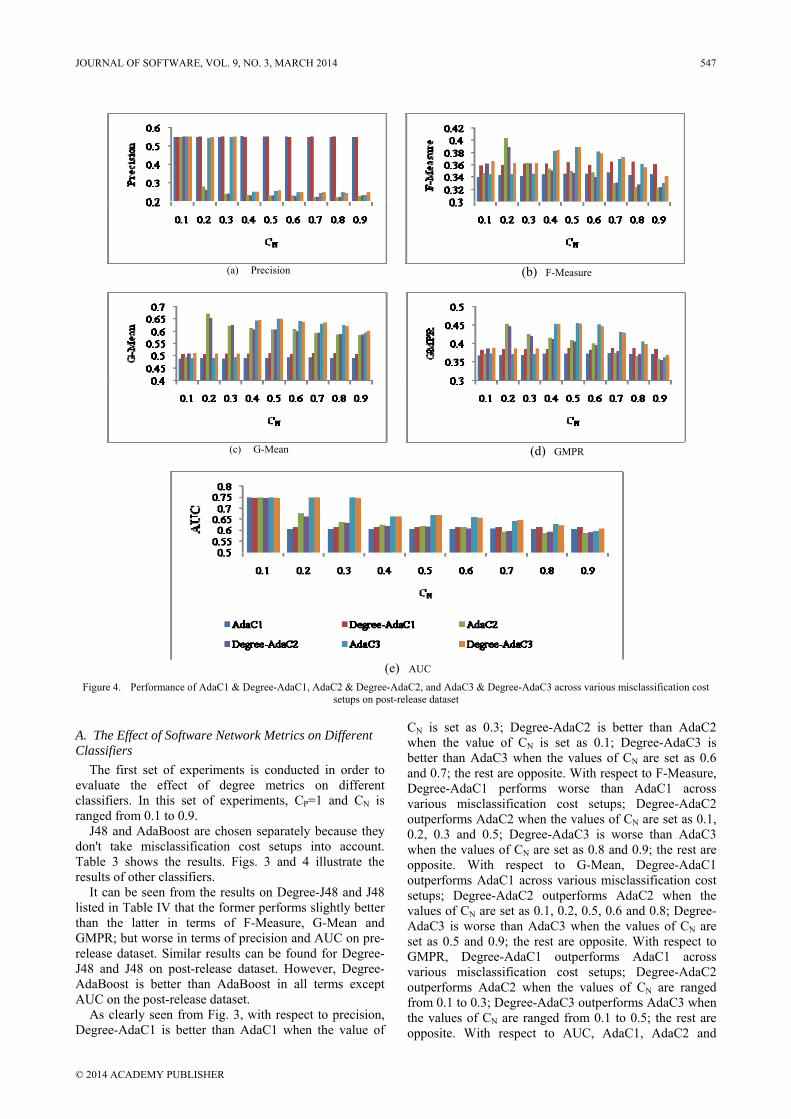
Figure 4. Performance of AdaC1 & Degree-AdaC1, AdaC2 & Degree-AdaC2, and AdaC3 & Degree-AdaC3 across various misclassification cost setups on post-release dataset
A. The Effect of Software Network Metrics on Different Classifiers
The first set of experiments is conducted in order to evaluate the effect of degree metrics on different classifiers. In this set of experiments, CP=1 and CN is ranged from 0.1 to 0.9.
J48 and AdaBoost are chosen separately because they don't take misclassification cost setups into account. Table 3 shows the results. Figs. 3 and 4 illustrate the results of other classifiers.
It can be seen from the results on Degree-J48 and J48 listed in Table IV that the former performs slightly better than the latter in terms of F-Measure, G-Mean and GMPR; but worse in terms of precision and AUC on pre-release dataset. Similar results can be found for Degree-J48 and J48 on post-release dataset. However, Degree-AdaBoost is better than AdaBoost in all terms except AUC on the post-release dataset.
As clearly seen from Fig. 3, with respect to precision, Degree-AdaC1 is better than AdaC1 when the value of
CN is set as 0.3; Degree-AdaC2 is better than AdaC2 when the value of CN is set as 0.1; Degree-AdaC3 is better than AdaC3 when the values of CN are set as 0.6 and 0.7; the rest are opposite. With respect to F-Measure, Degree-AdaC1 performs worse than AdaC1 across various misclassification cost setups; Degree-AdaC2 outperforms AdaC2 when the values of CN are set as 0.1, 0.2, 0.3 and 0.5; Degree-AdaC3 is worse than AdaC3 when the values of CN are set as 0.8 and 0.9; the rest are opposite. With respect to G-Mean, Degree-AdaC1 outperforms AdaC1 across various misclassification cost setups; Degree-AdaC2 outperforms AdaC2 when the values of CN are set as 0.1, 0.2, 0.5, 0.6 and 0.8; Degree-AdaC3 is worse than AdaC3 when the values of CN are set as 0.5 and 0.9; the rest are opposite. With respect to GMPR, Degree-AdaC1 outperforms AdaC1 across various misclassification cost setups; Degree-AdaC2 outperforms AdaC2 when the values of CN are ranged from 0.1 to 0.3; Degree-AdaC3 outperforms AdaC3 when the values of CN are ranged from 0.1 to 0.5; the rest are opposite. With respect to AUC, AdaC1, AdaC2 and
JOURNAL OF SOFTWARE, VOL. 9, NO. 3, MARCH 2014 547
© 2014 ACADEMY PUBLISHER
AdaC3 are better than Degree-AdaC1, Degree-AdaC2 and Degree-AdaC3, respectively.
There is a similar phenomenon from the results of AdaC1 & Degree-AdaC1, AdaC2 & Degree-AdaC2, and AdaC3 & Degree-AdaC3 on post-release dataset, as shown in Fig.4. With respect to precision, Degree-AdaC1 is better than AdaC1 when the values of CN are set as 0.2, 0.3, 0.5, 0.7 and 0.8; Degree-AdaC2 is better than AdaC2 when the values of CN are set as 0.1, 0.3, 0.8 and 0.9; AdaC3 is better than Degree-AdaC3 when the values of CN are 0.1, 0.6 and 0.8; the rest are opposite. With respect to F-Measure, Degree-AdaC1 outperforms AdaC1 across various misclassification cost setups; Degree-AdaC2 outperforms AdaC2 when the values of CN are set as 0.1, 0.7, 0.8 and 0.9; Degree-AdaC3 is worse than AdaC3 when the values of CN are set as 0.6 and 0.8; the rest are opposite. With respect to G-Mean, Degree-AdaC1
outperforms AdaC1 across various misclassification cost setups; Degree-AdaC2 outperforms AdaC2 when the values of CN are set as 0.1, 0.3, 0.7, 0.8 and 0.9; Degree-AdaC3 is worse than AdaC3 when the values of CN are set as 0.5, 0.6 and 0.8; the rest are opposite. With respect to GMPR, Degree-AdaC1 outperforms AdaC1 across various misclassification cost setups; Degree-AdaC2 outperforms AdaC2 when the values of CN are set as 0.1, 0.5 and 0.8; Degree-AdaC3 outperforms AdaC3 when the values of CN are ranged from 0.1 to 0.3; the rest are opposite. With respect to AUC, Degree-AdaC1 outperforms AdaC1 except the value of CN is set as 0.1; Degree-AdaC2 outperforms AdaC2 when the values of CN are ranged from 0.7 to 0.9; Degree-AdaC3 outperforms AdaC3 when the values of CN are set as 0.4, 0.7 and 0.9; the rest are opposite.
TABLE V.
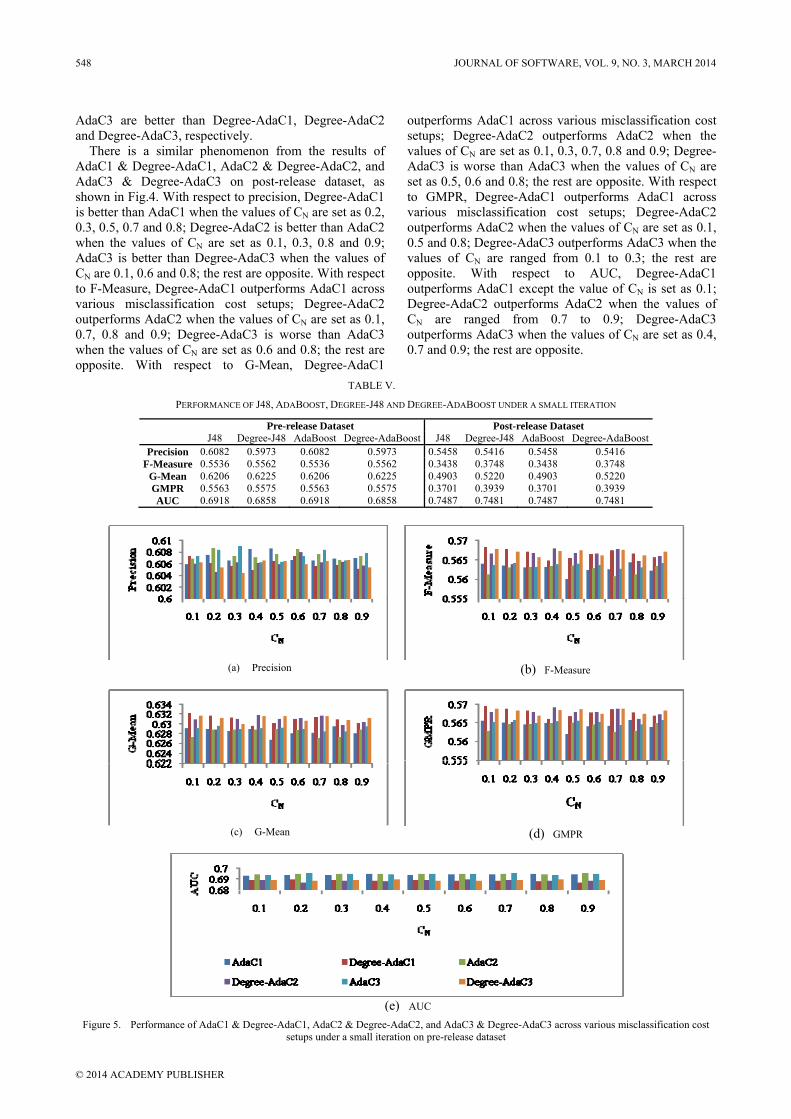
PERFORMANCE OF J48, ADABOOST, DEGREE-J48 AND DEGREE-ADABOOST UNDER A SMALL ITERATION
Pre-release Dataset Post-release Dataset J48 Degree-J48 AdaBoost Degree-AdaBoost J48 Degree-J48 AdaBoost Degree-AdaBoost
Precision 0.6082 0.5973 0.6082 0.5973 0.5458 0.5416 0.5458 0.5416 F-Measure 0.5536 0.5562 0.5536 0.5562 0.3438 0.3748 0.3438 0.3748
G-Mean 0.6206 0.6225 0.6206 0.6225 0.4903 0.5220 0.4903 0.5220 GMPR 0.5563 0.5575 0.5563 0.5575 0.3701 0.3939 0.3701 0.3939 AUC 0.6918 0.6858 0.6918 0.6858 0.7487 0.7481 0.7487 0.7481
(a) Precision
(b) F-Measure
(c) G-Mean
(d) GMPR
(e) AUC
Figure 5. Performance of AdaC1 & Degree-AdaC1, AdaC2 & Degree-AdaC2, and AdaC3 & Degree-AdaC3 across various misclassification cost setups under a small iteration on pre-release dataset
548 JOURNAL OF SOFTWARE, VOL. 9, NO. 3, MARCH 2014
© 2014 ACADEMY PUBLISHER
(a) Precision
(b) F-Measure
(c) G-Mean
(d) GMPR
(e) AUC
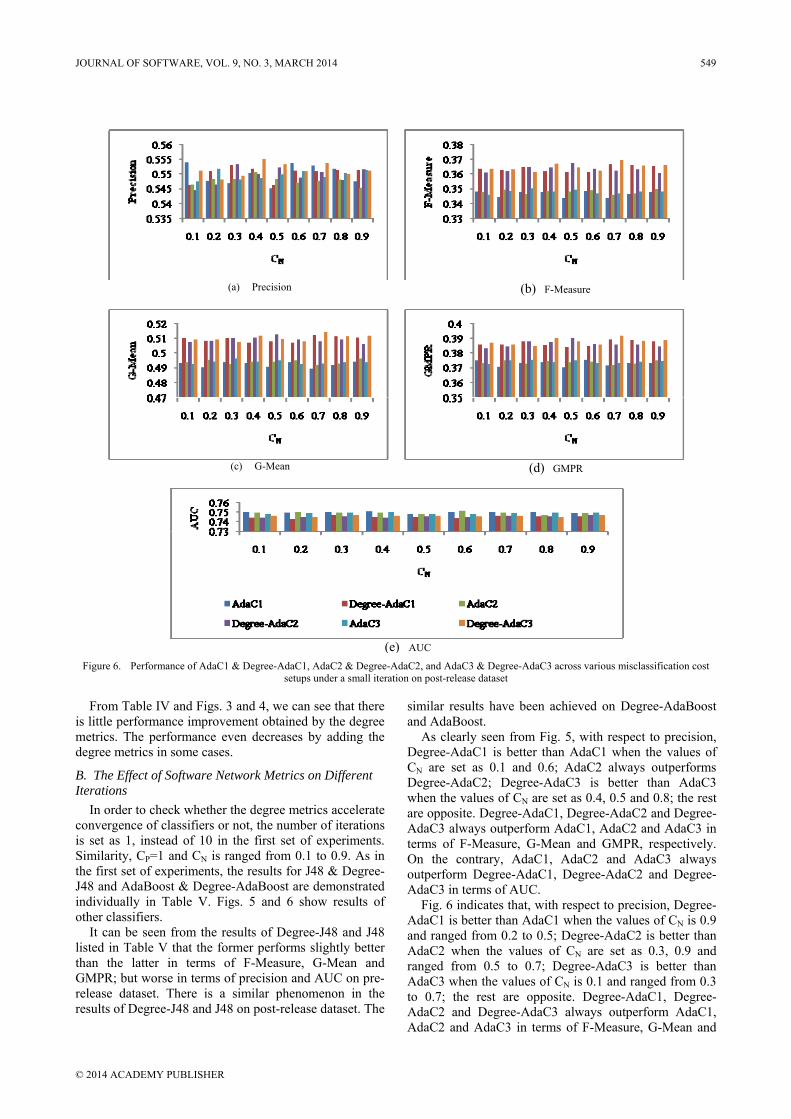
Figure 6. Performance of AdaC1 & Degree-AdaC1, AdaC2 & Degree-AdaC2, and AdaC3 & Degree-AdaC3 across various misclassification cost setups under a small iteration on post-release dataset
From Table IV and Figs. 3 and 4, we can see that there is little performance improvement obtained by the degree metrics. The performance even decreases by adding the degree metrics in some cases.
B. The Effect of Software Network Metrics on Different Iterations
In order to check whether the degree metrics accelerate convergence of classifiers or not, the number of iterations is set as 1, instead of 10 in the first set of experiments. Similarity, CP=1 and CN is ranged from 0.1 to 0.9. As in the first set of experiments, the results for J48 & Degree-J48 and AdaBoost & Degree-AdaBoost are demonstrated individually in Table V. Figs. 5 and 6 show results of other classifiers.
It can be seen from the results of Degree-J48 and J48 listed in Table V that the former performs slightly better than the latter in terms of F-Measure, G-Mean and GMPR; but worse in terms of precision and AUC on pre-release dataset. There is a similar phenomenon in the results of Degree-J48 and J48 on post-release dataset. The
similar results have been achieved on Degree-AdaBoost and AdaBoost.
As clearly seen from Fig. 5, with respect to precision, Degree-AdaC1 is better than AdaC1 when the values of CN are set as 0.1 and 0.6; AdaC2 always outperforms Degree-AdaC2; Degree-AdaC3 is better than AdaC3 when the values of CN are set as 0.4, 0.5 and 0.8; the rest are opposite. Degree-AdaC1, Degree-AdaC2 and Degree-AdaC3 always outperform AdaC1, AdaC2 and AdaC3 in terms of F-Measure, G-Mean and GMPR, respectively. On the contrary, AdaC1, AdaC2 and AdaC3 always outperform Degree-AdaC1, Degree-AdaC2 and Degree-AdaC3 in terms of AUC.
Fig. 6 indicates that, with respect to precision, Degree-AdaC1 is better than AdaC1 when the values of CN is 0.9 and ranged from 0.2 to 0.5; Degree-AdaC2 is better than AdaC2 when the values of CN are set as 0.3, 0.9 and ranged from 0.5 to 0.7; Degree-AdaC3 is better than AdaC3 when the values of CN is 0.1 and ranged from 0.3 to 0.7; the rest are opposite. Degree-AdaC1, Degree-AdaC2 and Degree-AdaC3 always outperform AdaC1, AdaC2 and AdaC3 in terms of F-Measure, G-Mean and
JOURNAL OF SOFTWARE, VOL. 9, NO. 3, MARCH 2014 549
© 2014 ACADEMY PUBLISHER
GMPR, respectively. On the contrary, AdaC1, AdaC2 and AdaC3 always outperform Degree-AdaC1, Degree-AdaC2 and Degree-AdaC3 in terms of AUC. There is exact same phenomenon in the results on pre-release dataset in Fig. 5.
The effect of the degree metrics on convergence of classifiers is minimal, as confirmed by the first set of experiments. That is to say, mixing software network metrics can’t accelerate convergence of classifiers.
C. The Effect of Software Network Metrics on Different Base Classifiers
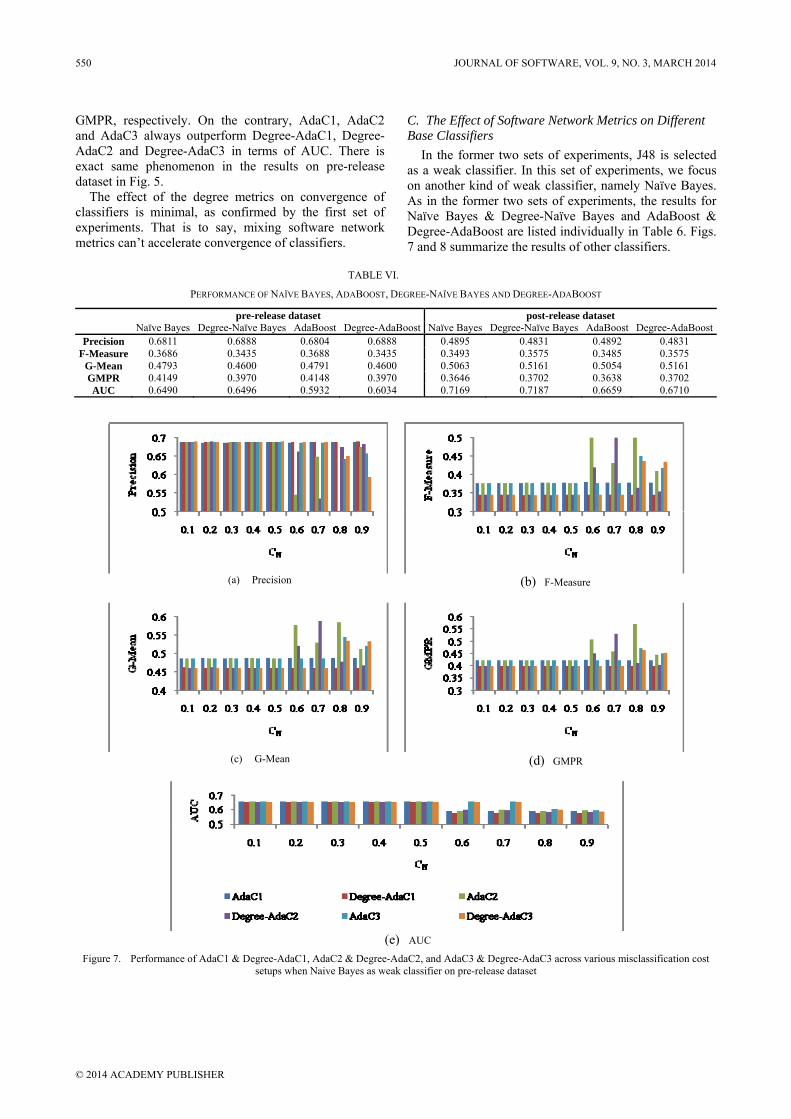
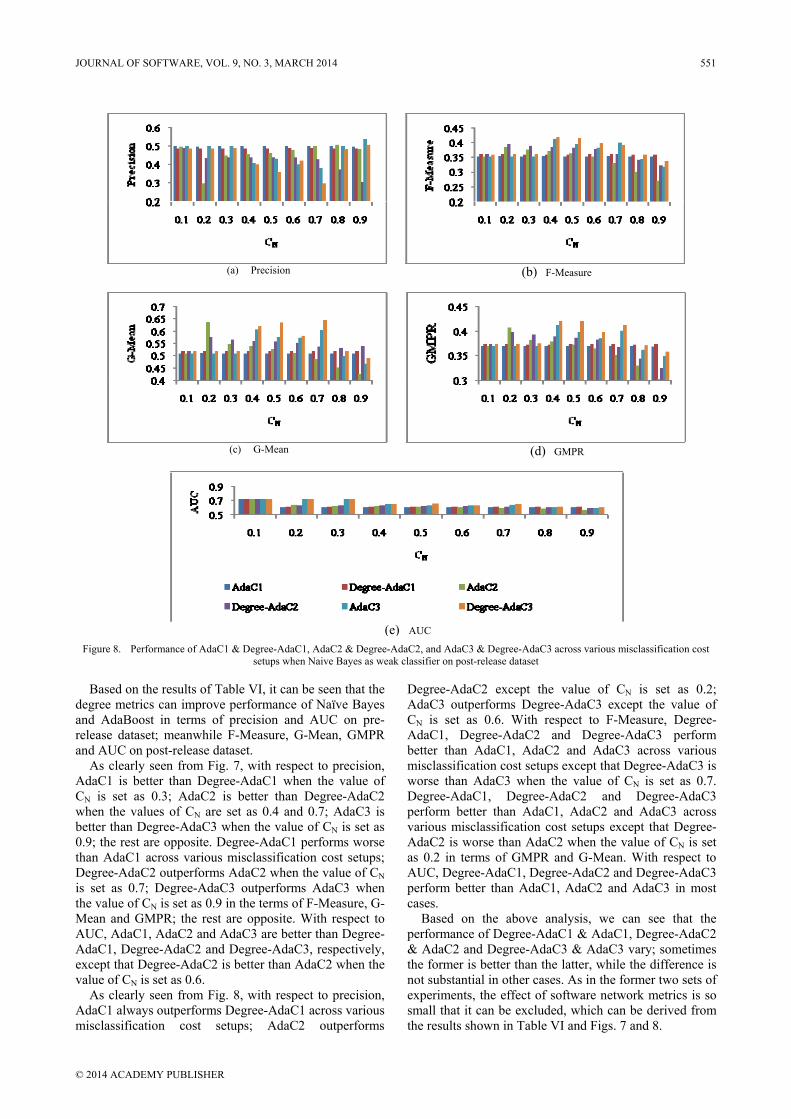
In the former two sets of experiments, J48 is selected as a weak classifier. In this set of experiments, we focus on another kind of weak classifier, namely Naïve Bayes. As in the former two sets of experiments, the results for Naïve Bayes & Degree-Naïve Bayes and AdaBoost & Degree-AdaBoost are listed individually in Table 6. Figs. 7 and 8 summarize the results of other classifiers.
TABLE VI.
PERFORMANCE OF NAÏVE BAYES, ADABOOST, DEGREE-NAÏVE BAYES AND DEGREE-ADABOOST
pre-release dataset post-release dataset Naïve Bayes Degree-Naïve Bayes AdaBoost Degree-AdaBoost Naïve Bayes Degree-Naïve Bayes AdaBoost Degree-AdaBoost
Precision 0.6811 0.6888 0.6804 0.6888 0.4895 0.4831 0.4892 0.4831 F-Measure 0.3686 0.3435 0.3688 0.3435 0.3493 0.3575 0.3485 0.3575
G-Mean 0.4793 0.4600 0.4791 0.4600 0.5063 0.5161 0.5054 0.5161 GMPR 0.4149 0.3970 0.4148 0.3970 0.3646 0.3702 0.3638 0.3702 AUC 0.6490 0.6496 0.5932 0.6034 0.7169 0.7187 0.6659 0.6710
(a) Precision
(b) F-Measure
(c) G-Mean
(d) GMPR
(e) AUC
Figure 7. Performance of AdaC1 & Degree-AdaC1, AdaC2 & Degree-AdaC2, and AdaC3 & Degree-AdaC3 across various misclassification cost setups when Naive Bayes as weak classifier on pre-release dataset
550 JOURNAL OF SOFTWARE, VOL. 9, NO. 3, MARCH 2014
© 2014 ACADEMY PUBLISHER
(a) Precision
(b) F-Measure
(c) G-Mean
(d) GMPR
(e) AUC
Figure 8. Performance of AdaC1 & Degree-AdaC1, AdaC2 & Degree-AdaC2, and AdaC3 & Degree-AdaC3 across various misclassification cost setups when Naive Bayes as weak classifier on post-release dataset
Based on the results of Table VI, it can be seen that the degree metrics can improve performance of Naïve Bayes and AdaBoost in terms of precision and AUC on pre-release dataset; meanwhile F-Measure, G-Mean, GMPR and AUC on post-release dataset.
As clearly seen from Fig. 7, with respect to precision, AdaC1 is better than Degree-AdaC1 when the value of CN is set as 0.3; AdaC2 is better than Degree-AdaC2 when the values of CN are set as 0.4 and 0.7; AdaC3 is better than Degree-AdaC3 when the value of CN is set as 0.9; the rest are opposite. Degree-AdaC1 performs worse than AdaC1 across various misclassification cost setups; Degree-AdaC2 outperforms AdaC2 when the value of CN is set as 0.7; Degree-AdaC3 outperforms AdaC3 when the value of CN is set as 0.9 in the terms of F-Measure, G-Mean and GMPR; the rest are opposite. With respect to AUC, AdaC1, AdaC2 and AdaC3 are better than Degree-AdaC1, Degree-AdaC2 and Degree-AdaC3, respectively, except that Degree-AdaC2 is better than AdaC2 when the value of CN is set as 0.6.
As clearly seen from Fig. 8, with respect to precision, AdaC1 always outperforms Degree-AdaC1 across various misclassification cost setups; AdaC2 outperforms
Degree-AdaC2 except the value of CN is set as 0.2; AdaC3 outperforms Degree-AdaC3 except the value of CN is set as 0.6. With respect to F-Measure, Degree-AdaC1, Degree-AdaC2 and Degree-AdaC3 perform better than AdaC1, AdaC2 and AdaC3 across various misclassification cost setups except that Degree-AdaC3 is worse than AdaC3 when the value of CN is set as 0.7. Degree-AdaC1, Degree-AdaC2 and Degree-AdaC3 perform better than AdaC1, AdaC2 and AdaC3 across various misclassification cost setups except that Degree-AdaC2 is worse than AdaC2 when the value of CN is set as 0.2 in terms of GMPR and G-Mean. With respect to AUC, Degree-AdaC1, Degree-AdaC2 and Degree-AdaC3 perform better than AdaC1, AdaC2 and AdaC3 in most cases.
Based on the above analysis, we can see that the performance of Degree-AdaC1 & AdaC1, Degree-AdaC2 & AdaC2 and Degree-AdaC3 & AdaC3 vary; sometimes the former is better than the latter, while the difference is not substantial in other cases. As in the former two sets of experiments, the effect of software network metrics is so small that it can be excluded, which can be derived from the results shown in Table VI and Figs. 7 and 8.
JOURNAL OF SOFTWARE, VOL. 9, NO. 3, MARCH 2014 551
© 2014 ACADEMY PUBLISHER
VII. CONCLUSIONS
This study empirically validates the influence of software network metrics to fault prediction beyond CK metrics. Three sets of experiments are conducted to analyze the effect of the degree metrics on classifiers, base classifiers, datasets, and iterations over the data from Eclipse version 2.0. Experimental results show that the degree metrics have minimal effect on overall performances of classifiers in both pre- or post-release fault prediction. This observation, as well as those confirmed by experiments reported in previous studies [8, 11], can provide some practical guidance for the research community.
Current, we just observe the experiment results on only one database. In future, we intend to investigate more on other different open source software systems.
ACKNOWLEDGMENT
This work has been partially supported by the Natural Science Foundation of China (Project No. 61163007, 61262010), Natural Science Foundation of Jiangxi (Project No. 20114BAB211019, 20132BAB201036) and Scientific Research Foundation of Jiangxi Provincial Education Department (Project No. GJJ12731, GJJ13305, GJJ12743).
REFERENCES
[1] Giulio Concas, Michele Marchesi, Sandro Pinna, and Nicola Serra, “Power-laws in a large object-oriented software system”, IEEE Transactions on Software Engineering, Vol. 33, No.10, pp.687-708, 2007.
[2] Panagiotis Louridas, Diomidis Spinellis, and Vasileios Vlachos, “Power laws in software”, ACM Transactions on Software Engineering and Methodology, Vol. 18, No.1, Article 2, 2008.
[3] Fangjun Wu, “Empirical tests of scale-free geometry in NASA data”, In Proceedings of 2nd International Conference on Advanced Measurement and Test (AMT 2011), pp. 762-767, 2011.
[4] Fangjun Wu, "Scale-free characteristic in open source software: an empirical case study", IJACT: International Journal of Advancements in Computing Technology, Vol. 5, No. 1, pp.792-799, 2013.
[5] Hui Li, Hui Zhang, Hai Zhao, and Wei Cai, “Research on structural holes and closeness of multi-granularity software networks”, Journal of Software, Vol.8, No.2, pp. 337-343, 2013.
[6] Thomas Zimmermann and Nachiappan Nagappan, “Predicting defects using network analysis on dependency graphs”, In Proceedings of 30th International Conference on Software Engineering, pp.531-540, 2008.
[7] Christian Bird, Nachiappan Nagappan, Harald Gall, Brendan Murphy, and Premkumar Devanbu, “Putting it all together: using socio-technical networks to predict failures”, In Proceedings of 20th International Symposium on Software Reliability Engineering, pp.109-119, 2009.
[8] Ayşe Tosun, Burak Turhan, and Ayşe Bener, “Validation of network measures as indicators of defective modules in software systems”, In Proceedings of 5th International Conference on Predictor Models in Software Engineering, Article No. 5, 2009.
[9] Yutao Ma, Keqing He, Bing Li, Jing Liu, and Xiaoyan Zhou, “A hybrid set of complexity metrics for large-scale object-oriented software systems”, Journal of Computer Science and Technology, Vol. 25, No.6, pp. 1184-1201, Nov. 2010.
[10] Giulio Concas, Michele Marchesi, Alessandro Murgia, and Roberto Tonelli, “An empirical study of social networks metrics in object-oriented software”, Advances in Software Engineering, Vol. 2010, Article ID 729826, January 2010.
[11] Roberto Tonelli, Giulio Concas, Michele Marchesi, and Alessandro Murgia, “An analysis of SNA metrics on the Java Qualitas Corpus”, In Proceedings of 4th India Software Engineering Conference, pp.205-213, 2011.
[12] Roberto Tonelli, and Giuseppe Destefanis, “Mixing SNA and classical software metrics for sub-projects analysis”, In Proceedings of 11th WSEAS International conference on Software Engineering, Parallel and Distributed Systems, and proceedings of 9th WSEAS International conference on Engineering Education, pp.104-109, 2012.
[13] Kewen Li, Jisong Kou, and Lina Gong, "Predicting software quality by optimized BP network based on PSO", Journal of Computers, Vol. 6, No. 1, pp.122-129, 2011.
[14] M. E. J. Newman, “The structure and function of complex networks”, SIAM Review, Vol. 45, No.2, pp. 167-256, 2003.
[15] Reka Albert and Albert-Laszlo Barabasi, “Statistical mechanics of complex networks”, Reviews of Modern Physics, Vol. 74, pp. 47-97, 2002.
[16] Gyimothy Tibor, Ferenc Rudolf, and Siket Istvan, “Empirical validation of object oriented metrics on open source software for fault prediction”, IEEE Transactions on Software Engineering, Vol.31, No.10, pp.897-910, 2005.
[17] Fangjun Wu, “Empirical validation of object-oriented metrics on NASA for fault prediction”, In Proceedings of 2011 International Conference on Computer Science and Education (CSE2011), pp. 168-175, 2011.
[18] Ian H. Witten and Eibe Frank, Data mining: practical machine learning tools and techniques, 3rd ed., San Francisco: Morgan Kaufmann, 2011.
[19] Yanmin Sun, Mohamed S. Kamel, Andrew K.C. Wong, and Yang Wang, “Cost-sensitive boosting for classification of imbalanced data”, Pattern Recognition, Vol.40, pp. 3358-3378, 2007.
[20] Yoav Freund and Robert Schapire, “A decision-theoretic generalization of on-line learning and an application to boosting”, Journal of Computer and System Sciences, Vol.55, pp. 119-139, 1997.
[21] Miroslav Kubat and Stan Matwin, “Addressing the curse of imbalanced training sets: one sided selection”, In Proceedings of 14th International Conference on Machine Learning, pp.179-186, 1997.
[22] Jin Huang and C.X. Ling, “Using AUC and accuracy in evaluating learning algorithms”, IEEE Transactions on Knowledge and Data Engineering, Vol.17, No.3, pp. 299-310, 2005.
Fangjun Wu received her Ph.D. degree in School of Information Technology at the Jiangxi University of Finance and Economics, China, in 2006. She joined this University in 2006 where she is at present Associate Professor and Associate Director of the Jiangxi Key Laboratory of Data and Knowledge Engineering, China. Dr. Wu has been a visiting scholar with Centre for Quantum Computation & Intelligent Systems (QCIS), Faculty of Engineering & IT, University of Technology Sydney (UTS), Australia from March 2012 to March 2013. Her research interests include data mining, software measurement, and complex network.
552 JOURNAL OF SOFTWARE, VOL. 9, NO. 3, MARCH 2014
© 2014 ACADEMY PUBLISHER