Embed Size (px)
Citation preview
An Acad Bras Cienc (2021) 93(1): e20190505 DOI 10.1590/0001-3765202120190505Anais da Academia Brasileira de Ciências | Annals of the Brazilian Academy of SciencesPrinted ISSN 0001-3765 I Online ISSN 1678-2690www.scielo.br/aabc | www.fb.com/aabcjournal
An Acad Bras Cienc (2021) 93(1)
Running title: COMPARATIVE ANALYSIS OF HRS AND MVCS TECHNOLOGIES
Academy Section: ENGINEERING
SCIENCES
e20190505
93 (1)93(1)
DOI10.1590/0001-3765202120190505
ENGINEERING SCIENCES
Comparative analysis of hydraulic refrigeration and mechanical vapour compression water cooling technologies in designing a technical system for oysters conservation.
MARCOS A. GARCIA, JOAQUIM M. GONÇALVES, KÁTIA C. MENDONÇA,NATHAN MENDES & LUCIANO A. MENDES
Abstract: The phenomenon of summer mortality in Pacifi c oysters cultures also occurs in Brazilian crops, with predominance in the adult phase, generating signifi cant losses for local producers. In the search for a technological solution to mitigate its effects, the mechanical vapour compression and hydraulic refrigeration concepts are evaluated as two proposed cooling technologies. The comparative analysis carried out with numeric simulations indicated that the hydraulic cooling system presents disadvantages regarding both the size of the compression column and the energy effi ciency, compared to the mechanical vapour compression cycle. By computing only the compression power, a COP value of 6.9 results for the MVCS at TCOND = 29.5 oC and TEVAP = 7.2 oC, while for HRS the COP value is around 3.1 for identical conditions. Results from the analysis contradict former publications, but are consistent with recent fi ndings reported in literature.
Key words: cooling technologies, oyster conservation, system efficiency, hydraulic re-frigeration system.
1. INTRODUCTION
The state of Santa Catarina (Brazil) presents favorable conditions for oyster farming, characterized by an appropriate regime of sea temperatures, and the abundance of nutrients provided by the South Atlantic Central Water (SACW) stream. The species cultivated in the Santa Catarina’s coast is native to the Pacifi c Ocean, where low water temperature ranges prevail. The Pacifi c oyster adapted well to local conditions, allowing producers to harvest in less than 12 months. Although being suitable for cultivation most of the year, it is during summer that the local sea temperatures can exceed 30°C. This condition is unknown to the mollusk and induces a frenetic reproduction process
that leads to high levels of stress, heavy losses of body mass and mortality rates above 30% (Mizuta et al. 2012).
According to Berthelin et al. (2000), if the spawning process is not triggered, a substantial reduction in mortality rates can be achieved. Le Gall & Raillar (1988) present the Pacifi c Oyster as temperature driven organisms and describe its behavior when subjected to different environmental temperatures. Those hypotheses justify the synthesis of a technological solution for this purpose, a process that can benefit from product development methodologies. Informational and conceptual design phases (Back et al. 2008) were carried out for this research and have indicated that a feasible solution will involve refrigeration in cultivation
MARCOS A. GARCIA et al. COMPARATIVE ANALYSIS OF HRS AND MVCS TECHNOLOGIES
An Acad Bras Cienc (2021) 93(1) e20190505 2 | 14
tanks. Two cooling technologies were identified based on Brown & Domanski’s (2014) work: the mechanical vapour compression (MVCS) and the hydraulic refrigeration (HRS) systems.
The selection of the cooling technology to be adopted must take into account the project requirements, which include low environmental impact, simplicity in use and low maintenance. Since both cooling technologies are theoretically able to meet those requirements, a comparative analysis was undertaken, focused on thermodynamics and energy efficiency. Section 2 describes the aforementioned cooling technologies, and in Section 3 the mathematical/analytical models employed for the comparison
between them are presented. Section 4 presents the results which are discussed in Section 5.
2. DESCRIPTION OF PROPOSED COOLING TECHNOLOGIES
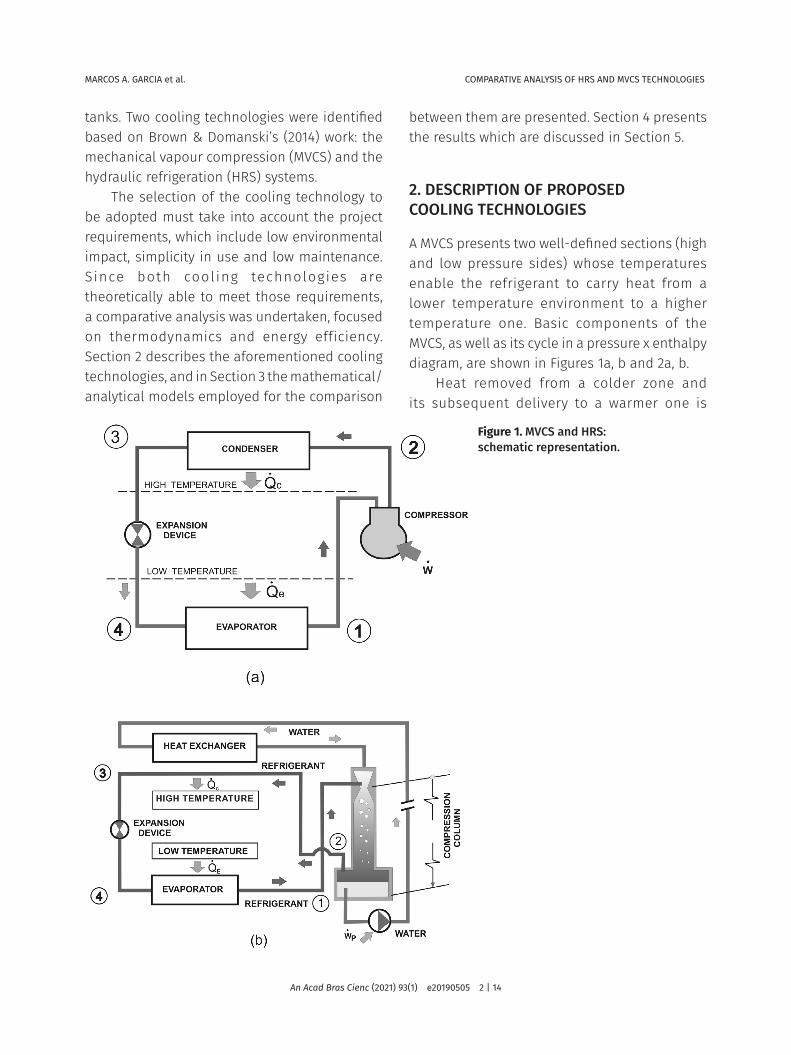
A MVCS presents two well-defined sections (high and low pressure sides) whose temperatures enable the refrigerant to carry heat from a lower temperature environment to a higher temperature one. Basic components of the MVCS, as well as its cycle in a pressure x enthalpy diagram, are shown in Figures 1a, b and 2a, b.
Heat removed from a colder zone and its subsequent delivery to a warmer one is
Figure 1. MVCS and HRS: schematic representation.
MARCOS A. GARCIA et al. COMPARATIVE ANALYSIS OF HRS AND MVCS TECHNOLOGIES
An Acad Bras Cienc (2021) 93(1) e20190505 3 | 14
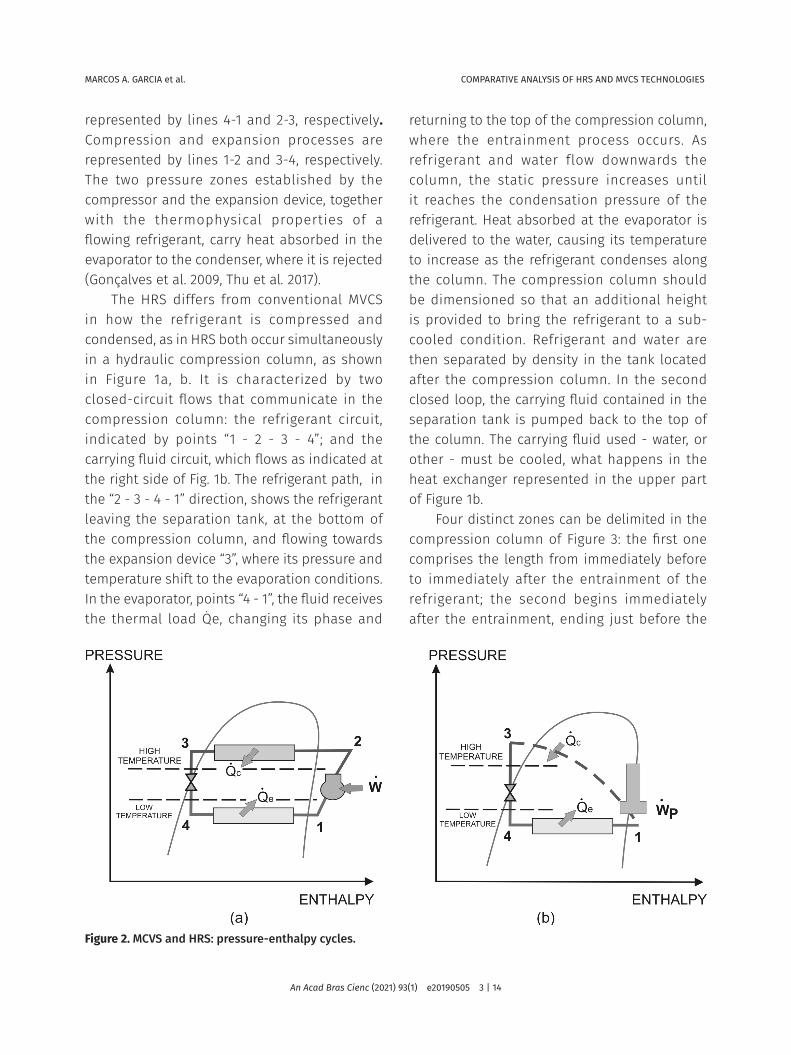
represented by lines 4-1 and 2-3, respectively. Compression and expansion processes are represented by lines 1-2 and 3-4, respectively. The two pressure zones established by the compressor and the expansion device, together with the thermophysical properties of a flowing refrigerant, carry heat absorbed in the evaporator to the condenser, where it is rejected (Gonçalves et al. 2009, Thu et al. 2017).
The HRS differs from conventional MVCS in how the refrigerant is compressed and condensed, as in HRS both occur simultaneously in a hydraulic compression column, as shown in Figure 1a, b. It is characterized by two closed-circuit flows that communicate in the compression column: the refrigerant circuit, indicated by points “1 - 2 - 3 - 4”; and the carrying fluid circuit, which flows as indicated at the right side of Fig. 1b. The refrigerant path, in the “2 - 3 - 4 - 1” direction, shows the refrigerant leaving the separation tank, at the bottom of the compression column, and flowing towards the expansion device “3”, where its pressure and temperature shift to the evaporation conditions. In the evaporator, points “4 - 1”, the fluid receives the thermal load Q̇e, changing its phase and
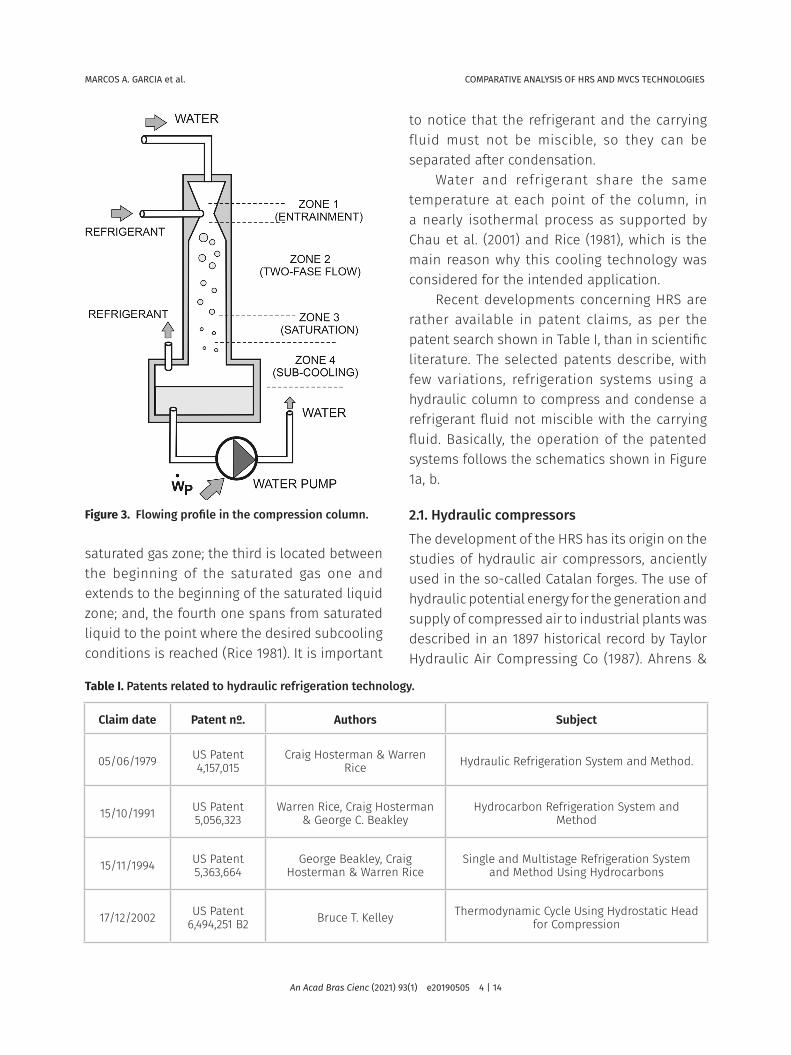
returning to the top of the compression column, where the entrainment process occurs. As refrigerant and water flow downwards the column, the static pressure increases until it reaches the condensation pressure of the refrigerant. Heat absorbed at the evaporator is delivered to the water, causing its temperature to increase as the refrigerant condenses along the column. The compression column should be dimensioned so that an additional height is provided to bring the refrigerant to a sub-cooled condition. Refrigerant and water are then separated by density in the tank located after the compression column. In the second closed loop, the carrying fluid contained in the separation tank is pumped back to the top of the column. The carrying fluid used - water, or other - must be cooled, what happens in the heat exchanger represented in the upper part of Figure 1b.
Four distinct zones can be delimited in the compression column of Figure 3: the first one comprises the length from immediately before to immediately after the entrainment of the refrigerant; the second begins immediately after the entrainment, ending just before the
Figure 2. MCVS and HRS: pressure-enthalpy cycles.
MARCOS A. GARCIA et al. COMPARATIVE ANALYSIS OF HRS AND MVCS TECHNOLOGIES
An Acad Bras Cienc (2021) 93(1) e20190505 4 | 14
saturated gas zone; the third is located between the beginning of the saturated gas one and extends to the beginning of the saturated liquid zone; and, the fourth one spans from saturated liquid to the point where the desired subcooling conditions is reached (Rice 1981). It is important
to notice that the refrigerant and the carrying fluid must not be miscible, so they can be separated after condensation.
Water and refrigerant share the same temperature at each point of the column, in a nearly isothermal process as supported by Chau et al. (2001) and Rice (1981), which is the main reason why this cooling technology was considered for the intended application.
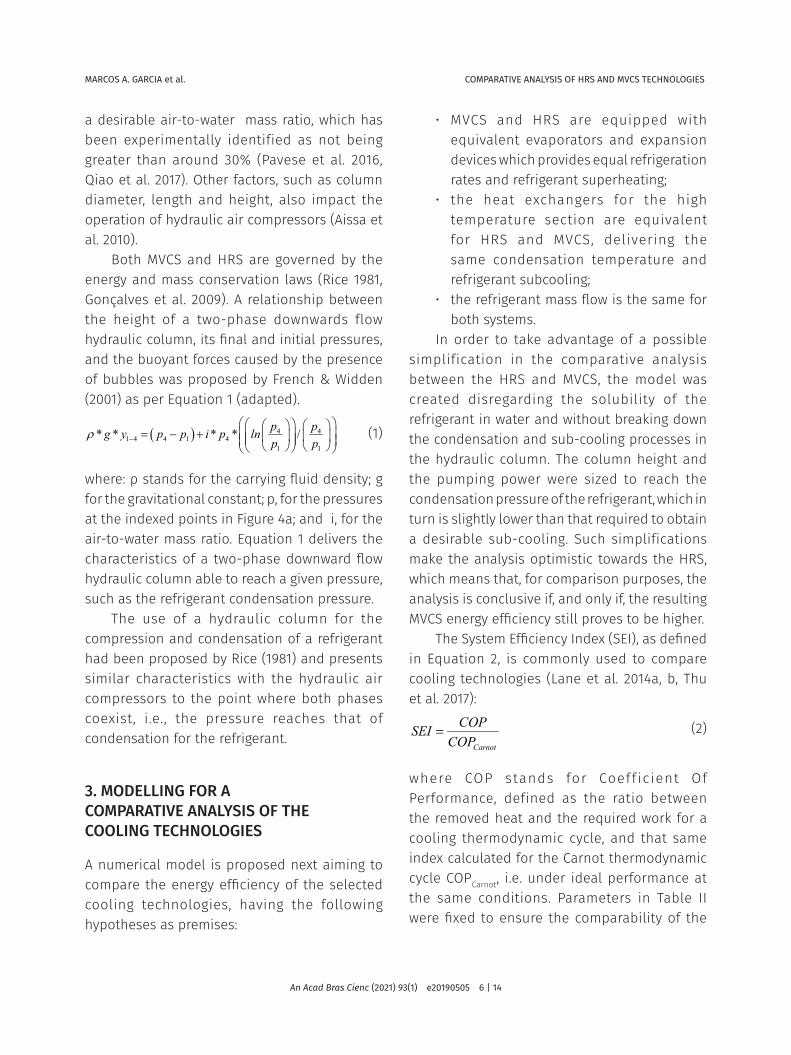
Recent developments concerning HRS are rather available in patent claims, as per the patent search shown in Table I, than in scientific literature. The selected patents describe, with few variations, refrigeration systems using a hydraulic column to compress and condense a refrigerant fluid not miscible with the carrying fluid. Basically, the operation of the patented systems follows the schematics shown in Figure 1a, b.
2.1. Hydraulic compressorsThe development of the HRS has its origin on the studies of hydraulic air compressors, anciently used in the so-called Catalan forges. The use of hydraulic potential energy for the generation and supply of compressed air to industrial plants was described in an 1897 historical record by Taylor Hydraulic Air Compressing Co (1987). Ahrens &
Table I. Patents related to hydraulic refrigeration technology.
Claim date Patent nº. Authors Subject
05/06/1979 US Patent 4,157,015
Craig Hosterman & Warren Rice Hydraulic Refrigeration System and Method.
15/10/1991 US Patent 5,056,323
Warren Rice, Craig Hosterman & George C. Beakley
Hydrocarbon Refrigeration System and Method
15/11/1994 US Patent 5,363,664
George Beakley, Craig Hosterman & Warren Rice
Single and Multistage Refrigeration System and Method Using Hydrocarbons
17/12/2002 US Patent 6,494,251 B2 Bruce T. Kelley Thermodynamic Cycle Using Hydrostatic Head
for Compression
Figure 3. Flowing profile in the compression column.

MARCOS A. GARCIA et al. COMPARATIVE ANALYSIS OF HRS AND MVCS TECHNOLOGIES
An Acad Bras Cienc (2021) 93(1) e20190505 5 | 14
Berghmans (1978) presented studies on the use of existing dams for similar purposes. The use of hydraulic potential energy was also studied for the generation of electric energy, delivering mathematical models that describe the biphasic flow in hydraulic compression columns (French & Widden 2001, Aissa et al. 2010).
Figure 4a presents a simplified scheme for the operation of a hydraulic air compressor. Mixed air and water flow continuously from tank 2 to the reservoir 4 through pipe 3; then, water only is pushed to tank 7 through pipe 5. An injector is assembled at the upper end of pipe 3 to capture air at atmospheric pressure. Pressure
in the reservoir 4 is consequent of water the level in tank 7. The levels in tanks 2 and 7 are held constant by drainage pipes 8 and 11 while pressurized air is stored in reservoir 4. Figure 4b scheme indicates the working principle for the HRS compression column highlighting its correspondence with the hydraulic compressor present in Figure.
The performance of a hydraulic compressor can be negatively affected, up to about 20%, by the solubility of air in the water (Millar 2014, Pavese et al. 2016). The characteristics of the air injector have a relevant impact on the biphasic flow as well, including its capacity to achieve
Figure 4. a, b: Schematic representation of a hydraulic air compressor.
MARCOS A. GARCIA et al. COMPARATIVE ANALYSIS OF HRS AND MVCS TECHNOLOGIES
An Acad Bras Cienc (2021) 93(1) e20190505 6 | 14
a desirable air-to-water mass ratio, which has been experimentally identified as not being greater than around 30% (Pavese et al. 2016, Qiao et al. 2017). Other factors, such as column diameter, length and height, also impact the operation of hydraulic air compressors (Aissa et al. 2010).
Both MVCS and HRS are governed by the energy and mass conservation laws (Rice 1981, Gonçalves et al. 2009). A relationship between the height of a two-phase downwards flow hydraulic column, its final and initial pressures, and the buoyant forces caused by the presence of bubbles was proposed by French & Widden (2001) as per Equation 1 (adapted).
( ) 4 41 4 4 1 4
1 1
* * * * /ρ −
= − +
p pg y p p i p lnp p
(1)
where: ρ stands for the carrying fluid density; g for the gravitational constant; p, for the pressures at the indexed points in Figure 4a; and i, for the air-to-water mass ratio. Equation 1 delivers the characteristics of a two-phase downward flow hydraulic column able to reach a given pressure, such as the refrigerant condensation pressure.
The use of a hydraulic column for the compression and condensation of a refrigerant had been proposed by Rice (1981) and presents similar characteristics with the hydraulic air compressors to the point where both phases coexist, i.e., the pressure reaches that of condensation for the refrigerant.
3. MODELLING FOR A COMPARATIVE ANALYSIS OF THE COOLING TECHNOLOGIES
A numerical model is proposed next aiming to compare the energy efficiency of the selected cooling technologies, having the following hypotheses as premises:
• MVCS and HRS are equipped with equivalent evaporators and expansion devices which provides equal refrigeration rates and refrigerant superheating;
• the heat exchangers for the high temperature section are equivalent for HRS and MVCS, delivering the same condensation temperature and refrigerant subcooling;
• the refrigerant mass flow is the same for both systems.
In order to take advantage of a possible simplification in the comparative analysis between the HRS and MVCS, the model was created disregarding the solubility of the refrigerant in water and without breaking down the condensation and sub-cooling processes in the hydraulic column. The column height and the pumping power were sized to reach the condensation pressure of the refrigerant, which in turn is slightly lower than that required to obtain a desirable sub-cooling. Such simplifications make the analysis optimistic towards the HRS, which means that, for comparison purposes, the analysis is conclusive if, and only if, the resulting MVCS energy efficiency still proves to be higher.
The System Efficiency Index (SEI), as defined in Equation 2, is commonly used to compare cooling technologies (Lane et al. 2014a, b, Thu et al. 2017):
=Carnot
COPSEICOP
(2)
where COP stands for Coefficient Of Performance, defined as the ratio between the removed heat and the required work for a cooling thermodynamic cycle, and that same index calculated for the Carnot thermodynamic cycle COPCarnot, i.e. under ideal performance at the same conditions. Parameters in Table II were fixed to ensure the comparability of the
MARCOS A. GARCIA et al. COMPARATIVE ANALYSIS OF HRS AND MVCS TECHNOLOGIES
An Acad Bras Cienc (2021) 93(1) e20190505 7 | 14
analysis for both cooling technologies strictly considering their thermodynamic cycles.
The required refrigerant mass flow rate demanded by a thermal load Q̇ is given by (3):
( )1 3
=−
Qmh h
(3)
with enthalpies indexes as per the locations labels used in Figure 2a, b.
3.1. MVCS ModelThe power for the mechanical compression system and its COP are obtained from (4) and (5):
( )2, 1
η−
=
sc
g
m h hW (4)
=
EVmec
c
QCOPW
(5)
where refrigerant enthalpies at specific points follow the curve in Figure 2a, and ηg is the overall compressor efficiency, a reference value which can be taken from catalogs.
Evaporation and condensation regimes can be approximated, with reasonable accuracy, by replacing the mass balances in the heat exchangers with correspondent subcooling and superheating conditions (Gonçalves et al. 2009, Boeng & Melo 2014).
The Carnot coefficient of performance (COPCarnot) (Gosney 1982) and the system efficiency index (SEImec) for the MVCS are calculated in (6) and (7), respectively:
( )=
−cold
Carnotwarm cold
TCOPT T
(6)
( )( )2, 1
η −=
−
g EV warm coldmec
s cold
Q T TSEI
m h h T (7)
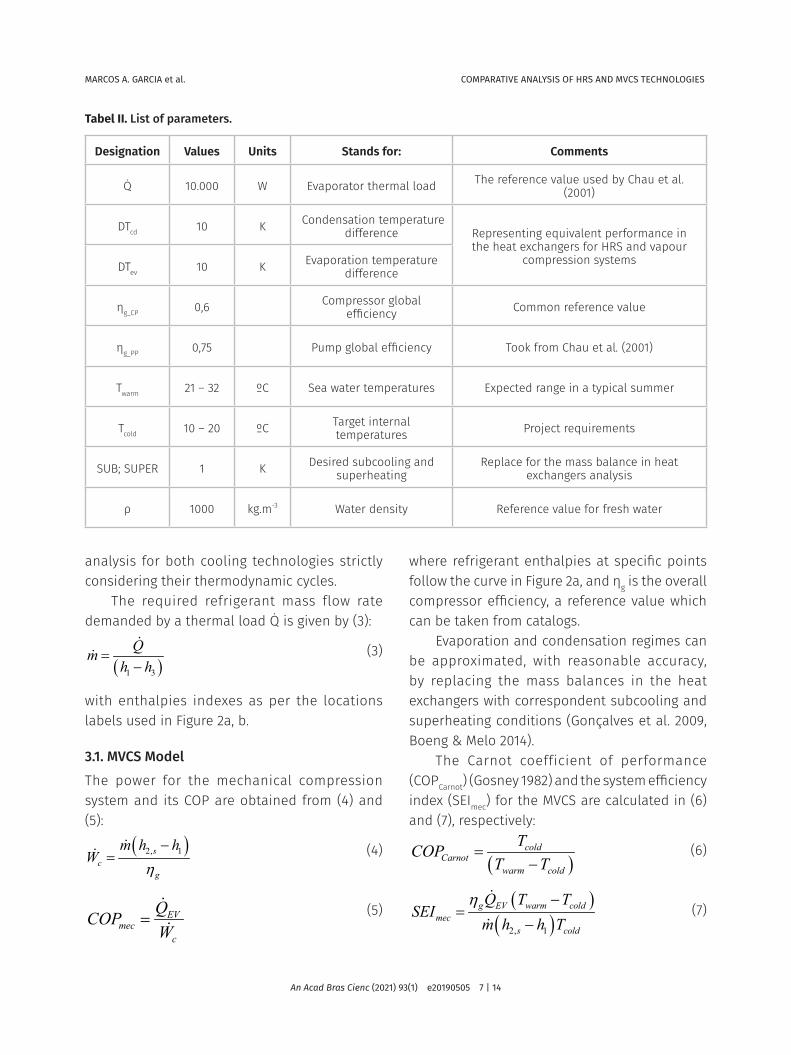
Tabel II. List of parameters.
Designation Values Units Stands for: Comments
Q̇ 10.000 W Evaporator thermal load The reference value used by Chau et al. (2001)
DTcd 10 K Condensation temperature difference Representing equivalent performance in
the heat exchangers for HRS and vapour compression systemsDTev 10 K Evaporation temperature
difference
ηg_CP 0,6 Compressor global efficiency Common reference value
ηg_PP 0,75 Pump global efficiency Took from Chau et al. (2001)
Twarm 21 – 32 ºC Sea water temperatures Expected range in a typical summer
Tcold 10 – 20 ºC Target internal temperatures Project requirements
SUB; SUPER 1 K Desired subcooling and superheating
Replace for the mass balance in heat exchangers analysis
ρ 1000 kg.m-3 Water density Reference value for fresh water

MARCOS A. GARCIA et al. COMPARATIVE ANALYSIS OF HRS AND MVCS TECHNOLOGIES
An Acad Bras Cienc (2021) 93(1) e20190505 8 | 14
The Carnot coefficient of performance (COPCarnot) is related to the temperature of the cold and warm sides as indicated in (6).
3.2. HRS ModelThe pressure difference to be provided by the pump in the compression column is calculated with (8):
( )
∆ = − +
cond
evapcol cond evap cond
cond
evap
plnp
p p p ippp
(8)
Equation 8 is derived from Equation 1. The first part of the equation represents the manometric height demanded by the operating conditions of the refrigeration system, and the second, the losses imposed by the biphasic flow. The condensation and evaporation pressures are consequent of the model parameters for the external and the refrigerated environments. The refrigerant-to-water mass ratio ’i’, was taken from literature and has an upper limit of around 30% (Rice 1981, French & Widden 2001, Aissa et
al. 2010) a threshold with bubble size effects in the flow stream.
The pump power and the column height are obtained by:
( ) 11η
− ∆=
colp
p
i mv PWi
(9)
ρ∆
= colcol
pHg (10)
where: v1 stands for the specific volume of the refrigerant at the inlet of the compression column, as per Figures 1b and 2b; the overall pump efficiency, ηP, is obtained from catalogs; g stands for the gravitational constant; and, ρ for the water density.
The coefficient of performance (COP) and the system efficiency index (SEI) for the HRS are calculated by (10) and (11):
=
evhrs
p
QCOPW
(11)
( )( ) 11 *η −
=− ∆
p ev warm coldhrs
col cold
i Q T TSEI
i m v P T
(12)
Figure 5. COP for HRS and MVCS.
MARCOS A. GARCIA et al. COMPARATIVE ANALYSIS OF HRS AND MVCS TECHNOLOGIES
An Acad Bras Cienc (2021) 93(1) e20190505 9 | 14
The modeling equations for both the HRS and MVCS were simultaneously solved, together with the refrigerant’s thermophysical properties (see Appendix I), in the EES - Engineering Equation Solver computing environment (Klein & Alvarado 2004).
4. RESULTS
Figure 5 presents the COP index for the hydraulic and mechanical compression systems for three selected refrigerants (Chemours 2019). The R-114 alternative was considered to provide
a comparison between the obtained results for the mechanical compression system of vapors with those reported for the HRS in the Rice (1981) seminal article. N-butane and iso-butane refrigerants were chosen due to their characteristic of being not miscible in water and, in accordance with the global search for environmentally friendly alternatives, because they are alternatives with zero ozone depletion potential.
The superiority of the MVCS technology over HRS regarding energy efficiency is considerable.
Simulations were run with cold side temperature (TCOLD) set at 10°C. The value for ‘i’ was set at 0.25, in accordance with Chau et al. (2001). Temperature difference between the refrigerant and the external environment was set at 10°C for both evaporation (DTEV) and condensation (DTCD) parameters. The established thermal load in the evaporator (QEV) is 10 kW. Thermophysical properties were calculated point-to-point for the three proposed refrigerants: n-butane, iso-butane and R-114. Global efficiency of the compressor and of the pump were set
Table III. Energy efficiency for external environment at 30°C.
TCOLD = 10° C
R114 R600a R600
COPHRS 0.64 0.71 0.70
MVCS 3.33 3.36 3.42
SEIHRS 0.04 0.05 0.05
MVCS 0.24 0.24 0.24
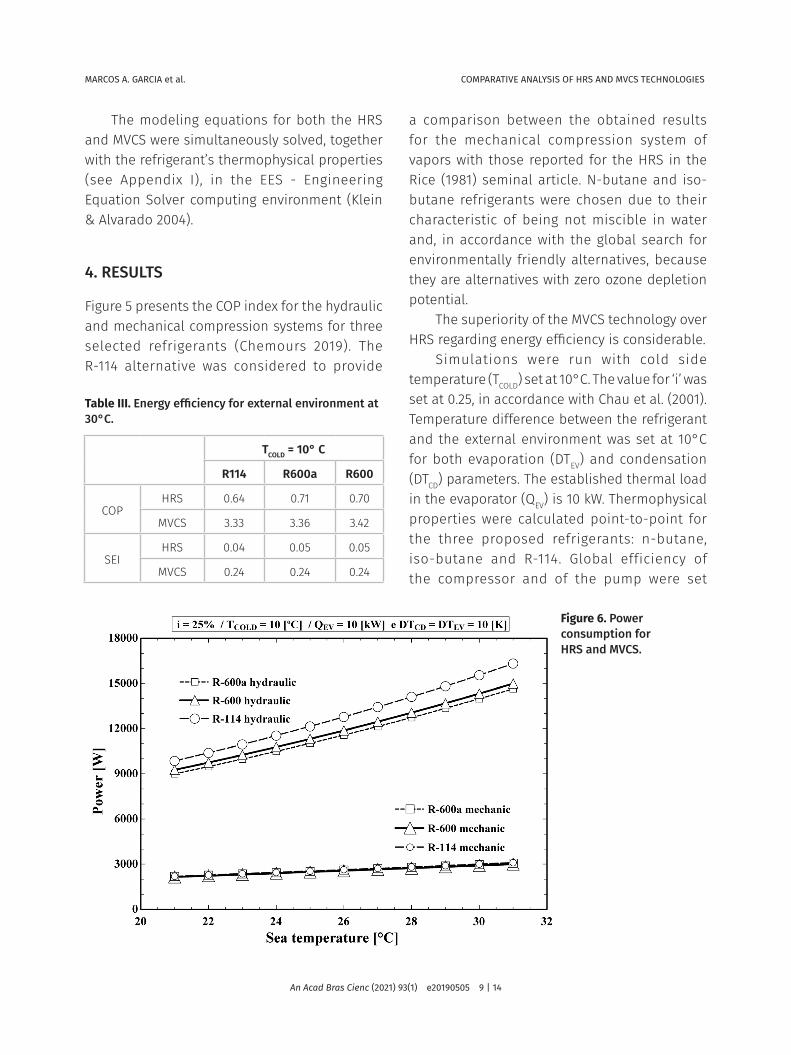
Figure 6. Power consumption for HRS and MVCS.
MARCOS A. GARCIA et al. COMPARATIVE ANALYSIS OF HRS AND MVCS TECHNOLOGIES
An Acad Bras Cienc (2021) 93(1) e20190505 10 | 14
respectively at 60%, from catalogs (EMBRACO 2019), and 75%, following Chau et al. (2001).
As can be seen in Figure 5, resulting energy performance for the HRS is much lower than that for an equivalent MVCS. Figure 5 also shows that the impact of the refrigerant on the COP of both systems is negligible, while the impact of the cold side temperature is relevant (COP decreases as temperature difference between the evaporator and the condenser increases).
As indicated in Table III, the COP and SEI for an HRS operating in conditions identical to those of Figure 5, and for a condensation temperature of 40°C (project specification for the oyster crop application), are around 1/4 of the values found for an equivalent MVCS at 10°C (TCOLD = 20° C) evaporating temperature. The calculated efficiency for the HRS confirms the reference values from Brown & Domanski’s (2014) work. As for the mechanical compression system, the efficiency is compatible to that presented by Thu et al. (2017) for similar temperature ranges.
Figure 6 shows the higher power consumption of the HRS when compared to that of the MVCS for sea temperatures (TWARM) varying in the 20-32°C range.
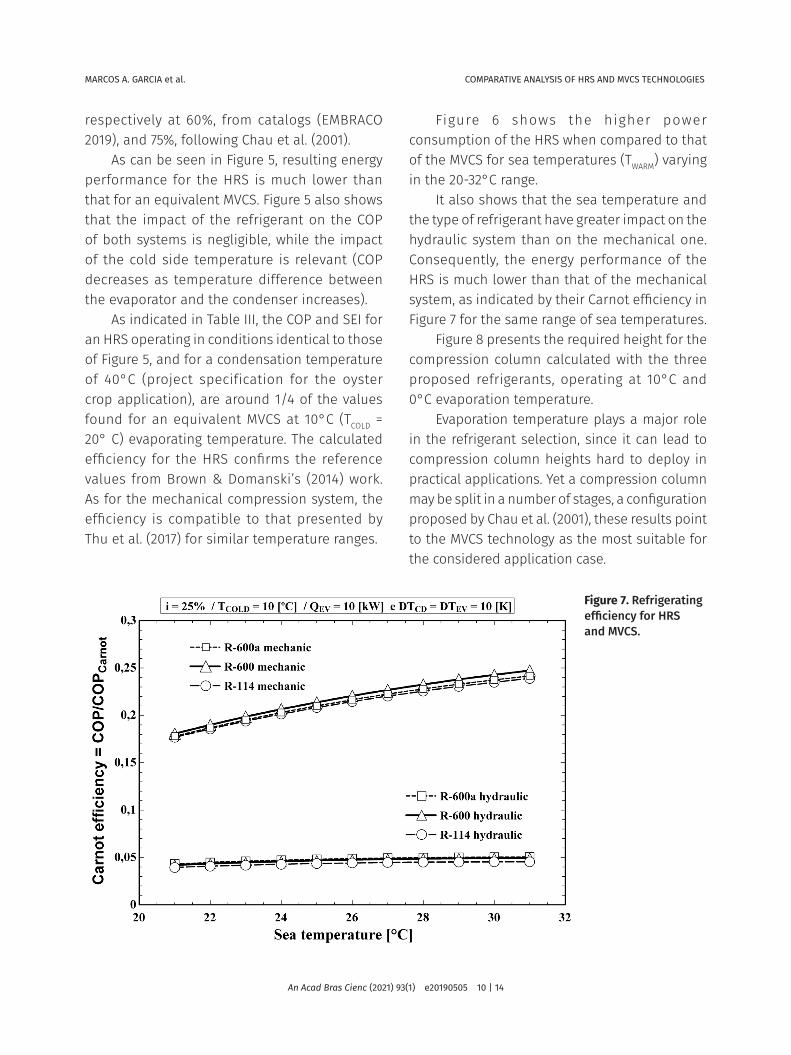
It also shows that the sea temperature and the type of refrigerant have greater impact on the hydraulic system than on the mechanical one. Consequently, the energy performance of the HRS is much lower than that of the mechanical system, as indicated by their Carnot efficiency in Figure 7 for the same range of sea temperatures.
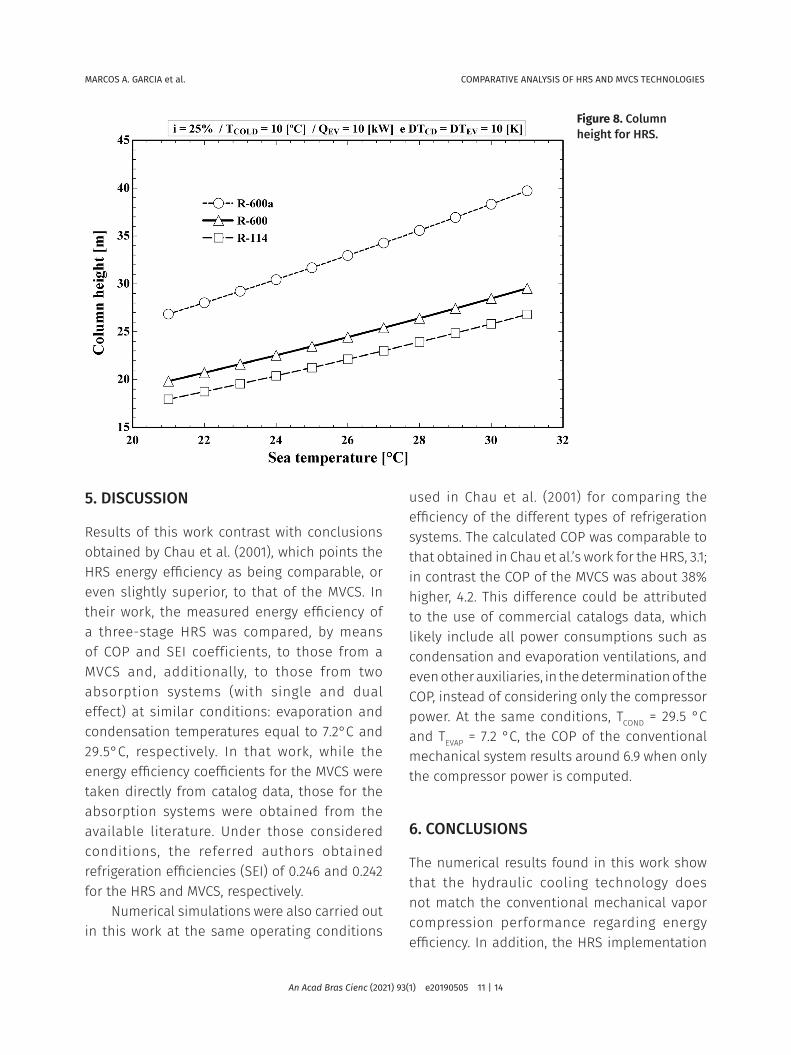
Figure 8 presents the required height for the compression column calculated with the three proposed refrigerants, operating at 10°C and 0°C evaporation temperature.
Evaporation temperature plays a major role in the refrigerant selection, since it can lead to compression column heights hard to deploy in practical applications. Yet a compression column may be split in a number of stages, a configuration proposed by Chau et al. (2001), these results point to the MVCS technology as the most suitable for the considered application case.
Figure 7. Refrigerating efficiency for HRS and MVCS.
MARCOS A. GARCIA et al. COMPARATIVE ANALYSIS OF HRS AND MVCS TECHNOLOGIES
An Acad Bras Cienc (2021) 93(1) e20190505 11 | 14
5. DISCUSSION
Results of this work contrast with conclusions obtained by Chau et al. (2001), which points the HRS energy efficiency as being comparable, or even slightly superior, to that of the MVCS. In their work, the measured energy efficiency of a three-stage HRS was compared, by means of COP and SEI coefficients, to those from a MVCS and, additionally, to those from two absorption systems (with single and dual effect) at similar conditions: evaporation and condensation temperatures equal to 7.2°C and 29.5°C, respectively. In that work, while the energy efficiency coefficients for the MVCS were taken directly from catalog data, those for the absorption systems were obtained from the available literature. Under those considered conditions, the referred authors obtained refrigeration efficiencies (SEI) of 0.246 and 0.242 for the HRS and MVCS, respectively.
Numerical simulations were also carried out in this work at the same operating conditions
used in Chau et al. (2001) for comparing the efficiency of the different types of refrigeration systems. The calculated COP was comparable to that obtained in Chau et al.’s work for the HRS, 3.1; in contrast the COP of the MVCS was about 38% higher, 4.2. This difference could be attributed to the use of commercial catalogs data, which likely include all power consumptions such as condensation and evaporation ventilations, and even other auxiliaries, in the determination of the COP, instead of considering only the compressor power. At the same conditions, TCOND = 29.5 °C and TEVAP = 7.2 °C, the COP of the conventional mechanical system results around 6.9 when only the compressor power is computed.
6. CONCLUSIONS
The numerical results found in this work show that the hydraulic cooling technology does not match the conventional mechanical vapor compression performance regarding energy efficiency. In addition, the HRS implementation
Figure 8. Column height for HRS.

MARCOS A. GARCIA et al. COMPARATIVE ANALYSIS OF HRS AND MVCS TECHNOLOGIES
An Acad Bras Cienc (2021) 93(1) e20190505 12 | 14
implies very unfavorable final dimensions for the compression column, even when considering multiple stages.
Computing only the compression power leads to a COP value of 6.9 for the MVCS at TCOND = 29.5 °C and TEVAP = 7.2 °C, instead of the 3.05 presented by Chau et al. (2001), and leads in turn to a different conclusion regarding the equivalence of both systems in terms of energy efficiency. Attention must then be paid to the adoption of a HRS as a cooling technology comparable to a conventional mechanical system.
Our findings for the mechanical and hydraulic systems are consistent to those from Brown & Domanski (2014). They do differ, however, of those from Chau et al. (2001); by stating the energy efficiencies of the two systems to be comparable those authors assumed a possible optimistic view towards the HRS, resulting from the direct comparison of HRS performance with catalog data for the conventional MVCS.
AcknowledgmentsThis research was partially supported by (CAPES) ‘Coordenação de Aperfeiçoamento de Pessoal de Nível Superior’, financing code 001.
REFERENCES
AHRENS FH & BERGHMANS JA. 1978. Preliminary evaluation of the use of hydraulic air compressors in water-compensated reservoir compressed air storage power plants. In: Compressed Air Energy Storage Technology Symposium. CAES 1: 1-26.
AISSA WA, MOHAMED SA & AHMED KA. 2010. Performance analysis of low-head hydraulic air compressor. SGRE 1: 15-24. DOI:10.4236/sgre.2010.11003.
BACK N, DIAS A, OGLIARI A & SILVA JC. 2008. Projeto Integrado de Produtos: planejamento, concepção e modelagem. 3rd ed., Barueri: Ed. Manole, 601 p. ISBN: 9788520422083.
BERTHELIN C, KELLNER K & MATHIEU M. 2000. Storage metabolism in the Pacific oyster (Crassotrea gigas) in relation to summer mortalities and reproductive cycle (West Coast of France). CBP Part B 125: 359-369.
BOENG J & MELO C. 2014. Mapping the energy consumption of household refrigerators by varying the refrigerant
Nomenclature
Roman Greeck
Q cooling capacity, W ρ density, kg.m-3
W power, W η efficiency, dimensionless
COP coefficient of performance, dimensionless
g gravitational constant, m.s-2 Subscripts
h enthalpy, J.kg-1 c compressor
i ratio of air to water, dimensionless col column
ṁ mass flow, kg.s-1 cond condensation
p pressure, kg.m-1.s-2 EV evaporator
SEI system efficiency index, dimensionless evap evaporation
T temperature, C g global
v specific volume, m³.kg-1 mec mechanical
y height, m numbers reference positions
Q cooling capacity, W p pump
H height, m s isentropic
MARCOS A. GARCIA et al. COMPARATIVE ANALYSIS OF HRS AND MVCS TECHNOLOGIES
An Acad Bras Cienc (2021) 93(1) e20190505 13 | 14
charge and the expansion restriction. Int J Refrig 41: 37-44. http://dx.doi.org/10.1016/j.ijrefrig.2013.06.005.
BROWN JS & DOMANSKI PA. 2014 Review of alternative cooling technologies. Appl Therm Eng 64: 252-262. http://dx.doi.org/10.1016/j.applthermaleng.2013.12.014.
CHAU DS, RICE W, PHELAN PE, WHITFIELD KL & WOOD BD. 2001 Experimental results for a hydraulic refrigeration system using n-butane. Int J Refrig. 24: 325-337. DOI: 0140-7007/01/
CHEMOURS CO. 2019. Freon Refrigerants. Available in: https://www.chemours.com/Refrigerants/en_US/products/Freon/# . Accessed in: 28/01/2019.
EMBRACO. 2019. Products and applications. Available in: http://www.embraco.com/Default.aspx?m1=productsAplications&sel=id0&tabid=165. Accessed in: 28/01/2019.
FRENCH MJ & WIDDEN MB. 2001. The exploitation of low-head hydropower by pressure interchange with air, using siphons. In: Proceedings of the Institution of Mechanical Engineers Part A. Int J Power Energy Syst 215: 223-230. https://doi.org/10.1243/0957650011538497.
GONÇALVES JM, MELO C & HERMES CJL. 2009. A semi-empirical model for steady-state simulation of household refrigerators. Appl Therm Eng 29: 1622-1630. doi:10.1016/j.applthermaleng.2008.07.021.
GOSNEY WB. 1982. Principles of refrigeration. 1st ed., New York: Cambridge University Press, 666 p. ISBN 0 521 236711.
KLEIN SA & ALVARADO FL. 2004. EES – Engineering equation solver user’s manual. 1st ed., Midletown: F-chart Software, 860 p.
LANE AL, BENSON J, ERIKSON L, FAHLÉN P, NORDMAN R, STIGNOR CH, BERGLÖF K & HUNDY G. 2014a. Method and guidelines to establish System Efficiency Index during field measurements on air conditioning and heat pump systems. 1st ed., SP RISI, 76 p. ISSN 0284-5172.
LANE AL, BENSON J, HUNDY G & BERGLÖF K. 2014b. System efficiency index. SEI, a key performance indicator for field measurements of refrigeration, air conditioning and heat pump systems. In: 3rd IIR International Conference on Sustainability and the Cold Chain, p. 695-702. URN: urn:nbn:se:ri:diva-12385.
LE GALL JL & RAILLAR O. 1988. Influence de la temperature sur la physiologie de l’huitre Crassostrea gigas. Océanis 14(5): 603-608.
MILLAR DL. 2014. A review of the case for modern-day adoption of hydraulic air compressors. Appl Therm Eng 69: 55-77. http://dx.doi.org/10.1016/j.applthermaleng.2014.04.008.
MIZUTA DD, SILVEIRA JRN, FISCHER CE & LEMOS D. 2012. Interannual variation in commercial oyster (Crassostrea gigas) farming in the sea (Florianópolis, Brazil, 27°44’ S; 48°33’ W) in relation to temperature, chlorophyll a and associated oceanographic conditions. Aquaculture 366-367: 105-114. https://doi.org/10.1016/j.aquaculture.2012.09.011.
PAVESE V, MILLAR DL & VERDA V. 2016. Mechanical efficiency of hydraulic air compressors. J Energy Resour Technol 138(6): 11 p. DOI: 10.1115/1.4033623.
QIAO S, MENA D & KIM S. 2017. Inlet effects on vertical-downward air-water two phase flow. Nuc Eng Des 312: 375-388. Disponível em http://dx.doi.org/10.1016/j.nucengdes.2016.04.033.
RICE W. 1981. Calculated characteristics of a hydraulic refrigeration system. J Energy. 5(6): 323-330. DOI: 10.2514/3.62549.
TAYLOR CO. 1897. Illustrated description of the Taylor Hydraulic Air Compressor and Transmition of Power by Compressed Air. Montreal: Taylor Hydraulic Air Compressing Co. 24 p. Available i n : h t t p s : //a rc h i v e .o rg /d e ta i l s / I l l u s t ra te d DescriptionOfTheTaylorHydraulicAirCompressor AndTransmission. Accessed in: 09/13/2017.
THU K, SATHTHASIVAN J, SAHA BB, CHA KJ, MURTHY SS & CHON K. 2017. Experimental investigation of a mechanical vapour compression chiller at elevated chilled water temperatures. Appl Therm Eng 123: 226-233. http://dx.doi.org/10.1016/j.applthermaleng.2017.05.091.
APPENDIX I
DETAILING OF THE BUILT NUMERICAL ALGORITHM
The numerical model was built to be applied under the EES - Engineering Equation Solver computing environment (Klein & Alvarado 2004). It is also based on the equations described in Section 3 of this paper and according to the logic described below:
First block - input parameters:• - Volumetric fraction of steam to water (i) • - Applied refrigerant;
MARCOS A. GARCIA et al. COMPARATIVE ANALYSIS OF HRS AND MVCS TECHNOLOGIES
An Acad Bras Cienc (2021) 93(1) e20190505 14 | 14
• - Gravitational constant;• - Water density (ρ);• - Temperatures for the warm and cold
sides (Twarm, Tcold);• - Thermal load Q̇;• - Temperature differences between the
hot and cold sides and condensation and evaporation temperatures, respectively;
• - Compressor and hydraulic pump efficiencies (ηg, ηP);
Second block - Calculation of the thermo physical properties of the refrigerant:
• - Evaporation and condensation pressures;
• - Specific enthalpies as per the indexed points in Figure 2;
• - Entropy in point 2 of Figure 2a;• - Specific volumes as per the indexed
points in Figure 2.
Third block - Calculation of the output variables:
• - Refrigerant mass flow, Equation 3;• - Compressor power, Equation 4;• - COP for the mechanical system, Equation
5;• - Carnot’s COP, Equation 6;• - SEI for the mechanical system, Equation
7;• - Manometric height of the hydraulic
column, Equation 8;• - Pump power, Equation 9;• - Physical height of the hydraulic column,
Equation 10;• - COP for the HRS, Equation 11;• - SEI for the HRS, Equation 12.• The equations are simultaneously
solved, together with the point-to-point estimated thermo physical properties of the refrigerant.
How to citeGARCIA MA, GONÇALVES JM, MENDONÇA KC, MENDES N & MENDES LA. 2021. Comparative analysis of hydraulic refrigeration and mechanical vapour compression water cooling technologies in designing a technical system for oysters conservation. An Acad Bras Cienc 93: e20190505. DOI 10.1590/0001-3765202120190505.
Manuscript received on April 29, 2019;accepted for publication on February 10, 2020.
MARCOS A. GARCIA1,2 https://orcid.org/0000-0002-8562-6971
JOAQUIM M. GONÇALVES1 https://orcid.org/0000-0003-2778-6130
KÁTIA C. MENDONÇA3 https://orcid.org/0000-0002-2723-6983
NATHAN MENDES2 https://orcid.org/0000-0002-8862-9748
LUCIANO A. MENDES2 https://orcid.org/0000-0002-2435-6592
¹Instituto Federal de Santa Catarina, Departamento de Refrigeração e Climatização, Rua José Lino Kretzer, 608, Praia Comprida, 88103-310 São José, SC, Brazil
²Pontifícia Universidade Católica do Paraná, Rua Imaculada Conceição, 1155, Morro do Estado, 80215-901 Curitiba, PR, Brazil
³CESI Ecole d’Ingénieurs – LINEACT CESI, 8 rue Isabelle Autissier, 17140 Lagord, France
Correspondence to: Marcos Antonio Garcia E-mail: [email protected]
Author contributionsMarcos Antonio Garcia and Joaquim Manoel Gonçalves designed the model and the computational framework and analyzed the data. Marcos Antonio Garcia and Joaquim Manoel Gonçalves carried out the implementation. Kátia Cordeiro Mendonça performed the calculations. Marcos Antonio Garcia e Kátia Cordeiro Mendonça wrote the manuscript with input from all authors. Luciano Antonio Mendes and Nathan Mendes conceived the study and were in charge of overall direction and planning.