Embed Size (px)
Citation preview
Jens Newig, Ana Adzersen, Edward Challies, Oliver Fritsch, Nicolas Jager
Comparative analysis of public environmental decision-making processes − a variable-based analytical scheme
Discussion Paper No. 37 / 13
Institute for Environmental and Sustainability Communication Research Group Governance, Participation and Sustainability
2
Institute for Environmental and Sustainability Communiucation (INFU)
Leuphana University Lüneburg Scharnhorststr. 1 21335 Lüneburg Germany www.leuphana.de/infu
Jens Newig, Ana Adzersen, Edward Challies, Oliver Fritsch and Nicolas Jager: Comparative analysis of public environmental decision-making processes − a variable-based analytical scheme INFU Discussion Paper 37 / 13 INFU-Diskussionsbeiträge 37 / 13 ISSN 1436-4202 Edited by Gerd Michelsen, Marco Rieckmann and Maik Adomßent. Available at http://www.leuphana.de/institute/infu/publikationen-vortraege/infu-reihe.html. Jens Newig, Ana Adzersen, Edward Challies and Nicolas Jager are affiliated with Leuphana University Lüneburg. Oliver Fritsch is affiliated with the University of Exeter, UK. Copyright remains with the author(s). Cover photos courtesy of Jens Newig (left and middle), and Julia Pawlowska (right). Please direct correspondance to Jens Newig, [email protected]. Published online on 20 February 2013. INFU Discussion Papers aim to disseminate empirical and conceptual research outputs of work in progress in order to foster the early exchange of ideas and stimulate academic debate.
3
Contents
PART ONE: INTRODUCTION .......................................................................................................... 4
Why an analytical scheme? ............................................................................................................................ 4
Scope and applicability of SCAPE ................................................................................................................. 5
The specifics of SCAPE ................................................................................................................................. 6
PART TWO: THE ANALYTICAL SCHEME (CODE BOOK) .................................................................... 9
General coding guidelines .............................................................................................................................. 9
Glossary of key terms ................................................................................................................................... 10
Guidelines for specific groups of variables ................................................................................................ 12
Guidelines and information for specific sections ...................................................................................... 12
Key abbreviations and symbols ................................................................................................................... 14
List of scales used / NIL and -99 peculiarities ............................................................................................ 15
A. GENERAL INFORMATION ........................................................................................................................ 16
B. CONTEXT ................................................................................................................................................... 18
B.I POLICY SPACE ................................................................................................................................... 18 B.I.1 Policy environment ...................................................................................................................... 18 B.I.2 Multi-level and spatial aspects .................................................................................................... 20 B.I.3 Societal environment .................................................................................................................. 21
B.II ENVIRONMENTAL ISSUE ................................................................................................................. 22 B.III STAKEHOLDER CHARACTERISTICS ............................................................................................. 27
C. PROCESS ................................................................................................................................................... 31
C.I PROCESS DESIGN ............................................................................................................................ 31 C.I.1 Rationales and goals of the process .......................................................................................... 31 C.I.2 Process design characteristics ................................................................................................... 35
C.II ACTUAL PROCESS .......................................................................................................................... 38 C.II.1 Role of the competent authority ................................................................................................. 38 C.II.2 Actor characteristics .................................................................................................................. 39 C.II.3 Process characteristics .............................................................................................................. 43
D. RESULTS .................................................................................................................................................... 46
D.I SUBSTANTIVE OUTPUT ................................................................................................................... 46 D.I.1 Environmental and sustainability-related output ......................................................................... 46 D.I.2 Information and learning ............................................................................................................. 50
D.II SOCIAL OUTCOMES ........................................................................................................................ 51 D.II.1 Acceptance of output ................................................................................................................. 51 D.II.2 Capacity building ....................................................................................................................... 52 D.II.3 Other .......................................................................................................................................... 53
E. CAUSAL HYPOTHESES ........................................................................................................................... 58 E.I.1 Participation produces outputs with higher environmental standards ........................................ 59 E.I.2 Participation produces outputs with lower environmental standards .......................................... 61 E.II.1 Participation fosters implementation capacity and acceptance of decisions .............................. 61 E.II.2 Participation fosters opposition to decisions ............................................................................... 63
References ..................................................................................................................................................... 64

4
PART ONE: INTRODUCTION
Jens Newig, Edward Challies, Nicolas Jager
Why an analytical scheme?
Research on public environmental decision-making is proliferating. Yet, consolidated knowledge
on how different forms of governance work, and what outcomes they produce in different contexts
is still rare. There is certainly no consensus among researchers as to whether public participation,
collaborative management, network governance or classical public management will do the best
job in any given case. Instead, current knowledge rests largely on independent, scattered small-n
case study analyses. Thousands of such case studies have been carried out and published in
various forms, ranging from doctoral dissertations and conference proceedings to journal articles,
book chapters, and whole volumes. Each of these is written from a different perspective, using
different methods, gathering different kinds of data in order to respond to different research ques-
tions. How might this huge pool of knowledge be tapped to derive consolidated evidence on the
mechanisms of public environmental decision-making?
At least three strategies lend themselves to this task: (1) multi-case comparative case, (2) meta-
analyses, and (3) individual case studies carried out according to a standardised protocol.
(1) Multi-case comparative studies have a long tradition. Using a common analytical frame-
work, they allow for a higher degree of generalisation than single case studies while at the
same time providing for considerable analytical depth (Yin & Heald 1975; George & Ben-
nett 2005). A few larger multi- case studies are available (e.g. Bingham 1986; Chess &
Purcell 1999; Lauria & Wagner 2006). While clearly superior to single case studies in
many respects, the efforts and resources needed to carry out multi-case studies increas-
es roughly proportionally with the number of cases under study, which makes large com-
parisons feasible only in larger, well-resourced research projects.
(2) Meta-analyses (e.g. case survey) seek to integrate findings from a typically larger number
of original studies to arrive at new insights beyond the scope and findings of the original
studies. Taking the myriad of available case studies as an “intellectual goldmine awaiting
discovery” (Jensen 2001), a highly structured and systematic integration of single case
study data into a coherent analysis is undertaken via the case survey method (Yin &
Heald 1975, Larsson 1993, Newig & Fritsch 2009). Like multi-case studies, a case survey
requires a common analytical framework (code book). This is applied to a number of al-
ready published studies, producing consistent qualitative or quantitative data conducive to
further analysis via established methods. The clear advantage is to grant structured ac-
cess to a large body of research in order to answer a particular set of research questions
with relatively few resources (as no primary research is conducted). However, a particular
challenge lies in the heterogeneity of the original material. With the exception of Beierle &
Cayford (2002) and Newig & Fritsch (2009), very few case surveys have been conducted
so far in the field of public environmental decision making.
5
(3) Individual case studies using a standardised, commonly accepted analytical scheme con-
stitute a third option that has to date not been put into practice. Such an approach would
allow for easy and coherent comparison of a multitude of case studies. It would foster the
genuine cumulation of research as is common practice in (many of) the natural sciences,
but still rare in the social sciences, let alone the complex field of public multi-actor deci-
sion-making processes. Depending on the specific focus of research, not every case
study would need to apply the whole of a common research protocol. Rather, each study
would focus on those variables most relevant to the case at hand. To our knowledge, no
operable analytical scheme is publicly available today that could be used by different re-
searchers embarking on new case studies.
All of the above options crucially rely on the existence of a coherent and empirically operable
analytical scheme. In this discussion paper, we introduce and outline in detail an analytical
scheme SCAPE that has been developed over several years, that has been tested and itera-
tively refined through application to dozens of case studies, and which is currently in use for a
case survey of several hundred case studies of public environmental decision-making.
Scope and applicability of SCAPE
This is our initial contribution towards a standardised, common analytical framework to respond to
the needs outlined above. Our ‘scheme for the comparative analysis of public environmental de-
cision-making’ (SCAPE) facilitates the systematic comparison of cases of public decision-making
and serves to identify causal relationships between the characteristics of a decision-making pro-
cess and its outcomes. The framework is meant to be applicable to a wide range of public deci-
sion-making processes, focused on but not limited to environmental governance processes.
A number of conceptual frameworks are available to study (environmental) governance, the most
common and widely recognised being the Institutional Analysis and Development framework,
advanced by E. Ostrom and colleagues. Most of these, however, lack sufficient detail to be direct-
ly empirically applicable. Application then results in different research protocols that, while refer-
ring to the same conceptual framework, produce empirical data hardly suitable for comparative
analysis. SCAPE, developed through the integration of existing conceptual and empirical litera-
ture, provides the detail required in an applicable research protocol. To our knowledge, no other
comparable analytical scheme for application in the field of governance analysis is currently pub-
licly available.
SCAPE is particularly suited to the analysis of processes in the realm of environmental govern-
ance that entail different forms of citizen and interest group involvement or environmental media-
tion. It develops a clear notion of the ‘decision-making process’ as its core unit of analysis, and
provides a coherently structured set of more than 300 items covering:
contextual conditions (section B) such as the societal and political environment, the pre-
history of a decision-making process, elements of the issue at stake, characteristics of the
relevant stakeholder field, and the level of pre-existing conflict;
process characteristics (section C) such as who is involved in terms of governmental and
non-governmental actors, the configuration of power relations, the role of scientific exper-
tise, communication and information flows between actors, aspects of process facilitation,
and process resources;
6
process outputs and outcomes (section D) in terms of social, economic and environmen-
tal aspects (with an emphasis on the latter), social learning, trust-building, public ac-
ceptance, and conflict resolution, to name but a few.
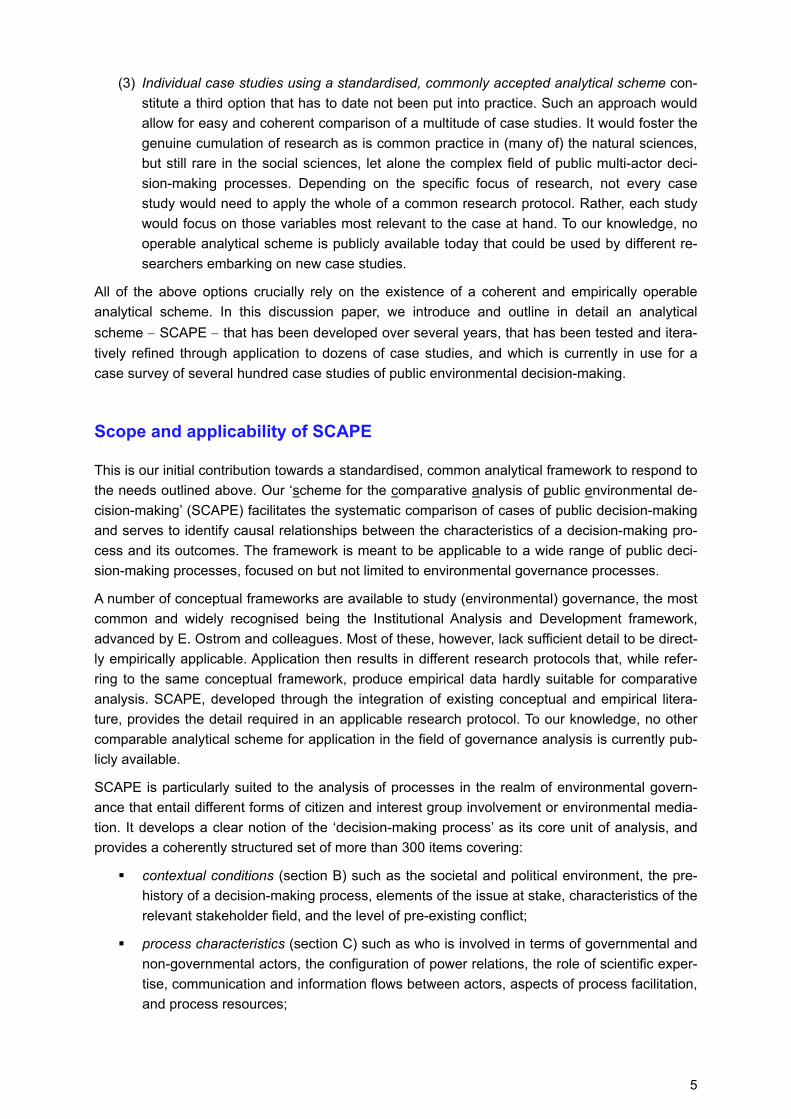
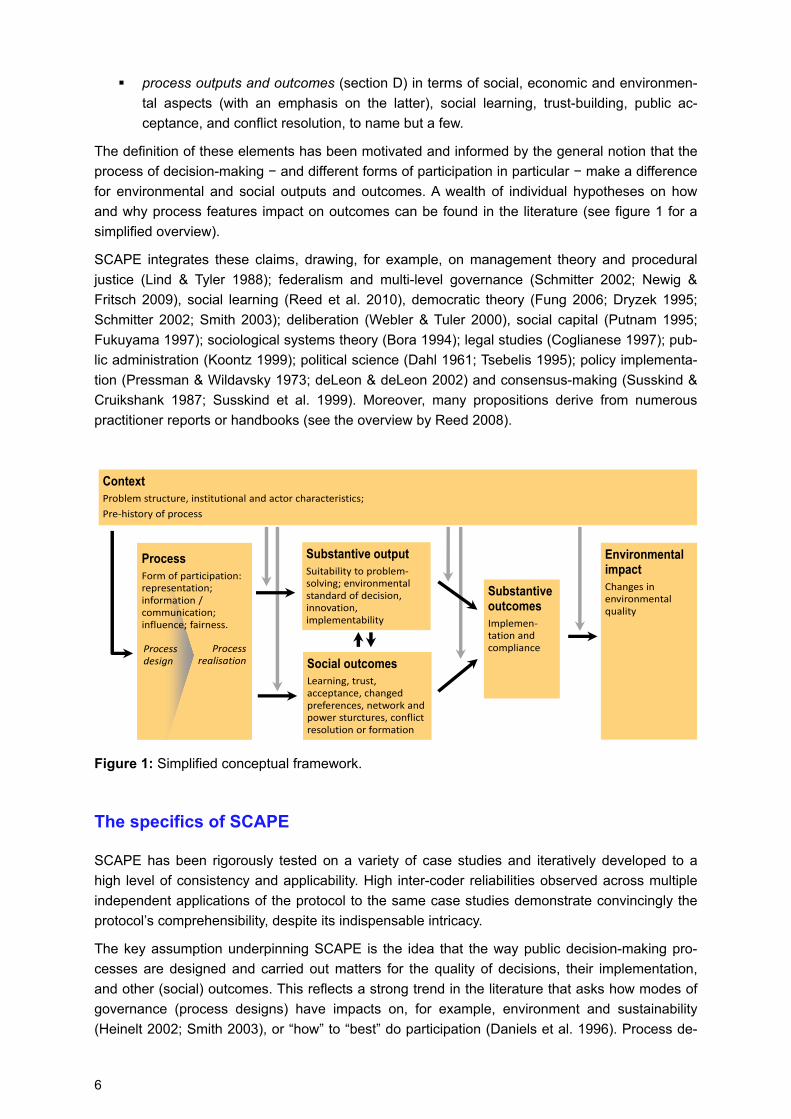
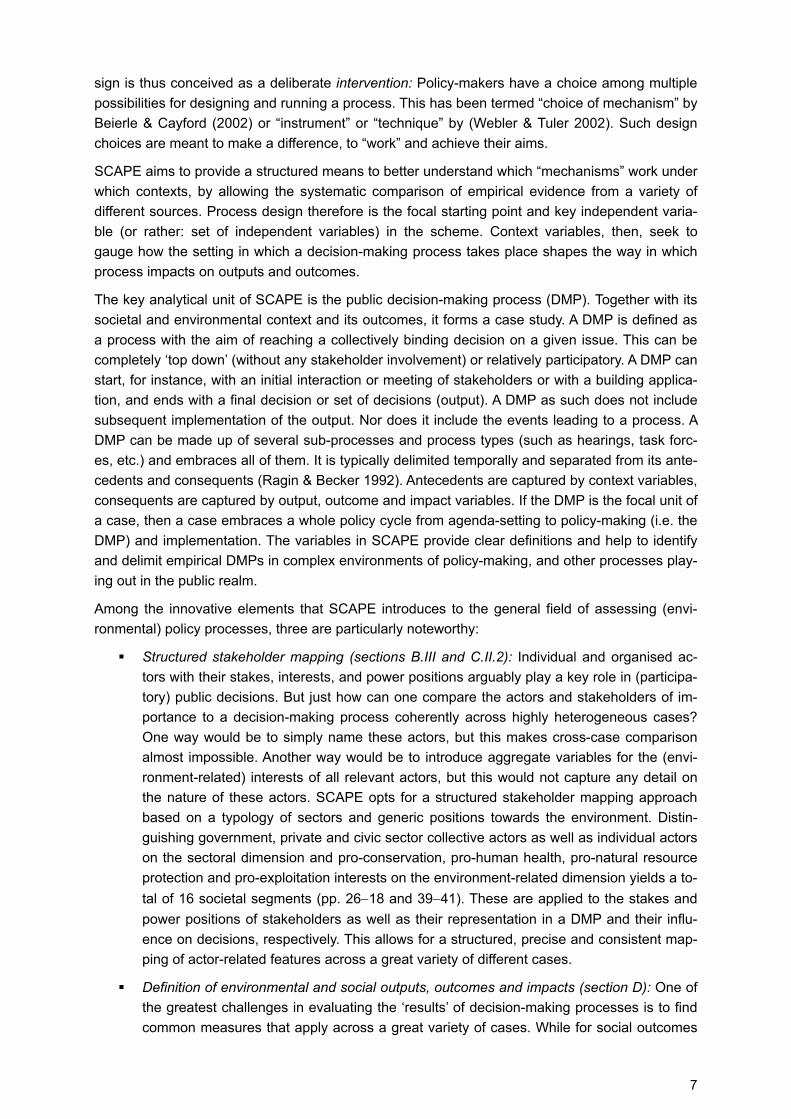
The definition of these elements has been motivated and informed by the general notion that the
process of decision-making − and different forms of participation in particular − make a difference
for environmental and social outputs and outcomes. A wealth of individual hypotheses on how
and why process features impact on outcomes can be found in the literature (see figure 1 for a
simplified overview).
SCAPE integrates these claims, drawing, for example, on management theory and procedural
justice (Lind & Tyler 1988); federalism and multi-level governance (Schmitter 2002; Newig &
Fritsch 2009), social learning (Reed et al. 2010), democratic theory (Fung 2006; Dryzek 1995;
Schmitter 2002; Smith 2003); deliberation (Webler & Tuler 2000), social capital (Putnam 1995;
Fukuyama 1997); sociological systems theory (Bora 1994); legal studies (Coglianese 1997); pub-
lic administration (Koontz 1999); political science (Dahl 1961; Tsebelis 1995); policy implementa-
tion (Pressman & Wildavsky 1973; deLeon & deLeon 2002) and consensus-making (Susskind &
Cruikshank 1987; Susskind et al. 1999). Moreover, many propositions derive from numerous
practitioner reports or handbooks (see the overview by Reed 2008).
Figure 1: Simplified conceptual framework.
The specifics of SCAPE
SCAPE has been rigorously tested on a variety of case studies and iteratively developed to a
high level of consistency and applicability. High inter-coder reliabilities observed across multiple
independent applications of the protocol to the same case studies demonstrate convincingly the
protocol’s comprehensibility, despite its indispensable intricacy.
The key assumption underpinning SCAPE is the idea that the way public decision-making pro-
cesses are designed and carried out matters for the quality of decisions, their implementation,
and other (social) outcomes. This reflects a strong trend in the literature that asks how modes of
governance (process designs) have impacts on, for example, environment and sustainability
(Heinelt 2002; Smith 2003), or “how” to “best” do participation (Daniels et al. 1996). Process de-
Social outcomesLearning, trust, acceptance, changed preferences, network and power sturctures, conflict resolution or formation
Substantive outputSuitability to problem‐solving; environmental standard of decision, innovation, implementability
Environmental impactChanges in environmental quality
Substantive outcomesImplemen‐tation andcompliance
ContextProblem structure, institutional and actor characteristics;
Pre‐history of process
ProcessForm of participation: representation; information / communication; influence; fairness.
Process realisation
Process design
7
sign is thus conceived as a deliberate intervention: Policy-makers have a choice among multiple
possibilities for designing and running a process. This has been termed “choice of mechanism” by
Beierle & Cayford (2002) or “instrument” or “technique” by (Webler & Tuler 2002). Such design
choices are meant to make a difference, to “work” and achieve their aims.
SCAPE aims to provide a structured means to better understand which “mechanisms” work under
which contexts, by allowing the systematic comparison of empirical evidence from a variety of
different sources. Process design therefore is the focal starting point and key independent varia-
ble (or rather: set of independent variables) in the scheme. Context variables, then, seek to
gauge how the setting in which a decision-making process takes place shapes the way in which
process impacts on outputs and outcomes.
The key analytical unit of SCAPE is the public decision-making process (DMP). Together with its
societal and environmental context and its outcomes, it forms a case study. A DMP is defined as
a process with the aim of reaching a collectively binding decision on a given issue. This can be
completely ‘top down’ (without any stakeholder involvement) or relatively participatory. A DMP can
start, for instance, with an initial interaction or meeting of stakeholders or with a building applica-
tion, and ends with a final decision or set of decisions (output). A DMP as such does not include
subsequent implementation of the output. Nor does it include the events leading to a process. A
DMP can be made up of several sub-processes and process types (such as hearings, task forc-
es, etc.) and embraces all of them. It is typically delimited temporally and separated from its ante-
cedents and consequents (Ragin & Becker 1992). Antecedents are captured by context variables,
consequents are captured by output, outcome and impact variables. If the DMP is the focal unit of
a case, then a case embraces a whole policy cycle from agenda-setting to policy-making (i.e. the
DMP) and implementation. The variables in SCAPE provide clear definitions and help to identify
and delimit empirical DMPs in complex environments of policy-making, and other processes play-
ing out in the public realm.
Among the innovative elements that SCAPE introduces to the general field of assessing (envi-
ronmental) policy processes, three are particularly noteworthy:
Structured stakeholder mapping (sections B.III and C.II.2): Individual and organised ac-
tors with their stakes, interests, and power positions arguably play a key role in (participa-
tory) public decisions. But just how can one compare the actors and stakeholders of im-
portance to a decision-making process coherently across highly heterogeneous cases?
One way would be to simply name these actors, but this makes cross-case comparison
almost impossible. Another way would be to introduce aggregate variables for the (envi-
ronment-related) interests of all relevant actors, but this would not capture any detail on
the nature of these actors. SCAPE opts for a structured stakeholder mapping approach
based on a typology of sectors and generic positions towards the environment. Distin-
guishing government, private and civic sector collective actors as well as individual actors
on the sectoral dimension and pro-conservation, pro-human health, pro-natural resource
protection and pro-exploitation interests on the environment-related dimension yields a to-
tal of 16 societal segments (pp. 2618 and 3941). These are applied to the stakes and
power positions of stakeholders as well as their representation in a DMP and their influ-
ence on decisions, respectively. This allows for a structured, precise and consistent map-
ping of actor-related features across a great variety of different cases.
Definition of environmental and social outputs, outcomes and impacts (section D): One of
the greatest challenges in evaluating the ‘results’ of decision-making processes is to find
common measures that apply across a great variety of cases. While for social outcomes
8
such as acceptance or learning, variables have been defined to compare across cases
(Beierle & Cayford 2002), little effort has previously been made to compare the environ-
mental results of decision-making. SCAPE introduces a threefold approach that draws on
work by Mitchell (2008). Outputs, outcomes and impacts are assessed against three dif-
ferent evaluative yardsticks. Environmental outputs (i.e. the decisions produced by a de-
cision-making process) are assessed (1) against the internally set goals of the process
represented by the goals of the DMP initiator; (2) externally, against the goals of a given
environmental regime reflected in any higher order policy of relevance to the issue (if ap-
plicable); (3) globally, against a hypothetical ‘business as usual’ scenario, and a hypothet-
ical ‘optimal’ condition or worst case scenario. Similarly, environmental impacts (i.e. likely
changes in the environment due to the implementation of the output of decisions) are as-
sessed (1) against the goals of the environmental output, as well as against criteria (2)
and (3) as applied to outputs above.
Assessing indications for causal hypotheses in a case (section E): SCAPE introduces a
method for assessing whether and to what degree a given case study provides support
for a number of causal hypotheses that link process characteristics with outputs and out-
comes (as sketched above). This assessment relies on counterfactual reasoning based
on the facts and arguments the case provides.
The technical details of SCAPE have been specifically developed to be applied in a case-study
meta analysis (case survey), drawing on multiple coders per case. The analytical scheme (code
book) presented in part two of this discussion paper corresponds to the second revision of 15
March 2012 plus a number of minor editorial changes. SCAPE may, however, be used for guiding
and analysing original (comparative) case studies as well. Not every detail will be relevant for
every application. However, we felt it would be most illustrative and inspiring to display all tech-
nical features of the analytical scheme, because any given application will have to deal with simi-
lar issues again.
We sincerely hope that SCAPE will prove as productive in other applications as it has proven in
the current case survey of 200 cases of environmental decision-making processes worldwide. We
invite fellow researchers to critique, test, apply, adapt or improve this analytical scheme and look
forward to any criticism.
Acknowledgements
We thank Brigitte Geißel, Tomas M. Koontz, William D. Leach, Mark S. Reed, Ortwin Renn, Detlef
Sprinz, Craig W. Thomas, Joris de Vente, Thomas Webler as well as our research assistants
Mark Owe Heuer, Anna-Lena Bögeholz, Nikolas Lührs, Michelle Mallwitz, Timo Steinert, Sarah
Velten, Ester Xicota, Anja Zirngibl and Sebastian Zösch for helpful comments on this analytical
scheme in the various phases of its development.
This work was in parts funded by the German Research Foundation, DFG project “ECOPAG
Environmental Consequences of Participatory Governance. A comparative meta-analysis of case
studies in environmental decision-making” (2009-2012) and by the European Research Council,
ERC Starting Grant “EDGE Evaluating the Delivery of Participatory Environmental Management
using an Evidence-Based Research Design” (2011-2016).
PART TWO: THE ANALYTICAL SCHEME (CODE BOOK)
General coding guidelines
Number of coders: In principle, all variables must be coded by three coders. A few exceptions are made regarding some key varia‐bles the codes of which crucially determine a whole range of other variable codes. One coder will be assigned to these variables, which are marked with an asterisk (*).
Variable scales: For semi‐quantitative variables (s‐q), we typically use a 5‐level scale from 0 to 4. This can be interpreted as:
0 corresponds to 0‐20 per cent; 1 corresponds to 20‐40 per cent; 2 corresponds to 40‐60 per cent; 3 corresponds to 60‐80 per cent; 4 corresponds to 80‐100 per cent;
with 100 per cent corresponding to a theoretical maximum, to be expected under realistic optimal conditions. For details on addi‐tional scales, see the full ‘list of scales used’ below.
Coding is to be based on evidence from the text(s). As a second priority, substantiated judgments by the author(s) that provide good arguments can be drawn on (usually with lower reliability than coding based on evidence). Only as a third priority, coding can be based on informed guesses (e.g. aspects not mentioned in the text but which can reasonably be assumed given all other infor‐mation). For selected variables only, information may be looked up in sources other than the specified text(s). These are marked with a (+) sign.
Coding is to follow as closely as possible the authors’ assessment rather than the interpretation of the coder. This does not imply following the authors’ terminology, as it may deviate from that of SCAPE. Authors’ terminology may need to be ‘translated’ into that of SCAPE.
Reliability field: For most variables, there is a separate field for the appraisal of the reliability of data on a scale from 0 to 3:
0 = insufficient information available. This means, the main variable is coded “NIL” (this is the default option in the web‐based data‐entry form); for technical reasons, NIL is not available in number and date fields; instead of NIL, enter ‐77 in number fields, and 00.00.0000 in date fields (each with a reliability of 0).
1 = sufficient information to make an informed guess on variable value; 2 = sufficient information to permit a reasonable evaluation; 3 = explicit, detailed and reliable information.
In situations where only very little information is available from the case text(s) for coding a specific variable or hypothesis, it is important to consider carefully the coding options. The choice in such situations will normally be between coding NIL with 0 reliabil‐ity, or entering some other code with a low reliability. Generally, if there is clearly no information or insufficient information to make an informed guess, a variable or hypothesis should be coded NIL with 0 reliability. However, in some situations, the absence of information (an author’s not mentioning something) can be informative. For example, where the author does not mention a factor or occurrence (X) that would reasonably be expected given all that we know about the case, it may in some instances be sufficient evidence that X was not present or did not occur. Similarly, if the author describes a process as involving X and Y, and it can reason‐ably be assumed that this is an exhaustive description of the process, it may be safe to assume Z was not present. In such cases it may be better to enter the appropriate code with a low reliability score.
Several variables depend on earlier coded variables (for instance, implementation variables 304−306 depend on how the output in variables 259−261 is coded). Here, reliability values should not depend on those earlier coded variables but only on the availability of information for each variable.
The reliability field should not be used to reflect uncertainty about the meaning of a variable. This would have to be mentioned in the annotations field.
Logically uncodable variables: If a variable cannot be coded because this would make no sense logically, it receives the value ‐99 and a reliability value of “NIL”. Where a reason for coding ‐99 is specified for a given variable (e.g. “Code ‐99 when there was no output”), this is not exclusive, and ‐99 can still be coded for other reasons. This then would have to be mentioned in the annota‐tions field. If (99) is specified in the variable description, the variable cannot be coded ‐99. For technical reasons, ‐99 is not available in date fields. Instead of ‐99, enter 13.13.1313 in date fields.
Annotations to variable codes: If the facts of the case appear to be in contradiction to the logic of SCAPE (i.e. a particular variable, a particular hypothesis or hypothesised counterfactual scenario, or some combination thereof) please provide an account of this in the annotations field 3. ANNOTATIONS.
Pre‐coded variables: Before starting coding, coders should confirm that information on pre‐coded variables ‐ marked by asterisks (*) ‐ is correct. This should be confirmed with the other two coders as soon as possible and before coding any other variables.
Priority variables: Variables for which the variable name appears in red should receive priority in coding discussions.
10
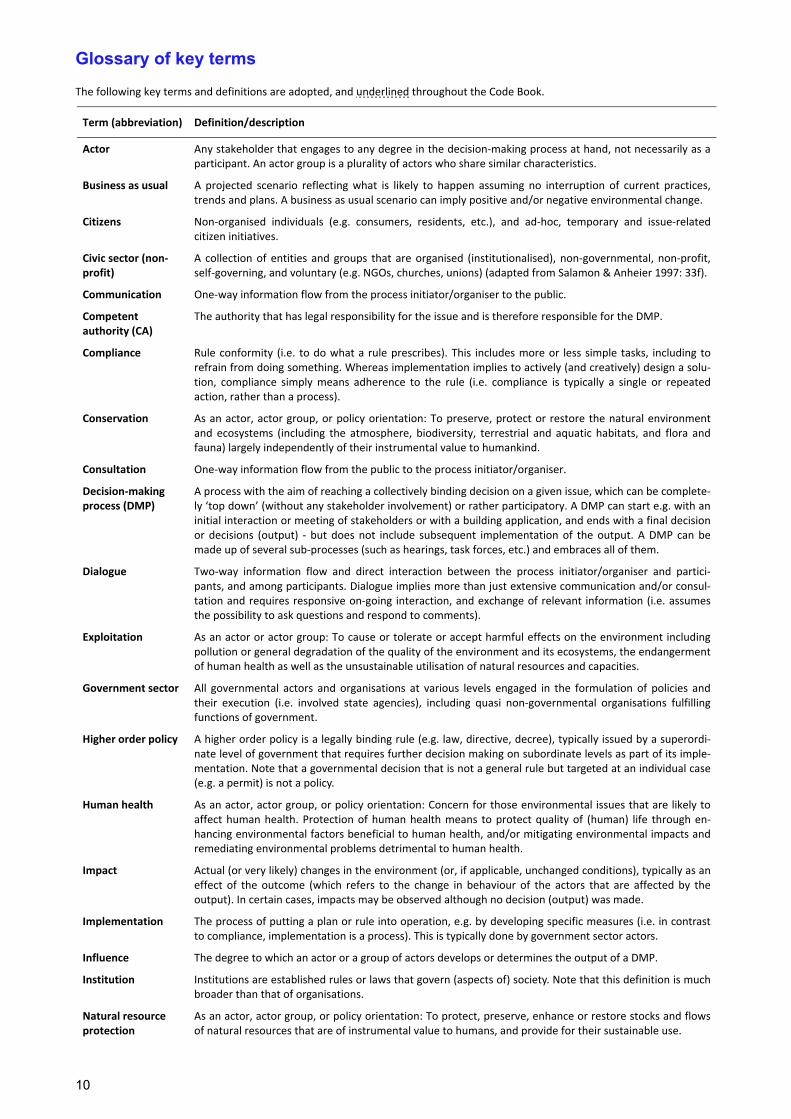
Glossary of key terms
The following key terms and definitions are adopted, and underlined throughout the Code Book.
Term (abbreviation) Definition/description
Actor Any stakeholder that engages to any degree in the decision‐making process at hand, not necessarily as a participant. An actor group is a plurality of actors who share similar characteristics.
Business as usual A projected scenario reflecting what is likely to happen assuming no interruption of current practices, trends and plans. A business as usual scenario can imply positive and/or negative environmental change.
Citizens Non‐organised individuals (e.g. consumers, residents, etc.), and ad‐hoc, temporary and issue‐related citizen initiatives.
Civic sector (non‐profit)
A collection of entities and groups that are organised (institutionalised), non‐governmental, non‐profit, self‐governing, and voluntary (e.g. NGOs, churches, unions) (adapted from Salamon & Anheier 1997: 33f).
Communication One‐way information flow from the process initiator/organiser to the public.
Competent authority (CA)
The authority that has legal responsibility for the issue and is therefore responsible for the DMP.
Compliance Rule conformity (i.e. to do what a rule prescribes). This includes more or less simple tasks, including to refrain from doing something. Whereas implementation implies to actively (and creatively) design a solu‐tion, compliance simply means adherence to the rule (i.e. compliance is typically a single or repeated action, rather than a process).
Conservation As an actor, actor group, or policy orientation: To preserve, protect or restore the natural environment and ecosystems (including the atmosphere, biodiversity, terrestrial and aquatic habitats, and flora and fauna) largely independently of their instrumental value to humankind.
Consultation One‐way information flow from the public to the process initiator/organiser.
Decision‐making process (DMP)
A process with the aim of reaching a collectively binding decision on a given issue, which can be complete‐ly ‘top down’ (without any stakeholder involvement) or rather participatory. A DMP can start e.g. with an initial interaction or meeting of stakeholders or with a building application, and ends with a final decision or decisions (output) ‐ but does not include subsequent implementation of the output. A DMP can be made up of several sub‐processes (such as hearings, task forces, etc.) and embraces all of them.
Dialogue Two‐way information flow and direct interaction between the process initiator/organiser and partici‐pants, and among participants. Dialogue implies more than just extensive communication and/or consul‐tation and requires responsive on‐going interaction, and exchange of relevant information (i.e. assumes the possibility to ask questions and respond to comments).
Exploitation As an actor or actor group: To cause or tolerate or accept harmful effects on the environment including pollution or general degradation of the quality of the environment and its ecosystems, the endangerment of human health as well as the unsustainable utilisation of natural resources and capacities.
Government sector All governmental actors and organisations at various levels engaged in the formulation of policies and their execution (i.e. involved state agencies), including quasi non‐governmental organisations fulfilling functions of government.
Higher order policy A higher order policy is a legally binding rule (e.g. law, directive, decree), typically issued by a superordi‐nate level of government that requires further decision making on subordinate levels as part of its imple‐mentation. Note that a governmental decision that is not a general rule but targeted at an individual case (e.g. a permit) is not a policy.
Human health As an actor, actor group, or policy orientation: Concern for those environmental issues that are likely to affect human health. Protection of human health means to protect quality of (human) life through en‐hancing environmental factors beneficial to human health, and/or mitigating environmental impacts and remediating environmental problems detrimental to human health.
Impact Actual (or very likely) changes in the environment (or, if applicable, unchanged conditions), typically as an effect of the outcome (which refers to the change in behaviour of the actors that are affected by the output). In certain cases, impacts may be observed although no decision (output) was made.
Implementation The process of putting a plan or rule into operation, e.g. by developing specific measures (i.e. in contrast to compliance, implementation is a process). This is typically done by government sector actors.
Influence The degree to which an actor or a group of actors develops or determines the output of a DMP.
Institution Institutions are established rules or laws that govern (aspects of) society. Note that this definition is much broader than that of organisations.
Natural resource protection
As an actor, actor group, or policy orientation: To protect, preserve, enhance or restore stocks and flows of natural resources that are of instrumental value to humans, and provide for their sustainable use.
11
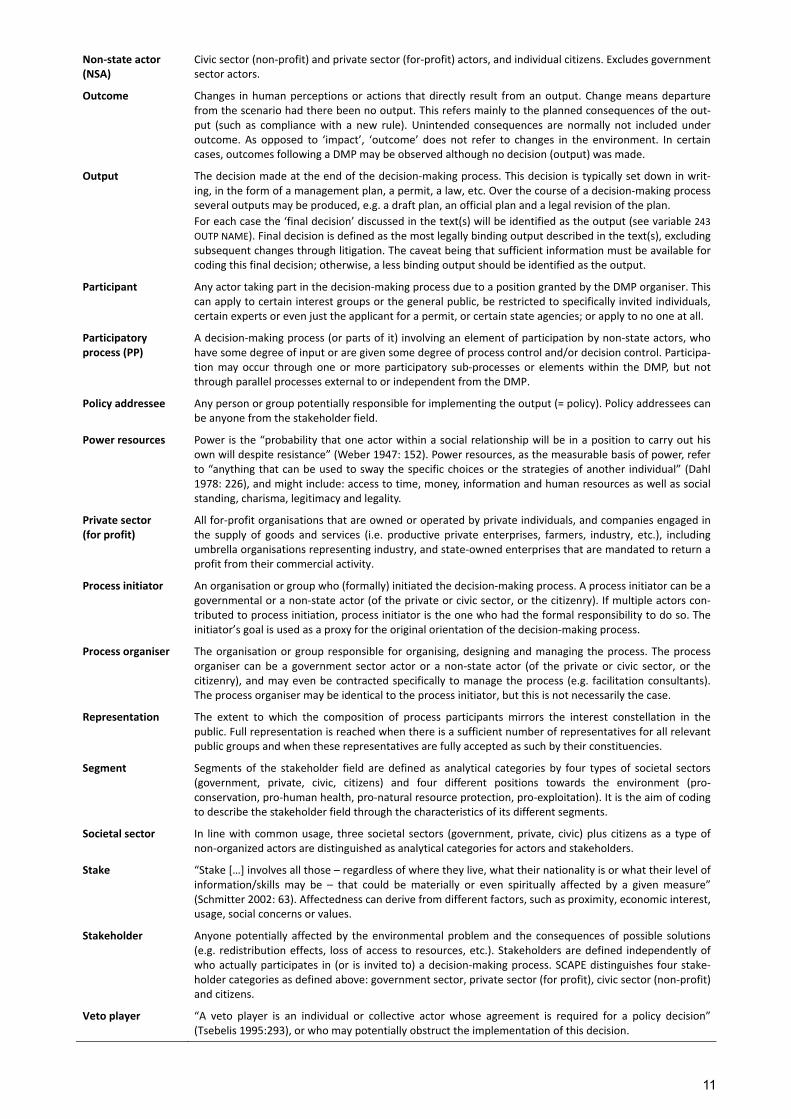
Non‐state actor (NSA)
Civic sector (non‐profit) and private sector (for‐profit) actors, and individual citizens. Excludes government sector actors.
Outcome Changes in human perceptions or actions that directly result from an output. Change means departure from the scenario had there been no output. This refers mainly to the planned consequences of the out‐put (such as compliance with a new rule). Unintended consequences are normally not included under outcome. As opposed to ‘impact’, ‘outcome’ does not refer to changes in the environment. In certain cases, outcomes following a DMP may be observed although no decision (output) was made.
Output The decision made at the end of the decision‐making process. This decision is typically set down in writ‐ing, in the form of a management plan, a permit, a law, etc. Over the course of a decision‐making process several outputs may be produced, e.g. a draft plan, an official plan and a legal revision of the plan.
For each case the ‘final decision’ discussed in the text(s) will be identified as the output (see variable 243 OUTP NAME). Final decision is defined as the most legally binding output described in the text(s), excluding subsequent changes through litigation. The caveat being that sufficient information must be available for coding this final decision; otherwise, a less binding output should be identified as the output.
Participant Any actor taking part in the decision‐making process due to a position granted by the DMP organiser. This can apply to certain interest groups or the general public, be restricted to specifically invited individuals, certain experts or even just the applicant for a permit, or certain state agencies; or apply to no one at all.
Participatory process (PP)
A decision‐making process (or parts of it) involving an element of participation by non‐state actors, who have some degree of input or are given some degree of process control and/or decision control. Participa‐tion may occur through one or more participatory sub‐processes or elements within the DMP, but not through parallel processes external to or independent from the DMP.
Policy addressee Any person or group potentially responsible for implementing the output (= policy). Policy addressees can be anyone from the stakeholder field.
Power resources Power is the “probability that one actor within a social relationship will be in a position to carry out his own will despite resistance” (Weber 1947: 152). Power resources, as the measurable basis of power, refer to “anything that can be used to sway the specific choices or the strategies of another individual” (Dahl 1978: 226), and might include: access to time, money, information and human resources as well as social standing, charisma, legitimacy and legality.
Private sector (for profit)
All for‐profit organisations that are owned or operated by private individuals, and companies engaged in the supply of goods and services (i.e. productive private enterprises, farmers, industry, etc.), including umbrella organisations representing industry, and state‐owned enterprises that are mandated to return a profit from their commercial activity.
Process initiator An organisation or group who (formally) initiated the decision‐making process. A process initiator can be a governmental or a non‐state actor (of the private or civic sector, or the citizenry). If multiple actors con‐tributed to process initiation, process initiator is the one who had the formal responsibility to do so. The initiator’s goal is used as a proxy for the original orientation of the decision‐making process.
Process organiser The organisation or group responsible for organising, designing and managing the process. The process organiser can be a government sector actor or a non‐state actor (of the private or civic sector, or the citizenry), and may even be contracted specifically to manage the process (e.g. facilitation consultants). The process organiser may be identical to the process initiator, but this is not necessarily the case.
Representation The extent to which the composition of process participants mirrors the interest constellation in the public. Full representation is reached when there is a sufficient number of representatives for all relevant public groups and when these representatives are fully accepted as such by their constituencies.
Segment Segments of the stakeholder field are defined as analytical categories by four types of societal sectors (government, private, civic, citizens) and four different positions towards the environment (pro‐conservation, pro‐human health, pro‐natural resource protection, pro‐exploitation). It is the aim of coding to describe the stakeholder field through the characteristics of its different segments.
Societal sector In line with common usage, three societal sectors (government, private, civic) plus citizens as a type of non‐organized actors are distinguished as analytical categories for actors and stakeholders.
Stake “Stake […] involves all those – regardless of where they live, what their nationality is or what their level of information/skills may be – that could be materially or even spiritually affected by a given measure” (Schmitter 2002: 63). Affectedness can derive from different factors, such as proximity, economic interest, usage, social concerns or values.
Stakeholder Anyone potentially affected by the environmental problem and the consequences of possible solutions (e.g. redistribution effects, loss of access to resources, etc.). Stakeholders are defined independently of who actually participates in (or is invited to) a decision‐making process. SCAPE distinguishes four stake‐holder categories as defined above: government sector, private sector (for profit), civic sector (non‐profit) and citizens.
Veto player “A veto player is an individual or collective actor whose agreement is required for a policy decision” (Tsebelis 1995:293), or who may potentially obstruct the implementation of this decision.
12
Guidelines for specific groups of variables
Coding reliability for dates:
0 = no discernible date; 1 = the year is uncertain; 2 = the year is known; 3 = the year and month are known.
For a small number of variables assigning a reliability value does not make sense and, hence, these will not be assigned a reliability code. Variables where this is the case are marked with a (rel) in the ‘scale’ column and do not provide the possi‐bility of assigning a reliability code in the database.
Some particular variables ask for general information which may be looked up in other sources. These variables are marked with a (+) before the variable description.
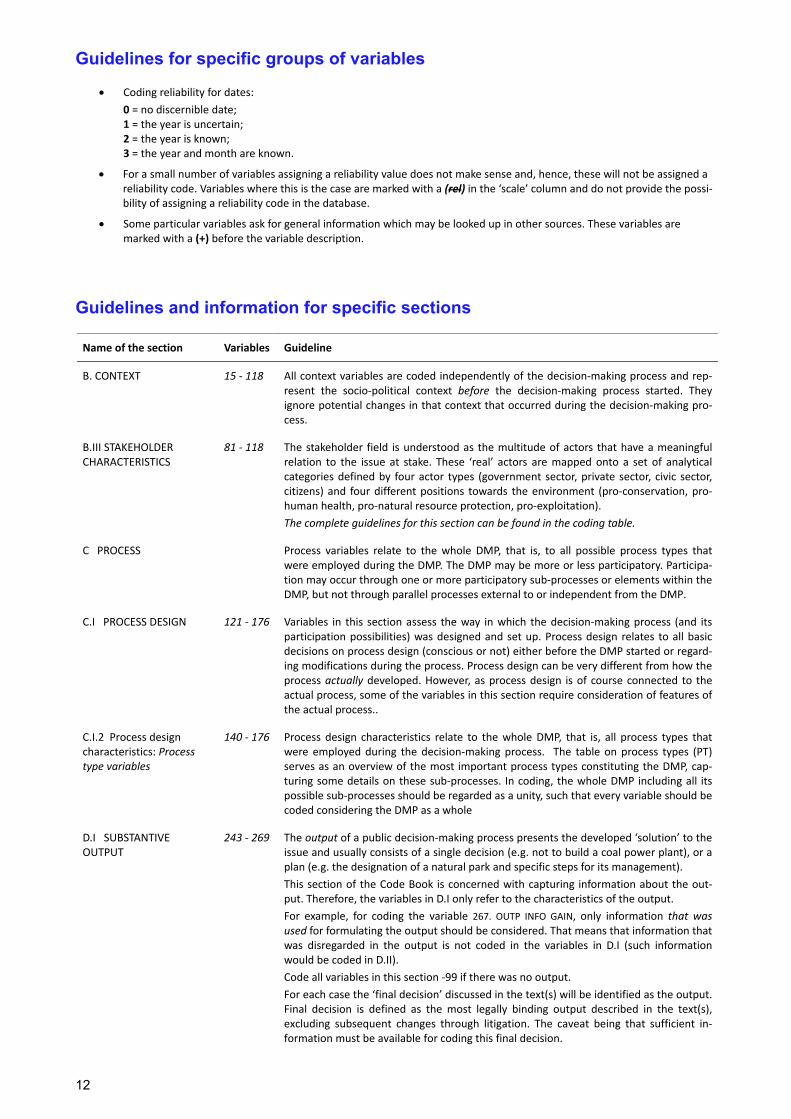
Guidelines and information for specific sections
Name of the section Variables Guideline
B. CONTEXT 15 ‐ 118 All context variables are coded independently of the decision‐making process and rep‐resent the socio‐political context before the decision‐making process started. They ignore potential changes in that context that occurred during the decision‐making pro‐cess.
B.III STAKEHOLDER CHARACTERISTICS
81 ‐ 118 The stakeholder field is understood as the multitude of actors that have a meaningful relation to the issue at stake. These ‘real’ actors are mapped onto a set of analytical categories defined by four actor types (government sector, private sector, civic sector, citizens) and four different positions towards the environment (pro‐conservation, pro‐human health, pro‐natural resource protection, pro‐exploitation).
The complete guidelines for this section can be found in the coding table.
C PROCESS Process variables relate to the whole DMP, that is, to all possible process types that were employed during the DMP. The DMP may be more or less participatory. Participa‐tion may occur through one or more participatory sub‐processes or elements within the DMP, but not through parallel processes external to or independent from the DMP.
C.I PROCESS DESIGN 121 ‐ 176 Variables in this section assess the way in which the decision‐making process (and its participation possibilities) was designed and set up. Process design relates to all basic decisions on process design (conscious or not) either before the DMP started or regard‐ing modifications during the process. Process design can be very different from how the process actually developed. However, as process design is of course connected to the actual process, some of the variables in this section require consideration of features of the actual process..
C.I.2 Process design characteristics: Process type variables
140 ‐ 176 Process design characteristics relate to the whole DMP, that is, all process types that were employed during the decision‐making process. The table on process types (PT) serves as an overview of the most important process types constituting the DMP, cap‐turing some details on these sub‐processes. In coding, the whole DMP including all its possible sub‐processes should be regarded as a unity, such that every variable should be coded considering the DMP as a whole
D.I SUBSTANTIVE OUTPUT
243 ‐ 269 The output of a public decision‐making process presents the developed ‘solution’ to the issue and usually consists of a single decision (e.g. not to build a coal power plant), or a plan (e.g. the designation of a natural park and specific steps for its management).
This section of the Code Book is concerned with capturing information about the out‐put. Therefore, the variables in D.I only refer to the characteristics of the output.
For example, for coding the variable 267. OUTP INFO GAIN, only information that was used for formulating the output should be considered. That means that information that was disregarded in the output is not coded in the variables in D.I (such information would be coded in D.II).
Code all variables in this section ‐99 if there was no output.
For each case the ‘final decision’ discussed in the text(s) will be identified as the output. Final decision is defined as the most legally binding output described in the text(s), excluding subsequent changes through litigation. The caveat being that sufficient in‐formation must be available for coding this final decision.
13
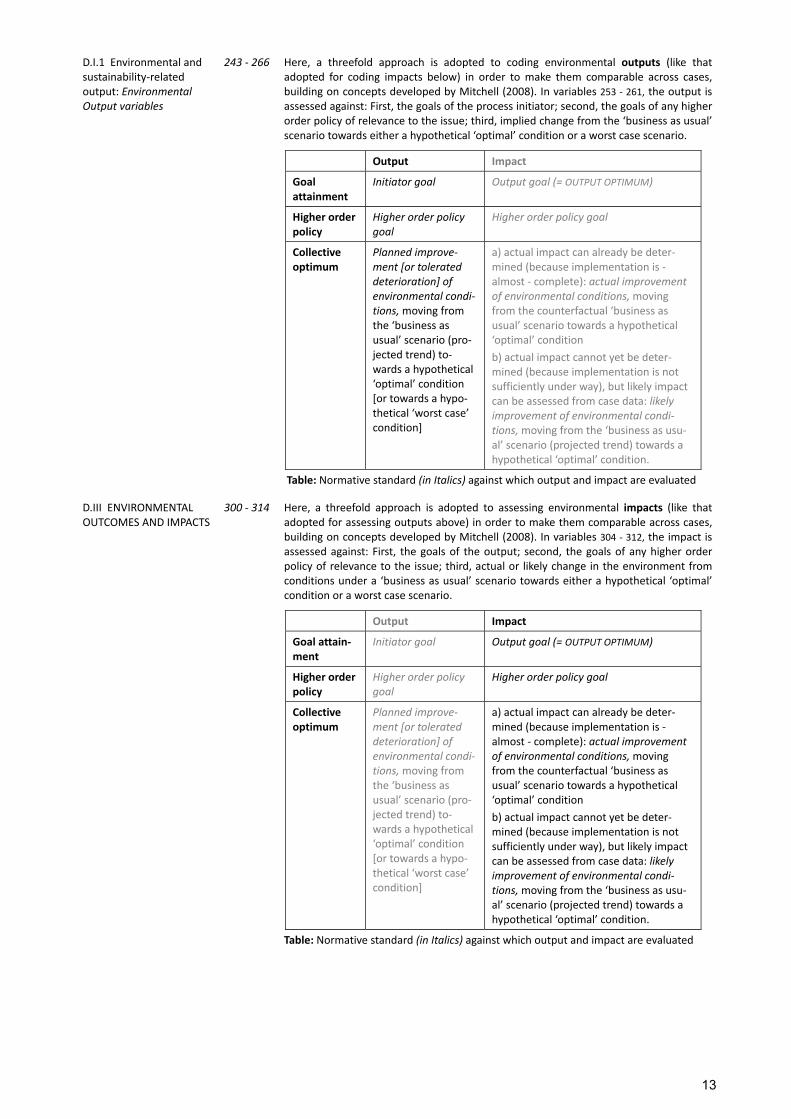
D.I.1 Environmental and sustainability‐related output: Environmental Output variables
243 ‐ 266 Here, a threefold approach is adopted to coding environmental outputs (like that adopted for coding impacts below) in order to make them comparable across cases, building on concepts developed by Mitchell (2008). In variables 253 ‐ 261, the output is assessed against: First, the goals of the process initiator; second, the goals of any higher order policy of relevance to the issue; third, implied change from the ‘business as usual’ scenario towards either a hypothetical ‘optimal’ condition or a worst case scenario.
Output Impact
Goal attainment
Initiator goal Output goal (= OUTPUT OPTIMUM)
Higher order policy
Higher order policy goal
Higher order policy goal
Collective optimum
Planned improve‐ment [or tolerated deterioration] of environmental condi‐tions, moving from the ‘business as usual’ scenario (pro‐jected trend) to‐wards a hypothetical ‘optimal’ condition [or towards a hypo‐thetical ‘worst case’ condition]
a) actual impact can already be deter‐mined (because implementation is ‐ almost ‐ complete): actual improvement of environmental conditions, moving from the counterfactual ‘business as usual’ scenario towards a hypothetical ‘optimal’ condition
b) actual impact cannot yet be deter‐mined (because implementation is not sufficiently under way), but likely impact can be assessed from case data: likely improvement of environmental condi‐tions, moving from the ‘business as usu‐al’ scenario (projected trend) towards a hypothetical ‘optimal’ condition.
Table: Normative standard (in Italics) against which output and impact are evaluated
D.III ENVIRONMENTAL OUTCOMES AND IMPACTS
300 ‐ 314 Here, a threefold approach is adopted to assessing environmental impacts (like that adopted for assessing outputs above) in order to make them comparable across cases, building on concepts developed by Mitchell (2008). In variables 304 ‐ 312, the impact is assessed against: First, the goals of the output; second, the goals of any higher order policy of relevance to the issue; third, actual or likely change in the environment from conditions under a ‘business as usual’ scenario towards either a hypothetical ‘optimal’ condition or a worst case scenario.
Output Impact
Goal attain‐ment
Initiator goal Output goal (= OUTPUT OPTIMUM)
Higher order policy
Higher order policy goal
Higher order policy goal
Collective optimum
Planned improve‐ment [or tolerated deterioration] of environmental condi‐tions, moving from the ‘business as usual’ scenario (pro‐jected trend) to‐wards a hypothetical ‘optimal’ condition [or towards a hypo‐thetical ‘worst case’ condition]
a) actual impact can already be deter‐mined (because implementation is ‐ almost ‐ complete): actual improvement of environmental conditions, moving from the counterfactual ‘business as usual’ scenario towards a hypothetical ‘optimal’ condition
b) actual impact cannot yet be deter‐mined (because implementation is not sufficiently under way), but likely impact can be assessed from case data: likely improvement of environmental condi‐tions, moving from the ‘business as usu‐al’ scenario (projected trend) towards a hypothetical ‘optimal’ condition.
Table: Normative standard (in Italics) against which output and impact are evaluated
14
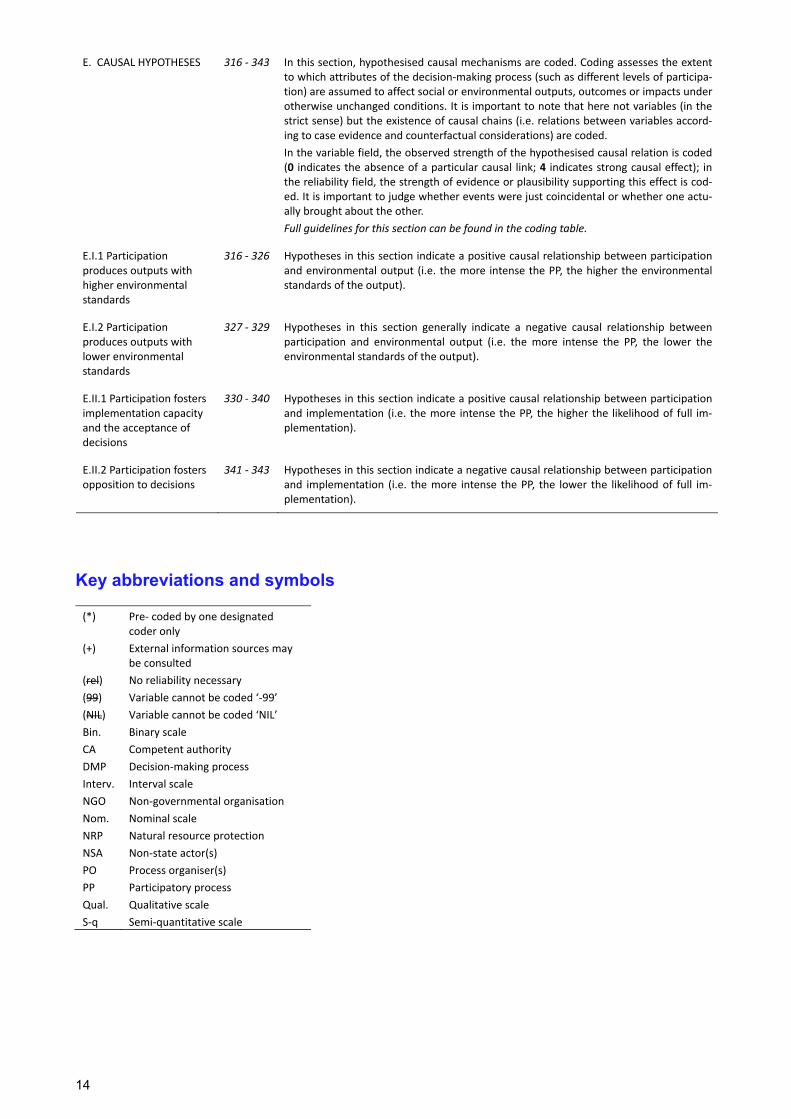
E. CAUSAL HYPOTHESES 316 ‐ 343 In this section, hypothesised causal mechanisms are coded. Coding assesses the extent to which attributes of the decision‐making process (such as different levels of participa‐tion) are assumed to affect social or environmental outputs, outcomes or impacts under otherwise unchanged conditions. It is important to note that here not variables (in the strict sense) but the existence of causal chains (i.e. relations between variables accord‐ing to case evidence and counterfactual considerations) are coded.
In the variable field, the observed strength of the hypothesised causal relation is coded (0 indicates the absence of a particular causal link; 4 indicates strong causal effect); in the reliability field, the strength of evidence or plausibility supporting this effect is cod‐ed. It is important to judge whether events were just coincidental or whether one actu‐ally brought about the other.
Full guidelines for this section can be found in the coding table.
E.I.1 Participation produces outputs with higher environmental standards
316 ‐ 326 Hypotheses in this section indicate a positive causal relationship between participation and environmental output (i.e. the more intense the PP, the higher the environmental standards of the output).
E.I.2 Participation produces outputs with lower environmental standards
327 ‐ 329 Hypotheses in this section generally indicate a negative causal relationship between participation and environmental output (i.e. the more intense the PP, the lower the environmental standards of the output).
E.II.1 Participation fosters implementation capacity and the acceptance of decisions
330 ‐ 340 Hypotheses in this section indicate a positive causal relationship between participation and implementation (i.e. the more intense the PP, the higher the likelihood of full im‐plementation).
E.II.2 Participation fosters opposition to decisions
341 ‐ 343 Hypotheses in this section indicate a negative causal relationship between participation and implementation (i.e. the more intense the PP, the lower the likelihood of full im‐plementation).
Key abbreviations and symbols
(*) Pre‐ coded by one designated coder only
(+) External information sources may be consulted
(rel) No reliability necessary
(99) Variable cannot be coded ‘‐99’
(NIL) Variable cannot be coded ‘NIL’
Bin. Binary scale
CA Competent authority
DMP Decision‐making process
Interv. Interval scale
NGO Non‐governmental organisation
Nom. Nominal scale
NRP Natural resource protection
NSA Non‐state actor(s)
PO Process organiser(s)
PP Participatory process
Qual. Qualitative scale
S‐q Semi‐quantitative scale
15
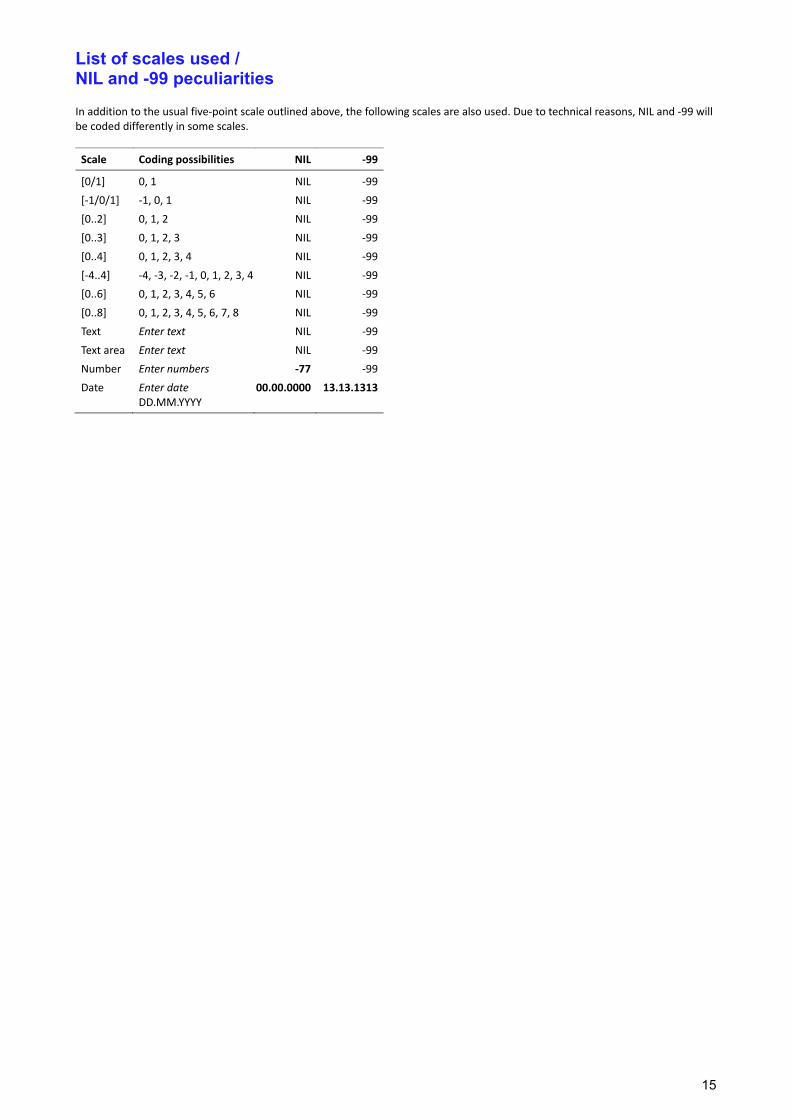
List of scales used / NIL and -99 peculiarities
In addition to the usual five‐point scale outlined above, the following scales are also used. Due to technical reasons, NIL and ‐99 will be coded differently in some scales.
Scale Coding possibilities NIL ‐99
[0/1] 0, 1 NIL ‐99
[‐1/0/1] ‐1, 0, 1 NIL ‐99
[0..2] 0, 1, 2 NIL ‐99
[0..3] 0, 1, 2, 3 NIL ‐99
[0..4] 0, 1, 2, 3, 4 NIL ‐99
[‐4..4] ‐4, ‐3, ‐2, ‐1, 0, 1, 2, 3, 4 NIL ‐99
[0..6] 0, 1, 2, 3, 4, 5, 6 NIL ‐99
[0..8] 0, 1, 2, 3, 4, 5, 6, 7, 8 NIL ‐99
Text Enter text NIL ‐99
Text area Enter text NIL ‐99
Number Enter numbers ‐77 ‐99
Date Enter date DD.MM.YYYY
00.00.0000 13.13.1313
16
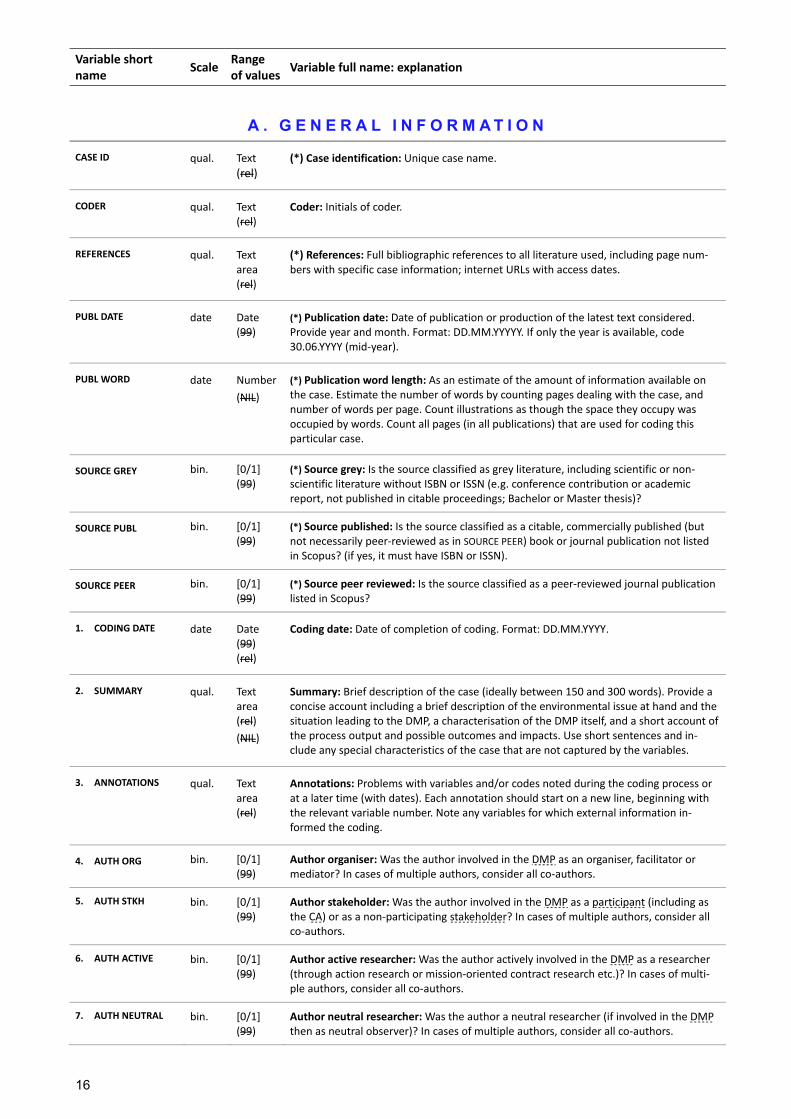
Variable short name
Scale Range of values
Variable full name: explanation
A . G E N E R A L I N F O R M A T I O N
CASE ID qual. Text
(rel) (*) Case identification: Unique case name.
CODER qual. Text (rel)
Coder: Initials of coder.
REFERENCES qual. Text area (rel)
(*) References: Full bibliographic references to all literature used, including page num‐bers with specific case information; internet URLs with access dates.
PUBL DATE date Date (99)
(*) Publication date: Date of publication or production of the latest text considered. Provide year and month. Format: DD.MM.YYYYY. If only the year is available, code 30.06.YYYY (mid‐year).
PUBL WORD date Number
(NIL)
(*) Publication word length: As an estimate of the amount of information available on the case. Estimate the number of words by counting pages dealing with the case, and number of words per page. Count illustrations as though the space they occupy was occupied by words. Count all pages (in all publications) that are used for coding this particular case.
SOURCE GREY bin. [0/1] (99)
(*) Source grey: Is the source classified as grey literature, including scientific or non‐scientific literature without ISBN or ISSN (e.g. conference contribution or academic report, not published in citable proceedings; Bachelor or Master thesis)?
SOURCE PUBL bin. [0/1] (99)
(*) Source published: Is the source classified as a citable, commercially published (but not necessarily peer‐reviewed as in SOURCE PEER) book or journal publication not listed in Scopus? (if yes, it must have ISBN or ISSN).
SOURCE PEER bin. [0/1] (99)
(*) Source peer reviewed: Is the source classified as a peer‐reviewed journal publication listed in Scopus?
1. CODING DATE date Date (99) (rel)
Coding date: Date of completion of coding. Format: DD.MM.YYYY.
2. SUMMARY qual. Text area (rel)
(NIL)
Summary: Brief description of the case (ideally between 150 and 300 words). Provide a concise account including a brief description of the environmental issue at hand and the situation leading to the DMP, a characterisation of the DMP itself, and a short account of the process output and possible outcomes and impacts. Use short sentences and in‐clude any special characteristics of the case that are not captured by the variables.
3. ANNOTATIONS qual. Text area (rel)
Annotations: Problems with variables and/or codes noted during the coding process or at a later time (with dates). Each annotation should start on a new line, beginning with the relevant variable number. Note any variables for which external information in‐formed the coding.
4. AUTH ORG bin. [0/1] (99)
Author organiser: Was the author involved in the DMP as an organiser, facilitator or mediator? In cases of multiple authors, consider all co‐authors.
5. AUTH STKH bin. [0/1] (99)
Author stakeholder: Was the author involved in the DMP as a participant (including as the CA) or as a non‐participating stakeholder? In cases of multiple authors, consider all co‐authors.
6. AUTH ACTIVE bin. [0/1] (99)
Author active researcher: Was the author actively involved in the DMP as a researcher (through action research or mission‐oriented contract research etc.)? In cases of multi‐ple authors, consider all co‐authors.
7. AUTH NEUTRAL bin. [0/1] (99)
Author neutral researcher: Was the author a neutral researcher (if involved in the DMP then as neutral observer)? In cases of multiple authors, consider all co‐authors.
17
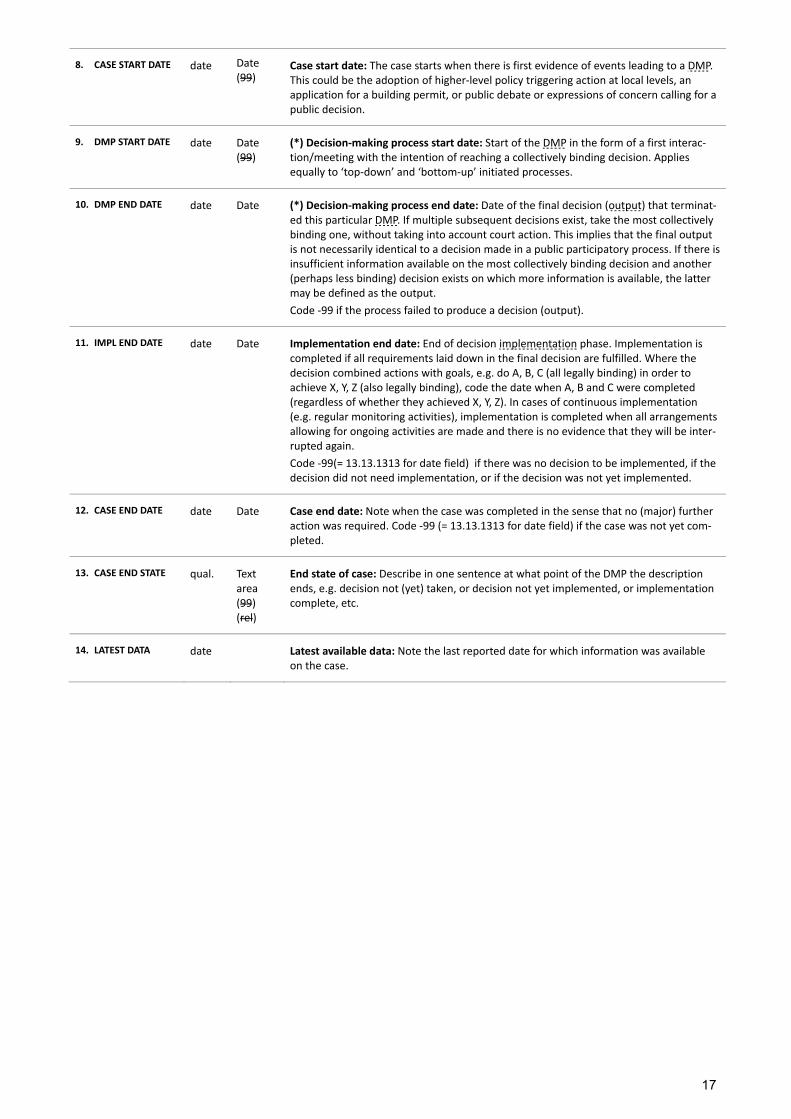
8. CASE START DATE date Date (99)
Case start date: The case starts when there is first evidence of events leading to a DMP. This could be the adoption of higher‐level policy triggering action at local levels, an application for a building permit, or public debate or expressions of concern calling for a public decision.
9. DMP START DATE date Date (99)
(*) Decision‐making process start date: Start of the DMP in the form of a first interac‐tion/meeting with the intention of reaching a collectively binding decision. Applies equally to ‘top‐down’ and ‘bottom‐up’ initiated processes.
10. DMP END DATE date Date (*) Decision‐making process end date: Date of the final decision (output) that terminat‐ed this particular DMP. If multiple subsequent decisions exist, take the most collectively binding one, without taking into account court action. This implies that the final output is not necessarily identical to a decision made in a public participatory process. If there is insufficient information available on the most collectively binding decision and another (perhaps less binding) decision exists on which more information is available, the latter may be defined as the output.
Code ‐99 if the process failed to produce a decision (output).
11. IMPL END DATE date Date Implementation end date: End of decision implementation phase. Implementation is completed if all requirements laid down in the final decision are fulfilled. Where the decision combined actions with goals, e.g. do A, B, C (all legally binding) in order to achieve X, Y, Z (also legally binding), code the date when A, B and C were completed (regardless of whether they achieved X, Y, Z). In cases of continuous implementation (e.g. regular monitoring activities), implementation is completed when all arrangements allowing for ongoing activities are made and there is no evidence that they will be inter‐rupted again.
Code ‐99(= 13.13.1313 for date field) if there was no decision to be implemented, if the decision did not need implementation, or if the decision was not yet implemented.
12. CASE END DATE date Date Case end date: Note when the case was completed in the sense that no (major) further action was required. Code ‐99 (= 13.13.1313 for date field) if the case was not yet com‐pleted.
13. CASE END STATE qual. Text area (99) (rel)
End state of case: Describe in one sentence at what point of the DMP the description ends, e.g. decision not (yet) taken, or decision not yet implemented, or implementation complete, etc.
14. LATEST DATA date Latest available data: Note the last reported date for which information was available on the case.
18
B . C O N T E X T
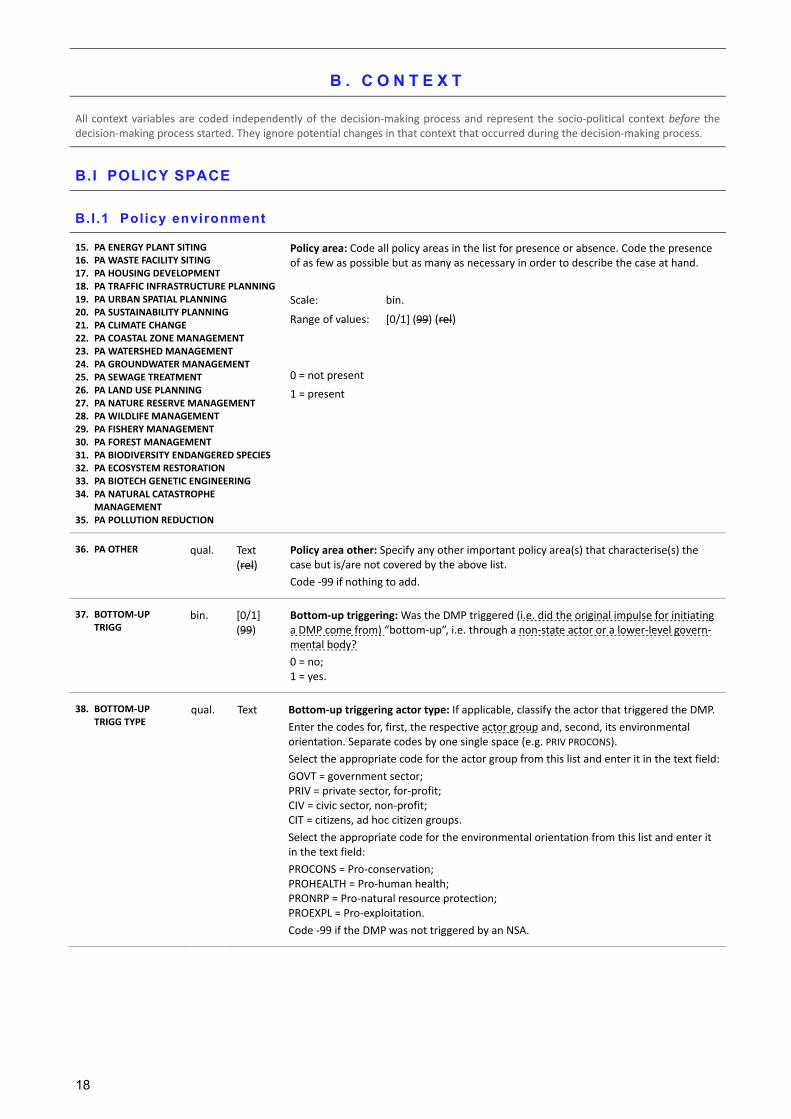
All context variables are coded independently of the decision‐making process and represent the socio‐political context before the decision‐making process started. They ignore potential changes in that context that occurred during the decision‐making process.
B.I POLICY SPACE
B.I .1 Policy environment
15. PA ENERGY PLANT SITING 16. PA WASTE FACILITY SITING 17. PA HOUSING DEVELOPMENT 18. PA TRAFFIC INFRASTRUCTURE PLANNING 19. PA URBAN SPATIAL PLANNING 20. PA SUSTAINABILITY PLANNING 21. PA CLIMATE CHANGE 22. PA COASTAL ZONE MANAGEMENT 23. PA WATERSHED MANAGEMENT 24. PA GROUNDWATER MANAGEMENT 25. PA SEWAGE TREATMENT 26. PA LAND USE PLANNING 27. PA NATURE RESERVE MANAGEMENT 28. PA WILDLIFE MANAGEMENT 29. PA FISHERY MANAGEMENT 30. PA FOREST MANAGEMENT 31. PA BIODIVERSITY ENDANGERED SPECIES 32. PA ECOSYSTEM RESTORATION 33. PA BIOTECH GENETIC ENGINEERING 34. PA NATURAL CATASTROPHE
MANAGEMENT 35. PA POLLUTION REDUCTION
Policy area: Code all policy areas in the list for presence or absence. Code the presence of as few as possible but as many as necessary in order to describe the case at hand.
Scale: bin.
Range of values: [0/1] (99) (rel)
0 = not present
1 = present
36. PA OTHER qual. Text
(rel) Policy area other: Specify any other important policy area(s) that characterise(s) the case but is/are not covered by the above list.
Code ‐99 if nothing to add.
37. BOTTOM‐UP TRIGG
bin. [0/1] (99)
Bottom‐up triggering: Was the DMP triggered (i.e. did the original impulse for initiating a DMP come from) “bottom‐up”, i.e. through a non‐state actor or a lower‐level govern‐mental body?
0 = no; 1 = yes.
38. BOTTOM‐UP TRIGG TYPE
qual. Text Bottom‐up triggering actor type: If applicable, classify the actor that triggered the DMP.
Enter the codes for, first, the respective actor group and, second, its environmental orientation. Separate codes by one single space (e.g. PRIV PROCONS).
Select the appropriate code for the actor group from this list and enter it in the text field:
GOVT = government sector; PRIV = private sector, for‐profit; CIV = civic sector, non‐profit; CIT = citizens, ad hoc citizen groups.
Select the appropriate code for the environmental orientation from this list and enter it in the text field:
PROCONS = Pro‐conservation; PROHEALTH = Pro‐human health; PRONRP = Pro‐natural resource protection; PROEXPL = Pro‐exploitation.
Code ‐99 if the DMP was not triggered by an NSA.
19
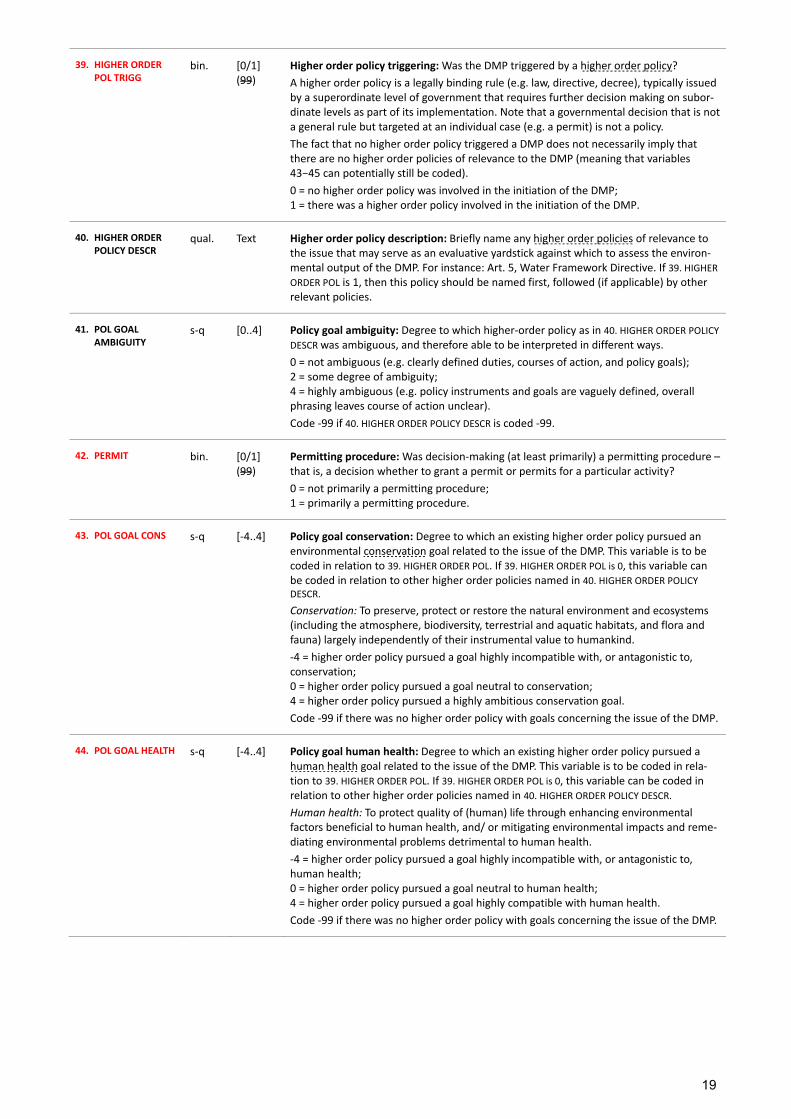
39. HIGHER ORDER POL TRIGG
bin. [0/1] (99)
Higher order policy triggering: Was the DMP triggered by a higher order policy?
A higher order policy is a legally binding rule (e.g. law, directive, decree), typically issued by a superordinate level of government that requires further decision making on subor‐dinate levels as part of its implementation. Note that a governmental decision that is not a general rule but targeted at an individual case (e.g. a permit) is not a policy.
The fact that no higher order policy triggered a DMP does not necessarily imply that there are no higher order policies of relevance to the DMP (meaning that variables 43−45 can potentially still be coded).
0 = no higher order policy was involved in the initiation of the DMP; 1 = there was a higher order policy involved in the initiation of the DMP.
40. HIGHER ORDER POLICY DESCR
qual. Text Higher order policy description: Briefly name any higher order policies of relevance to the issue that may serve as an evaluative yardstick against which to assess the environ‐mental output of the DMP. For instance: Art. 5, Water Framework Directive. If 39. HIGHER ORDER POL is 1, then this policy should be named first, followed (if applicable) by other relevant policies.
41. POL GOAL AMBIGUITY
s‐q [0..4] Policy goal ambiguity: Degree to which higher‐order policy as in 40. HIGHER ORDER POLICY DESCR was ambiguous, and therefore able to be interpreted in different ways.
0 = not ambiguous (e.g. clearly defined duties, courses of action, and policy goals); 2 = some degree of ambiguity; 4 = highly ambiguous (e.g. policy instruments and goals are vaguely defined, overall phrasing leaves course of action unclear).
Code ‐99 if 40. HIGHER ORDER POLICY DESCR is coded ‐99.
42. PERMIT bin. [0/1] (99)
Permitting procedure: Was decision‐making (at least primarily) a permitting procedure – that is, a decision whether to grant a permit or permits for a particular activity?
0 = not primarily a permitting procedure; 1 = primarily a permitting procedure.
43. POL GOAL CONS s‐q [‐4..4] Policy goal conservation: Degree to which an existing higher order policy pursued an environmental conservation goal related to the issue of the DMP. This variable is to be coded in relation to 39. HIGHER ORDER POL. If 39. HIGHER ORDER POL is 0, this variable can be coded in relation to other higher order policies named in 40. HIGHER ORDER POLICY DESCR.
Conservation: To preserve, protect or restore the natural environment and ecosystems (including the atmosphere, biodiversity, terrestrial and aquatic habitats, and flora and fauna) largely independently of their instrumental value to humankind.
‐4 = higher order policy pursued a goal highly incompatible with, or antagonistic to, conservation; 0 = higher order policy pursued a goal neutral to conservation; 4 = higher order policy pursued a highly ambitious conservation goal.
Code ‐99 if there was no higher order policy with goals concerning the issue of the DMP.
44. POL GOAL HEALTH s‐q [‐4..4] Policy goal human health: Degree to which an existing higher order policy pursued a human health goal related to the issue of the DMP. This variable is to be coded in rela‐tion to 39. HIGHER ORDER POL. If 39. HIGHER ORDER POL is 0, this variable can be coded in relation to other higher order policies named in 40. HIGHER ORDER POLICY DESCR.
Human health: To protect quality of (human) life through enhancing environmental factors beneficial to human health, and/ or mitigating environmental impacts and reme‐diating environmental problems detrimental to human health.
‐4 = higher order policy pursued a goal highly incompatible with, or antagonistic to, human health; 0 = higher order policy pursued a goal neutral to human health; 4 = higher order policy pursued a goal highly compatible with human health.
Code ‐99 if there was no higher order policy with goals concerning the issue of the DMP.
20
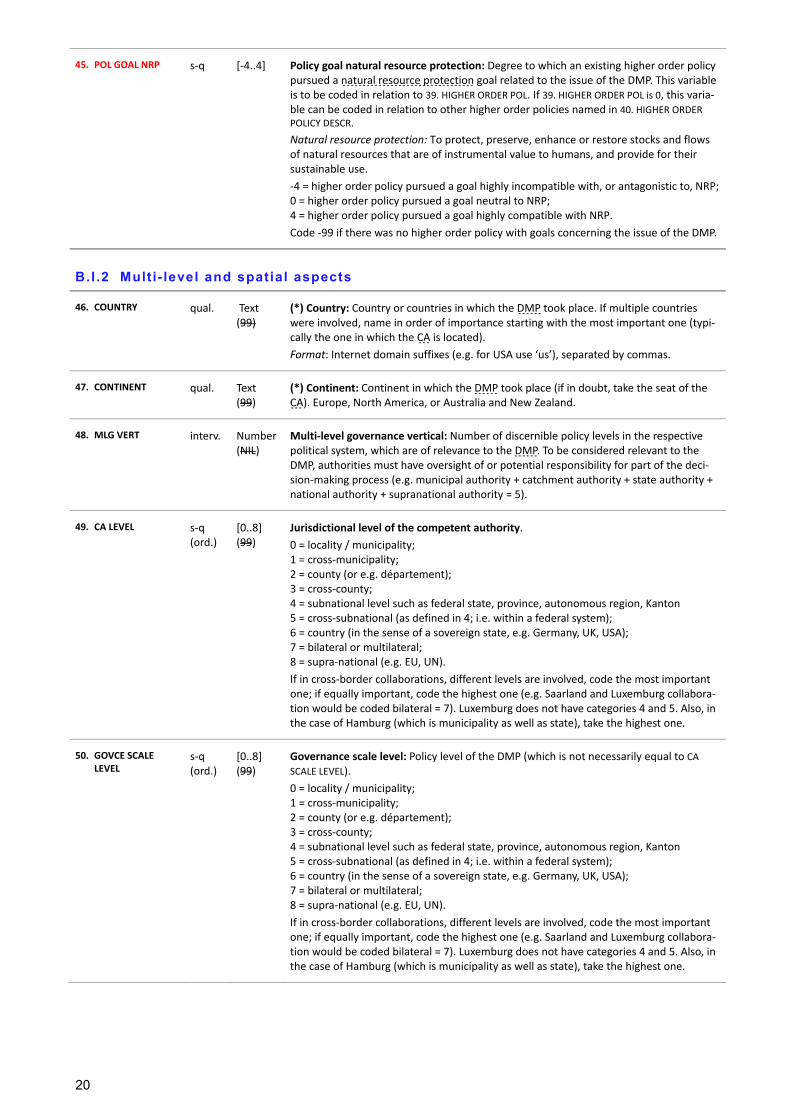
45. POL GOAL NRP s‐q [‐4..4] Policy goal natural resource protection: Degree to which an existing higher order policy pursued a natural resource protection goal related to the issue of the DMP. This variable is to be coded in relation to 39. HIGHER ORDER POL. If 39. HIGHER ORDER POL is 0, this varia‐ble can be coded in relation to other higher order policies named in 40. HIGHER ORDER POLICY DESCR.
Natural resource protection: To protect, preserve, enhance or restore stocks and flows of natural resources that are of instrumental value to humans, and provide for their sustainable use.
‐4 = higher order policy pursued a goal highly incompatible with, or antagonistic to, NRP; 0 = higher order policy pursued a goal neutral to NRP; 4 = higher order policy pursued a goal highly compatible with NRP.
Code ‐99 if there was no higher order policy with goals concerning the issue of the DMP.
B.I .2 Multi - level and spatial aspects
46. COUNTRY qual. Text (99)
(*) Country: Country or countries in which the DMP took place. If multiple countries were involved, name in order of importance starting with the most important one (typi‐cally the one in which the CA is located).
Format: Internet domain suffixes (e.g. for USA use ‘us’), separated by commas.
47. CONTINENT qual. Text (99)
(*) Continent: Continent in which the DMP took place (if in doubt, take the seat of the CA). Europe, North America, or Australia and New Zealand.
48. MLG VERT interv. Number (NIL)
Multi‐level governance vertical: Number of discernible policy levels in the respective political system, which are of relevance to the DMP. To be considered relevant to the DMP, authorities must have oversight of or potential responsibility for part of the deci‐sion‐making process (e.g. municipal authority + catchment authority + state authority + national authority + supranational authority = 5).
49. CA LEVEL s‐q (ord.)
[0..8] (99)
Jurisdictional level of the competent authority.
0 = locality / municipality; 1 = cross‐municipality; 2 = county (or e.g. département); 3 = cross‐county; 4 = subnational level such as federal state, province, autonomous region, Kanton 5 = cross‐subnational (as defined in 4; i.e. within a federal system); 6 = country (in the sense of a sovereign state, e.g. Germany, UK, USA); 7 = bilateral or multilateral; 8 = supra‐national (e.g. EU, UN).
If in cross‐border collaborations, different levels are involved, code the most important one; if equally important, code the highest one (e.g. Saarland and Luxemburg collabora‐tion would be coded bilateral = 7). Luxemburg does not have categories 4 and 5. Also, in the case of Hamburg (which is municipality as well as state), take the highest one.
50. GOVCE SCALE LEVEL
s‐q (ord.)
[0..8] (99)
Governance scale level: Policy level of the DMP (which is not necessarily equal to CA SCALE LEVEL).
0 = locality / municipality; 1 = cross‐municipality; 2 = county (or e.g. département); 3 = cross‐county; 4 = subnational level such as federal state, province, autonomous region, Kanton 5 = cross‐subnational (as defined in 4; i.e. within a federal system); 6 = country (in the sense of a sovereign state, e.g. Germany, UK, USA); 7 = bilateral or multilateral; 8 = supra‐national (e.g. EU, UN).
If in cross‐border collaborations, different levels are involved, code the most important one; if equally important, code the highest one (e.g. Saarland and Luxemburg collabora‐tion would be coded bilateral = 7). Luxemburg does not have categories 4 and 5. Also, in the case of Hamburg (which is municipality as well as state), take the highest one.
21
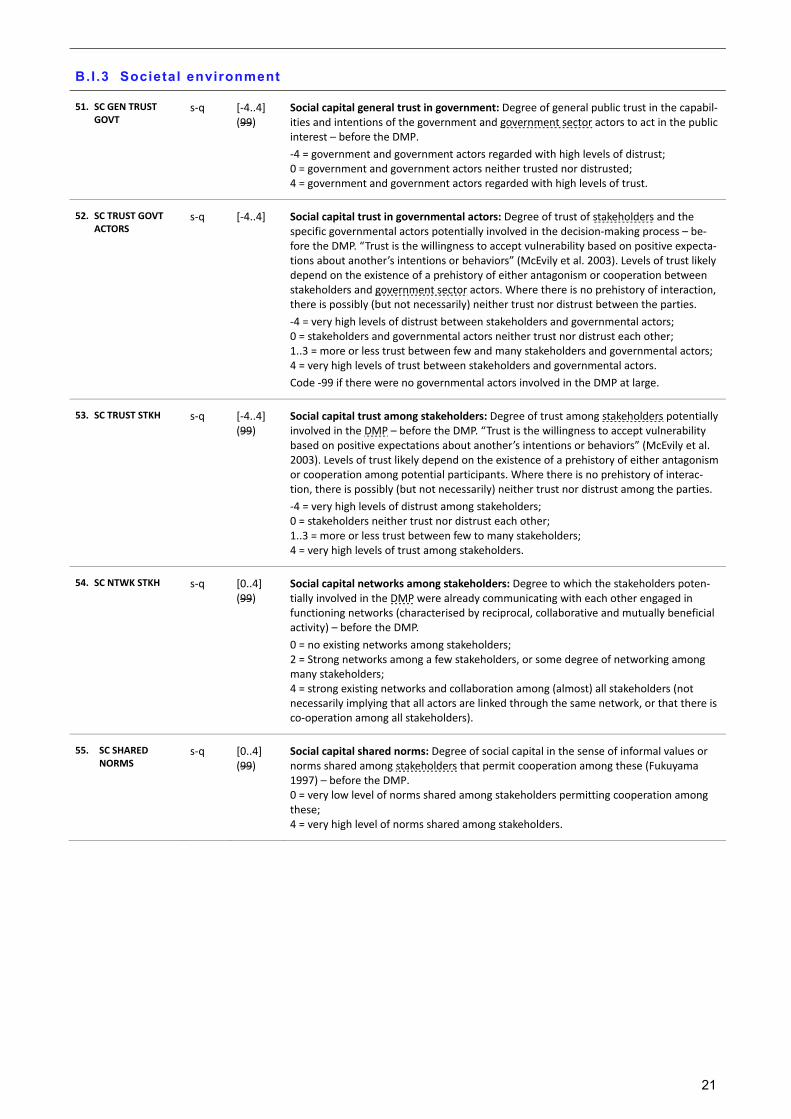
B.I .3 Societal environment
51. SC GEN TRUST GOVT
s‐q [‐4..4] (99)
Social capital general trust in government: Degree of general public trust in the capabil‐ities and intentions of the government and government sector actors to act in the public interest – before the DMP.
‐4 = government and government actors regarded with high levels of distrust; 0 = government and government actors neither trusted nor distrusted; 4 = government and government actors regarded with high levels of trust.
52. SC TRUST GOVT ACTORS
s‐q [‐4..4] Social capital trust in governmental actors: Degree of trust of stakeholders and the specific governmental actors potentially involved in the decision‐making process – be‐fore the DMP. “Trust is the willingness to accept vulnerability based on positive expecta‐tions about another’s intentions or behaviors” (McEvily et al. 2003). Levels of trust likely depend on the existence of a prehistory of either antagonism or cooperation between stakeholders and government sector actors. Where there is no prehistory of interaction, there is possibly (but not necessarily) neither trust nor distrust between the parties.
‐4 = very high levels of distrust between stakeholders and governmental actors; 0 = stakeholders and governmental actors neither trust nor distrust each other; 1..3 = more or less trust between few and many stakeholders and governmental actors; 4 = very high levels of trust between stakeholders and governmental actors.
Code ‐99 if there were no governmental actors involved in the DMP at large.
53. SC TRUST STKH s‐q [‐4..4] (99)
Social capital trust among stakeholders: Degree of trust among stakeholders potentially involved in the DMP – before the DMP. “Trust is the willingness to accept vulnerability based on positive expectations about another’s intentions or behaviors” (McEvily et al. 2003). Levels of trust likely depend on the existence of a prehistory of either antagonism or cooperation among potential participants. Where there is no prehistory of interac‐tion, there is possibly (but not necessarily) neither trust nor distrust among the parties.
‐4 = very high levels of distrust among stakeholders; 0 = stakeholders neither trust nor distrust each other; 1..3 = more or less trust between few to many stakeholders; 4 = very high levels of trust among stakeholders.
54. SC NTWK STKH s‐q [0..4] (99)
Social capital networks among stakeholders: Degree to which the stakeholders poten‐tially involved in the DMP were already communicating with each other engaged in functioning networks (characterised by reciprocal, collaborative and mutually beneficial activity) – before the DMP.
0 = no existing networks among stakeholders; 2 = Strong networks among a few stakeholders, or some degree of networking among many stakeholders; 4 = strong existing networks and collaboration among (almost) all stakeholders (not necessarily implying that all actors are linked through the same network, or that there is co‐operation among all stakeholders).
55. SC SHARED NORMS
s‐q [0..4] (99)
Social capital shared norms: Degree of social capital in the sense of informal values or norms shared among stakeholders that permit cooperation among these (Fukuyama 1997) – before the DMP. 0 = very low level of norms shared among stakeholders permitting cooperation among these; 4 = very high level of norms shared among stakeholders.
22
56. PARTN CULT s‐q [0..4] (99)
Participation culture: Degree to which participation and cooperation were accepted as appropriate means to resolve social and political conflicts and make public decisions, at the scale of the DMP. In assessing participation culture, consider the following elements (Note: these elements need not all be present to justify a high code):
Legal requirement to adopt cooperative conflict resolution;
Scope to apply participatory procedures across a variety of political and social areas (ranging from singular policy areas to the wider political system as under conditions of neocorporatism or deliberative democracy);
Degree of NSA involvement in public policy‐making (ranging from information rights to consultation to participation rights);
Degree of public acceptance of participation and cooperation as decision‐making procedures;
Length of participatory tradition.
0 = absence of participation culture;
4 = long‐standing and strong tradition of public participation.
57. GREEN CULT s‐q [0..4] (99)
Green culture: Degree to which the societal context was characterised by a culture of environmental awareness, at the scale of the DMP. This variable estimates the extent to which environmental and sustainability concerns were present in the public conscious‐ness and inform community action and decision‐making. In assessing environmental awareness, consider the following elements (Note: these elements need not all be present to justify a high code):
Public awareness of environmental laws and regulations, and understanding of rights, interests, duties and responsibilities with respect to these laws and regulations, and the social, environmental and economic consequences of non‐compliance;
Prevalence of social action and environmental campaigns at the community level;
Prevalence of environmental awareness‐raising by public sector authorities, environmental NGOs or interest groups;
Coverage of environmental issues in local and national mainstream media and community media.
0 = absence of a culture of environmental awareness; 4 = strong culture of environmental awareness.
B.II ENVIRONMENTAL ISSUE
58. ISSUE DESCR qual. Text area
(rel)
Issue description: Brief description of the environmental issue at stake. Describe what was at stake for environmental quality. If there was disagreement among actors, de‐scribe multiple perspectives.
59. ISSUE PERCEP CONS
s‐q [0..4] (99)
Issue perception conservation: Degree to which conservation was perceived as im‐portant by stakeholders.
Conservation: To preserve, protect or restore the natural environment and ecosystems (including the atmosphere, biodiversity, terrestrial and aquatic habitats, and flora and fauna) largely independently of their instrumental value to humankind.
0 = conservation not perceived as important by stakeholders; 2 = conservation perceived as very important by a few stakeholders, or somewhat im‐portant by most stakeholders; 4 = conservation perceived as very important by most stakeholders.
60. ISSUE PERCEP HEALTH
s‐q [0..4] (99)
Issue perception human health: Degree to which human health was perceived as im‐portant by stakeholders.
Human health: To protect quality of (human) life through enhancing environmental factors beneficial to human health, and/ or mitigating environmental impacts and reme‐diating environmental problems detrimental to human health.
0 = human health not perceived as important by stakeholders; 2 = human health perceived as very important by a few stakeholders, or somewhat important by most stakeholders; 4 = human health perceived as very important by most stakeholders.
23
61. ISSUE PERCEP NRP s‐q [0..4] (99)
Issue perception natural resource protection: Degree to which natural resource protec‐tion was perceived as important by stakeholders. Natural resource protection: To protect, preserve, enhance or restore stocks and flows of natural resources that are of instrumental value to humans, and provide for their sustainable use. 0 = Natural resource protection not perceived as important by stakeholders; 2 = Natural resource protection perceived as very important by a few stakeholders, or somewhat important by most stakeholders; 4 = Natural resource protection perceived as very important by most stakeholders.
62. ENVI IMPT CONS s‐q [0..4] (99)
Environmental importance conservation: Degree to which the environmental issue at stake has a potential conservation impact.
Conservation: To preserve, protect or restore the natural environment and ecosystems (including the atmosphere, biodiversity, terrestrial and aquatic habitats, and flora and fauna) largely independently of their instrumental value to humankind.
Comparing across cases, provide the scale of the potential conservation impact, consid‐ering a spatial scale from the local to the global, and taking into account temporal scope and irreversibility of the impact.
0 = low and/or short‐term potential conservation impact of restricted scope; 2 = low and/or short‐term impact of global scope, or high and/or long‐term impact of very restricted scope; 4 = very high and/or long‐term potential conservation impact of global scope.
63. ENVI IMPT HEALTH s‐q [0..4] (99)
Environmental importance human health: Degree to which the environmental issue at stake has a potential human health impact. Human health: To protect quality of (human) life through enhancing environmental factors beneficial to human health, and/ or mitigating environmental impacts and reme‐diating environmental problems detrimental to human health.
Comparing across cases, provide the scale of the potential human health impact, con‐sidering a spatial scale from the local to the global, and taking into account temporal scope and irreversibility of the impact.
0 = low and/or short‐term potential human health impact of restricted scope; 2 = low and/or short‐term impact of global scope, or high and/or long‐term impact of very restricted scope; 4 = very high and/or long‐term potential human health impact of global scope.
64. ENVI IMPT NRP s‐q [0..4] (99)
Environmental importance natural resource protection: Degree to which the environ‐mental issue at stake has a potential NRP impact.
Natural resource protection: To protect, preserve, enhance or restore stocks and flows of natural resources that are of instrumental value to humans, and provide for their sustainable use.
Comparing across cases, provide the scale of the potential NRP impact, considering a spatial scale from the local to the global, and taking into account temporal scope and irreversibility of the impact.
0 = low and/or short‐term potential NRP impact of restricted scope; 2 = low and/or short‐term impact of global scope, or high and/or long‐term impact of very restricted scope; 4 = very high and/or long‐term potential NRP impact of global scope.
65. TECH COMPLEX s‐q [0..4] (99)
Technical complexity: Degree to which the key environmental issue at stake in the DMP is difficult to understand and process intellectually. In the context of this variable, the issue is taken to include underlying causes, actual or potential impacts, and possible means to mitigate or enhance these impacts. The notion of complexity includes both the range of associated phenomena that need to be considered in order to comprehend the issue, and the level of expertise, education or specialist knowledge required to make sense of the issue.
0 = low complexity (environmental issue easy to understand); 2 = moderate complexity; 4 = high level of complexity (environmental issue difficult to understand).
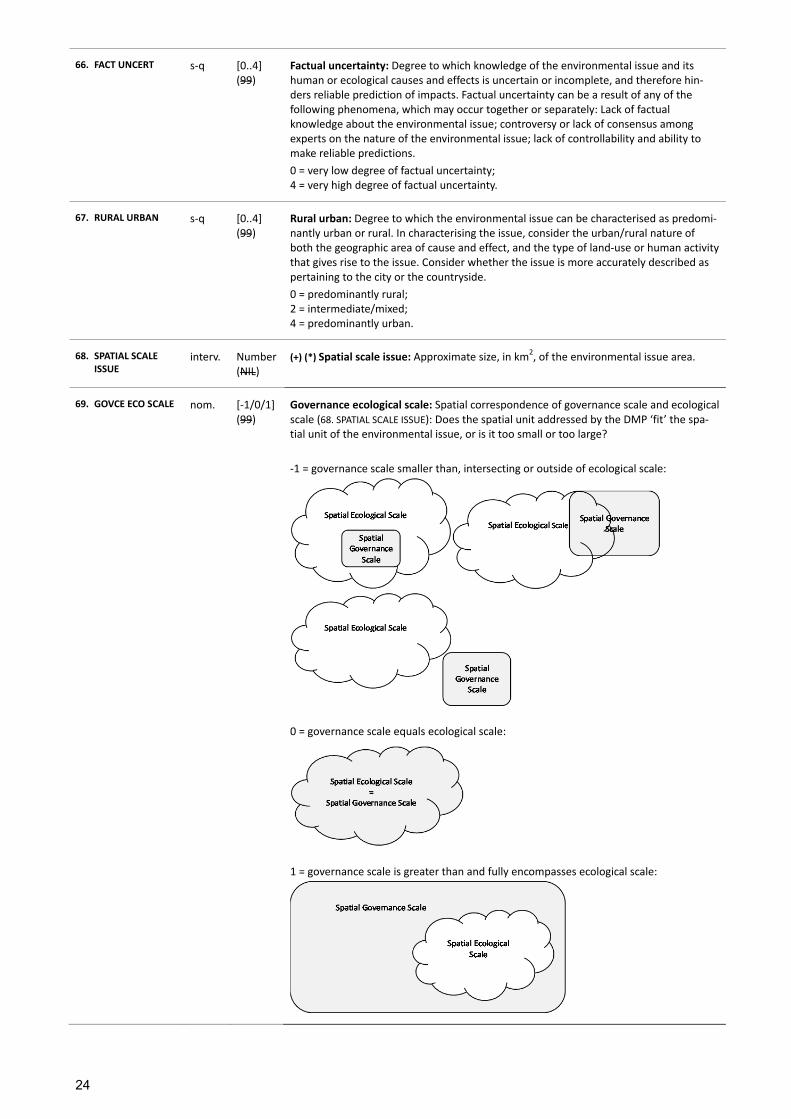
24
66. FACT UNCERT s‐q [0..4] (99)
Factual uncertainty: Degree to which knowledge of the environmental issue and its human or ecological causes and effects is uncertain or incomplete, and therefore hin‐ders reliable prediction of impacts. Factual uncertainty can be a result of any of the following phenomena, which may occur together or separately: Lack of factual knowledge about the environmental issue; controversy or lack of consensus among experts on the nature of the environmental issue; lack of controllability and ability to make reliable predictions.
0 = very low degree of factual uncertainty; 4 = very high degree of factual uncertainty.
67. RURAL URBAN s‐q [0..4] (99)
Rural urban: Degree to which the environmental issue can be characterised as predomi‐nantly urban or rural. In characterising the issue, consider the urban/rural nature of both the geographic area of cause and effect, and the type of land‐use or human activity that gives rise to the issue. Consider whether the issue is more accurately described as pertaining to the city or the countryside.
0 = predominantly rural; 2 = intermediate/mixed; 4 = predominantly urban.
68. SPATIAL SCALE ISSUE
interv. Number (NIL)
(+) (*) Spatial scale issue: Approximate size, in km2, of the environmental issue area.
69. GOVCE ECO SCALE
nom. [‐1/0/1] (99)
Governance ecological scale: Spatial correspondence of governance scale and ecological scale (68. SPATIAL SCALE ISSUE): Does the spatial unit addressed by the DMP ‘fit’ the spa‐tial unit of the environmental issue, or is it too small or too large?
‐1 = governance scale smaller than, intersecting or outside of ecological scale:
0 = governance scale equals ecological scale:
1 = governance scale is greater than and fully encompasses ecological scale:
25
70. SPILL POLLUTION s‐q [0..4] (99)
Spillovers pollution: Degree to which what is potentially or actually at stake in the DMP implies pollution spillovers beyond the policy scale of the DMP, as in 50. GOVCE SCALE LEVEL.
A pollution spillover occurs with the movement of pollutants across jurisdictional boundaries (Stewart 1992: 45). In coding, consider both the severity and the geograph‐ical scope of the pollution spillover.
0 = no potential or actual pollution spillover; 2 = moderate potential or actual pollution spillover; 4 = significant potential or actual pollution spillover.
71. SPILL CONS s‐q [0..4] (99)
Spillovers conservation: Degree to which what is potentially or actually at stake in the DMP implies conservation spillovers beyond the policy scale of the DMP, as in 50. GOVCE SCALE LEVEL.
A conservation spillover occurs when the conservation or protection of an ecologically significant resource has benefits for parties across jurisdictional boundaries (Stewart 1992: 45). The ecological resource may, for example, provide ecosystem services or hold existence value for parties beyond the jurisdiction of the CA.
0 = no potential or actual conservation spillover; 2 = moderate potential or actual conservation spillover; 4 = significant potential or actual conservation spillover.
72. SPILL RACE TOP s‐q [0..4] (99)
Competitive spillovers ‘race to the top’: Degree to which what is potentially or actually at stake in the DMP implies environmentally positive competitive spillovers in the sense of a ‘race to the top’ beyond the policy scale of the DMP, as in 50. GOVCE SCALE LEVEL.
Competitive spillovers occur when multiple (potentially distant) jurisdictions compete on environmental regulatory standards in order to gain a competitive advantage, thus influencing each other’s environmental regulation. Competitive spillovers with positive environmental impacts (‘race to the top’) occur when competition drives jurisdictions to increase environmental standards (e.g. when competing for tourists who favour higher environmental standards) (Stewart 1992: 45; Benson & Jordan 2010: 10).
0 = no positive potential or actual competitive spillover; 2 = moderate positive potential or actual conservation spillover; 4 = competitive potential or actual spillover strongly positive for environmental stand‐ards (‘race to the top’).
73. SPILL RACE BOTTOM
s‐q [0..4] (99)
Competitive spillovers ‘race to the bottom’: Degree to which what is potentially or actually at stake in the DMP implies environmentally negative competitive spillovers in the sense of a ‘race to the bottom’ beyond the policy scale of the DMP, as in 50. GOVCE SCALE LEVEL.
Competitive spillovers occur when multiple (potentially distant) jurisdictions compete on environmental regulatory standards in order to gain a competitive advantage, thus influencing each other’s environmental regulation. Competitive spillovers with negative environmental impacts (‘race to the bottom’) occur when competition drives jurisdic‐tions to lower environmental standards (e.g. when competing for industry investments that favour lower environmental standards). (Stewart 1992: 45; Benson & Jordan 2010: 10)
0 = no negative potential or actual competitive spillover; 2 = moderate negative potential or actual conservation spillover; 4 = competitive potential or actual spillover strongly negative for environmental stand‐ards (‘race to the bottom’).
74. PREVIOUS ATTEMPT
bin. [0/1] (99)
Previous attempt: Had there been a previous ‘unsuccessful’ attempt at resolving the issue at stake (perhaps framed slightly differently)? ‘Unsuccessful’ means that either no output or an insufficient output was produced or that an output was not accepted, implemented or complied with, and that therefore a new attempt was made which led to the current DMP.
0 = no; 1 = yes.
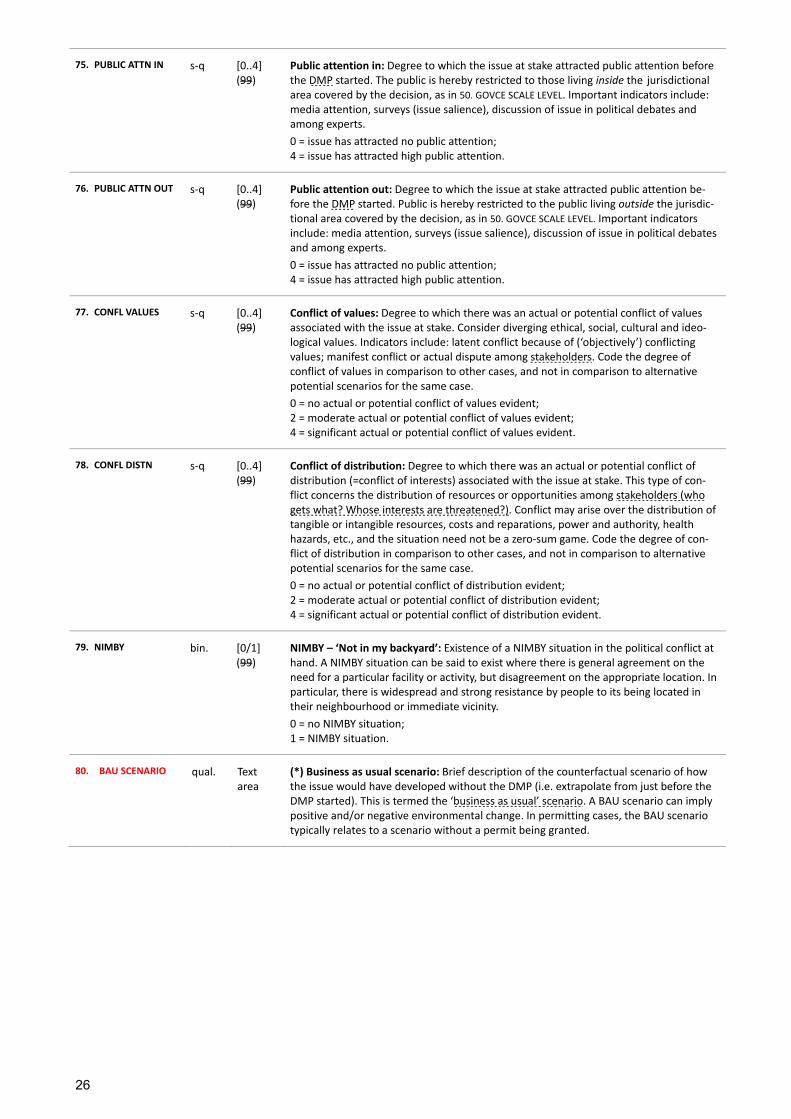
26
75. PUBLIC ATTN IN s‐q [0..4] (99)
Public attention in: Degree to which the issue at stake attracted public attention before the DMP started. The public is hereby restricted to those living inside the jurisdictional area covered by the decision, as in 50. GOVCE SCALE LEVEL. Important indicators include: media attention, surveys (issue salience), discussion of issue in political debates and among experts.
0 = issue has attracted no public attention; 4 = issue has attracted high public attention.
76. PUBLIC ATTN OUT s‐q [0..4] (99)
Public attention out: Degree to which the issue at stake attracted public attention be‐fore the DMP started. Public is hereby restricted to the public living outside the jurisdic‐tional area covered by the decision, as in 50. GOVCE SCALE LEVEL. Important indicators include: media attention, surveys (issue salience), discussion of issue in political debates and among experts.
0 = issue has attracted no public attention; 4 = issue has attracted high public attention.
77. CONFL VALUES s‐q [0..4] (99)
Conflict of values: Degree to which there was an actual or potential conflict of values associated with the issue at stake. Consider diverging ethical, social, cultural and ideo‐logical values. Indicators include: latent conflict because of (‘objectively’) conflicting values; manifest conflict or actual dispute among stakeholders. Code the degree of conflict of values in comparison to other cases, and not in comparison to alternative potential scenarios for the same case.
0 = no actual or potential conflict of values evident; 2 = moderate actual or potential conflict of values evident; 4 = significant actual or potential conflict of values evident.
78. CONFL DISTN s‐q [0..4] (99)
Conflict of distribution: Degree to which there was an actual or potential conflict of distribution (=conflict of interests) associated with the issue at stake. This type of con‐flict concerns the distribution of resources or opportunities among stakeholders (who gets what? Whose interests are threatened?). Conflict may arise over the distribution of tangible or intangible resources, costs and reparations, power and authority, health hazards, etc., and the situation need not be a zero‐sum game. Code the degree of con‐flict of distribution in comparison to other cases, and not in comparison to alternative potential scenarios for the same case.
0 = no actual or potential conflict of distribution evident; 2 = moderate actual or potential conflict of distribution evident; 4 = significant actual or potential conflict of distribution evident.
79. NIMBY bin. [0/1] (99)
NIMBY – ‘Not in my backyard’: Existence of a NIMBY situation in the political conflict at hand. A NIMBY situation can be said to exist where there is general agreement on the need for a particular facility or activity, but disagreement on the appropriate location. In particular, there is widespread and strong resistance by people to its being located in their neighbourhood or immediate vicinity.
0 = no NIMBY situation; 1 = NIMBY situation.
80. BAU SCENARIO qual. Text area
(*) Business as usual scenario: Brief description of the counterfactual scenario of how the issue would have developed without the DMP (i.e. extrapolate from just before the DMP started). This is termed the ‘business as usual’ scenario. A BAU scenario can imply positive and/or negative environmental change. In permitting cases, the BAU scenario typically relates to a scenario without a permit being granted.
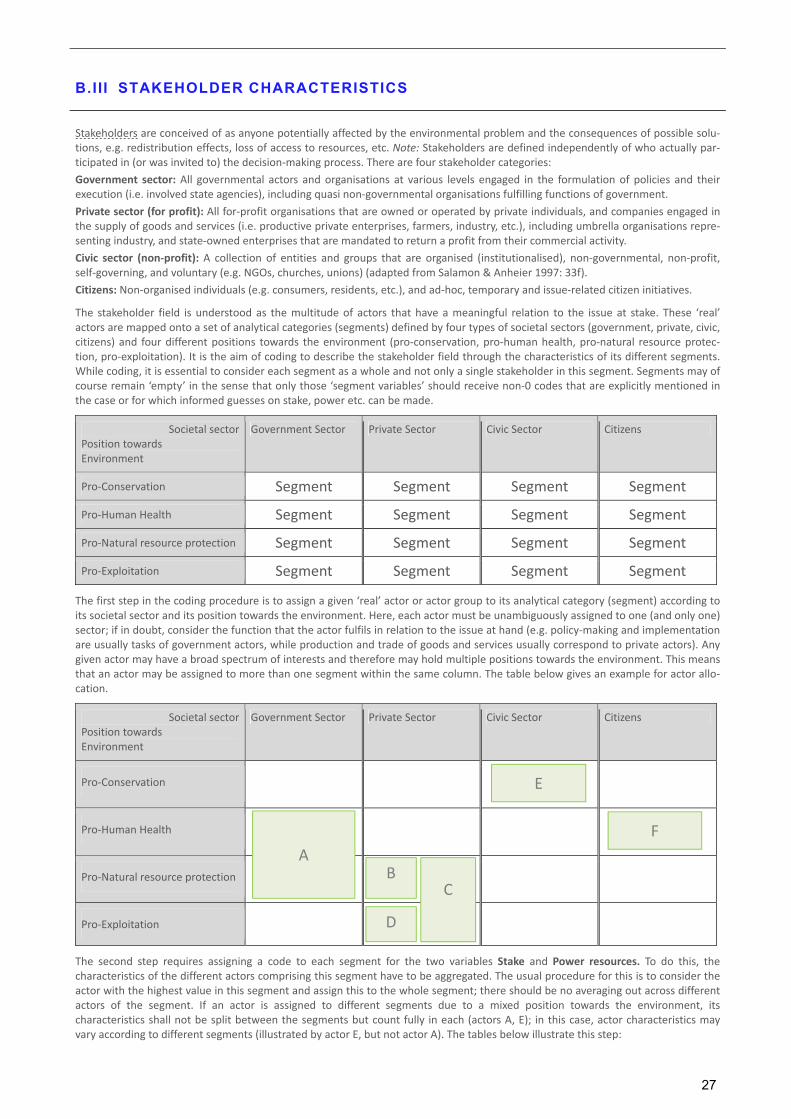
27
B.III STAKEHOLDER CHARACTERISTICS
Stakeholders are conceived of as anyone potentially affected by the environmental problem and the consequences of possible solu‐tions, e.g. redistribution effects, loss of access to resources, etc. Note: Stakeholders are defined independently of who actually par‐ticipated in (or was invited to) the decision‐making process. There are four stakeholder categories:
Government sector: All governmental actors and organisations at various levels engaged in the formulation of policies and their execution (i.e. involved state agencies), including quasi non‐governmental organisations fulfilling functions of government.
Private sector (for profit): All for‐profit organisations that are owned or operated by private individuals, and companies engaged in the supply of goods and services (i.e. productive private enterprises, farmers, industry, etc.), including umbrella organisations repre‐senting industry, and state‐owned enterprises that are mandated to return a profit from their commercial activity.
Civic sector (non‐profit): A collection of entities and groups that are organised (institutionalised), non‐governmental, non‐profit, self‐governing, and voluntary (e.g. NGOs, churches, unions) (adapted from Salamon & Anheier 1997: 33f).
Citizens: Non‐organised individuals (e.g. consumers, residents, etc.), and ad‐hoc, temporary and issue‐related citizen initiatives.
The stakeholder field is understood as the multitude of actors that have a meaningful relation to the issue at stake. These ‘real’ actors are mapped onto a set of analytical categories (segments) defined by four types of societal sectors (government, private, civic, citizens) and four different positions towards the environment (pro‐conservation, pro‐human health, pro‐natural resource protec‐tion, pro‐exploitation). It is the aim of coding to describe the stakeholder field through the characteristics of its different segments. While coding, it is essential to consider each segment as a whole and not only a single stakeholder in this segment. Segments may of course remain ‘empty’ in the sense that only those ‘segment variables’ should receive non‐0 codes that are explicitly mentioned in the case or for which informed guesses on stake, power etc. can be made.
Societal sectorPosition towards Environment
Government Sector Private Sector Civic Sector Citizens
Pro‐Conservation Segment Segment Segment Segment
Pro‐Human Health Segment Segment Segment Segment
Pro‐Natural resource protection Segment Segment Segment Segment
Pro‐Exploitation Segment Segment Segment Segment
The first step in the coding procedure is to assign a given ‘real’ actor or actor group to its analytical category (segment) according to its societal sector and its position towards the environment. Here, each actor must be unambiguously assigned to one (and only one) sector; if in doubt, consider the function that the actor fulfils in relation to the issue at hand (e.g. policy‐making and implementation are usually tasks of government actors, while production and trade of goods and services usually correspond to private actors). Any given actor may have a broad spectrum of interests and therefore may hold multiple positions towards the environment. This means that an actor may be assigned to more than one segment within the same column. The table below gives an example for actor allo‐cation.
Societal sectorPosition towards Environment
Government Sector Private Sector Civic Sector Citizens
Pro‐Conservation Segment
Pro‐Human Health Segment Segment
Pro‐Natural resource protection Segment
Pro‐Exploitation
The second step requires assigning a code to each segment for the two variables Stake and Power resources. To do this, the characteristics of the different actors comprising this segment have to be aggregated. The usual procedure for this is to consider the actor with the highest value in this segment and assign this to the whole segment; there should be no averaging out across different actors of the segment. If an actor is assigned to different segments due to a mixed position towards the environment, its characteristics shall not be split between the segments but count fully in each (actors A, E); in this case, actor characteristics may vary according to different segments (illustrated by actor E, but not actor A). The tables below illustrate this step:
E
F
D
A
BC
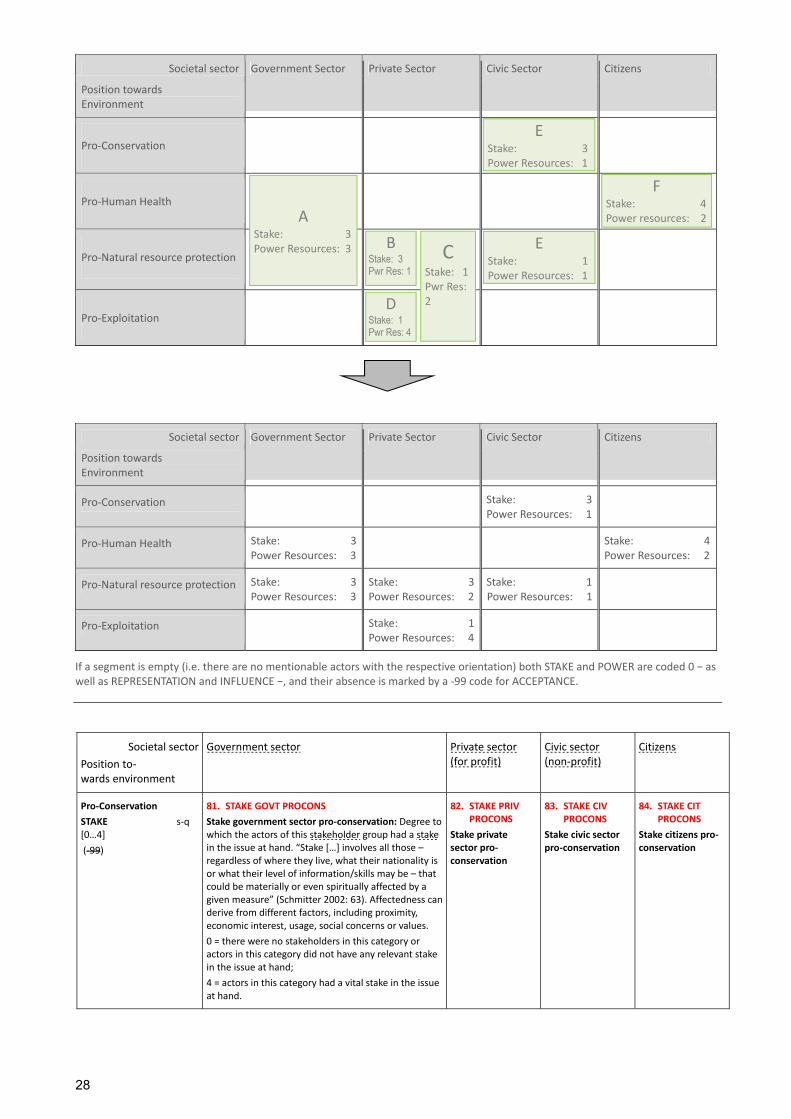
28
Societal sector Government Sector Private Sector Civic Sector Citizens
Position towards Environment
Pro‐Conservation
Pro‐Human Health
Pro‐Natural resource protection
Pro‐Exploitation
Societal sector Government Sector Private Sector Civic Sector Citizens
Position towards Environment
Pro‐Conservation Stake: 3 Power Resources: 1
Pro‐Human Health Stake: 3Power Resources: 3
Stake: 4Power Resources: 2
Pro‐Natural resource protection Stake: 3Power Resources: 3
Stake: 3Power Resources: 2
Stake: 1 Power Resources: 1
Pro‐Exploitation Stake: 1Power Resources: 4
If a segment is empty (i.e. there are no mentionable actors with the respective orientation) both STAKE and POWER are coded 0 − as well as REPRESENTATION and INFLUENCE −, and their absence is marked by a ‐99 code for ACCEPTANCE.
Societal sector
Position to‐ wards environment
Government sector Private sector (for profit)
Civic sector (non‐profit)
Citizens
Pro‐Conservation
STAKE s‐q [0…4]
(‐99)
81. STAKE GOVT PROCONS
Stake government sector pro‐conservation: Degree to which the actors of this stakeholder group had a stake in the issue at hand. “Stake […] involves all those – regardless of where they live, what their nationality is or what their level of information/skills may be – that could be materially or even spiritually affected by a given measure” (Schmitter 2002: 63). Affectedness can derive from different factors, including proximity, economic interest, usage, social concerns or values.
0 = there were no stakeholders in this category or actors in this category did not have any relevant stake in the issue at hand;
4 = actors in this category had a vital stake in the issue at hand.
82. STAKE PRIV PROCONS
Stake private sector pro‐conservation
83. STAKE CIV PROCONS
Stake civic sector pro‐conservation
84. STAKE CIT PROCONS
Stake citizens pro‐conservation
E Stake: 3 Power Resources: 1
FStake: 4Power resources: 2
DStake: 1 Pwr Res: 4
A Stake: 3Power Resources: 3 B
Stake: 3 Pwr Res: 1
C Stake: 1Pwr Res: 2
E Stake: 1 Power Resources: 1
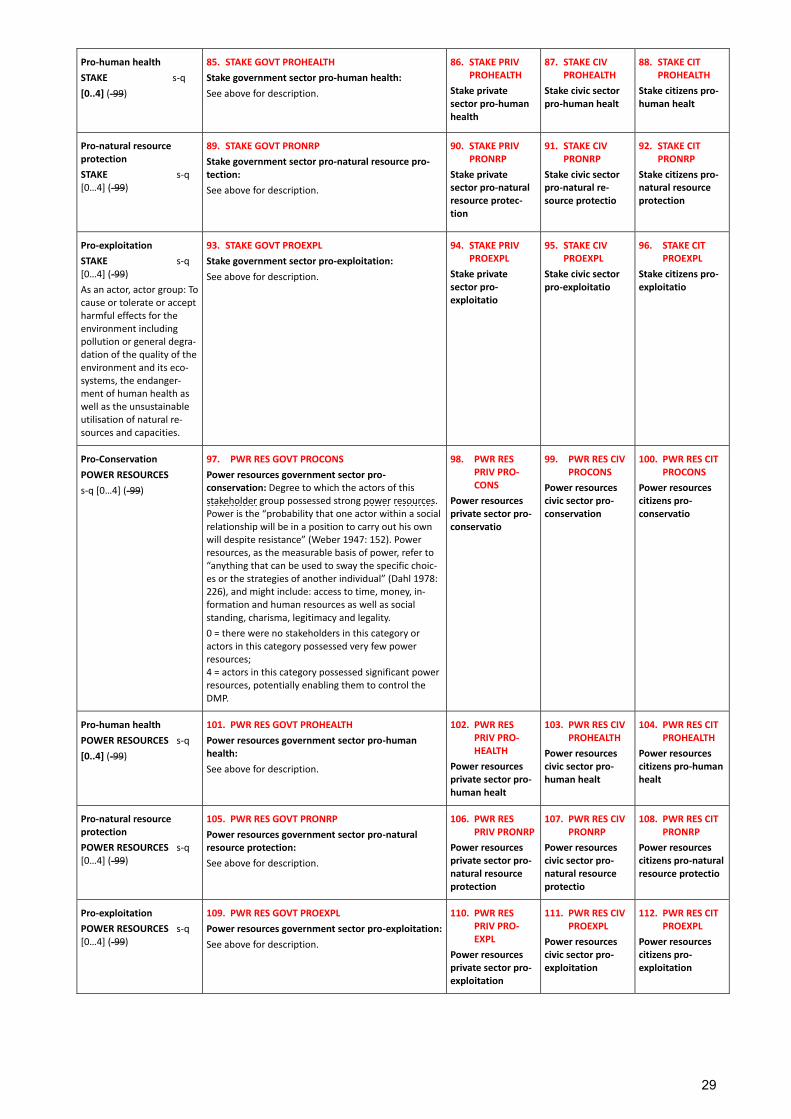
29
Pro‐human health
STAKE s‐q
[0..4] (‐99)
85. STAKE GOVT PROHEALTH
Stake government sector pro‐human health:
See above for description.
86. STAKE PRIV PROHEALTH
Stake private sector pro‐human health
87. STAKE CIV PROHEALTH
Stake civic sector pro‐human healt
88. STAKE CIT PROHEALTH
Stake citizens pro‐human healt
Pro‐natural resource protection
STAKE s‐q [0…4] (‐99)
89. STAKE GOVT PRONRP
Stake government sector pro‐natural resource pro‐tection:
See above for description.
90. STAKE PRIV PRONRP
Stake private sector pro‐natural resource protec‐tion
91. STAKE CIV PRONRP
Stake civic sector pro‐natural re‐source protectio
92. STAKE CIT PRONRP
Stake citizens pro‐ natural resource protection
Pro‐exploitation
STAKE s‐q [0…4] (‐99)
As an actor, actor group: To cause or tolerate or accept harmful effects for the environment including pollution or general degra‐dation of the quality of the environment and its eco‐systems, the endanger‐ment of human health as well as the unsustainable utilisation of natural re‐sources and capacities.
93. STAKE GOVT PROEXPL
Stake government sector pro‐exploitation:
See above for description.
94. STAKE PRIV PROEXPL
Stake private sector pro‐exploitatio
95. STAKE CIV PROEXPL
Stake civic sector pro‐exploitatio
96. STAKE CIT PROEXPL
Stake citizens pro‐exploitatio
Pro‐Conservation
POWER RESOURCES
s‐q [0…4] (‐99)
97. PWR RES GOVT PROCONS
Power resources government sector pro‐conservation: Degree to which the actors of this stakeholder group possessed strong power resources. Power is the “probability that one actor within a social relationship will be in a position to carry out his own will despite resistance” (Weber 1947: 152). Power resources, as the measurable basis of power, refer to “anything that can be used to sway the specific choic‐es or the strategies of another individual” (Dahl 1978: 226), and might include: access to time, money, in‐formation and human resources as well as social standing, charisma, legitimacy and legality.
0 = there were no stakeholders in this category or actors in this category possessed very few power resources; 4 = actors in this category possessed significant power resources, potentially enabling them to control the DMP.
98. PWR RES PRIV PRO‐CONS
Power resources private sector pro‐conservatio
99. PWR RES CIV PROCONS
Power resources civic sector pro‐conservation
100. PWR RES CIT PROCONS
Power resources citizens pro‐conservatio
Pro‐human health
POWER RESOURCES s‐q
[0..4] (‐99)
101. PWR RES GOVT PROHEALTH
Power resources government sector pro‐human health:
See above for description.
102. PWR RES PRIV PRO‐HEALTH
Power resources private sector pro‐human healt
103. PWR RES CIV PROHEALTH
Power resources civic sector pro‐human healt
104. PWR RES CIT PROHEALTH
Power resources citizens pro‐human healt
Pro‐natural resource protection
POWER RESOURCES s‐q [0…4] (‐99)
105. PWR RES GOVT PRONRP
Power resources government sector pro‐natural resource protection:
See above for description.
106. PWR RES PRIV PRONRP
Power resources private sector pro‐natural resource protection
107. PWR RES CIV PRONRP
Power resources civic sector pro‐natural resource protectio
108. PWR RES CIT PRONRP
Power resources citizens pro‐natural resource protectio
Pro‐exploitation
POWER RESOURCES s‐q [0…4] (‐99)
109. PWR RES GOVT PROEXPL
Power resources government sector pro‐exploitation:
See above for description.
110. PWR RES PRIV PRO‐EXPL
Power resources private sector pro‐exploitation
111. PWR RES CIV PROEXPL
Power resources civic sector pro‐exploitation
112. PWR RES CIT PROEXPL
Power resources citizens pro‐exploitation
30
113. PERCEIVED URGENCY
s‐q [0..4] (‐99)
Perceived urgency: Degree to which members of the public perceived the issue at hand as one requiring urgent attention and/or action.
Indicators: media coverage, bottom‐up debates in town halls, formation of neighbour‐hood initiatives, demonstrations, strikes and protests, public campaigns.
This variable has two dimensions: number of individual or organised actors that per‐ceived the issue as urgent, and the degree of urgency or significance of the issue identi‐fied.
0 = no one perceived the issue at hand as one of urgency; 2 = many members of the public perceived the issue at hand as one of moderate urgen‐cy, or some members of the public perceived the issue at hand as one of great urgency; 4 = many members of the public perceived the issue at hand as one of great urgency.
114. COOP PROCONS s‐q
[0..4]
Cooperativeness of pro‐conservation actors: Degree of cooperativeness of pro‐conservation actors.
Cooperativeness is an aggregate concept describing the willingness to engage in a col‐laborative process, to contribute information and to reach a compromise or consensus.
0 = pro‐conservation actors were not cooperative; 4 = pro‐conservation actors were fully cooperative.
Code ‐99 if stakeholder group not present.
115. COOP PROHEALTH
s‐q
[0..4]
Cooperativeness of pro‐health actors: Degree of cooperativeness of pro‐health actors.
Cooperativeness is an aggregate concept describing the willingness to engage in a col‐laborative process, to contribute information and to reach a compromise or consensus.
0 = pro‐health actors were not cooperative; 4 = pro‐health actors were fully cooperative.
Code ‐99 if stakeholder group not present.
116. COOP PRONRP s‐q
[0..4]
Cooperativeness of pro‐NRP actors: Degree of cooperativeness of pro‐NRP actors.
Cooperativeness is an aggregate concept describing the willingness to engage in a col‐laborative process, to contribute information and to reach a compromise or consensus.
0 = pro‐NRP actors were not cooperative; 4 = pro‐NRP actors were fully cooperative.
Code ‐99 if stakeholder group not present.
117. COOP PROEXPL s‐q
[0..4]
Cooperativeness of pro‐exploitation actors: Degree of cooperativeness of pro‐exploitation actors.
Cooperativeness is an aggregate concept describing the willingness to engage in a col‐laborative process, to contribute information and to reach a compromise or consensus.
0 = pro‐exploitation actors were not cooperative; 4 = pro‐exploitation actors were fully cooperative.
Code ‐99 if stakeholder group not present.
118. WIN WIN POT
s‐q [0..4] Win‐win potential: Degree of a win‐win potential (that was also recognised by at least one stakeholder) prior to the DMP. It does not matter how many stakeholders recog‐nised the potential, provided it was recognised by at least one. Decisive is the size or significance of the win‐win potential.
Win‐win (or Pareto optimal) solutions are those that provide gains (or at least: no losses) to all involved parties. These are always positive‐sum solutions compared to the non‐collaborative alternative. Win‐win solutions include solutions where compensation is provided to those who would otherwise suffer losses. Win‐win solutions are not neces‐sarily limited to the environmental issue at hand, but may be linked to alternative issues and competing interests on and off the table, as well as to future decisions (Wondolleck & Yaffee 2000: 50). 0 = there was no win‐win potential recognised by stakeholders; 2 = there was a moderate win‐win potential recognised by stakeholders; 4 = there was a significant win‐win potential meeting all stakeholders’ maximum expec‐tations.
31
C . P R O C E S S
Process variables relate to the whole DMP, that is, to all possible process types that were employed during the DMP. The DMP may be more or less participatory. Participation may occur through one or more participatory sub‐processes or elements within the DMP, but not through parallel processes external to or independent from the DMP.
C.I PROCESS DESIGN
Variables in this section assess the way in which the decision‐making process (and its participation possibilities) was designed and set up. Process design relates to all basic decisions on how the process should be set up (at any point before or during the DMP). Actual process may of course play out differently to how it was designed.. However, as process design is of course connected to the actual process, some of the variables in this section require consideration of features of the actual process.
C.I .1 Rationales and goals of the process
119. INITR NAME qual. Text
(99)
(*) Initiator name: Enter the name of the main formal process initiator – that is, the main organisation or group through whose action the decision‐making process was initiated.
120. INITR TYPE qual. Text (99)
Initiator type: Classify the main formal process initiator.
Enter the codes for, first, the respective actor group and, second, its environmental orientation. Separate codes by one single space (e.g. PRIV PROCONS).
Select the appropriate code for the actor group from this list and enter it in the text field:
GOVT = government sector; PRIV = private sector, for‐profit; CIV = civic sector, non‐profit; CIT = citizens, ad hoc citizen groups.
Select the appropriate code for the environmental orientation from this list and enter it in the text field:
PROCONS = Pro‐conservation; PROHEALTH = Pro‐human health; PRONRP = Pro‐natural resource protection; PROEXPL = Pro‐exploitation.
121. DMP INITN GOVT s‐q (ord.)
[0..8]
Decision‐making process initiation government: Administrative level of the government sector organisation that initiated or co‐initiated the DMP.
In the case that the DMP was initiated by government sector as well as non‐state actors, consider here only the government sector actor.
If initiated in (cross‐border) collaboration, where different levels were involved, code the most important one; if equally important, code the highest one (e.g. Saarland and Lux‐emburg collaboration would be coded bilateral = 7).
0 = locality / municipality; 1 = cross‐municipality; 2 = county (or e.g. département); 3 = cross‐county; 4 = subnational level such as federal state, province, autonomous region, Kanton 5 = cross‐subnational (as defined in 4; i.e. within a federal system); 6 = country (in the sense of a sovereign state, e.g. Germany, UK, USA); 7 = bilateral or multilateral; 8 = supra‐national (e.g. EU, UN).
Code ‐99 if the DMP was not initiated by a government sector organisation.
32
122. DMP INITN NSA s‐q [0..4] Decision‐making process initiation non‐state actor: Size of the non‐state organisation that initiated or co‐initiated the DMP.
Non‐state actors include civic sector and private sector actors, and individual citizens. Size refers here to the size of the organisation’s constituency or membership.
In the case that the DMP was initiated by non‐state as well as government sector actors, consider here only the non‐state actors.
0 = individual citizens that demanded a collective decision on a given problem; 1 = small scale, local non‐state organisation; 2 = medium scale and/or regionally active non‐state organisation; 4 = large scale, supra‐nationally operating organisation.
Code ‐99 if no non‐state actors were involved in the initiation of the DMP.
123. PP INITN GOVT s‐q (ord.)
[0..8]
Participatory process initiation government: Administrative level of the government sector organisation that initiated participation.
In the case that a PP was initiated by government sector as well as non‐state actors, consider here only the government sector actor. If initiated in (cross‐border) collabora‐tion, where different levels were involved, code the most important one; if equally im‐portant, code the highest one (e.g. Saarland and Luxemburg collaboration would be coded bilateral = 7).
0 = local / municipality; 1 = cross‐municipality; 2 = county; 3 = cross‐county; 4 = state; 5 = multi‐state (e.g. within a federal system); 6 = country; 7 = bilateral or multilateral; 8 = supra‐national (e.g. EU, UN).
Code ‐99 if no government sector organisation was involved in the initiation of participa‐tion, or if no PP took place.
124. PP INITN NSA s‐q [0..4] Participatory process initiation non‐state actors: Size of the non‐state organisation that initiated participation.
Non‐state actors include civic sector and private sector actors, and individual citizens. Size refers here to the size of the organisation’s constituency or membership.
In the case that a PP was initiated by non‐state as well as government sector actors, consider here only the non‐state actor.
0 = individual citizens that demanded the opportunity to participate in a DMP; 1 = small scale, local non‐state organisation; 2 = medium scale and/or regionally active non‐state organisation; 4 = large scale, supra‐nationally operating organisation.
Code ‐99 if no non‐state actor was involved in the initiation of participation, or if no PP took place.
125. INITR GOAL CONS s‐q [‐4..4] (99)
Initiator goal conservation: Degree to which the main formal process initiator, as speci‐fied in 119. INITR NAME, pursued an environmental conservation goal in the DMP, i.e. only code the position towards the DMP issue, not general goals.
‐4 = initiator pursued a goal highly incompatible with, or antagonistic to, conservation; ‐2 = initiator pursued a goal moderately incompatible with, or antagonistic to, conserva‐tion; 0 = initiator pursued a goal neutral to conservation; 2 = initiator pursued a moderately ambitious conservation goal; 4 = initiator pursued a highly ambitious conservation goal.
126. INITR GOAL HEALTH
s‐q [‐4..4] (99)
Initiator goal human health: Degree to which the main formal process initiator, as speci‐fied in 119. INITR NAME, pursued a human health protection goal in the DMP, i.e. only code the position towards the DMP issue, not general goals.
‐4 = initiator pursued a goal highly incompatible with, or antagonistic to, human health protection; ‐2 = initiator pursued a goal moderately incompatible with, or antagonistic to, human health protection; 0 = initiator pursued a goal neutral to human health protection; 2 = initiator pursued a goal moderately compatible with human health protection; 4 = initiator pursued a goal highly compatible with human health protection.
33
127. INITR GOAL NRP s‐q [‐4..4] (99)
Initiator goal natural resource protection: Degree to which the main formal process initiator, as specified in 119. INITR NAME, pursued a natural resource protection goal in the DMP, i.e. only code the position towards the DMP issue, not general goals.
‐4 = initiator pursued a goal highly incompatible with, or antagonistic to, NRP; ‐2 = initiator pursued a goal moderately incompatible with, or antagonistic to, NRP; 0 = initiator pursued a goal neutral to NRP; 2 = initiator pursued a goal moderately compatible with NRP; 4 = initiator pursued a goal highly compatible with NRP.
128. RAT EMPOWER s‐q [0..4] (99)
Rationale empowerment: Degree to which empowerment was an overall rationale for the chosen type of DMP.
Empowerment includes measures of public capacity building by means of information and education with the aim of “levelling the playing field between the public and the government”, and facilitating individual and collective public agency in the DMP (Stern & Fineberg 1996, cited in Beierle & Cayford 2002: 15).
0 = empowerment provided no rationale for the chosen type of DMP; 2 = empowerment provided a significant rationale for the chosen type of DMP; 4 = empowerment provided a very strong rationale for the chosen type of DMP.
129. RAT LEGITIMACY
s‐q [0..4] (99)
Rationale legitimacy: Degree to which (democratic) legitimacy was an overall rationale for the chosen type of DMP.
Legitimacy refers here to input‐legitimacy deriving from the consent of the public and the authentic expression of its will in the behaviour and decisions of the government (Wolf 2002). Public participation “provides a mechanism for obtaining the consent of the governed in more specific ways than are possible with elections. In the ideal case, public participation is a form of democracy in action, and its results are likely to be widely accepted as legitimate (Nonet, 1980)” (Dietz & Stern 2008: 2‐15).
Indicators include: acceptance, transparency, etc.
0 = legitimacy provided no rationale for the chosen type of DMP; 2 = legitimacy provided a significant rationale for the chosen type of DMP; 4 = legitimacy provided a very strong rationale for the chosen type of DMP.
130. RAT EFFECTIVE s‐q [0..4] (99)
Rationale effectiveness: Degree to which the effective achievement of specific substan‐tive goals (= outcomes as opposed to process) (e.g. environmental, social, economic), was an overall rationale for the chosen type of DMP.
0 = effective achievement of substantive goals provided no rationale for the chosen type of DMP; 2 = effective achievement of substantive goals provided a significant rationale for the chosen type of DMP; 4 = effective achievement of substantive goals provided a very strong rationale for the chosen type of DMP.
131. RAT ENVI s‐q [0..4] (99)
Rationale environmental benefit: Degree to which the achievement of environmental benefits was an overall rationale for the chosen type of DMP.
0 = achievement of environmental benefits provided no rationale for the chosen type of DMP; 2 = achievement of environmental benefits provided a significant rationale for the cho‐sen type of DMP; 4 = achievement of environmental benefits provided a very strong rationale for the chosen type of DMP.
This rationale is a sub‐rationale of 130. RAT EFFECTIVE meaning that 130. RAT EFFECTIVE is always coded at least as high as 131. RAT ENVI.
132. RAT LONGTERM EFFICIENCY
s‐q [0..4] (99)
Rationale long‐term efficiency: Degree to which long‐term efficiency was an overall rationale for the chosen type of DMP.
Long‐term efficiency refers to the achievement of lasting and more satisfactory deci‐sions, avoiding potential obstacles such as litigation and gridlock that characterise much environmental decision‐making (Susskind & Cruikshank 1987).
0 = long‐term efficiency provided no rationale for the chosen type of DMP; 2 = long‐term efficiency provided a significant rationale for the chosen type of DMP; 4 = long‐term efficiency provided a very strong rationale for the chosen type of DMP.
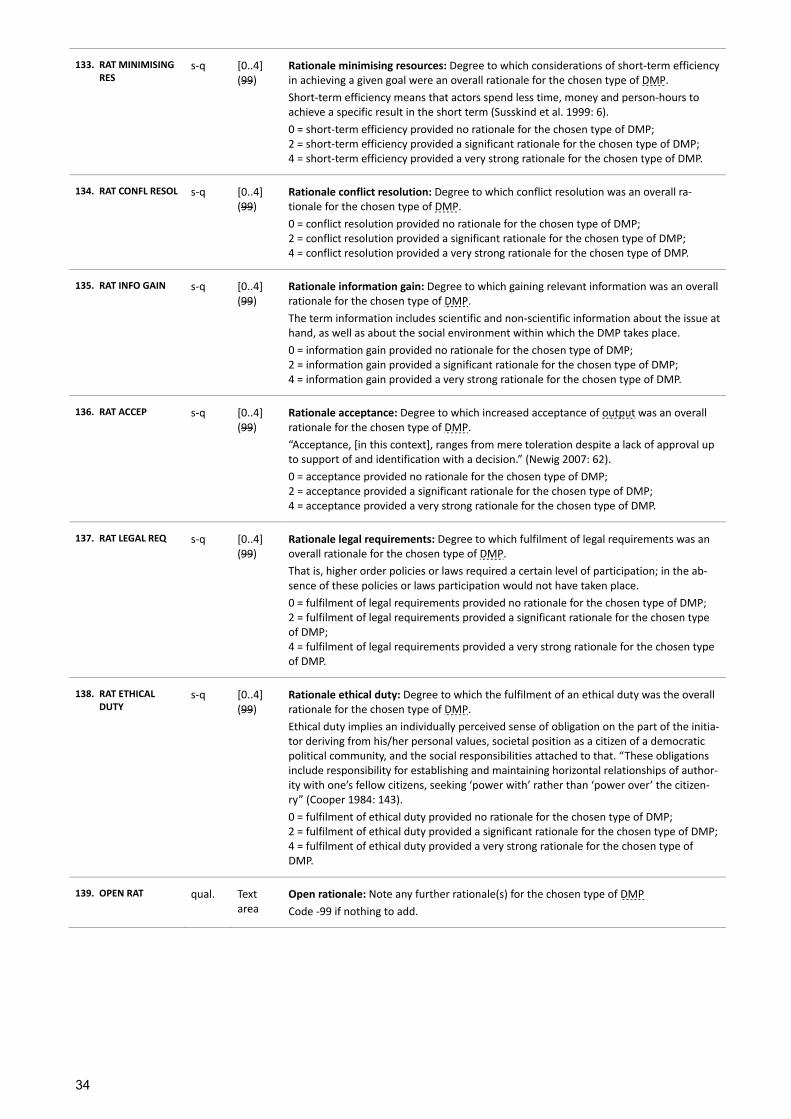
34
133. RAT MINIMISING RES
s‐q [0..4] (99)
Rationale minimising resources: Degree to which considerations of short‐term efficiency in achieving a given goal were an overall rationale for the chosen type of DMP.
Short‐term efficiency means that actors spend less time, money and person‐hours to achieve a specific result in the short term (Susskind et al. 1999: 6).
0 = short‐term efficiency provided no rationale for the chosen type of DMP; 2 = short‐term efficiency provided a significant rationale for the chosen type of DMP; 4 = short‐term efficiency provided a very strong rationale for the chosen type of DMP.
134. RAT CONFL RESOL s‐q [0..4] (99)
Rationale conflict resolution: Degree to which conflict resolution was an overall ra‐tionale for the chosen type of DMP.
0 = conflict resolution provided no rationale for the chosen type of DMP; 2 = conflict resolution provided a significant rationale for the chosen type of DMP; 4 = conflict resolution provided a very strong rationale for the chosen type of DMP.
135. RAT INFO GAIN s‐q [0..4] (99)
Rationale information gain: Degree to which gaining relevant information was an overall rationale for the chosen type of DMP.
The term information includes scientific and non‐scientific information about the issue at hand, as well as about the social environment within which the DMP takes place.
0 = information gain provided no rationale for the chosen type of DMP; 2 = information gain provided a significant rationale for the chosen type of DMP; 4 = information gain provided a very strong rationale for the chosen type of DMP.
136. RAT ACCEP s‐q [0..4] (99)
Rationale acceptance: Degree to which increased acceptance of output was an overall rationale for the chosen type of DMP.
“Acceptance, [in this context], ranges from mere toleration despite a lack of approval up to support of and identification with a decision.” (Newig 2007: 62).
0 = acceptance provided no rationale for the chosen type of DMP; 2 = acceptance provided a significant rationale for the chosen type of DMP; 4 = acceptance provided a very strong rationale for the chosen type of DMP.
137. RAT LEGAL REQ s‐q [0..4] (99)
Rationale legal requirements: Degree to which fulfilment of legal requirements was an overall rationale for the chosen type of DMP.
That is, higher order policies or laws required a certain level of participation; in the ab‐sence of these policies or laws participation would not have taken place.
0 = fulfilment of legal requirements provided no rationale for the chosen type of DMP; 2 = fulfilment of legal requirements provided a significant rationale for the chosen type of DMP; 4 = fulfilment of legal requirements provided a very strong rationale for the chosen type of DMP.
138. RAT ETHICAL DUTY
s‐q [0..4] (99)
Rationale ethical duty: Degree to which the fulfilment of an ethical duty was the overall rationale for the chosen type of DMP.
Ethical duty implies an individually perceived sense of obligation on the part of the initia‐tor deriving from his/her personal values, societal position as a citizen of a democratic political community, and the social responsibilities attached to that. “These obligations include responsibility for establishing and maintaining horizontal relationships of author‐ity with one’s fellow citizens, seeking ‘power with’ rather than ‘power over’ the citizen‐ry” (Cooper 1984: 143).
0 = fulfilment of ethical duty provided no rationale for the chosen type of DMP; 2 = fulfilment of ethical duty provided a significant rationale for the chosen type of DMP;4 = fulfilment of ethical duty provided a very strong rationale for the chosen type of DMP.
139. OPEN RAT qual. Text area
Open rationale: Note any further rationale(s) for the chosen type of DMP
Code ‐99 if nothing to add.
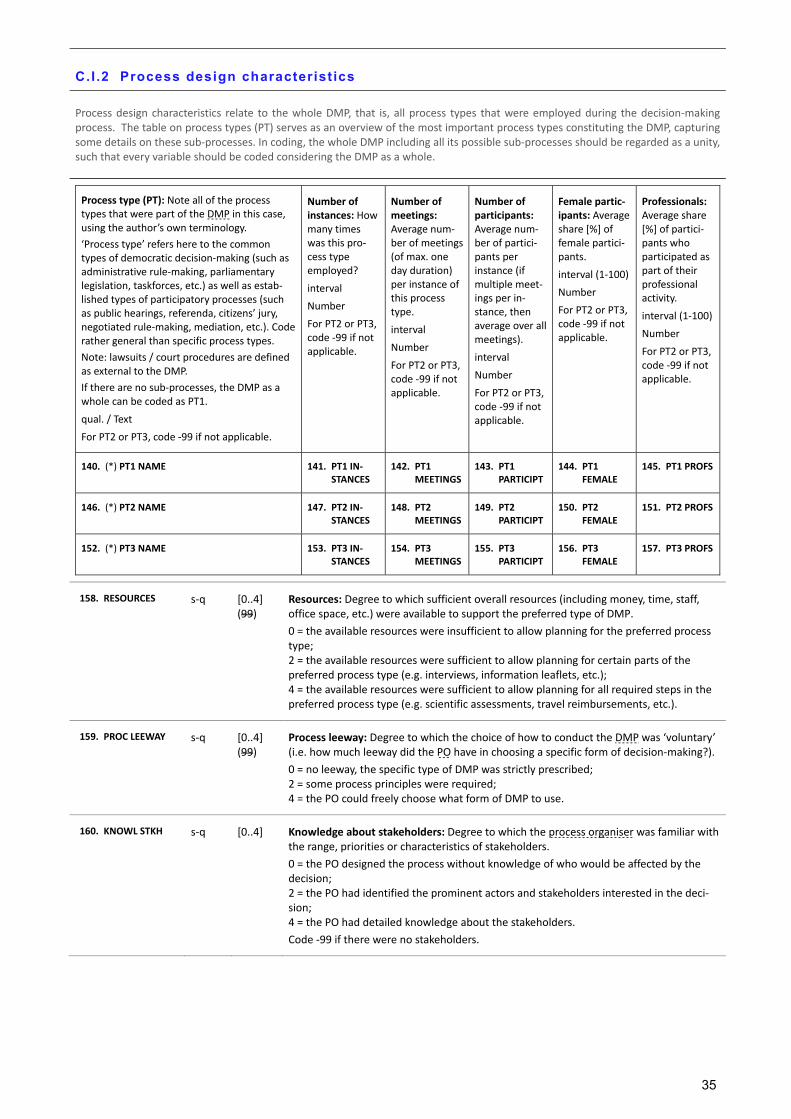
35
C.I .2 Process design characterist ics
Process design characteristics relate to the whole DMP, that is, all process types that were employed during the decision‐making process. The table on process types (PT) serves as an overview of the most important process types constituting the DMP, capturing some details on these sub‐processes. In coding, the whole DMP including all its possible sub‐processes should be regarded as a unity, such that every variable should be coded considering the DMP as a whole.
Process type (PT): Note all of the process types that were part of the DMP in this case, using the author’s own terminology.
‘Process type’ refers here to the common types of democratic decision‐making (such as administrative rule‐making, parliamentary legislation, taskforces, etc.) as well as estab‐lished types of participatory processes (such as public hearings, referenda, citizens’ jury, negotiated rule‐making, mediation, etc.). Code rather general than specific process types.
Note: lawsuits / court procedures are defined as external to the DMP.
If there are no sub‐processes, the DMP as a whole can be coded as PT1.
qual. / Text
For PT2 or PT3, code ‐99 if not applicable.
Number of instances: How many times was this pro‐cess type employed?
interval
Number
For PT2 or PT3, code ‐99 if not applicable.
Number of meetings: Average num‐ber of meetings (of max. one day duration) per instance of this process type.
interval
Number
For PT2 or PT3, code ‐99 if not applicable.
Number of participants: Average num‐ber of partici‐pants per instance (if multiple meet‐ings per in‐stance, then average over all meetings).
interval
Number
For PT2 or PT3, code ‐99 if not applicable.
Female partic‐ipants: Average share [%] of female partici‐pants.
interval (1‐100)
Number
For PT2 or PT3, code ‐99 if not applicable.
Professionals: Average share [%] of partici‐pants who participated as part of their professional activity.
interval (1‐100)
Number
For PT2 or PT3, code ‐99 if not applicable.
140. (*) PT1 NAME 141. PT1 IN‐STANCES
142. PT1 MEETINGS
143. PT1 PARTICIPT
144. PT1 FEMALE
145. PT1 PROFS
146. (*) PT2 NAME 147. PT2 IN‐STANCES
148. PT2 MEETINGS
149. PT2 PARTICIPT
150. PT2 FEMALE
151. PT2 PROFS
152. (*) PT3 NAME 153. PT3 IN‐STANCES
154. PT3 MEETINGS
155. PT3 PARTICIPT
156. PT3 FEMALE
157. PT3 PROFS
158. RESOURCES s‐q [0..4] (99)
Resources: Degree to which sufficient overall resources (including money, time, staff, office space, etc.) were available to support the preferred type of DMP.
0 = the available resources were insufficient to allow planning for the preferred process type; 2 = the available resources were sufficient to allow planning for certain parts of the preferred process type (e.g. interviews, information leaflets, etc.); 4 = the available resources were sufficient to allow planning for all required steps in the preferred process type (e.g. scientific assessments, travel reimbursements, etc.).
159. PROC LEEWAY s‐q [0..4] (99)
Process leeway: Degree to which the choice of how to conduct the DMP was ‘voluntary’ (i.e. how much leeway did the PO have in choosing a specific form of decision‐making?).
0 = no leeway, the specific type of DMP was strictly prescribed; 2 = some process principles were required; 4 = the PO could freely choose what form of DMP to use.
160. KNOWL STKH s‐q [0..4] Knowledge about stakeholders: Degree to which the process organiser was familiar with the range, priorities or characteristics of stakeholders.
0 = the PO designed the process without knowledge of who would be affected by the decision; 2 = the PO had identified the prominent actors and stakeholders interested in the deci‐sion; 4 = the PO had detailed knowledge about the stakeholders.
Code ‐99 if there were no stakeholders.
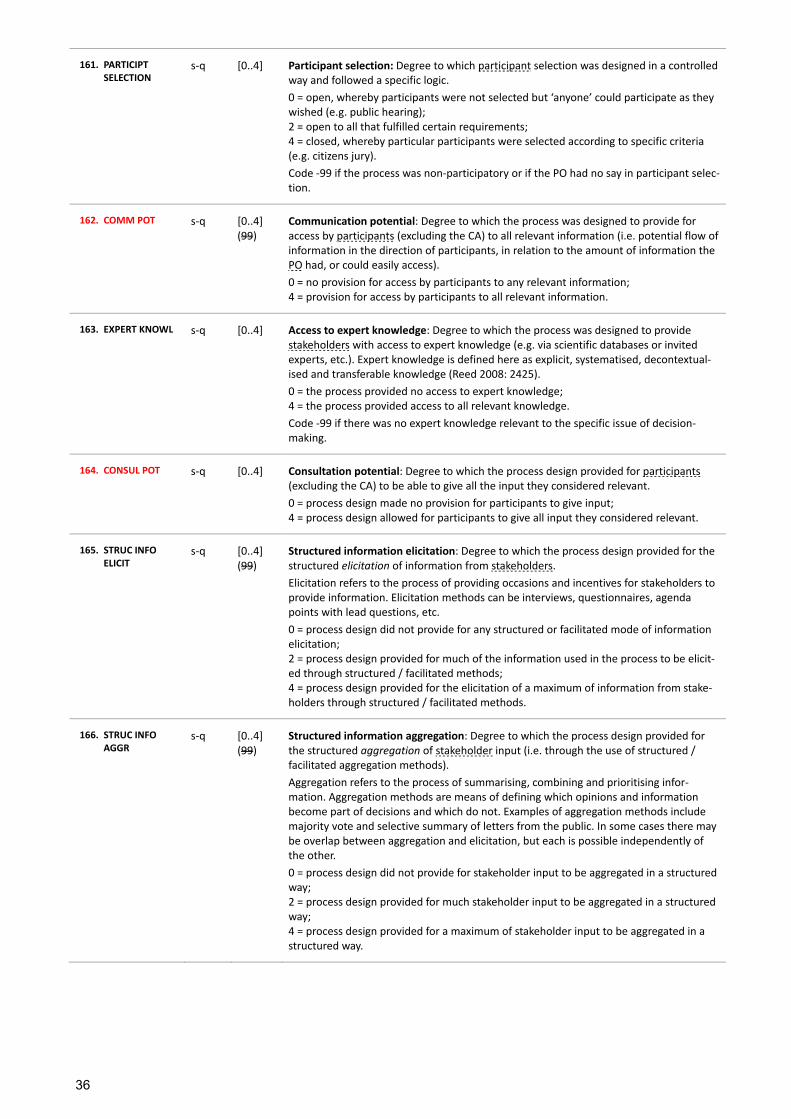
36
161. PARTICIPT SELECTION
s‐q [0..4] Participant selection: Degree to which participant selection was designed in a controlled way and followed a specific logic.
0 = open, whereby participants were not selected but ‘anyone’ could participate as they wished (e.g. public hearing); 2 = open to all that fulfilled certain requirements; 4 = closed, whereby particular participants were selected according to specific criteria (e.g. citizens jury).
Code ‐99 if the process was non‐participatory or if the PO had no say in participant selec‐tion.
162. COMM POT s‐q [0..4] (99)
Communication potential: Degree to which the process was designed to provide for access by participants (excluding the CA) to all relevant information (i.e. potential flow of information in the direction of participants, in relation to the amount of information the PO had, or could easily access).
0 = no provision for access by participants to any relevant information; 4 = provision for access by participants to all relevant information.
163. EXPERT KNOWL s‐q [0..4] Access to expert knowledge: Degree to which the process was designed to provide stakeholders with access to expert knowledge (e.g. via scientific databases or invited experts, etc.). Expert knowledge is defined here as explicit, systematised, decontextual‐ised and transferable knowledge (Reed 2008: 2425).
0 = the process provided no access to expert knowledge; 4 = the process provided access to all relevant knowledge.
Code ‐99 if there was no expert knowledge relevant to the specific issue of decision‐making.
164. CONSUL POT s‐q [0..4] Consultation potential: Degree to which the process design provided for participants (excluding the CA) to be able to give all the input they considered relevant.
0 = process design made no provision for participants to give input; 4 = process design allowed for participants to give all input they considered relevant.
165. STRUC INFO ELICIT
s‐q [0..4] (99)
Structured information elicitation: Degree to which the process design provided for the structured elicitation of information from stakeholders.
Elicitation refers to the process of providing occasions and incentives for stakeholders to provide information. Elicitation methods can be interviews, questionnaires, agenda points with lead questions, etc.
0 = process design did not provide for any structured or facilitated mode of information elicitation; 2 = process design provided for much of the information used in the process to be elicit‐ed through structured / facilitated methods; 4 = process design provided for the elicitation of a maximum of information from stake‐holders through structured / facilitated methods.
166. STRUC INFO AGGR
s‐q [0..4] (99)
Structured information aggregation: Degree to which the process design provided for the structured aggregation of stakeholder input (i.e. through the use of structured / facilitated aggregation methods).
Aggregation refers to the process of summarising, combining and prioritising infor‐mation. Aggregation methods are means of defining which opinions and information become part of decisions and which do not. Examples of aggregation methods include majority vote and selective summary of letters from the public. In some cases there may be overlap between aggregation and elicitation, but each is possible independently of the other.
0 = process design did not provide for stakeholder input to be aggregated in a structured way; 2 = process design provided for much stakeholder input to be aggregated in a structured way; 4 = process design provided for a maximum of stakeholder input to be aggregated in a structured way.
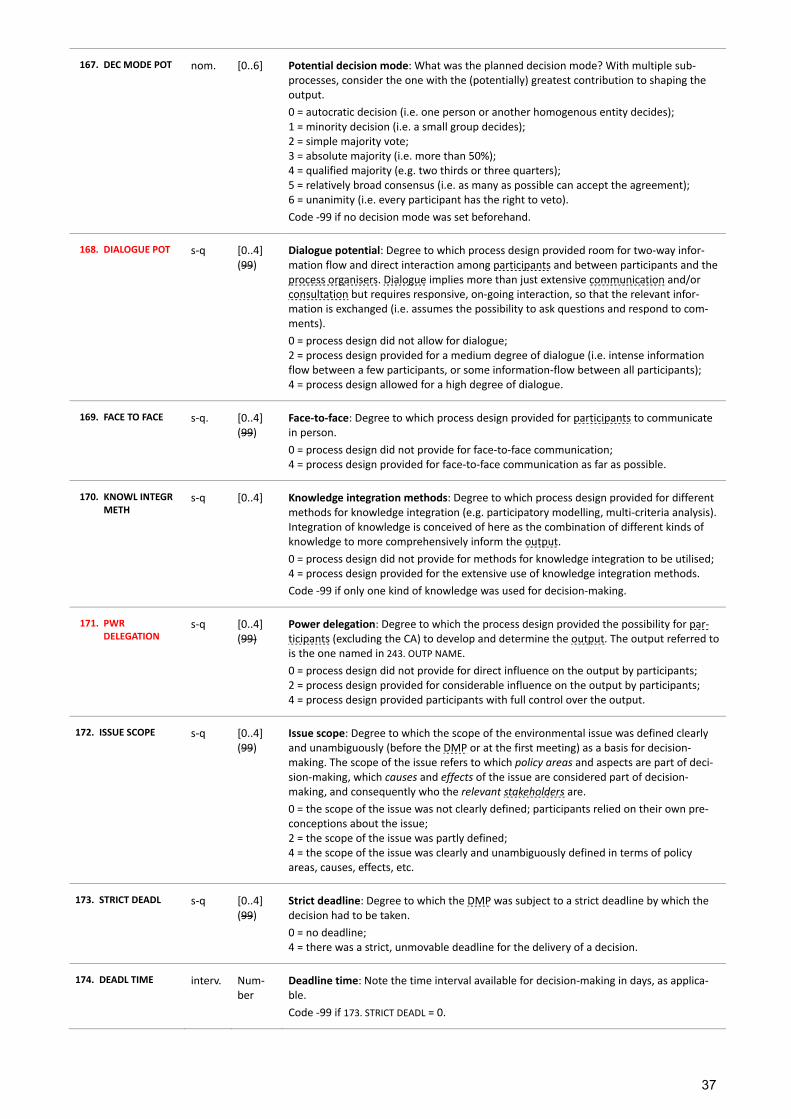
37
167. DEC MODE POT nom. [0..6] Potential decision mode: What was the planned decision mode? With multiple sub‐processes, consider the one with the (potentially) greatest contribution to shaping the output.
0 = autocratic decision (i.e. one person or another homogenous entity decides); 1 = minority decision (i.e. a small group decides); 2 = simple majority vote; 3 = absolute majority (i.e. more than 50%); 4 = qualified majority (e.g. two thirds or three quarters); 5 = relatively broad consensus (i.e. as many as possible can accept the agreement); 6 = unanimity (i.e. every participant has the right to veto).
Code ‐99 if no decision mode was set beforehand.
168. DIALOGUE POT s‐q [0..4] (99)
Dialogue potential: Degree to which process design provided room for two‐way infor‐mation flow and direct interaction among participants and between participants and the process organisers. Dialogue implies more than just extensive communication and/or consultation but requires responsive, on‐going interaction, so that the relevant infor‐mation is exchanged (i.e. assumes the possibility to ask questions and respond to com‐ments).
0 = process design did not allow for dialogue; 2 = process design provided for a medium degree of dialogue (i.e. intense information flow between a few participants, or some information‐flow between all participants); 4 = process design allowed for a high degree of dialogue.
169. FACE TO FACE s‐q. [0..4] (99)
Face‐to‐face: Degree to which process design provided for participants to communicate in person.
0 = process design did not provide for face‐to‐face communication; 4 = process design provided for face‐to‐face communication as far as possible.
170. KNOWL INTEGR METH
s‐q [0..4] Knowledge integration methods: Degree to which process design provided for different methods for knowledge integration (e.g. participatory modelling, multi‐criteria analysis). Integration of knowledge is conceived of here as the combination of different kinds of knowledge to more comprehensively inform the output.
0 = process design did not provide for methods for knowledge integration to be utilised; 4 = process design provided for the extensive use of knowledge integration methods.
Code ‐99 if only one kind of knowledge was used for decision‐making.
171. PWR DELEGATION
s‐q [0..4] (99)
Power delegation: Degree to which the process design provided the possibility for par‐ticipants (excluding the CA) to develop and determine the output. The output referred to is the one named in 243. OUTP NAME.
0 = process design did not provide for direct influence on the output by participants; 2 = process design provided for considerable influence on the output by participants; 4 = process design provided participants with full control over the output.
172. ISSUE SCOPE s‐q [0..4] (99)
Issue scope: Degree to which the scope of the environmental issue was defined clearly and unambiguously (before the DMP or at the first meeting) as a basis for decision‐making. The scope of the issue refers to which policy areas and aspects are part of deci‐sion‐making, which causes and effects of the issue are considered part of decision‐making, and consequently who the relevant stakeholders are.
0 = the scope of the issue was not clearly defined; participants relied on their own pre‐conceptions about the issue; 2 = the scope of the issue was partly defined; 4 = the scope of the issue was clearly and unambiguously defined in terms of policy areas, causes, effects, etc.
173. STRICT DEADL s‐q [0..4] (99)
Strict deadline: Degree to which the DMP was subject to a strict deadline by which the decision had to be taken.
0 = no deadline; 4 = there was a strict, unmovable deadline for the delivery of a decision.
174. DEADL TIME interv. Num‐ber
Deadline time: Note the time interval available for decision‐making in days, as applica‐ble.
Code ‐99 if 173. STRICT DEADL = 0.
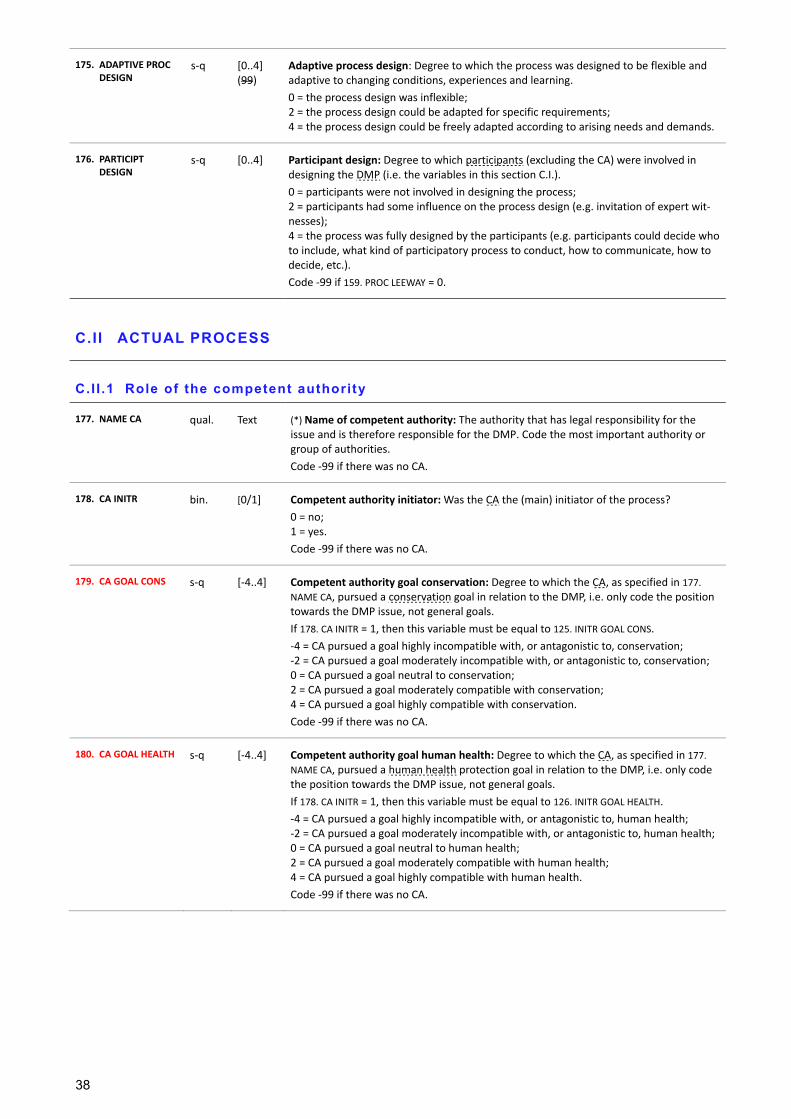
38
175. ADAPTIVE PROC DESIGN
s‐q [0..4] (99)
Adaptive process design: Degree to which the process was designed to be flexible and adaptive to changing conditions, experiences and learning.
0 = the process design was inflexible; 2 = the process design could be adapted for specific requirements; 4 = the process design could be freely adapted according to arising needs and demands.
176. PARTICIPT DESIGN
s‐q [0..4] Participant design: Degree to which participants (excluding the CA) were involved in designing the DMP (i.e. the variables in this section C.I.).
0 = participants were not involved in designing the process; 2 = participants had some influence on the process design (e.g. invitation of expert wit‐nesses); 4 = the process was fully designed by the participants (e.g. participants could decide who to include, what kind of participatory process to conduct, how to communicate, how to decide, etc.).
Code ‐99 if 159. PROC LEEWAY = 0.
C.II ACTUAL PROCESS
C.I I .1 Role of the competent authority
177. NAME CA qual.
Text (*) Name of competent authority: The authority that has legal responsibility for the issue and is therefore responsible for the DMP. Code the most important authority or group of authorities.
Code ‐99 if there was no CA.
178. CA INITR bin. [0/1] Competent authority initiator: Was the CA the (main) initiator of the process?
0 = no; 1 = yes.
Code ‐99 if there was no CA.
179. CA GOAL CONS s‐q [‐4..4] Competent authority goal conservation: Degree to which the CA, as specified in 177. NAME CA, pursued a conservation goal in relation to the DMP, i.e. only code the position towards the DMP issue, not general goals.
If 178. CA INITR = 1, then this variable must be equal to 125. INITR GOAL CONS.
‐4 = CA pursued a goal highly incompatible with, or antagonistic to, conservation; ‐2 = CA pursued a goal moderately incompatible with, or antagonistic to, conservation; 0 = CA pursued a goal neutral to conservation; 2 = CA pursued a goal moderately compatible with conservation; 4 = CA pursued a goal highly compatible with conservation.
Code ‐99 if there was no CA.
180. CA GOAL HEALTH s‐q [‐4..4] Competent authority goal human health: Degree to which the CA, as specified in 177. NAME CA, pursued a human health protection goal in relation to the DMP, i.e. only code the position towards the DMP issue, not general goals.
If 178. CA INITR = 1, then this variable must be equal to 126. INITR GOAL HEALTH.
‐4 = CA pursued a goal highly incompatible with, or antagonistic to, human health; ‐2 = CA pursued a goal moderately incompatible with, or antagonistic to, human health; 0 = CA pursued a goal neutral to human health; 2 = CA pursued a goal moderately compatible with human health; 4 = CA pursued a goal highly compatible with human health.
Code ‐99 if there was no CA.
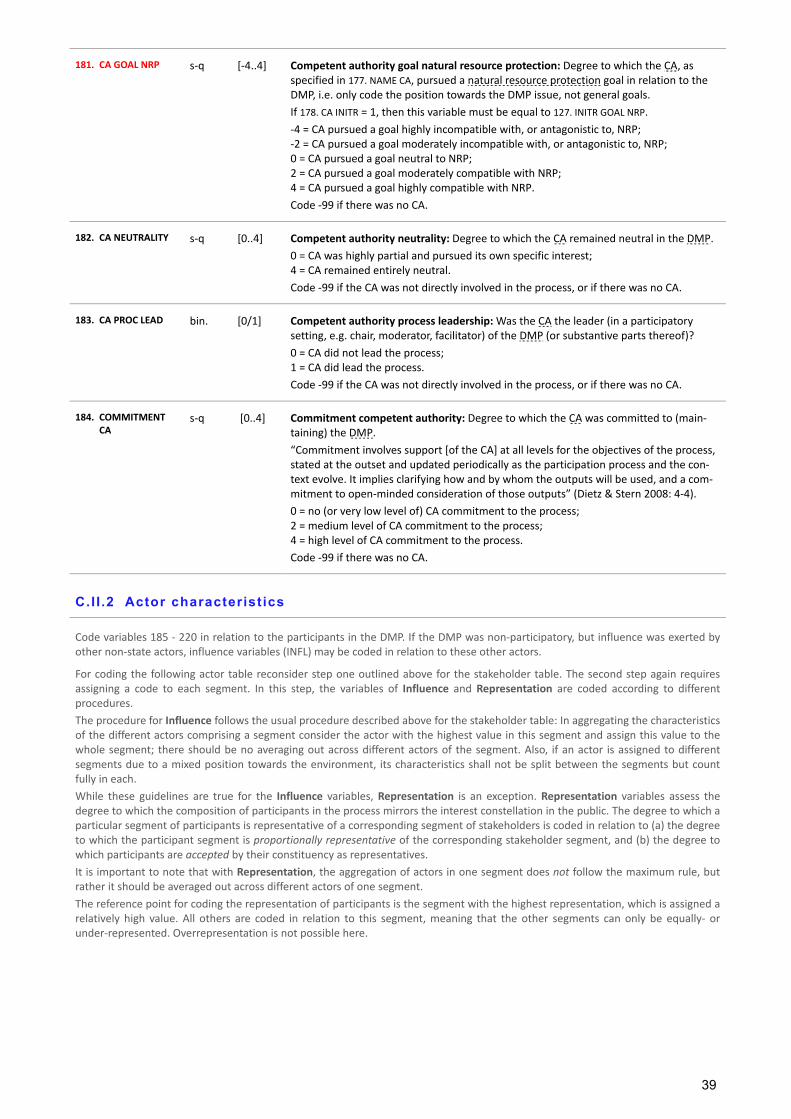
39
181. CA GOAL NRP s‐q [‐4..4] Competent authority goal natural resource protection: Degree to which the CA, as specified in 177. NAME CA, pursued a natural resource protection goal in relation to the DMP, i.e. only code the position towards the DMP issue, not general goals.
If 178. CA INITR = 1, then this variable must be equal to 127. INITR GOAL NRP.
‐4 = CA pursued a goal highly incompatible with, or antagonistic to, NRP; ‐2 = CA pursued a goal moderately incompatible with, or antagonistic to, NRP; 0 = CA pursued a goal neutral to NRP; 2 = CA pursued a goal moderately compatible with NRP; 4 = CA pursued a goal highly compatible with NRP.
Code ‐99 if there was no CA.
182. CA NEUTRALITY s‐q [0..4] Competent authority neutrality: Degree to which the CA remained neutral in the DMP.
0 = CA was highly partial and pursued its own specific interest; 4 = CA remained entirely neutral.
Code ‐99 if the CA was not directly involved in the process, or if there was no CA.
183. CA PROC LEAD bin. [0/1] Competent authority process leadership: Was the CA the leader (in a participatory setting, e.g. chair, moderator, facilitator) of the DMP (or substantive parts thereof)?
0 = CA did not lead the process; 1 = CA did lead the process.
Code ‐99 if the CA was not directly involved in the process, or if there was no CA.
184. COMMITMENT CA
s‐q [0..4] Commitment competent authority: Degree to which the CA was committed to (main‐taining) the DMP.
“Commitment involves support [of the CA] at all levels for the objectives of the process, stated at the outset and updated periodically as the participation process and the con‐text evolve. It implies clarifying how and by whom the outputs will be used, and a com‐mitment to open‐minded consideration of those outputs” (Dietz & Stern 2008: 4‐4).
0 = no (or very low level of) CA commitment to the process; 2 = medium level of CA commitment to the process; 4 = high level of CA commitment to the process.
Code ‐99 if there was no CA.
C.II .2 Actor characteristics
Code variables 185 ‐ 220 in relation to the participants in the DMP. If the DMP was non‐participatory, but influence was exerted by other non‐state actors, influence variables (INFL) may be coded in relation to these other actors.
For coding the following actor table reconsider step one outlined above for the stakeholder table. The second step again requires assigning a code to each segment. In this step, the variables of Influence and Representation are coded according to different procedures.
The procedure for Influence follows the usual procedure described above for the stakeholder table: In aggregating the characteristics of the different actors comprising a segment consider the actor with the highest value in this segment and assign this value to the whole segment; there should be no averaging out across different actors of the segment. Also, if an actor is assigned to different segments due to a mixed position towards the environment, its characteristics shall not be split between the segments but count fully in each.
While these guidelines are true for the Influence variables, Representation is an exception. Representation variables assess the degree to which the composition of participants in the process mirrors the interest constellation in the public. The degree to which a particular segment of participants is representative of a corresponding segment of stakeholders is coded in relation to (a) the degree to which the participant segment is proportionally representative of the corresponding stakeholder segment, and (b) the degree to which participants are accepted by their constituency as representatives.
It is important to note that with Representation, the aggregation of actors in one segment does not follow the maximum rule, but rather it should be averaged out across different actors of one segment.
The reference point for coding the representation of participants is the segment with the highest representation, which is assigned a relatively high value. All others are coded in relation to this segment, meaning that the other segments can only be equally‐ or under‐represented. Overrepresentation is not possible here.
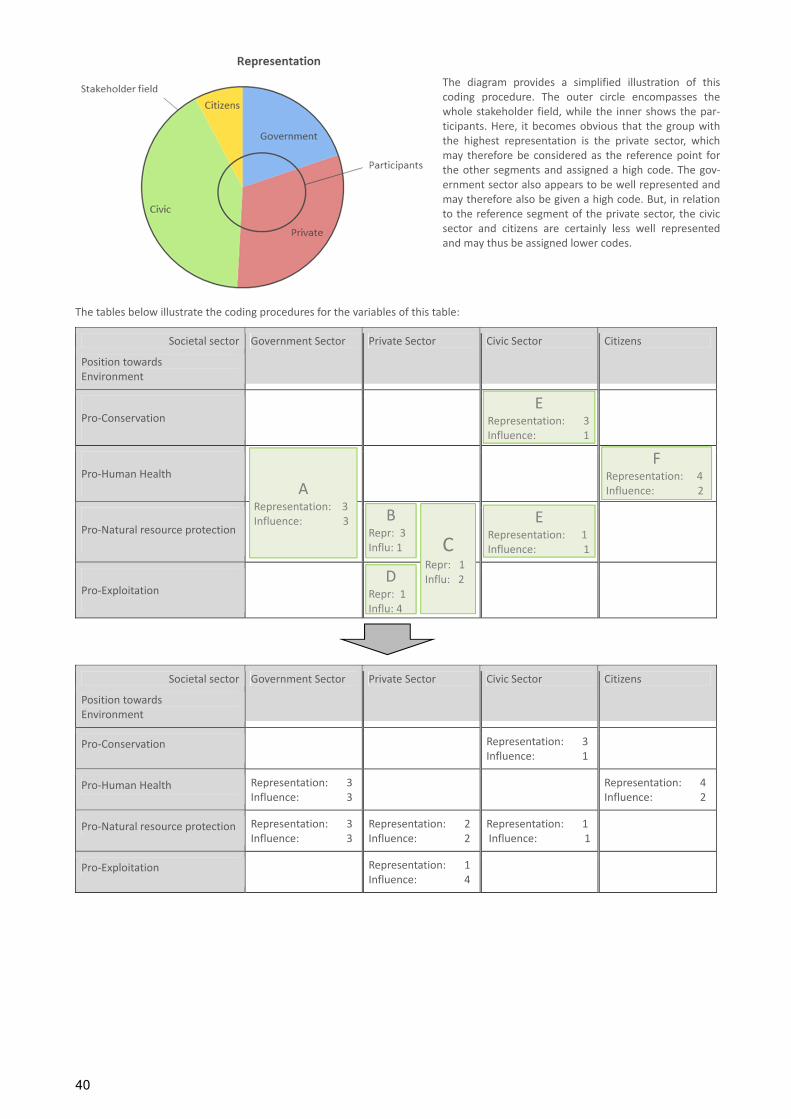
40
The diagram provides a simplified illustration of this coding procedure. The outer circle encompasses the whole stakeholder field, while the inner shows the par-ticipants. Here, it becomes obvious that the group with the highest representation is the private sector, which may therefore be considered as the reference point for the other segments and assigned a high code. The gov-ernment sector also appears to be well represented and may therefore also be given a high code. But, in relation to the reference segment of the private sector, the civic sector and citizens are certainly less well represented and may thus be assigned lower codes.
The tables below illustrate the coding procedures for the variables of this table:
Societal sector Government Sector Private Sector Civic Sector Citizens
Position towards Environment
Pro-Conservation
Pro-Human Health
Pro-Natural resource protection
Pro-Exploitation
Societal sector Government Sector Private Sector Civic Sector Citizens
Position towards Environment
Pro-Conservation Representation: 3 Influence: 1
Pro-Human Health Representation: 3 Influence: 3
Representation: 4 Influence: 2
Pro-Natural resource protection Representation: 3 Influence: 3
Representation: 2 Influence: 2
Representation: 1 Influence: 1
Pro-Exploitation Representation: 1 Influence: 4
E Representation: 3 Influence: 1
FRepresentation: 4 Influence: 2
DRepr: 1 Influ: 4
A Representation: 3 Influence: 3 B
Repr: 3 Influ: 1 C
Repr: 1 Influ: 2
E Representation: 1 Influence: 1
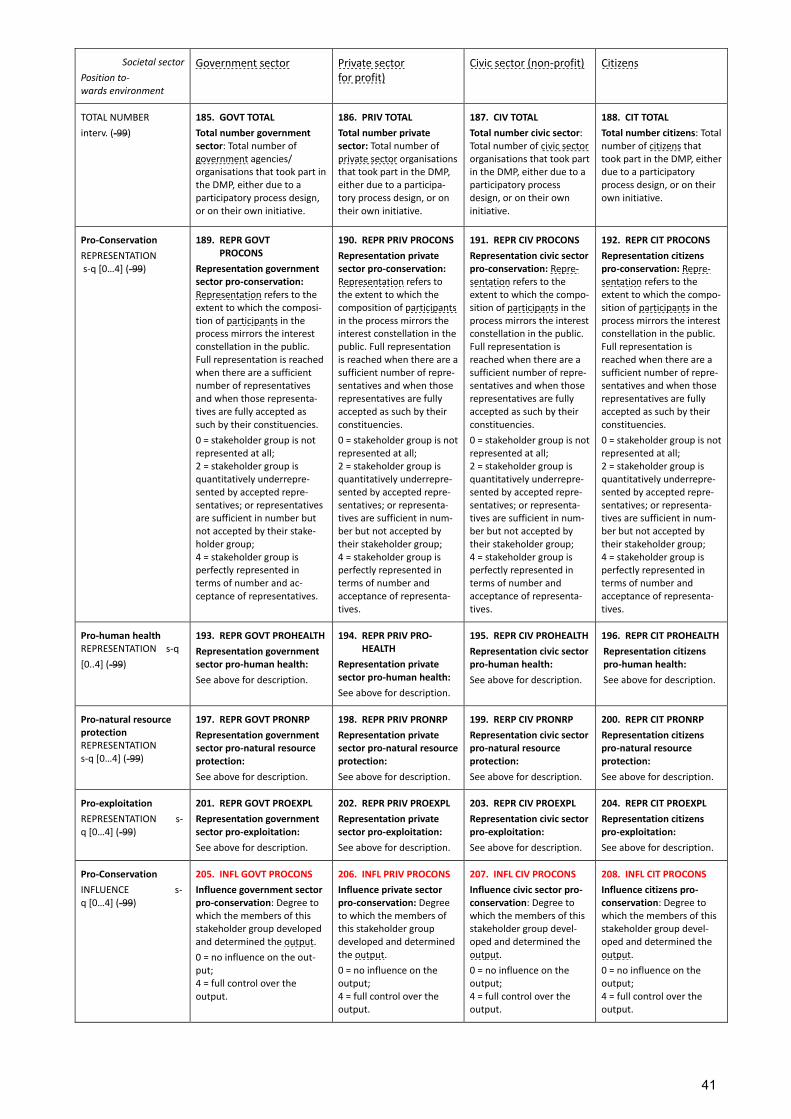
41
Societal sector
Position to‐ wards environment
Government sector Private sector for profit)
Civic sector (non-profit) Citizens
TOTAL NUMBER
interv. (-99)
185. GOVT TOTAL
Total number government sector: Total number of government agencies/ organisations that took part in the DMP, either due to a participatory process design, or on their own initiative.
186. PRIV TOTAL
Total number private sector: Total number of private sector organisations that took part in the DMP, either due to a participa-tory process design, or on their own initiative.
187. CIV TOTAL
Total number civic sector: Total number of civic sector organisations that took part in the DMP, either due to a participatory process design, or on their own initiative.
188. CIT TOTAL
Total number citizens: Total number of citizens that took part in the DMP, either due to a participatory process design, or on their own initiative.
Pro‐Conservation
REPRESENTATION s-q [0…4] (-99)
189. REPR GOVT PROCONS
Representation government sector pro‐conservation: Representation refers to the extent to which the composi-tion of participants in the process mirrors the interest constellation in the public. Full representation is reached when there are a sufficient number of representatives and when those representa-tives are fully accepted as such by their constituencies.
0 = stakeholder group is not represented at all; 2 = stakeholder group is quantitatively underrepre-sented by accepted repre-sentatives; or representatives are sufficient in number but not accepted by their stake-holder group; 4 = stakeholder group is perfectly represented in terms of number and ac-ceptance of representatives.
190. REPR PRIV PROCONS
Representation private sector pro‐conservation: Representation refers to the extent to which the composition of participants in the process mirrors the interest constellation in the public. Full representation is reached when there are a sufficient number of repre-sentatives and when those representatives are fully accepted as such by their constituencies.
0 = stakeholder group is not represented at all; 2 = stakeholder group is quantitatively underrepre-sented by accepted repre-sentatives; or representa-tives are sufficient in num-ber but not accepted by their stakeholder group; 4 = stakeholder group is perfectly represented in terms of number and acceptance of representa-tives.
191. REPR CIV PROCONS
Representation civic sector pro‐conservation: Repre-sentation refers to the extent to which the compo-sition of participants in the process mirrors the interest constellation in the public. Full representation is reached when there are a sufficient number of repre-sentatives and when those representatives are fully accepted as such by their constituencies.
0 = stakeholder group is not represented at all; 2 = stakeholder group is quantitatively underrepre-sented by accepted repre-sentatives; or representa-tives are sufficient in num-ber but not accepted by their stakeholder group; 4 = stakeholder group is perfectly represented in terms of number and acceptance of representa-tives.
192. REPR CIT PROCONS
Representation citizens pro‐conservation: Repre-sentation refers to the extent to which the compo-sition of participants in the process mirrors the interest constellation in the public. Full representation is reached when there are a sufficient number of repre-sentatives and when those representatives are fully accepted as such by their constituencies.
0 = stakeholder group is not represented at all; 2 = stakeholder group is quantitatively underrepre-sented by accepted repre-sentatives; or representa-tives are sufficient in num-ber but not accepted by their stakeholder group; 4 = stakeholder group is perfectly represented in terms of number and acceptance of representa-tives.
Pro‐human health REPRESENTATION s-q
[0..4] (-99)
193. REPR GOVT PROHEALTH
Representation government sector pro‐human health:
See above for description.
194. REPR PRIV PRO‐HEALTH
Representation private sector pro‐human health:
See above for description.
195. REPR CIV PROHEALTH
Representation civic sector pro‐human health:
See above for description.
196. REPR CIT PROHEALTH
Representation citizens pro‐human health:
See above for description.
Pro‐natural resource protection REPRESENTATION s-q [0…4] (-99)
197. REPR GOVT PRONRP
Representation government sector pro‐natural resource protection:
See above for description.
198. REPR PRIV PRONRP
Representation private sector pro‐natural resource protection:
See above for description.
199. RERP CIV PRONRP
Representation civic sector pro‐natural resource protection:
See above for description.
200. REPR CIT PRONRP
Representation citizens pro‐natural resource protection:
See above for description.
Pro‐exploitation
REPRESENTATION s-q [0…4] (-99)
201. REPR GOVT PROEXPL
Representation government sector pro‐exploitation:
See above for description.
202. REPR PRIV PROEXPL
Representation private sector pro‐exploitation:
See above for description.
203. REPR CIV PROEXPL
Representation civic sector pro‐exploitation:
See above for description.
204. REPR CIT PROEXPL
Representation citizens pro‐exploitation:
See above for description.
Pro‐Conservation
INFLUENCE s-q [0…4] (-99)
205. INFL GOVT PROCONS
Influence government sector pro‐conservation: Degree to which the members of this stakeholder group developed and determined the output.
0 = no influence on the out-put; 4 = full control over the output.
206. INFL PRIV PROCONS
Influence private sector pro‐conservation: Degree to which the members of this stakeholder group developed and determined the output.
0 = no influence on the output; 4 = full control over the output.
207. INFL CIV PROCONS
Influence civic sector pro‐conservation: Degree to which the members of this stakeholder group devel-oped and determined the output.
0 = no influence on the output; 4 = full control over the output.
208. INFL CIT PROCONS
Influence citizens pro‐conservation: Degree to which the members of this stakeholder group devel-oped and determined the output.
0 = no influence on the output; 4 = full control over the output.
42
Pro‐human health
INFLUENCE s-q
[0..4] (-99)
209. INFL GOVT PROHEALTH
Influence government sector pro‐human health:
See above for description.
210. INFL PRIV PRO‐HEALTH
Influence private sector pro‐human health:
See above for description.
211. INFL CIV PROHEALTH
Influence civic sector pro‐human health:
See above for description.
212. INFL CIT PROHEALTH
Influence citizens pro‐human health:
See above for description.
Pro‐natural resource protection INFLUENCE s-q [0…4] (-99)
213. INFL GOVT PRONRP
Influence government sector pro‐natural resource protec‐tion:
See above for description.
214. INFL PRIV PRONRP
Influence private sector pro‐natural resource protection:
See above for description.
215. INFL CIV PRONRP
Influence civic sector pro‐natural resource protec‐tion:
See above for description.
216. INFL CIT PRONRP
Influence citizens pro‐natural resource protec‐tion:
See above for description.
Pro‐exploitation
INFLUENCE s-q [0…4] (-99)
217. INFL GOVT PROEXPL
Influence government sector pro‐exploitation:
See above for description.
218. INFL PRIV PROEXPL
Influence private sector pro‐exploitation:
See above for description.
219. INFL CIV PROEXPL
Influence civic sector pro‐exploitation:
See above for description.
220. INFL CIT PROEXPL
Influence citizens pro‐exploitation:
See above for description.
221. OPINION LEADERS
s-q [0..4] Opinion leaders: Degree to which important opinion leaders were involved in the DMP. “Opinion leadership is the degree to which an individual is able to influence other indi-viduals’ attitudes or overt behaviour informally in a desired way with relative frequency. This informal leadership is not a function of the individual’s formal position or status in the system. Opinion leadership is earned and maintained by the individual’s technical competence, social accessibility, and conformity to the system’s norms” (Rogers 1995: 26).
0 = no important opinion leaders were involved in the DMP; 1..3 = some important opinion leaders were involved; 4 = all important opinion leaders were involved.
Code -99 if the DMP was not participatory.
222. POL ADDR s-q [0..4] Policy addressees: Degree to which those potentially responsible for implementing the output participated in the decision-making process.
0 = none of the policy addressees participated or were represented in the DMP; 4 = all policy addressees or their representatives participated in the DMP.
Code -99 if there were no policy addressees.
223. SCIENT PROC ADV s-q [0..4] (99)
Scientific process advice: Degree to which scientific process expertise informed the process (either by external advisors or process organisers).
0 = no researchers were involved in the DMP as process advisors; 4 = the DMP was designed and steered by scientific advisors.
224. FACILITATION s-q [0..4] (99)
Facilitation: Degree to which the process was characterised by skilled facilitation.
A facilitator is a specialist who helps people design effective meetings and problem-solving sessions, and acts as the meeting leader on behalf of the group. A facilitator does not have the authority to make substantive decisions, but may have a say in how the meeting is run, and will consult with the group about major process decisions, such as a significant change in agenda or meeting procedures (adapted from Creighton 1998).
Skilled facilitation consists of the following elements:
Assistance with designing meetings;
Helping to keep meetings on track;
Clarifying and accepting communication and feelings;
Stating problems in a constructive way;
Suggesting appropriate procedures or problem-solving approaches;
Summarising and clarifying direction;
Consensus-testing
Managing power imbalances between participants.
0 = process did not have any of the elements of skilled facilitation; 2 = process had a number elements of skilled facilitation; 4 = process had all elements of skilled facilitation.
43
225. SHARED CULT s-q [0..4] Shared culture: Degree to which the participants shared the same issue-specific cultural background.
0 = the participants had a very low level of cultural commonality; 2 = the participants had a medium level of cultural commonality; 4 = all participants shared a common culture concerning the issue at hand.
Code -99 if the DMP was not participatory.
226. VENUE SHOP STKH
s-q [0..4] (99)
Venue shopping stakeholders: Degree to which stakeholders ‘venue shop’.
The term policy venue refers to institutional locations where authoritative decisions are made concerning a given issue (Baumgartner & Jones 1993: 32). Venue shopping de-scribes the activities of stakeholders seeking access to alternative venues to influence the process (Weible 2006: 101).
0 = stakeholders do not engage in venue shopping; 2 = stakeholders engage in venue shopping to a moderate degree (i.e. some stakeholders concentrate on access to alternative venues, or a significant share of stakeholders also consider alternative venues); 4 = all of the stakeholders engage in alternative venues to influence the decision.
227. VENUE SHOP ENGOS
s-q [0..4] Venue shopping pro‐environmental actors: Degree to which pro-environmental actors (typically, but not limited to, NGOs) ‘venue shop’.
The term policy venue refers to institutional locations where authoritative decisions are made concerning a given issue (Baumgartner & Jones 1993: 32). Venue shopping de-scribes the activities of stakeholders seeking access to alternative venues where they might have a competitive advantage (Weible 2006: 101).
0 = Pro-environmental actors do not engage in venue shopping; 2 = Pro-environmental actors also consider alternative venues; 4 = Pro-environmental actors engage frequently and pivotally in alternative venues.
Code -99 if there are no pro-environmental stakeholders.
C.II .3 Process characteristics
228. PROC ADAP s-q [0..4] (99)
Process adaptations: Degree to which the DMP design was changed or adapted in the course of the process.
0 = there was no change during the process; 2 = considerable adaptions were made during the process; 4 = the DMP was completely reorganised.
229. COMM ACT s-q [0..4] (99)
Actual communication: Degree to which participants (excluding the CA) received all relevant information (i.e. actual flow of information in the direction of participants), in relation to the amount of information the PO had or could easily access.
0 = no provision for access by participants to any relevant information; 4 = provision made for access by participants to all relevant information.
230. CONSUL ACT s-q [0..4] (99)
Actual consultation: Degree to which participants (excluding the CA) gave all the input they considered relevant.
0 = participants did not give any input; 4 = participants gave all the input they considered relevant.
231. DIALOGUE ACT
s-q [0..4] (99)
Actual dialogue: Degree to which a two-way information flow and direct interaction among participants and between participants and the process organisers took place.
Dialogue implies more than just extensive communication and/or consultation but requires responsive on-going interaction, so that the relevant information is exchanged (i.e. assumes the possibility to ask questions and respond to comments).
0 = the process did not allow for dialogue; 2 = the process allowed for a medium degree of dialogue (i.e. intense information flow between few participants or some information flow between all participants); 4 = the process allowed for a high degree of dialogue.
44
232. INFL ACT s-q [0..4] (99)
Influence actual: Degree to which the participants (excluding the CA) actually developed and determined the output. The output referred to is the one named in 243. OUTP NAME.
0 = participants did not directly influence the output; 2 = participants considerably influenced the output; 4 = participants fully determined the output.
233. DELIB s-q [0..4] (99)
Deliberation: Degree to which deliberation in the sense of a ‘rational’ discourse among participants took place.
The notion of deliberation refers to a process of interaction, exchange and mutual learn-ing preceding any group decision. During this process, participants disclose their respec-tive (relevant) values and preferences, avoiding hidden agendas and strategic game playing. Agreements are based on rational arguments, and principles such as laws of formal logic and analytical reasoning (Renn 2004: 303; Fung 2006: 68).
0 = no deliberation took place; 2 = some deliberation with limited impact took place; 4 = the DMP was characterised by steady deliberation among participants.
234. DEC MODE ACT nom. [0..6] Actual decision mode: Mode by which the output was decided upon. With multiple sub-processes, consider the one with the greatest contribution to shaping the output.
0 = autocratic decision (i.e. one person or another homogenous entity decides); 1 = minority decision (i.e. a small group decides); 2 = simple majority vote; 3 = absolute majority (i.e. more than 50%); 4 = qualified majority (e.g. two thirds or three quarters); 5 = relatively broad consensus (i.e. as many as possible can accept the agreement); 6 = unanimity (i.e. every participant has the right to veto).
Code -99 if no decision was taken.
Analogous to 167. DEC MODE POT.
235. DISC FAIR s-q [0..4] (99)
Discursive fairness: Degree to which the DMP was executed through a process of fair discourse.
Indicators include: all participants must be able to attend, make statements, participate in the discussion, and participate in the decision-making (Webler & Tuler 2000: 569).
0 = DMP was not discursively fair, but highly discriminatory; 2 = DMP afforded participants limited opportunity to engage in fair discourse; 4 = DMP was characterised by fair discourse.
236. GROUP DYSF s-q [0..4] (99)
Group dysfunction: Degree to which there were dysfunctional group dynamics.
Group dysfunction refers to situations where internal group dynamics eliminate discur-sive principles based on reason and argument and lead to unfavourable transformations of the participants’ attitudes and behaviour. Common types of group dysfunction are risky shift, Abilene paradox and group think (explained below) (Cooke 2001: 106 ff.).
Risky shift: Refers to a situation in which a group discussion leads its members to take more risky decisions than they would otherwise have taken as individuals (Cooke 2001: 106 ff.).
Abilene paradox: In collective decision making processes group members may agree to a certain action because everyone else is in favour of this action. An Abilene paradox arises where all group members agree against their genuine will because all others seem to be in favour, leading an organisation or group to act in contradiction to its own objec-tives (Cooke 2001: 109).
Group think: May occur in situations where an ‘ingroup’ versus ‘outgroup’ mentality prevails. In the context of a collective decision making process, group think may result in irrational and dehumanising reactions to the views of outgroups. The more amiability and esprit de corps there is among the ingroup, the greater the danger of group think replacing independent critical thinking (Cooke 2001: 112).
0 = no dysfunctional group dynamics; 4 = DMP characterised by dysfunctional group dynamics.
237. EXPERT SELECTION PARTICIPT
s-q [0..4] (99)
Expert selection participants: Degree to which participants (excluding the CA) drew on expertise from sources that they could independently choose.
0 = participants did not draw on expertise from independently selected sources; 4 = participants chose independently which sources of expertise to draw on.
45
238. COMPR INFO s-q [0..4] Comprehensible information for lay public: Degree to which information was processed in the DMP in a way that enabled all participants to understand and use it equally.
0 = information was not processed for special needs of participants;
2 = information was processed, so that all participants could understand some of it;
4 = information was processed in a way that enabled all participants to understand everything;
Code -99 if participants had no special information needs or if the DMP was not partici-patory.
239. TIME NEED interv. [h]
Number Time need: Average number of hours each participant spent in meetings and prepara-tions in total, regarding the whole participatory process.
Code -99 if there was no participatory process.
240. PP DURATION interv. [Months]
Number Participatory process duration: If a participatory process was conducted, note the num-ber of months (with decimal place) that the process lasted from first to final event.
Code -99 if there was no participatory process.
241. REIMBURSEMENT s-q [0..4] Reimbursement: Degree to which financial, material or immaterial compensation was offered to participants for their efforts to engage in the DMP.
0 = no reimbursement was offered to participants; 4 = full reimbursement was offered to participants.
Code -99 if there were no participants that needed reimbursement.
242. EXT TRANSP s-q [0..4] External transparency: Degree to which the process was transparent to third parties, including constituencies, and the general public.
Transparency here refers to the degree to which information about the process was accessible, how it was accessible (e.g. in its original version, filtered), when information was accessible (e.g. immediately, after processing, after the process) and to whom (e.g. journalists, the public).
0 = no information was made public; 1..3 = only selected information was made public; and/or only selected people had access to the information; and/or information provision was delayed; and/or infor-mation was first filtered; 4 = all information was made public immediately in accessible and unfiltered form.
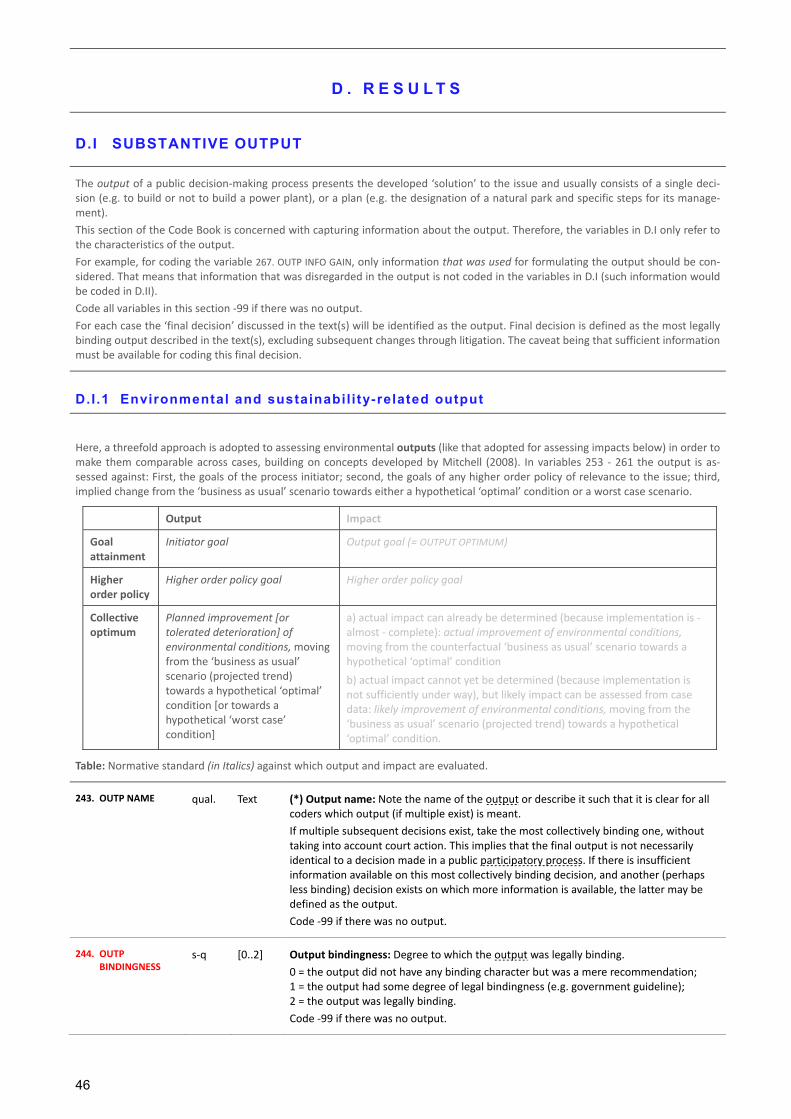
46
D . R E S U L T S
D.I SUBSTANTIVE OUTPUT
The output of a public decision-making process presents the developed ‘solution’ to the issue and usually consists of a single deci-sion (e.g. to build or not to build a power plant), or a plan (e.g. the designation of a natural park and specific steps for its manage-ment).
This section of the Code Book is concerned with capturing information about the output. Therefore, the variables in D.I only refer to the characteristics of the output.
For example, for coding the variable 267. OUTP INFO GAIN, only information that was used for formulating the output should be con-sidered. That means that information that was disregarded in the output is not coded in the variables in D.I (such information would be coded in D.II).
Code all variables in this section -99 if there was no output.
For each case the ‘final decision’ discussed in the text(s) will be identified as the output. Final decision is defined as the most legally binding output described in the text(s), excluding subsequent changes through litigation. The caveat being that sufficient information must be available for coding this final decision.
D.I.1 Environmental and sustainabil i ty-related output
Here, a threefold approach is adopted to assessing environmental outputs (like that adopted for assessing impacts below) in order to make them comparable across cases, building on concepts developed by Mitchell (2008). In variables 253 - 261 the output is as-sessed against: First, the goals of the process initiator; second, the goals of any higher order policy of relevance to the issue; third, implied change from the ‘business as usual’ scenario towards either a hypothetical ‘optimal’ condition or a worst case scenario.
Output Impact
Goal attainment
Initiator goal Output goal (= OUTPUT OPTIMUM)
Higher order policy
Higher order policy goal Higher order policy goal
Collective optimum
Planned improvement [or tolerated deterioration] of environmental conditions, moving from the ‘business as usual’ scenario (projected trend) towards a hypothetical ‘optimal’ condition [or towards a hypothetical ‘worst case’ condition]
a) actual impact can already be determined (because implementation is - almost - complete): actual improvement of environmental conditions, moving from the counterfactual ‘business as usual’ scenario towards a hypothetical ‘optimal’ condition
b) actual impact cannot yet be determined (because implementation is not sufficiently under way), but likely impact can be assessed from case data: likely improvement of environmental conditions, moving from the ‘business as usual’ scenario (projected trend) towards a hypothetical ‘optimal’ condition.
Table: Normative standard (in Italics) against which output and impact are evaluated.
243. OUTP NAME qual. Text (*) Output name: Note the name of the output or describe it such that it is clear for all coders which output (if multiple exist) is meant.
If multiple subsequent decisions exist, take the most collectively binding one, without taking into account court action. This implies that the final output is not necessarily identical to a decision made in a public participatory process. If there is insufficient information available on this most collectively binding decision, and another (perhaps less binding) decision exists on which more information is available, the latter may be defined as the output.
Code -99 if there was no output.
244. OUTP BINDINGNESS
s-q [0..2] Output bindingness: Degree to which the output was legally binding.
0 = the output did not have any binding character but was a mere recommendation; 1 = the output had some degree of legal bindingness (e.g. government guideline); 2 = the output was legally binding.
Code -99 if there was no output.
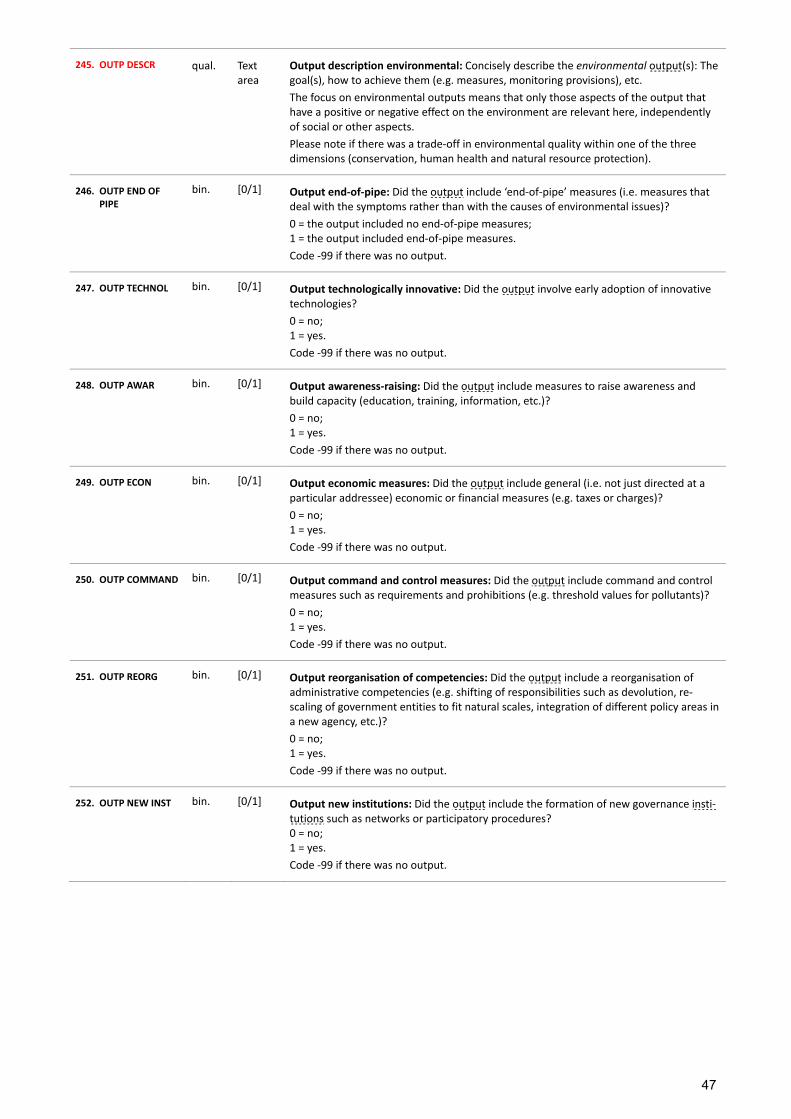
47
245. OUTP DESCR qual. Text area
Output description environmental: Concisely describe the environmental output(s): The goal(s), how to achieve them (e.g. measures, monitoring provisions), etc.
The focus on environmental outputs means that only those aspects of the output that have a positive or negative effect on the environment are relevant here, independently of social or other aspects.
Please note if there was a trade-off in environmental quality within one of the three dimensions (conservation, human health and natural resource protection).
246. OUTP END OF PIPE
bin. [0/1] Output end‐of‐pipe: Did the output include ‘end-of-pipe’ measures (i.e. measures that deal with the symptoms rather than with the causes of environmental issues)?
0 = the output included no end-of-pipe measures; 1 = the output included end-of-pipe measures.
Code -99 if there was no output.
247. OUTP TECHNOL bin. [0/1] Output technologically innovative: Did the output involve early adoption of innovative technologies?
0 = no; 1 = yes.
Code -99 if there was no output.
248. OUTP AWAR bin. [0/1] Output awareness‐raising: Did the output include measures to raise awareness and build capacity (education, training, information, etc.)?
0 = no; 1 = yes.
Code -99 if there was no output.
249. OUTP ECON bin. [0/1] Output economic measures: Did the output include general (i.e. not just directed at a particular addressee) economic or financial measures (e.g. taxes or charges)?
0 = no; 1 = yes.
Code -99 if there was no output.
250. OUTP COMMAND bin. [0/1] Output command and control measures: Did the output include command and control measures such as requirements and prohibitions (e.g. threshold values for pollutants)?
0 = no; 1 = yes.
Code -99 if there was no output.
251. OUTP REORG bin. [0/1] Output reorganisation of competencies: Did the output include a reorganisation of administrative competencies (e.g. shifting of responsibilities such as devolution, re-scaling of government entities to fit natural scales, integration of different policy areas in a new agency, etc.)?
0 = no; 1 = yes.
Code -99 if there was no output.
252. OUTP NEW INST bin. [0/1] Output new institutions: Did the output include the formation of new governance insti-tutions such as networks or participatory procedures? 0 = no; 1 = yes.
Code -99 if there was no output.
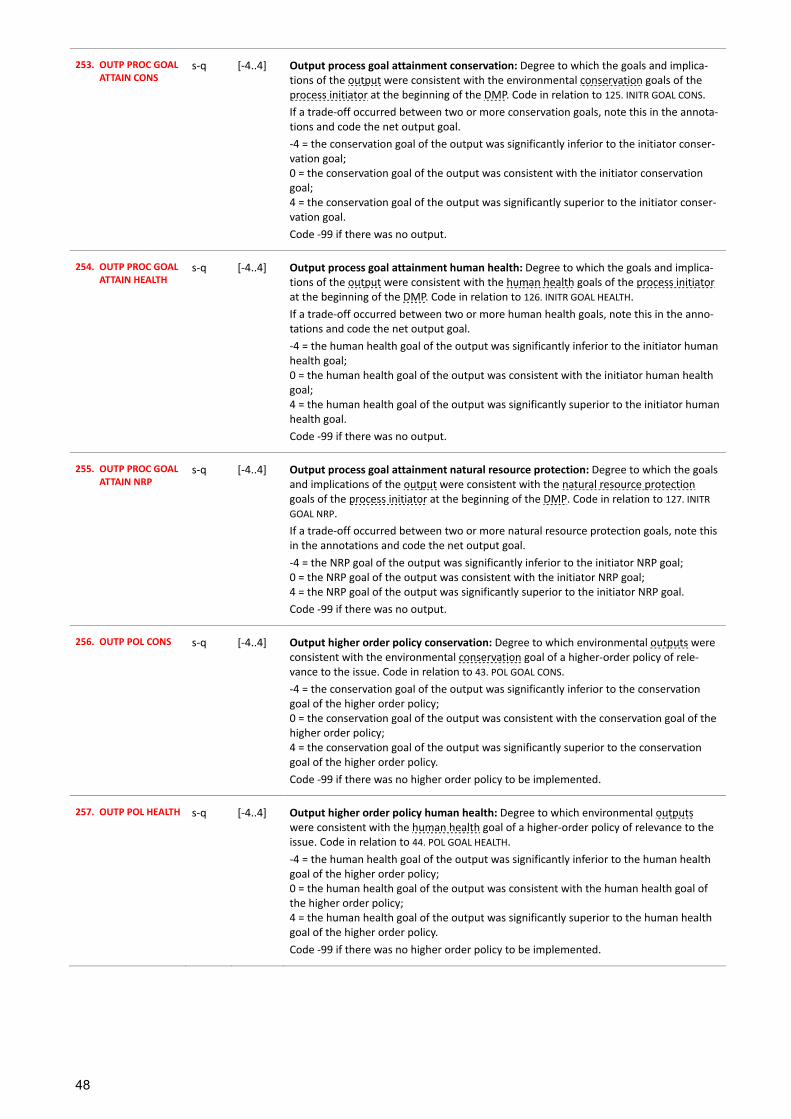
48
253. OUTP PROC GOAL ATTAIN CONS
s-q [-4..4]
Output process goal attainment conservation: Degree to which the goals and implica-tions of the output were consistent with the environmental conservation goals of the process initiator at the beginning of the DMP. Code in relation to 125. INITR GOAL CONS.
If a trade-off occurred between two or more conservation goals, note this in the annota-tions and code the net output goal.
-4 = the conservation goal of the output was significantly inferior to the initiator conser-vation goal; 0 = the conservation goal of the output was consistent with the initiator conservation goal; 4 = the conservation goal of the output was significantly superior to the initiator conser-vation goal.
Code -99 if there was no output.
254. OUTP PROC GOAL ATTAIN HEALTH
s-q [-4..4]
Output process goal attainment human health: Degree to which the goals and implica-tions of the output were consistent with the human health goals of the process initiator at the beginning of the DMP. Code in relation to 126. INITR GOAL HEALTH.
If a trade-off occurred between two or more human health goals, note this in the anno-tations and code the net output goal.
-4 = the human health goal of the output was significantly inferior to the initiator human health goal; 0 = the human health goal of the output was consistent with the initiator human health goal; 4 = the human health goal of the output was significantly superior to the initiator human health goal.
Code -99 if there was no output.
255. OUTP PROC GOAL ATTAIN NRP
s-q [-4..4]
Output process goal attainment natural resource protection: Degree to which the goals and implications of the output were consistent with the natural resource protection goals of the process initiator at the beginning of the DMP. Code in relation to 127. INITR GOAL NRP.
If a trade-off occurred between two or more natural resource protection goals, note this in the annotations and code the net output goal.
-4 = the NRP goal of the output was significantly inferior to the initiator NRP goal; 0 = the NRP goal of the output was consistent with the initiator NRP goal; 4 = the NRP goal of the output was significantly superior to the initiator NRP goal.
Code -99 if there was no output.
256. OUTP POL CONS s-q [-4..4] Output higher order policy conservation: Degree to which environmental outputs were consistent with the environmental conservation goal of a higher-order policy of rele-vance to the issue. Code in relation to 43. POL GOAL CONS.
-4 = the conservation goal of the output was significantly inferior to the conservation goal of the higher order policy; 0 = the conservation goal of the output was consistent with the conservation goal of the higher order policy; 4 = the conservation goal of the output was significantly superior to the conservation goal of the higher order policy.
Code -99 if there was no higher order policy to be implemented.
257. OUTP POL HEALTH s-q [-4..4] Output higher order policy human health: Degree to which environmental outputs were consistent with the human health goal of a higher-order policy of relevance to the issue. Code in relation to 44. POL GOAL HEALTH.
-4 = the human health goal of the output was significantly inferior to the human health goal of the higher order policy; 0 = the human health goal of the output was consistent with the human health goal of the higher order policy; 4 = the human health goal of the output was significantly superior to the human health goal of the higher order policy.
Code -99 if there was no higher order policy to be implemented.
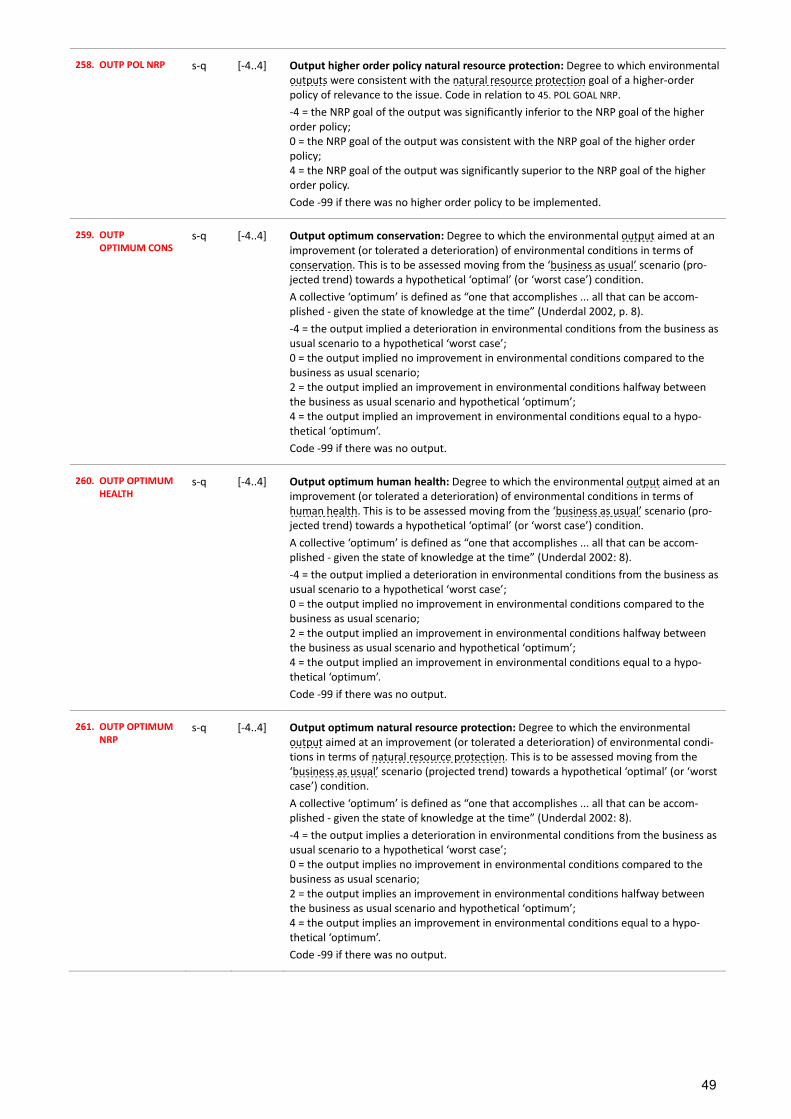
49
258. OUTP POL NRP s-q [-4..4] Output higher order policy natural resource protection: Degree to which environmental outputs were consistent with the natural resource protection goal of a higher-order policy of relevance to the issue. Code in relation to 45. POL GOAL NRP.
-4 = the NRP goal of the output was significantly inferior to the NRP goal of the higher order policy; 0 = the NRP goal of the output was consistent with the NRP goal of the higher order policy; 4 = the NRP goal of the output was significantly superior to the NRP goal of the higher order policy.
Code -99 if there was no higher order policy to be implemented.
259. OUTP OPTIMUM CONS
s-q [-4..4] Output optimum conservation: Degree to which the environmental output aimed at an improvement (or tolerated a deterioration) of environmental conditions in terms of conservation. This is to be assessed moving from the ‘business as usual’ scenario (pro-jected trend) towards a hypothetical ‘optimal’ (or ‘worst case’) condition.
A collective ‘optimum’ is defined as “one that accomplishes ... all that can be accom-plished - given the state of knowledge at the time” (Underdal 2002, p. 8).
-4 = the output implied a deterioration in environmental conditions from the business as usual scenario to a hypothetical ‘worst case’; 0 = the output implied no improvement in environmental conditions compared to the business as usual scenario; 2 = the output implied an improvement in environmental conditions halfway between the business as usual scenario and hypothetical ‘optimum’; 4 = the output implied an improvement in environmental conditions equal to a hypo-thetical ‘optimum’.
Code -99 if there was no output.
260. OUTP OPTIMUM HEALTH
s-q [-4..4] Output optimum human health: Degree to which the environmental output aimed at an improvement (or tolerated a deterioration) of environmental conditions in terms of human health. This is to be assessed moving from the ‘business as usual’ scenario (pro-jected trend) towards a hypothetical ‘optimal’ (or ‘worst case’) condition.
A collective ‘optimum’ is defined as “one that accomplishes ... all that can be accom-plished - given the state of knowledge at the time” (Underdal 2002: 8).
-4 = the output implied a deterioration in environmental conditions from the business as usual scenario to a hypothetical ‘worst case’; 0 = the output implied no improvement in environmental conditions compared to the business as usual scenario; 2 = the output implied an improvement in environmental conditions halfway between the business as usual scenario and hypothetical ‘optimum’; 4 = the output implied an improvement in environmental conditions equal to a hypo-thetical ‘optimum’.
Code -99 if there was no output.
261. OUTP OPTIMUM NRP
s-q [-4..4] Output optimum natural resource protection: Degree to which the environmental output aimed at an improvement (or tolerated a deterioration) of environmental condi-tions in terms of natural resource protection. This is to be assessed moving from the ‘business as usual’ scenario (projected trend) towards a hypothetical ‘optimal’ (or ‘worst case’) condition.
A collective ‘optimum’ is defined as “one that accomplishes ... all that can be accom-plished - given the state of knowledge at the time” (Underdal 2002: 8).
-4 = the output implies a deterioration in environmental conditions from the business as usual scenario to a hypothetical ‘worst case’; 0 = the output implies no improvement in environmental conditions compared to the business as usual scenario; 2 = the output implies an improvement in environmental conditions halfway between the business as usual scenario and hypothetical ‘optimum’; 4 = the output implies an improvement in environmental conditions equal to a hypo-thetical ‘optimum’.
Code -99 if there was no output.
50
262. OUTP IMPLE‐MENTABILITY
s-q [0..4] Output implementability: Degree to which the environmental goals of the output were likely to be implemented (“ex ante expectation”). E.g., did the output specify clear pro-cedures, provide resources, assign responsibilities, include measures to control policy addressees, monitor implementation/compliance and enforcement mechanisms (i.e. penalties, sanctions or other coercive measures to induce compliance with obligations) (Newig 2003: 73)?
0 = the output did not include the necessary provisions to implement its environmental goals; 2 = the output included some important provisions necessary to implement its environ-mental goals; 4 = the output was easy to implement, either because it included all necessary provi-sions to implement its environmental goals, or because no implementation is necessary (this is often the case where a building permit is declined)
Code -99 if there was no output.
263. OUTP ADAPTIVE APPROACH
s-q [0..4] Output adaptive approach: Degree to which the output is characterised by an adaptive approach. Adaptive approach refers to adapting measures to new knowledge or chang-ing conditions. It does not mean that overall goals can be altered, but rather that the means, strategies and interim targets to achieve them can be adapted.
0 = the output was not designed to allow for adaptation; 2 = the output was designed to allow for some degree of adaptation; 4 = the output was designed to be fully adaptable as to the means to achieve its goals.
Code -99 if there was no output.
264. OUTP FLEXIBLE GOALS
s-q [0..4] Output flexible environmental goals: Degree to which the overall environmental goals of the output were flexible.
0 = the environmental goals of the output were fully fixed and not alterable; 4 = the environmental goals of the output were fully flexible and/or negotiable.
Code -99 if there was no output.
265. OUTP SUSTY PERSPECTIVE
s-q [0..4] Output sustainability perspective: Degree to which a sustainability perspective was adopted in the output. “Sustainable development is development that meets the needs of the present without compromising the ability of future generations to meet their own needs” (Brundtland report, WCED 1987).
0 = The output did not consider sustainable development. 1..3 = The output was shaped in a way that it considered sustainable development to a certain degree. 4 = The output was shaped in a way that it considered sustainable development as far as possible within the limits of the issue at stake.
Code -99 if there was no output.
266. OUTP ADDIT qual. Text area (rel)
Output additional: Describe any important additional environmental outputs that are broader than the originally defined issue/goal(s) (e.g. new problems were tackled that did not appear in the original problem-framing or agenda).
Code -99 if nothing to add.
D.I.2 Information and learning
267. OUTP INFO GAIN s-q [0..4] Output information gain: Degree to which additional information in the sense of con-textualised, local (including traditional and indigenous) knowledge informed the output. This kind of knowledge is characterised as implicit, informal, context-dependent, and resulting from collective experience, and can concern known parameters and/or new perspectives. This includes knowledge that may be ‘expert’ knowledge (e.g. of local people) but not in the sense of knowledge that is published (e.g. in a handbook) (cf. Berkes & Folke 2002: 122).
0 = contextualised, local knowledge did not contribute to the output; 2 = contextualised, local knowledge contributed to the output; 4 = contextualised, local knowledge was decisive for producing the output.
Code -99 if there was no local knowledge to draw on, or if there was no output.
51
268. OUTP INNOV s-q [0..4] Innovation: Did the output present an innovative, novel solution in the sense of a solu-tion addressing the issue at hand that had not been discussed before the DMP? This need not be an innovation in the sense of an ‘invention’ in global comparison.
0 = the output did not include innovative elements but only reflected was known and had been discussed before the DMP; 2 = the output included considerable innovative elements; 4 = the core of the output was innovative.
Code -99 if there was no output.
269. PRBL REDEF qual. Text area
Problem redefinition: If the problem was reframed or redefined in the course of the DMP, briefly describe how.
D.II SOCIAL OUTCOMES
D.I I .1 Acceptance of output
270. MUTUAL GAINS s-q [0..4] Mutual gains: Degree to which win-win solutions were developed during the DMP (i.e. degree to which the output provided mutual gains).
Win-win (or Pareto optimal) solutions are those that provide gains (or at least: no loss-es) to all involved parties. These are always positive-sum solutions compared to the non-collaborative alternative. Win-win solutions include solutions where compensation is provided to those who would otherwise suffer losses. Win-win solutions are not necessarily limited to the environmental issue at hand, but may be linked to alternative issues and competing interests on and off the table, as well as to future decisions (Wondolleck & Yaffee 2000: 50).
0 = output provided no mutual gains; 2 = output provided moderate gains for some stakeholder groups; 4 = output provided high gains for all stakeholder groups.
Code -99 if there was no output.
271. CONFL RESOL s-q [-4..4] (99)
Conflict resolution: Degree to which an existing conflict was resolved or worsened or a new conflict developed. Consider the nature of change in any pre-existing conflict of values and/or distribution identified in variables 77. CONFL VALUES and 78. CONFL DISTN.
-4 = conflict severely intensified or developed in the first place; 0 = degree of conflict did not change during the process; 4 = existing conflict was fully resolved.
272. ADDR ACCEP s-q [0..2] Addressees acceptance: Acceptance of the decision on the part of those actors who had to comply with and implement the decision (i.e. those actors coded in 222. POL ADDR).
0 = decision was opposed; 1 = decision was accepted despite reservations regarding its content; 2 = decision was accepted and supported.
Code -99 if there were no policy addressees
273. CA ACCEP s-q [0..2] Competent authority acceptance: Acceptance of the decision on the part of the CA.
0 = decision was opposed; 1 = decision was accepted despite reservations regarding its content; 2 = decision was accepted and supported.
Code -99 if there was no CA.
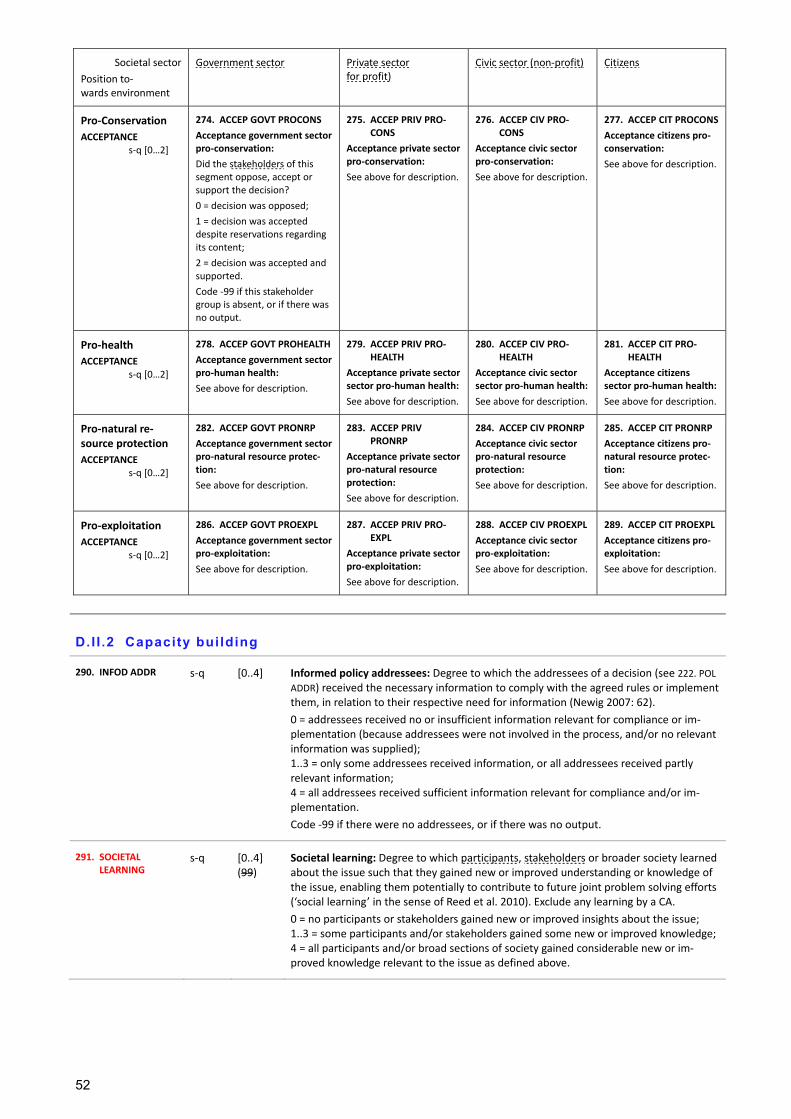
52
Societal sector
Position to- wards environment
Government sector Private sector for profit)
Civic sector (non-profit) Citizens
Pro‐Conservation
ACCEPTANCE s-q [0…2]
274. ACCEP GOVT PROCONS
Acceptance government sector pro‐conservation:
Did the stakeholders of this segment oppose, accept or support the decision?
0 = decision was opposed;
1 = decision was accepted despite reservations regarding its content;
2 = decision was accepted and supported.
Code -99 if this stakeholder group is absent, or if there was no output.
275. ACCEP PRIV PRO‐CONS
Acceptance private sector pro‐conservation:
See above for description.
276. ACCEP CIV PRO‐CONS
Acceptance civic sector pro‐conservation:
See above for description.
277. ACCEP CIT PROCONS
Acceptance citizens pro‐conservation:
See above for description.
Pro‐health
ACCEPTANCE s-q [0…2]
278. ACCEP GOVT PROHEALTH
Acceptance government sector pro‐human health:
See above for description.
279. ACCEP PRIV PRO‐HEALTH
Acceptance private sector sector pro‐human health:
See above for description.
280. ACCEP CIV PRO‐HEALTH
Acceptance civic sector sector pro‐human health:
See above for description.
281. ACCEP CIT PRO‐HEALTH
Acceptance citizens sector pro‐human health:
See above for description.
Pro‐natural re‐source protection
ACCEPTANCE s-q [0…2]
282. ACCEP GOVT PRONRP
Acceptance government sector pro‐natural resource protec‐tion:
See above for description.
283. ACCEP PRIV PRONRP
Acceptance private sector pro‐natural resource protection:
See above for description.
284. ACCEP CIV PRONRP
Acceptance civic sector pro‐natural resource protection:
See above for description.
285. ACCEP CIT PRONRP
Acceptance citizens pro‐natural resource protec‐tion:
See above for description.
Pro‐exploitation
ACCEPTANCE s-q [0…2]
286. ACCEP GOVT PROEXPL
Acceptance government sector pro‐exploitation:
See above for description.
287. ACCEP PRIV PRO‐EXPL
Acceptance private sector pro‐exploitation:
See above for description.
288. ACCEP CIV PROEXPL
Acceptance civic sector pro‐exploitation:
See above for description.
289. ACCEP CIT PROEXPL
Acceptance citizens pro‐exploitation:
See above for description.
D.I I .2 Capacity building
290. INFOD ADDR s-q [0..4] Informed policy addressees: Degree to which the addressees of a decision (see 222. POL ADDR) received the necessary information to comply with the agreed rules or implement them, in relation to their respective need for information (Newig 2007: 62).
0 = addressees received no or insufficient information relevant for compliance or im-plementation (because addressees were not involved in the process, and/or no relevant information was supplied); 1..3 = only some addressees received information, or all addressees received partly relevant information; 4 = all addressees received sufficient information relevant for compliance and/or im-plementation.
Code -99 if there were no addressees, or if there was no output.
291. SOCIETAL LEARNING
s-q [0..4] (99)
Societal learning: Degree to which participants, stakeholders or broader society learned about the issue such that they gained new or improved understanding or knowledge of the issue, enabling them potentially to contribute to future joint problem solving efforts (‘social learning’ in the sense of Reed et al. 2010). Exclude any learning by a CA.
0 = no participants or stakeholders gained new or improved insights about the issue; 1..3 = some participants and/or stakeholders gained some new or improved knowledge;4 = all participants and/or broad sections of society gained considerable new or im-proved knowledge relevant to the issue as defined above.
53
292. INDIV CAPACITY BLDG
s-q [0..4]
(99)
Individual capacity building: Degree to which the skills and capabilities of individual participants or stakeholders were enhanced through involvement in or engagement with the DMP. These skills and capabilities may be specific to the issue at hand, or incidental and applicable to a range of social situations.
0 = individual-level skills and capabilities were not enhanced;
1..3 = significant enhancement of skills and capabilities among a few individuals, or some enhancement of skills and capabilities among many individuals;
4 = significant enhancement of skills and capabilities among many individuals.
293. COMPENSATION s-q [0..4] Compensation: Degree to which compensation was awarded to groups that would (potentially) suffer from implications of the decision.
0 = no compensation was awarded; 4 = all groups that (potentially) suffer from a decision were awarded adequate compen-sation.
Code -99 if no groups were affected in a way that compensation would make any sense.
294. SC BUILDING TRUST
s-q [-4..4] (99)
Social capital building (trust): Degree to which trust relationships were created or strengthened among participants (and potentially beyond), which can be expected to “facilitate coordination and cooperation for mutual benefit” (Putnam 1995: 67, see also Ansell & Gash 2008). “Trust is the willingness to accept vulnerability based on positive expectations about another’s intentions or behaviors” (McEvily et al. 2003).
-4 = existing trust relationships were seriously undermined, or distrust was built up; 0 = there was no change in trust relationships; 4 = trust relationships in the above sense were significantly built up or strengthened.
295. SC BUILDING NETWK
s-q [-4..4] (99)
Social capital building (networks): Degree to which social networks were created or built on (or undermined) among participants and beyond, taking into account the struc-ture of the network including both ‘weak’ and ‘strong’ ties (Granovetter 1973). Net-works are defined here in the sense of social capital building, which can be expected to “facilitate coordination and cooperation for mutual benefit” (Putnam 1995: 67; also cf. http://www.socialcapitalresearch.com/definition.html) regarding capacity to address the problem or similar issues.
-4 = existing network relations were seriously undermined; 0 = there was no change in social networks; 4 = network relations were significantly built on or strengthened.
296. SC BUILDING SHARED NORMS
s-q [-4..4] (99)
Social capital building (shared norms): Degree to which social capital among partici-pants (and potentially beyond) was created or strengthened in the sense of “informal values or norms shared among members of a group that permit cooperation among them” (Fukuyama 1997).
-4 = shared norms were seriously undermined; 0 = there was no change in shared norms; 4 = shared norms were significantly built up or strengthened.
D.II .3 Other
297. OUTC ECON s-q [-4..4] (99)
Outcomes economic: Degree to which outcomes - in the sense of all intended conse-quences of the DMP - were economically positive or negative. Economic outcomes include consequences for productivity, competitiveness, standard of living, employment rate, or general economic well-being at the level of the region at issue (as identified in 50. GOVCE SCALE LEVEL), taking into consideration possible negative or positive externali-ties to other regions, if data are available.
-4 = DMP produced strongly negative economic outcomes; 0 = DMP had no economic consequences; 4 = DMP produced strongly positive economic outcomes.
298. OUTC SOCIAL s-q [-4..4] (99)
Outcomes social equity: Degree to which outcomes - in the sense of all intended conse-quences of the DMP - were socially equitable in a distributional justice sense. Social equity refers to the distribution of all types of costs and benefits (e.g. economic, envi-ronmental, access to information, education). -4 = DMP produced strongly negative social equity outcomes; 0 = DMP had no social equity consequences; 4 = DMP produced strongly positive social equity outcomes.
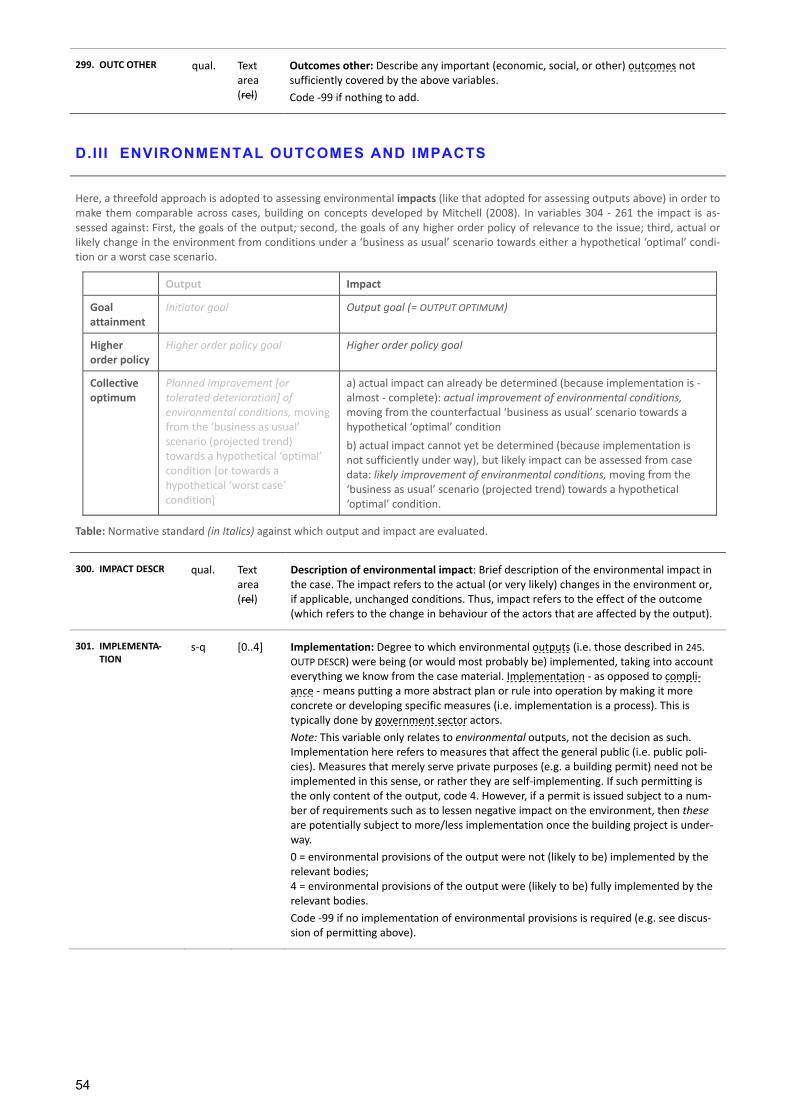
54
299. OUTC OTHER qual. Text area (rel)
Outcomes other: Describe any important (economic, social, or other) outcomes not sufficiently covered by the above variables.
Code -99 if nothing to add.
D.II I ENVIRONMENTAL OUTCOMES AND IMPACTS
Here, a threefold approach is adopted to assessing environmental impacts (like that adopted for assessing outputs above) in order to make them comparable across cases, building on concepts developed by Mitchell (2008). In variables 304 - 261 the impact is as-sessed against: First, the goals of the output; second, the goals of any higher order policy of relevance to the issue; third, actual or likely change in the environment from conditions under a ‘business as usual’ scenario towards either a hypothetical ‘optimal’ condi-tion or a worst case scenario.
Output Impact
Goal attainment
Initiator goal Output goal (= OUTPUT OPTIMUM)
Higher order policy
Higher order policy goal Higher order policy goal
Collective optimum
Planned improvement [or tolerated deterioration] of environmental conditions, moving from the ‘business as usual’ scenario (projected trend) towards a hypothetical ‘optimal’ condition [or towards a hypothetical ‘worst case’ condition]
a) actual impact can already be determined (because implementation is - almost - complete): actual improvement of environmental conditions, moving from the counterfactual ‘business as usual’ scenario towards a hypothetical ‘optimal’ condition
b) actual impact cannot yet be determined (because implementation is not sufficiently under way), but likely impact can be assessed from case data: likely improvement of environmental conditions, moving from the ‘business as usual’ scenario (projected trend) towards a hypothetical ‘optimal’ condition.
Table: Normative standard (in Italics) against which output and impact are evaluated.
300. IMPACT DESCR qual. Text area (rel)
Description of environmental impact: Brief description of the environmental impact in the case. The impact refers to the actual (or very likely) changes in the environment or, if applicable, unchanged conditions. Thus, impact refers to the effect of the outcome (which refers to the change in behaviour of the actors that are affected by the output).
301. IMPLEMENTA‐TION
s-q [0..4] Implementation: Degree to which environmental outputs (i.e. those described in 245. OUTP DESCR) were being (or would most probably be) implemented, taking into account everything we know from the case material. Implementation - as opposed to compli-ance - means putting a more abstract plan or rule into operation by making it more concrete or developing specific measures (i.e. implementation is a process). This is typically done by government sector actors.
Note: This variable only relates to environmental outputs, not the decision as such. Implementation here refers to measures that affect the general public (i.e. public poli-cies). Measures that merely serve private purposes (e.g. a building permit) need not be implemented in this sense, or rather they are self-implementing. If such permitting is the only content of the output, code 4. However, if a permit is issued subject to a num-ber of requirements such as to lessen negative impact on the environment, then these are potentially subject to more/less implementation once the building project is under-way.
0 = environmental provisions of the output were not (likely to be) implemented by the relevant bodies; 4 = environmental provisions of the output were (likely to be) fully implemented by the relevant bodies.
Code -99 if no implementation of environmental provisions is required (e.g. see discus-sion of permitting above).
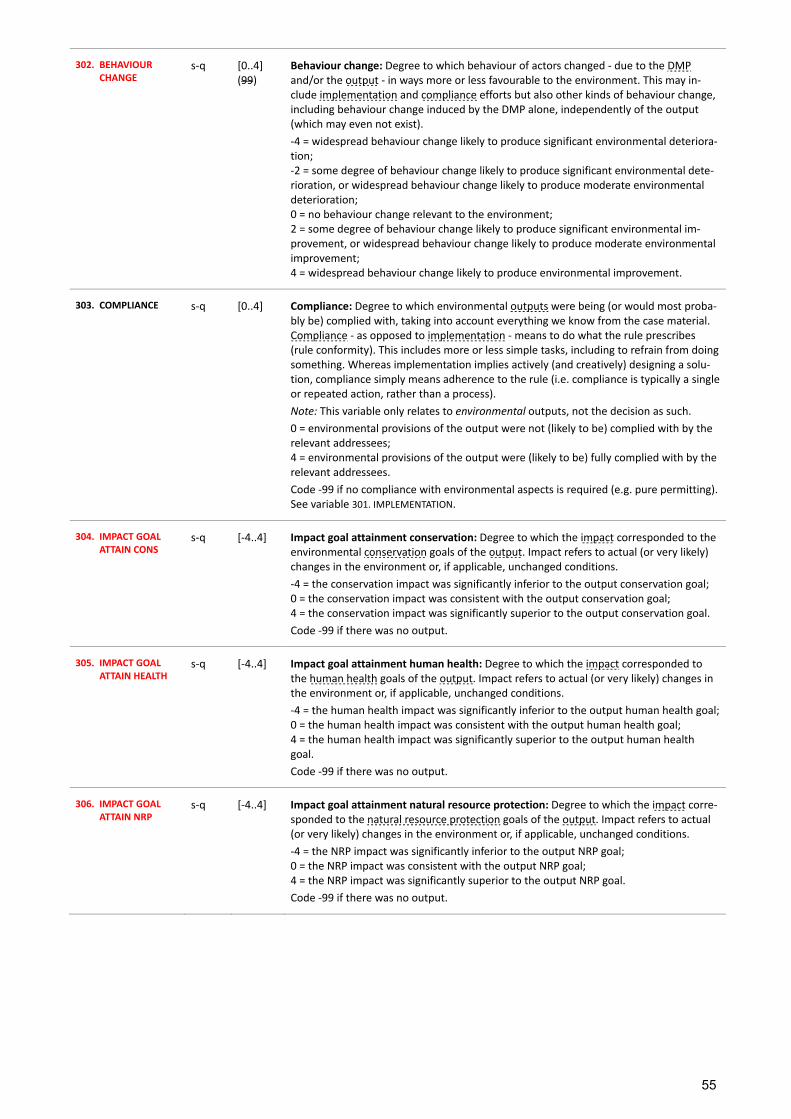
55
302. BEHAVIOUR CHANGE
s-q [0..4] (99)
Behaviour change: Degree to which behaviour of actors changed - due to the DMP and/or the output - in ways more or less favourable to the environment. This may in-clude implementation and compliance efforts but also other kinds of behaviour change, including behaviour change induced by the DMP alone, independently of the output (which may even not exist).
-4 = widespread behaviour change likely to produce significant environmental deteriora-tion; -2 = some degree of behaviour change likely to produce significant environmental dete-rioration, or widespread behaviour change likely to produce moderate environmental deterioration; 0 = no behaviour change relevant to the environment; 2 = some degree of behaviour change likely to produce significant environmental im-provement, or widespread behaviour change likely to produce moderate environmental improvement; 4 = widespread behaviour change likely to produce environmental improvement.
303. COMPLIANCE s-q [0..4] Compliance: Degree to which environmental outputs were being (or would most proba-bly be) complied with, taking into account everything we know from the case material. Compliance - as opposed to implementation - means to do what the rule prescribes (rule conformity). This includes more or less simple tasks, including to refrain from doing something. Whereas implementation implies actively (and creatively) designing a solu-tion, compliance simply means adherence to the rule (i.e. compliance is typically a single or repeated action, rather than a process).
Note: This variable only relates to environmental outputs, not the decision as such.
0 = environmental provisions of the output were not (likely to be) complied with by the relevant addressees; 4 = environmental provisions of the output were (likely to be) fully complied with by the relevant addressees.
Code -99 if no compliance with environmental aspects is required (e.g. pure permitting). See variable 301. IMPLEMENTATION.
304. IMPACT GOAL ATTAIN CONS
s-q [-4..4]
Impact goal attainment conservation: Degree to which the impact corresponded to the environmental conservation goals of the output. Impact refers to actual (or very likely) changes in the environment or, if applicable, unchanged conditions.
-4 = the conservation impact was significantly inferior to the output conservation goal; 0 = the conservation impact was consistent with the output conservation goal; 4 = the conservation impact was significantly superior to the output conservation goal.
Code -99 if there was no output.
305. IMPACT GOAL ATTAIN HEALTH
s-q [-4..4]
Impact goal attainment human health: Degree to which the impact corresponded to the human health goals of the output. Impact refers to actual (or very likely) changes in the environment or, if applicable, unchanged conditions.
-4 = the human health impact was significantly inferior to the output human health goal;0 = the human health impact was consistent with the output human health goal; 4 = the human health impact was significantly superior to the output human health goal.
Code -99 if there was no output.
306. IMPACT GOAL ATTAIN NRP
s-q [-4..4]
Impact goal attainment natural resource protection: Degree to which the impact corre-sponded to the natural resource protection goals of the output. Impact refers to actual (or very likely) changes in the environment or, if applicable, unchanged conditions.
-4 = the NRP impact was significantly inferior to the output NRP goal; 0 = the NRP impact was consistent with the output NRP goal; 4 = the NRP impact was significantly superior to the output NRP goal.
Code -99 if there was no output.
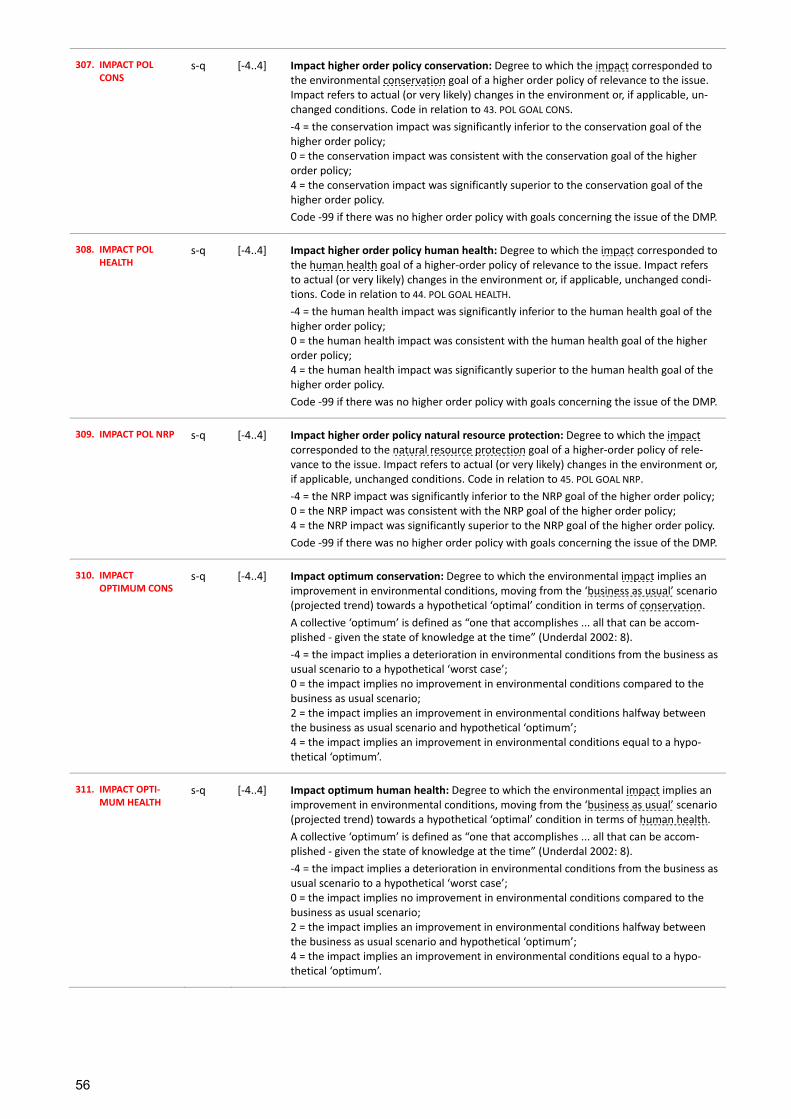
56
307. IMPACT POL CONS
s-q [-4..4] Impact higher order policy conservation: Degree to which the impact corresponded to the environmental conservation goal of a higher order policy of relevance to the issue. Impact refers to actual (or very likely) changes in the environment or, if applicable, un-changed conditions. Code in relation to 43. POL GOAL CONS.
-4 = the conservation impact was significantly inferior to the conservation goal of the higher order policy; 0 = the conservation impact was consistent with the conservation goal of the higher order policy; 4 = the conservation impact was significantly superior to the conservation goal of the higher order policy.
Code -99 if there was no higher order policy with goals concerning the issue of the DMP.
308. IMPACT POL HEALTH
s-q [-4..4] Impact higher order policy human health: Degree to which the impact corresponded to the human health goal of a higher-order policy of relevance to the issue. Impact refers to actual (or very likely) changes in the environment or, if applicable, unchanged condi-tions. Code in relation to 44. POL GOAL HEALTH.
-4 = the human health impact was significantly inferior to the human health goal of the higher order policy; 0 = the human health impact was consistent with the human health goal of the higher order policy; 4 = the human health impact was significantly superior to the human health goal of the higher order policy.
Code -99 if there was no higher order policy with goals concerning the issue of the DMP.
309. IMPACT POL NRP s-q [-4..4] Impact higher order policy natural resource protection: Degree to which the impact corresponded to the natural resource protection goal of a higher-order policy of rele-vance to the issue. Impact refers to actual (or very likely) changes in the environment or, if applicable, unchanged conditions. Code in relation to 45. POL GOAL NRP.
-4 = the NRP impact was significantly inferior to the NRP goal of the higher order policy; 0 = the NRP impact was consistent with the NRP goal of the higher order policy; 4 = the NRP impact was significantly superior to the NRP goal of the higher order policy.
Code -99 if there was no higher order policy with goals concerning the issue of the DMP.
310. IMPACT OPTIMUM CONS
s-q [-4..4] Impact optimum conservation: Degree to which the environmental impact implies an improvement in environmental conditions, moving from the ‘business as usual’ scenario (projected trend) towards a hypothetical ‘optimal’ condition in terms of conservation.
A collective ‘optimum’ is defined as “one that accomplishes ... all that can be accom-plished - given the state of knowledge at the time” (Underdal 2002: 8).
-4 = the impact implies a deterioration in environmental conditions from the business as usual scenario to a hypothetical ‘worst case’; 0 = the impact implies no improvement in environmental conditions compared to the business as usual scenario; 2 = the impact implies an improvement in environmental conditions halfway between the business as usual scenario and hypothetical ‘optimum’; 4 = the impact implies an improvement in environmental conditions equal to a hypo-thetical ‘optimum’.
311. IMPACT OPTI‐MUM HEALTH
s-q [-4..4] Impact optimum human health: Degree to which the environmental impact implies an improvement in environmental conditions, moving from the ‘business as usual’ scenario (projected trend) towards a hypothetical ‘optimal’ condition in terms of human health.
A collective ‘optimum’ is defined as “one that accomplishes ... all that can be accom-plished - given the state of knowledge at the time” (Underdal 2002: 8).
-4 = the impact implies a deterioration in environmental conditions from the business as usual scenario to a hypothetical ‘worst case’; 0 = the impact implies no improvement in environmental conditions compared to the business as usual scenario; 2 = the impact implies an improvement in environmental conditions halfway between the business as usual scenario and hypothetical ‘optimum’; 4 = the impact implies an improvement in environmental conditions equal to a hypo-thetical ‘optimum’.
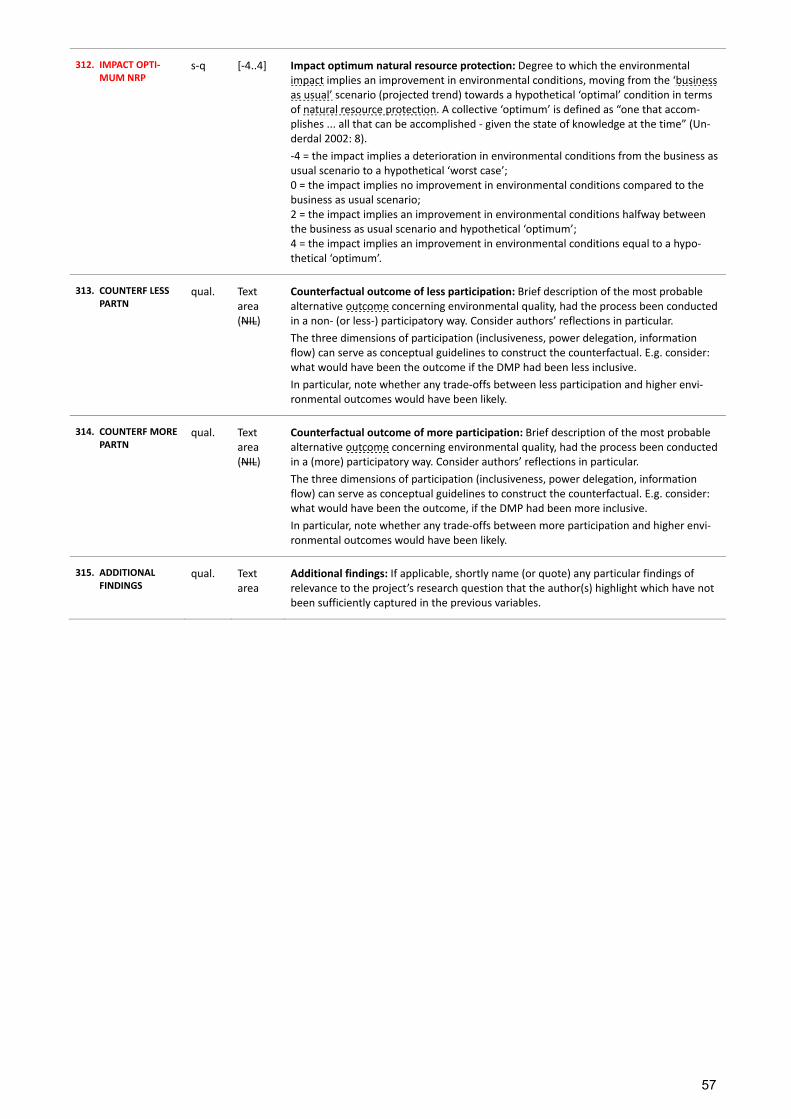
57
312. IMPACT OPTI‐MUM NRP
s-q [-4..4] Impact optimum natural resource protection: Degree to which the environmental impact implies an improvement in environmental conditions, moving from the ‘business as usual’ scenario (projected trend) towards a hypothetical ‘optimal’ condition in terms of natural resource protection. A collective ‘optimum’ is defined as “one that accom-plishes ... all that can be accomplished - given the state of knowledge at the time” (Un-derdal 2002: 8).
-4 = the impact implies a deterioration in environmental conditions from the business as usual scenario to a hypothetical ‘worst case’; 0 = the impact implies no improvement in environmental conditions compared to the business as usual scenario; 2 = the impact implies an improvement in environmental conditions halfway between the business as usual scenario and hypothetical ‘optimum’; 4 = the impact implies an improvement in environmental conditions equal to a hypo-thetical ‘optimum’.
313. COUNTERF LESS PARTN
qual. Text area (NIL)
Counterfactual outcome of less participation: Brief description of the most probable alternative outcome concerning environmental quality, had the process been conducted in a non- (or less-) participatory way. Consider authors’ reflections in particular.
The three dimensions of participation (inclusiveness, power delegation, information flow) can serve as conceptual guidelines to construct the counterfactual. E.g. consider: what would have been the outcome if the DMP had been less inclusive.
In particular, note whether any trade-offs between less participation and higher envi-ronmental outcomes would have been likely.
314. COUNTERF MORE PARTN
qual. Text area (NIL)
Counterfactual outcome of more participation: Brief description of the most probable alternative outcome concerning environmental quality, had the process been conducted in a (more) participatory way. Consider authors’ reflections in particular.
The three dimensions of participation (inclusiveness, power delegation, information flow) can serve as conceptual guidelines to construct the counterfactual. E.g. consider: what would have been the outcome, if the DMP had been more inclusive.
In particular, note whether any trade-offs between more participation and higher envi-ronmental outcomes would have been likely.
315. ADDITIONAL FINDINGS
qual. Text area
Additional findings: If applicable, shortly name (or quote) any particular findings of relevance to the project’s research question that the author(s) highlight which have not been sufficiently captured in the previous variables.
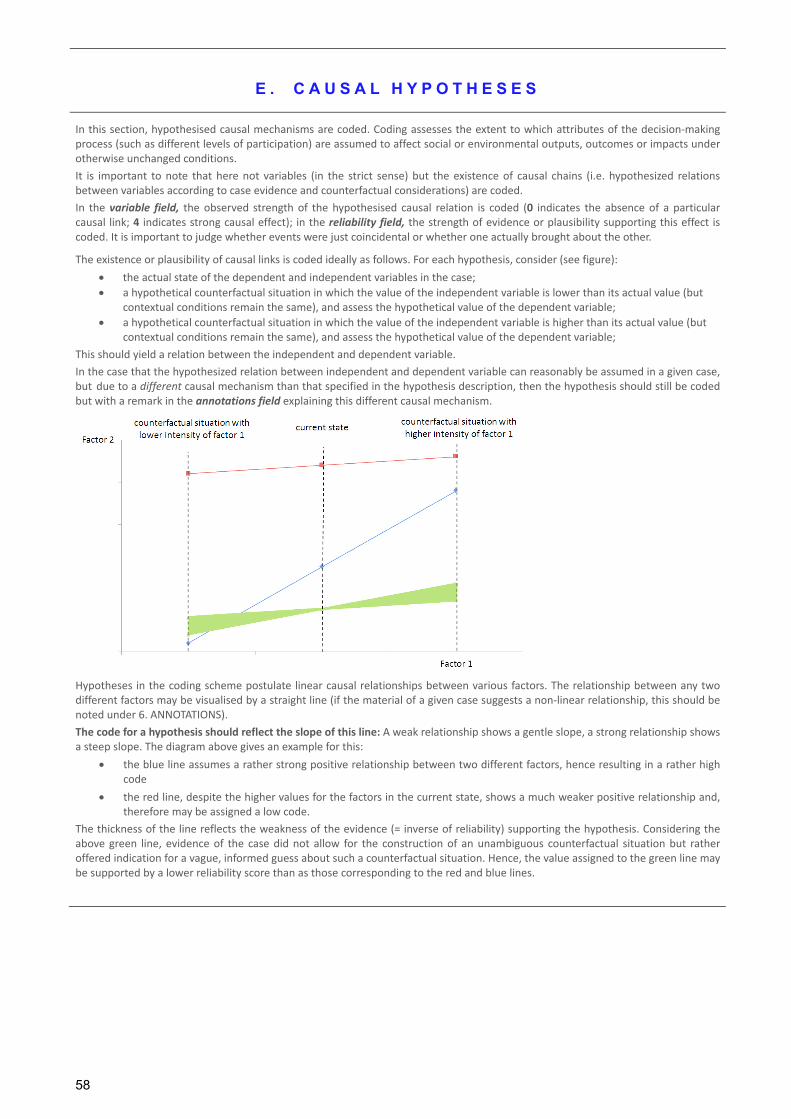
58
E . C A U S A L H Y P O T H E S E S
In this section, hypothesised causal mechanisms are coded. Coding assesses the extent to which attributes of the decision-making process (such as different levels of participation) are assumed to affect social or environmental outputs, outcomes or impacts under otherwise unchanged conditions.
It is important to note that here not variables (in the strict sense) but the existence of causal chains (i.e. hypothesized relations between variables according to case evidence and counterfactual considerations) are coded.
In the variable field, the observed strength of the hypothesised causal relation is coded (0 indicates the absence of a particular causal link; 4 indicates strong causal effect); in the reliability field, the strength of evidence or plausibility supporting this effect is coded. It is important to judge whether events were just coincidental or whether one actually brought about the other.
The existence or plausibility of causal links is coded ideally as follows. For each hypothesis, consider (see figure):
the actual state of the dependent and independent variables in the case;
a hypothetical counterfactual situation in which the value of the independent variable is lower than its actual value (but contextual conditions remain the same), and assess the hypothetical value of the dependent variable;
a hypothetical counterfactual situation in which the value of the independent variable is higher than its actual value (but contextual conditions remain the same), and assess the hypothetical value of the dependent variable;
This should yield a relation between the independent and dependent variable.
In the case that the hypothesized relation between independent and dependent variable can reasonably be assumed in a given case, but due to a different causal mechanism than that specified in the hypothesis description, then the hypothesis should still be coded but with a remark in the annotations field explaining this different causal mechanism.
Hypotheses in the coding scheme postulate linear causal relationships between various factors. The relationship between any two different factors may be visualised by a straight line (if the material of a given case suggests a non-linear relationship, this should be noted under 6. ANNOTATIONS).
The code for a hypothesis should reflect the slope of this line: A weak relationship shows a gentle slope, a strong relationship shows a steep slope. The diagram above gives an example for this:
the blue line assumes a rather strong positive relationship between two different factors, hence resulting in a rather high code
the red line, despite the higher values for the factors in the current state, shows a much weaker positive relationship and, therefore may be assigned a low code.
The thickness of the line reflects the weakness of the evidence (= inverse of reliability) supporting the hypothesis. Considering the above green line, evidence of the case did not allow for the construction of an unambiguous counterfactual situation but rather offered indication for a vague, informed guess about such a counterfactual situation. Hence, the value assigned to the green line may be supported by a lower reliability score than as those corresponding to the red and blue lines.
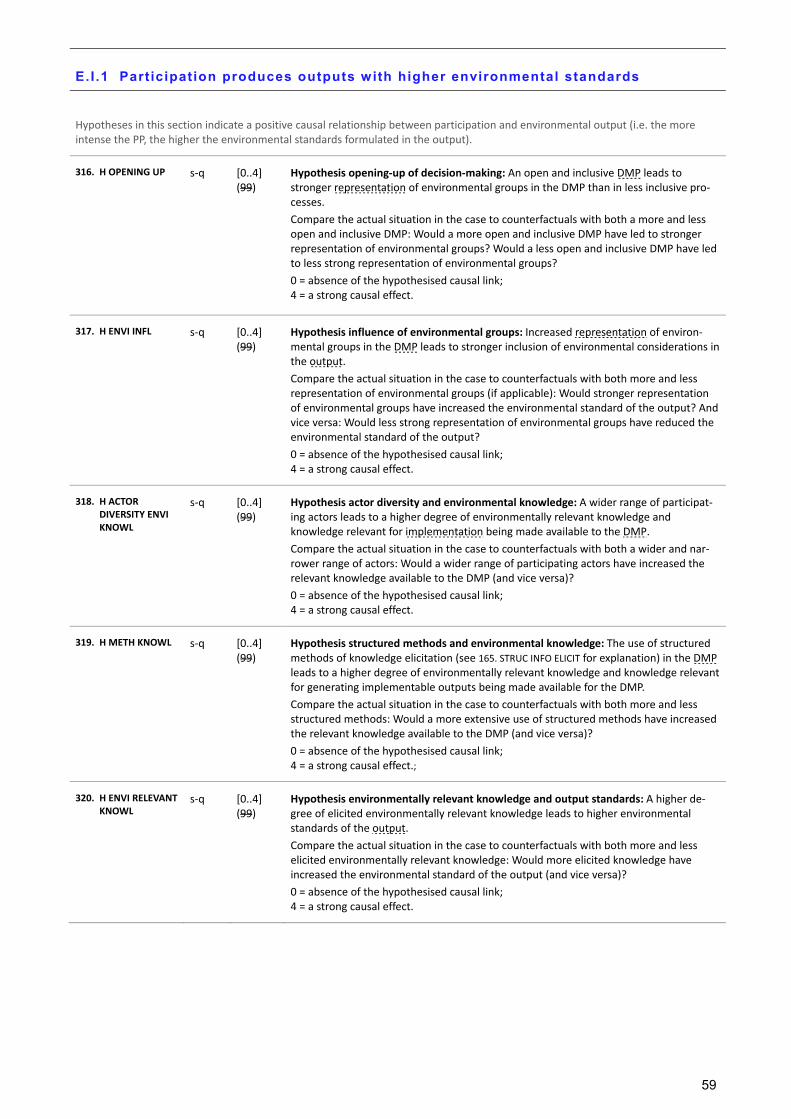
59
E.I .1 Participation produces outputs with higher environmental standards
Hypotheses in this section indicate a positive causal relationship between participation and environmental output (i.e. the more intense the PP, the higher the environmental standards formulated in the output).
316. H OPENING UP s-q [0..4] (99)
Hypothesis opening‐up of decision‐making: An open and inclusive DMP leads to stronger representation of environmental groups in the DMP than in less inclusive pro-cesses.
Compare the actual situation in the case to counterfactuals with both a more and less open and inclusive DMP: Would a more open and inclusive DMP have led to stronger representation of environmental groups? Would a less open and inclusive DMP have led to less strong representation of environmental groups?
0 = absence of the hypothesised causal link; 4 = a strong causal effect.
317. H ENVI INFL s-q [0..4] (99)
Hypothesis influence of environmental groups: Increased representation of environ-mental groups in the DMP leads to stronger inclusion of environmental considerations in the output.
Compare the actual situation in the case to counterfactuals with both more and less representation of environmental groups (if applicable): Would stronger representation of environmental groups have increased the environmental standard of the output? And vice versa: Would less strong representation of environmental groups have reduced the environmental standard of the output?
0 = absence of the hypothesised causal link; 4 = a strong causal effect.
318. H ACTOR DIVERSITY ENVI KNOWL
s-q [0..4] (99)
Hypothesis actor diversity and environmental knowledge: A wider range of participat-ing actors leads to a higher degree of environmentally relevant knowledge and knowledge relevant for implementation being made available to the DMP.
Compare the actual situation in the case to counterfactuals with both a wider and nar-rower range of actors: Would a wider range of participating actors have increased the relevant knowledge available to the DMP (and vice versa)?
0 = absence of the hypothesised causal link; 4 = a strong causal effect.
319. H METH KNOWL s-q [0..4] (99)
Hypothesis structured methods and environmental knowledge: The use of structured methods of knowledge elicitation (see 165. STRUC INFO ELICIT for explanation) in the DMP leads to a higher degree of environmentally relevant knowledge and knowledge relevant for generating implementable outputs being made available for the DMP.
Compare the actual situation in the case to counterfactuals with both more and less structured methods: Would a more extensive use of structured methods have increased the relevant knowledge available to the DMP (and vice versa)?
0 = absence of the hypothesised causal link; 4 = a strong causal effect.;
320. H ENVI RELEVANT KNOWL
s-q [0..4] (99)
Hypothesis environmentally relevant knowledge and output standards: A higher de-gree of elicited environmentally relevant knowledge leads to higher environmental standards of the output.
Compare the actual situation in the case to counterfactuals with both more and less elicited environmentally relevant knowledge: Would more elicited knowledge have increased the environmental standard of the output (and vice versa)?
0 = absence of the hypothesised causal link; 4 = a strong causal effect.

60
321. H DELIB s-q [0..4] (99)
Hypothesis deliberation: A process setting characterised by discursive fairness leads to the formation or transformation of participants’ views oriented towards the common good (Smith 2003: 63-64, quoting Miller 1992, Goodin 1996). See also Dryzek (1995). ‘Orientation towards a common good’ is defined here as the transgression of personal interests, i.e. a focus on solving the problem rather than securing personal benefits.
Compare the actual situation in the case to counterfactuals with settings characterised by both more and less discursive fairness: Would a more discursively fair setting have increased the (trans)formation of participants’ views towards the common good (and vice versa)?
0 = absence of the hypothesised causal link; 4 = a strong causal effect.
322. H COMMON GOOD
s-q [0..4] (99)
Hypothesis common good orientation: Stronger orientation of participants towards the common good leads to higher environmental standards of the output (Smith 2003: 63). ‘Orientation towards a common good’ is defined here as the transgression of personal interests, i.e. a focus on solving the problem rather than securing personal benefits.
Compare the actual situation in the case to counterfactuals with both stronger and weaker orientation of participants towards the common good: Would a stronger orien-tation of participants towards the common good have increased the environmental standards of the output (and vice versa)?
0 = absence of the hypothesised causal link; 4 = a strong causal effect.
323. H NEGOTIATION s-q [0..4] (99)
Hypothesis effects of negotiation: A DMP characterised by a higher degree of commu-nication and bargaining leads to the identification of an optimal allocation/solution, such that a positive-sum game results.
Extreme example: Two parties battle over a single egg. A participatory setting enables them to talk in a rational manner in which they find out that one party is interested in the egg yolk, and the other in the egg white only, thus giving each party what it really wants.
Compare the actual situation in the case to counterfactuals with both more and less communication and bargaining: Would more communication and bargaining have in-creased the likelihood of identification of an optimal allocation/solution (and vice ver-sa)?
0 = absence of the hypothesised causal link; 4 = a strong causal effect.
324. H POSITIVE SUM GAME
s-q [0..4] (99)
Hypothesis effects of positive‐sum solution: Positive-sum results of a DMP (see 323. H NEGOTIATION) lead to higher environmental standards of the output (because everyone profits, including ‘the environment’).
Compare the actual situation in the case to counterfactuals with both more and fewer positive-sum results: Would more positive-sum-results have increased the environmen-tal standards of the output (and vice versa)?
0 = absence of the hypothesised causal link; 4 = a strong causal effect.
325. H CREATIVITY s-q [0..4] (99)
Hypothesis creativity: A DMP characterised by open dialogue (involving open-minded communication atmosphere) leads to the collective development of more creative, innovative solutions.
Compare the actual situation in the case to counterfactuals with more or less open dialogue: Would more open dialogue have increased the generation of innovative ideas (and vice versa)?
0 = absence of the hypothesised causal link; 4 = a strong causal effect.
326. H ENVI INNOV s-q [0..4] (99)
Hypothesis environmental effects of innovation: Creative solutions generated in a DMP lead to higher environmental standards of the output (because creative solutions in-volve a positive-sum game benefitting the environment).
Compare the actual situation in the case to counterfactuals with both more and less creative solutions: Would more creative solutions have increased the environmental standards of the output (and vice versa)?
0 = absence of the hypothesised causal link; 4 = a strong causal effect.
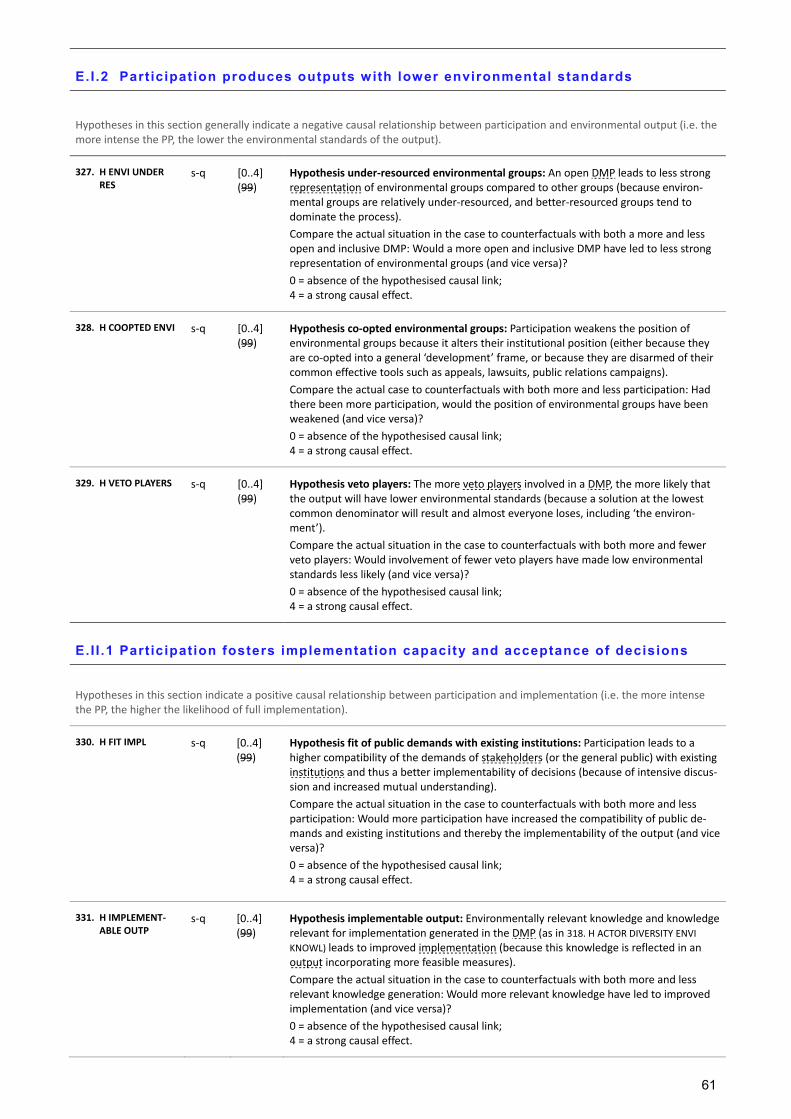
61
E.I .2 Participation produces outputs with lower environmental standards
Hypotheses in this section generally indicate a negative causal relationship between participation and environmental output (i.e. the more intense the PP, the lower the environmental standards of the output).
327. H ENVI UNDER RES
s-q [0..4] (99)
Hypothesis under‐resourced environmental groups: An open DMP leads to less strong representation of environmental groups compared to other groups (because environ-mental groups are relatively under-resourced, and better-resourced groups tend to dominate the process).
Compare the actual situation in the case to counterfactuals with both a more and less open and inclusive DMP: Would a more open and inclusive DMP have led to less strong representation of environmental groups (and vice versa)?
0 = absence of the hypothesised causal link; 4 = a strong causal effect.
328. H COOPTED ENVI s-q [0..4] (99)
Hypothesis co‐opted environmental groups: Participation weakens the position of environmental groups because it alters their institutional position (either because they are co-opted into a general ‘development’ frame, or because they are disarmed of their common effective tools such as appeals, lawsuits, public relations campaigns).
Compare the actual case to counterfactuals with both more and less participation: Had there been more participation, would the position of environmental groups have been weakened (and vice versa)?
0 = absence of the hypothesised causal link; 4 = a strong causal effect.
329. H VETO PLAYERS s-q [0..4] (99)
Hypothesis veto players: The more veto players involved in a DMP, the more likely that the output will have lower environmental standards (because a solution at the lowest common denominator will result and almost everyone loses, including ‘the environ-ment’).
Compare the actual situation in the case to counterfactuals with both more and fewer veto players: Would involvement of fewer veto players have made low environmental standards less likely (and vice versa)?
0 = absence of the hypothesised causal link; 4 = a strong causal effect.
E.I I .1 Participation fosters implementation capacity and acceptance of decisions
Hypotheses in this section indicate a positive causal relationship between participation and implementation (i.e. the more intense the PP, the higher the likelihood of full implementation).
330. H FIT IMPL s-q [0..4] (99)
Hypothesis fit of public demands with existing institutions: Participation leads to a higher compatibility of the demands of stakeholders (or the general public) with existing institutions and thus a better implementability of decisions (because of intensive discus-sion and increased mutual understanding).
Compare the actual situation in the case to counterfactuals with both more and less participation: Would more participation have increased the compatibility of public de-mands and existing institutions and thereby the implementability of the output (and vice versa)?
0 = absence of the hypothesised causal link; 4 = a strong causal effect.
331. H IMPLEMENT‐ABLE OUTP
s-q [0..4] (99)
Hypothesis implementable output: Environmentally relevant knowledge and knowledge relevant for implementation generated in the DMP (as in 318. H ACTOR DIVERSITY ENVI KNOWL) leads to improved implementation (because this knowledge is reflected in an output incorporating more feasible measures).
Compare the actual situation in the case to counterfactuals with both more and less relevant knowledge generation: Would more relevant knowledge have led to improved implementation (and vice versa)?
0 = absence of the hypothesised causal link; 4 = a strong causal effect.
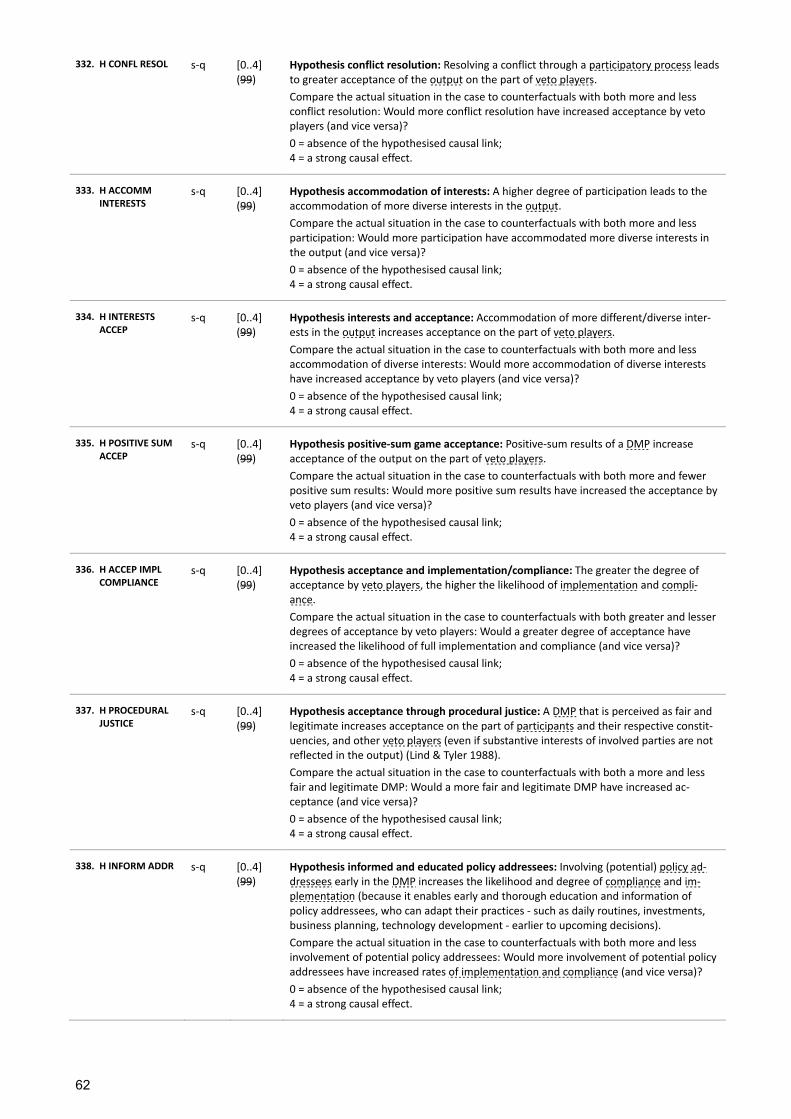
62
332. H CONFL RESOL s-q [0..4] (99)
Hypothesis conflict resolution: Resolving a conflict through a participatory process leads to greater acceptance of the output on the part of veto players.
Compare the actual situation in the case to counterfactuals with both more and less conflict resolution: Would more conflict resolution have increased acceptance by veto players (and vice versa)?
0 = absence of the hypothesised causal link; 4 = a strong causal effect.
333. H ACCOMM INTERESTS
s-q [0..4] (99)
Hypothesis accommodation of interests: A higher degree of participation leads to the accommodation of more diverse interests in the output.
Compare the actual situation in the case to counterfactuals with both more and less participation: Would more participation have accommodated more diverse interests in the output (and vice versa)?
0 = absence of the hypothesised causal link; 4 = a strong causal effect.
334. H INTERESTS ACCEP
s-q [0..4] (99)
Hypothesis interests and acceptance: Accommodation of more different/diverse inter-ests in the output increases acceptance on the part of veto players.
Compare the actual situation in the case to counterfactuals with both more and less accommodation of diverse interests: Would more accommodation of diverse interests have increased acceptance by veto players (and vice versa)?
0 = absence of the hypothesised causal link; 4 = a strong causal effect.
335. H POSITIVE SUM ACCEP
s-q [0..4] (99)
Hypothesis positive‐sum game acceptance: Positive-sum results of a DMP increase acceptance of the output on the part of veto players.
Compare the actual situation in the case to counterfactuals with both more and fewer positive sum results: Would more positive sum results have increased the acceptance by veto players (and vice versa)?
0 = absence of the hypothesised causal link; 4 = a strong causal effect.
336. H ACCEP IMPL COMPLIANCE
s-q [0..4] (99)
Hypothesis acceptance and implementation/compliance: The greater the degree of acceptance by veto players, the higher the likelihood of implementation and compli-ance.
Compare the actual situation in the case to counterfactuals with both greater and lesser degrees of acceptance by veto players: Would a greater degree of acceptance have increased the likelihood of full implementation and compliance (and vice versa)?
0 = absence of the hypothesised causal link; 4 = a strong causal effect.
337. H PROCEDURAL JUSTICE
s-q [0..4] (99)
Hypothesis acceptance through procedural justice: A DMP that is perceived as fair and legitimate increases acceptance on the part of participants and their respective constit-uencies, and other veto players (even if substantive interests of involved parties are not reflected in the output) (Lind & Tyler 1988).
Compare the actual situation in the case to counterfactuals with both a more and less fair and legitimate DMP: Would a more fair and legitimate DMP have increased ac-ceptance (and vice versa)?
0 = absence of the hypothesised causal link; 4 = a strong causal effect.
338. H INFORM ADDR s-q [0..4] (99)
Hypothesis informed and educated policy addressees: Involving (potential) policy ad-dressees early in the DMP increases the likelihood and degree of compliance and im-plementation (because it enables early and thorough education and information of policy addressees, who can adapt their practices - such as daily routines, investments, business planning, technology development - earlier to upcoming decisions).
Compare the actual situation in the case to counterfactuals with both more and less involvement of potential policy addressees: Would more involvement of potential policy addressees have increased rates of implementation and compliance (and vice versa)?
0 = absence of the hypothesised causal link; 4 = a strong causal effect.
63
339. H NETWK CREATION
s-q [0..4] (99)
Hypothesis partnerships and social control for better implementation: Participation provides opportunities for participants to get to know each other and each other’s in-terests and capacities, so that alliances and other networks can develop, which further implementation and/or other environmentally beneficial activities and allow for mutual social control.
Compare the actual situation in the case to counterfactuals with both more and less participation: Would more participation have increased the development of alliances and networks for implementation or other environmentally beneficial activities (and vice versa)?
0 = absence of the hypothesised causal link; 4 = a strong causal effect.
340. H NETWK IMPL s-q [0..4] (99)
Hypothesis networks for implementation: Creation of networks/partnerships (see 339. H NETWK CREATION) leads to improved compliance and implementation. This includes the possibility that participants play a major role in monitoring each other’s compliance and implementation activities.
Compare the actual situation in the case to counterfactuals with both more and less network and partnership creation: Would more network and partnership creation have increased the likelihood of full implementation and compliance (and vice versa)?
0 = absence of the hypothesised causal link; 4 = a strong causal effect.
E.I I .2 Participation fosters opposit ion to decisions
Hypotheses in this section indicate a negative causal relationship between participation and implementation (i.e. the more intense the PP, the lower the likelihood of full implementation).
341. H AWAR DECREASE ACCEP
s-q [0..4] (99)
Hypothesis waking sleeping dogs: Raising stakeholders’ awareness of issues and their involvement in decision-making leads them to consider possible negative effects of decisions and thus increases opposition to environmentally beneficial measures (Coglianese 1997).
Compare the actual situation in the case to counterfactuals with both more and less participation: Would more participation have increased opposition to environmentally beneficial measures (and vice versa)?
0 = absence of the hypothesised causal link; 4 = a strong causal effect.
342. H MISFIT INST s-q [0..4] (99)
Hypothesis misfit of public demands with existing institutions: Participation opens the door for procedural and substantive demands of stakeholders (or the general public), which tend to be incompatible with existing institutions (Bora 1994).
Compare the actual situation in the case to counterfactuals with both more and less participation: Would more participation have decreased the compatibility of public demands and existing institutions (and vice versa)?
0 = absence of the hypothesised causal link; 4 = a strong causal effect.
343. H MISFIT IMPL s-q [0..4] (99)
Hypothesis misfit of public demands with implementability: Participation opens the door for procedural and substantive demands of stakeholders (or the general public), which tend to be less implementable than ‘top-down’ decisions (Bora 1994).
Compare the actual situation in the case to counterfactuals with both more and less participation: Would more participation have decreased the implementability of the output (and vice versa)?
0 = absence of the hypothesised causal link; 4 = a strong causal effect.
64
References
Ansell, C., & Gash, A. (2008). Collaborative Governance in Theory and Practice. Journal of Public Administration Research and Theo‐ry, 18(4), 543-571.
Baumgartner, F. R., & Jones, B. D. (1993). Agendas and instability in American politics. Chicago: University of Chicago Press.
Beierle, T. C., & Cayford, J. (2002). Democracy in Practice. Public Participation in Environmental Decisions. Washington, DC: Re-sources for the Future.
Benson, D., & Jordan, A. (2010). The Scaling of Water Governance Tasks: A comparative federal analysis of the European Union and Australia. Environmental Management, 46(1), 7-16.
Berkes, F. & Folke, C. (2002). Back to the Future: Ecosystem Danymics and Local Knowledge. In L. Gunderson & C.S. Holling (eds.): Panarchy. Understanding transformations in human and natural systems, Washington: Island Press (pp. 121-146).
Bingham, G. (1986). Resolving Environmental Disputes. A Decade of Experience. Washington, D.C.: The Conservation Foundation.
Bora, A. (1994). Grenzen der Partizipation? Risikoentscheidungen und Öffentlichkeitsbeteiligung im Recht. Zeitschrift für Rechtssozi‐ologie, 15(2), 126-152.
Chess, C., & Purcell, K. (1999). Public Participation and the Environment: Do We Know What Works? Environmental Science & Tech‐nology, 33(16), 2685-2692.
Coglianese, C. (1997). Assessing Consensus: The Promise And Performance Of Negotiated Rule-making. Duke Law Journal, 46, 1255-1346.
Cooke, B. (2001). The Social Psychological Limits of Participation? In B. Cooke & U. Kothari (Eds.), Participation: the new tyranny? (pp. 102-121). London, New York: Zed Books.
Cooper, T. L. (1984). Citizenship and Professionalism in Public Administration. Public Administration Review, 44, 143-151.
Creighton, J. L. (1981). The public involvement manual. Cambridge (Mass.): Abt Books.
Dahl, R. A. (1961). Who Governs. New Haven: Yale University Press.
Daniels, S. E., Lawrence, R. L., & Alig, R. J. (1996). Decision-making and ecosystem-based management: applying the Vroom-Yetton model to public participation strategy. Environmental Impact Assessment Review, 16(1), 13-30.
deLeon, P., & deLeon, L. (2002). What Ever Happened to Policy Implementation? An Alternative Approach. Journal of public admin‐istration research and theory, 12(4), 467-492.
Dietz, T., & Stern, P. C. (Eds.). (2008). Public participation in environmental assessment and decision-making. Panel on Public Partici-pation in Environmental Assessment and Decision Making, National Research Council. Washington, D.C.: National Academic Press.
Dryzek, J. S. (1995). Political and ecological communication. Environmental Politics, 4(4), 13-30.
Fukuyama, F. (1997). Social capital and the modern capitalist economy: Creating a high trust workplace. Stern Business Magazine, 4(1).
Fung, A. (2006). Varieties of Participation in Complex Governance. Public Administration Review, 66(Special Issue), 66-75.
George, A. L., & Bennett, A. (2005). Case Studies and Theory Development. Cambridge, Mass.: MIT Press.
Granovetter, M. (1973). The Strength of Weak Ties. American Journal of Sociology, 78(6), 1360-1380.
Heinelt, H. (2002). Achieving Sustainable and Innovative Policies through Participatory Governance in a Multi-level Context: Theo-retical Issues. In H. Heinelt, P. Getimis, G. Kafkalas, R. Smith & E. Swyngedouw (Eds.), Participatory governance in multi‐level Context. Concepts and experience (pp. 17-32). Opladen: Leske + Budrich.
Jensen, J. L., & Rodgers, R. (2001). Cumulating the Intellectual Gold of Case Study Research. Public Administration Review, 61(2), 235-246.
Koontz, T. M. (1999). Citizen Participation: Conflicting Interests in State and National Agency Policy Making. The Social Science Jour‐nal, 36(3), 441-458.
Larsson, R. (1993). Case Survey Methodology: Quantitative Analysis of Patterns across Case Studies. The Academy of Management Journal, 36(6), 1515-1546.
Lauria, M., & Wagner, J. A. (2006). What Can We Learn from Empirical Studies of Planning Theory? A Comparative Case Analysis of Extant Literature. Journal of Planning Education and Research, 25, 364-381.
Lind, E. A., & Tyler, T. R. (1988). The Social Psychology of Procedural Justice. New York, London.
McEvily, B., Perrone, V., & Zaheer, A. (2003). Trust as an Organizing Principle. Organization Science, 14(1), 91-103.
Mitchell, R. B. (2008). Evaluating the Performance of Environmental Institutions: What to Evaluate and How to Evaluate it? In O. R. Young; L. A. King & H. Schroeder (eds.): Institutions and Environmental Change. Principal Findings, Applications and Research Frontiers, Cambridge, Mass. (pp. 79-114).
Newig, J. (2003). Symbolische Umweltgesetzgebung. Rechtssoziologische Untersuchungen am Beispiel des Ozongesetzes, des Kreis‐laufwirtschaft‐ und Abfallgesetzes sowie der Großfeuerungsanlagenverordnung. Berlin: Duncker & Humblot.
Newig, J. (2007). Does public participation in environmental decisions lead to improved environmental quality? Towards an analyti-cal framework. Communication, Cooperation, Participation (International Journal of Sustainability Communication), 1(1), 51-71.
65
Newig, J., & Fritsch, O. (2009). Environmental Governance: Participatory, Multi-Level – And Effective? Environmental Policy and Governance, 19(3), 197-214.
Pressman, J. L., & Wildavsky, A. (1984 [1973]). Implementation: how great expectations in Washington are dashed in Oakland. Berkeley, Calif. et al.: Univ. of Calif. Press.
Putnam, R. D. (1995). Bowling Alone: America's Declining Social Capital. Journal of Democracy, 6(1), 65-78.
Ragin, C. C., & Becker, H. S. (Eds.). (1992). What is a Case? Exploring the Foundations of Social Inquiry. Cambridge, New York, Mel-bourne, Madrid, Cape Town, Singapore, Sao Paulo, Delhi, Dubai, Tokyo, Mexico City.
Reed, M. S. (2008). Stakeholder participation for environmental management: a literature review. Biological Conservation, 114(10), 2417-2431.
Reed, M. S., Evely, A. C., Cundill, G., Fazey, I., Glass, J., Laing, A., Newig, J., Parrish, B., Prell, C., Stringer, L. C. (2010). What is Social Learning? Ecology & Society, 15(2).
Renn, O. (2004). The Challenge of Integrating Deliberation and Expertise. Participation and Discourse in Risk Management. In T. L. MacDaniels & M. J. Small (Eds.), Risk Analysis and Society. An Interdisciplinary Characterization of the Field (pp. 289–366). Cam-bridge: Cambridge University Press.
Rogers, E. M. (1995). Diffusion of innovations (4th ed.). New York: Free Press.
Salamon, L. M., & Anheier, H. K. (1997). Defining the nonprofit sector. Manchester [u.a.]: Manchester Univ. Press.
Schmitter, P. C. (2002). Participation in Governance Arrangements: Is there any reason to expect it will achieve "Sustainable and Innovative Policies in a Multi-Level Context"? In J. R. Grote & B. Gbikpi (Eds.), Participatory Governance. Political and Societal Implications (pp. 51-69).
Smith, G. (2003). Deliberative Democracy and the Environment. London: Routledge.
Stewart, R. B. (1992). Environmental Law in the United States and the European Community: Spillovers, cooperation, rivalry, institu-tions. University of Chicago Legal Forum, 1992, 41-80.
Susskind, L., McKearnan, S., & Thomas-Larmer, J. (Eds.). (1999). The consensus building handbook : a comprehensive guide to reach‐ing agreement. Thousand Oaks, Calif. [u.a.]: Sage Publications.
Susskind, L., J. Thomas-Larmer, et al. (2000). Negotiating environmental agreements. Washington, D.C, Island Press.
Tsebelis, G. (1995). Decision Making in Political Systems: Veto Players in Presidentialism, Parliamentarism, Multicameralism and Multipartism. British Journal of Political Science 25 (3), 289-325.
Underdal, A. (2002). One Question, Two Answers. In E. L. Miles, A. Underdal, S. Andresen, J. Wetterstad, J. B. Skjaerseth & E. M. Carlin (Eds.), Environmental regime effectiveness: Confronting theory with evidence (pp. 3–46). Cambridge, Mass: MIT Press.
Weber, M. (1947, first published 1922). The Theory of Social and Economic Organization. Translated by A. M. Henderson and Talcott Parsons; edited by Talcott Parsons. New York: Free Press.
Webler, T., & Tuler, S. (2000). Fairness and Competence in Citizen Participation. Administration & Society, 32(5), 566-595.
Weible, C. M. (2006). An Advocacy Coalition Framework Approach to Stakeholder Analysis: Understanding the Political Context of California Marine Protected Area Policy. Journal of Public Administration Research and Theory, 17(1), 95-117.
Wolf, K. D. (2002). Contextualizing Normative Standards for Legitimate Governance beyond the State. In J. R. Grote & B. Gbikpi (Eds.), Participatory Governance. Political and Societal Implications (pp. 35–50). Opladen: Leske + Budrich.
World Commission on Environment and Development (1987). Our common future. Oxford: Oxford University Press.
Wondolleck, J.M. and S.L. Yaffee (2000). Making Collaboration Work. Lessons from Innovation in Natural Resource Management (Washington, D.C., Covelo: Island Press).
Yin, R. K., & Heald, K. A. (1975). Using the Case Survey Method to Analyze Policy Studies. Administrative Science Quarterly, 20, 371-381.