Embed Size (px)
Citation preview
Comparative Effectiveness Review Number 8 Comparative Effectiveness and Safety of Oral Diabetes Medications for Adults With Type 2 Diabetes
This report is based on research conducted by The Johns Hopkins University Evidence-based Practice Center (EPC) under contract to the Agency for Healthcare Research and Quality (AHRQ), Rockville, MD (Contract No. 290-02-0018). The findings and conclusions in this document are those of the author(s), who are responsible for its contents; the findings and conclusions do not necessarily represent the views of AHRQ. Therefore, no statement in this report should be construed as an official position of the Agency for Healthcare Research and Quality or of the U.S. Department of Health and Human Services. This report is intended as a reference and not as a substitute for clinical judgment. Anyone who makes decisions concerning the provision of clinical care should consider this report in the same way as any medical reference and in conjunction with all other pertinent information. This report may be used, in whole or in part, as the basis for development of clinical practice guidelines and other quality enhancement tools, or as a basis for reimbursement and coverage policies. AHRQ or U.S. Department of Health and Human Services endorsement of such derivative products may not be stated or implied.
Comparative Effectiveness Review Number 8 Comparative Effectiveness and Safety of Oral Diabetes Medications for Adults With Type 2 Diabetes Prepared for: Agency for Healthcare Research and Quality U.S. Department of Health and Human Services 540 Gaither Road Rockville, MD 20850 www.ahrq.gov Contract No. #290-02-0018 Prepared by:
The Johns Hopkins University Evidence-based Practice Center Investigators Shari Bolen, M.D., M.P.H. Lisa Wilson, Sc.M. Jason Vassy, M.P.H. Leonard Feldman, M.D. Jessica Yeh, Ph.D. Spyridon Marinopoulos, M.D., M.B.A. Renee Wilson, M.Sc. David Cheng Crystal Wiley, M.D. Elizabeth Selvin, Ph.D., M.P.H. David Malaka, M.B.B.S., M.P.H. Charity Akpala, M.B.B.S., M.P.H. Fred Brancati, M.D., M.H.S. Eric Bass, M.D., M.P.H. AHRQ Publication No. 07-EHC010-EF July 2007
ii
This document is in the public domain and may be used and reprinted without permission except those copyrighted materials noted for which further reproduction is prohibited without the specific permission of copyright holders.
Suggested citation: Bolen S, Wilson L, Vassy J, Feldman L, Yeh J, Marinopoulos S, Wilson R, Cheng D, Wiley C, Selvin E, Malaka D, Akpala C, Brancati F, Bass E. Comparative Effectiveness and Safety of Oral Diabetes Medications for Adults With Type 2 Diabetes. Comparative Effectiveness Review No. 8. (Prepared by Johns Hopkins Evidence-based Practice Center under Contract No. 290-02-0018.) Rockville, MD: Agency for Healthcare Research and Quality. July 2007. Available at: www.effectivehealthcare.ahrq.gov/reports/final.cfm.
None of the investigators has any affiliations or financial involvement that conflicts with the material presented in this report.
iii
Preface The Agency for Healthcare Research and Quality (AHRQ) conducts the Effective Health Care Program as part of its mission to organize knowledge and make it available to inform decisions about health care. As part of the Medicare Prescription Drug, Improvement, and Modernization Act of 2003, Congress directed AHRQ to conduct and support research on the comparative outcomes, clinical effectiveness, and appropriateness of pharmaceuticals, devices, and health care services to meet the needs of Medicare, Medicaid, and the State Children’s Health Insurance Program (SCHIP). AHRQ has an established network of Evidence-based Practice Centers (EPCs) that produce Evidence Reports/Technology Assessments to assist public- and private-sector organizations in their efforts to improve the quality of health care. The EPCs now lend their expertise to the Effective Health Care Program by conducting Comparative Effectiveness Reviews of medications, devices, and other relevant interventions, including strategies for how these items and services can best be organized, managed, and delivered. Systematic reviews are the building blocks underlying evidence-based practice; they focus attention on the strengths and limits of evidence from research studies about the effectiveness and safety of a clinical intervention. In the context of developing recommendations for practice, systematic reviews are useful because they define the strengths and limits of the evidence, clarifying whether assertions about the value of the intervention are based on strong evidence from clinical studies. For more information about systematic reviews, see http://effectivehealthcare.ahrq.gov/reference/purpose.cfm. AHRQ expects that Comparative Effectiveness Reviews will be helpful to health plans, providers, purchasers, government programs, and the health care system as a whole. In addition, AHRQ is committed to presenting information in different formats so that consumers who make decisions about their own and their family’s health can benefit from the evidence. Transparency and stakeholder input are essential to the Effective Health Care Program. Please visit the Web site (www.effectivehealthcare.ahrq.gov) to see draft research questions and reports or to join an e-mail list to learn about new program products and opportunities for input. Comparative Effectiveness Reviews will be updated regularly.
iv
Acknowledgments The Evidence-based Practice Center thanks Karen Robinson for her assistance in developing the search strategies; Tina Hai, Kayla Cunningham, Mohan Kumar, Gabriel Lai, Stephanie Chang, and Lori Bash for their assistance with article reviewing and data entry; Mark Newgent for his help formatting and editing the report; Brenda Zacharko for her assistance with final preparations of the report; and Eliseo Guallar for his help with the meta-analyses and methodology of the report. Technical Expert Panel Nathaniel Clark, M.D., M.S., R.D. American Diabetes Association Alexandria, VA Susan Norris, M.D., M.P.H., M.Sc. Oregon Health and Science University Portland, OR Sheila Roman, M.D., M.P.H. Johns Hopkins Medical Institutions Centers for Medicare & Medicaid Services Baltimore, MD AHRQ Contacts Beth A. Collins-Sharp, Ph.D., R.N. Director Evidence-based Practice Center Program Agency for Healthcare Research and Quality Rockville, MD
Leonard Pogach, M.D. Office of Patient Care Services, Veterans Health Administration Veterans Administration Health Care System East Orange, NJ Chris Saudek, M.D. Johns Hopkins School of Medicine Baltimore, MD Sherita Golden, M.D. Johns Hopkins School of Medicine Baltimore, MD Steven Fox, M.D., S.M., M.P.H. Task Order Officer Evidence-based Practice Center Program Agency for Healthcare Research and Quality Rockville, MD

v
Contents Executive Summary ....................................................................................................................1 Introduction...............................................................................................................................19 Background.....................................................................................................................19 Conceptual Model...........................................................................................................20 Scope and Key Questions ...............................................................................................21 Methods......................................................................................................................................27 Topic Development.........................................................................................................27 Search Strategy ...............................................................................................................27 Study Selection ...............................................................................................................28 Data Abstraction .............................................................................................................29 Quality Assessment.........................................................................................................29 Applicability ...................................................................................................................30 Data Analysis and Synthesis...........................................................................................30 Data Entry and Quality Control ......................................................................................32 Rating the Body of Evidence ..........................................................................................32 Peer Review and Public Commentary ............................................................................33 Results ........................................................................................................................................37
Results of Search and Quality of Systematic Reviews ...................................................37 Results of Primary Literature Review.............................................................................37 Key Question 1: Do oral diabetes medications for the treatment of adults with type 2 diabetes differ in their ability to affect the following proximal clinical outcomes: glycated hemoglobin, weight, blood pressure, serum lipid levels, and 2 hour PPG levels? .............................................................................................................................37
Study Design and Population Characteristics ...........................................................37 Hemoglobin A1c Results ..........................................................................................38 Two-Hour Postprandial Glucose...............................................................................44 Weight/BMI ..............................................................................................................46 Systolic Blood Pressure ............................................................................................53 Diastolic Blood Pressure...........................................................................................55 Low Density Lipoprotein Cholesterol ......................................................................57 High Density Lipoprotein Cholesterol......................................................................62 Triglycerides .............................................................................................................66 Study Quality ............................................................................................................71 Key Limitations ........................................................................................................71
Key Question 2: Do oral diabetes medications for the treatment of adults with type 2 diabetes differ in their ability to affect distal diabetes-related complications including mortality and the following macrovascular and microvascular complications: coronary artery disease, myocardial infarction, stroke, transient ischemic attack, arrhythmia, coronary artery stenosis and in-stent re-stenosis, retinopathy, nephropathy, neuropathy, and peripheral arterial disease?.............................................72
vi
Study Design and Population Characteristics ...........................................................72 All Cause Mortality...................................................................................................72 Cardiovascular Disease Mortality.............................................................................77 Cardiovascular Disease Morbidity............................................................................80 Peripheral Vascular Disease .....................................................................................83 Retinopathy...............................................................................................................84 Nephropathy..............................................................................................................86 Neuropathy................................................................................................................88 Study Quality ............................................................................................................89 Key Limitations ........................................................................................................89
Key Question 3: Do oral diabetes medications for the treatment of adults with type 2 diabetes differ in their ability to influence other health outcomes including quality of life and functional status?...........................................................................................90
Study Design and Population Characteristics ...........................................................90 Quality of Life...........................................................................................................90 Study Quality ............................................................................................................91 Key Limitations ........................................................................................................91
Key Question 4: Do oral diabetes medications for the treatment of adults with type 2 diabetes differ in terms of risk of the following life-threatening adverse events: life-threatening hypoglycemia leading to emergency care or death; liver failure; CHF; severe lactic acidosis; cancer; anemia, thrombocytopenia, or leucopenia requiring transfusion; and allergic reactions leading to hospitalization or death?.........................91
Key Question 5: Do oral diabetes medications for the treatment of adults with type 2 diabetes differ in their safety for the following adverse events that are not life-threatening: hypoglycemia requiring any assistance; elevated aminotransferase levels; pedal edema; hypervolemia; anemia, thrombocytopenia, and leucopenia not requiring transfusion; mild lactic acidosis; and GI problems? .......................................91
Study Design and Population Characteristics ...........................................................92 Hypoglycemia ...........................................................................................................92 Gastrointestinal Adverse Events ...............................................................................99 Elevated Serum Aminotransferase Levels ..............................................................103 Congestive Heart Failure ........................................................................................107 Edema .....................................................................................................................110 Lactic Acidosis........................................................................................................112 Anemia/Leucopenia/Thrombocytopenia.................................................................113 Cancer .....................................................................................................................115 Allergic Reactions...................................................................................................116 Withdrawals Due to Unspecified Adverse Events..................................................116
Summary of Food and Drug Administration Data, Pharmaceutical Company Information, and Ongoing Trials ............................................................................118
Study Quality ..........................................................................................................121 Key Limitations ......................................................................................................121
Key Question 6: Do safety and effectiveness of oral diabetes medications for the treatment of adults with type 2 diabetes differ across particular adult populations such as those based on demographic factors (e.g., race/ethnicity, age greater than 65
vii
years, or gender) or comorbid conditions (e.g., renal insufficiency, CHF, liver disease, obesity, depression, or schizophrenia)? ..........................................................122
Articles Reporting on More Than One Study.........................................................122 Grading of the Body of Evidence ...........................................................................123 Publication Bias Results .........................................................................................123 Summary Figures and Tables for HbA1C ....................................................................127 Summary Figures and Tables for Weight .....................................................................138 Summary Figures and Tables for SBP..........................................................................146 Summary Figures and Tables for LDL .........................................................................150 Summary Table for HDL..............................................................................................158 Summary Figures and Tables for TG............................................................................159 Summary Figures and Tables for Hypoglycemia .........................................................169 Conclusions ..............................................................................................................................185 Summary .......................................................................................................................185 Discussion.....................................................................................................................185 Future Research ............................................................................................................190 References ................................................................................................................................201 List of Acronyms .....................................................................................................................219 Tables Table 1. Characteristics of selected oral diabetes medications evaluated ..................................24 Table 2. Inclusion and exclusion criteria ...................................................................................34 Table 3. Number of studies for head-to-head comparisons .....................................................126 Table 4. Summary measures: weighted mean difference in hemoglobin A1c between groups and 95% confidence interval for randomized controlled trials comparing oral diabetes medications with placebo/diet ....................................................................................136 Table 5. Indirect comparisons of hemoglobin A1c effects between nateglinide and other oral diabetes medications..........................................................................................................136 Table 6. Indirect comparisons of hemoglobin A1c between repaglinide and other oral diabetes medications .................................................................................................................137 Table 7. Indirect comparisons of hemoglobin A1c effects between acarbose and other oral diabetes medications .................................................................................................................137 Table 8. Indirect comparisons of hemoglobin A1c between miglitol and other oral diabetes medications ...............................................................................................................................137 Table 9. Summary measures: weighted mean difference in weight effect between groups and 95% confidence interval for randomized controlled trials comparing oral diabetes medications with placebo/diet...................................................................................................145 Table 10. Indirect comparisons of weight effects between acarbose and other oral diabetes medications ...............................................................................................................................145 Table 11. Summary measures: weighted mean difference in low density lipoprotein effect between groups and 95% confidence interval for randomized controlled trials comparing oral diabetes medications with placebo/diet .............................................................................156
viii
Table 12. Indirect comparisons of low density lipoprotein effect between acarbose and other oral diabetes medications.................................................................................................157 Table 13. Indirect comparisons of low density lipoprotein effect between rosiglitazone and other oral diabetes medications.................................................................................................157 Table 14. Summary table of high density lipoprotein results – head to head comparisons with greater than three trials .....................................................................................................158 Table 15. Summary measures: weighted mean difference in triglycerides between groups and 95% confidence interval for randomized controlled trials comparing oral diabetes medications with placebo/diet...................................................................................................167 Table 16. Indirect comparisons of the triglyceride (TG) effects between rosiglitazone and other oral diabetes medications.................................................................................................168 Table 17. Indirect comparisons of the triglyceride (TG) effects between acarbose and other oral diabetes medications..........................................................................................................168 Table 18. Summary measures: pooled risk difference in hypoglycemia between groups and 95% confidence interval for randomized controlled trials comparing oral diabetes medications with placebo/diet...................................................................................................177 Table 19. Indirect comparisons of the incidence of hypoglycemia between repaglinide and other oral diabetes medications..........................................................................................178 Table 20. Indirect comparisons of incidence of hypoglycemia between metformin and thiazolidinediones .....................................................................................................................178 Table 21. Summary of edema results – head-to-head comparisons with greater than one comparison................................................................................................................................179 Table 22. Subgroup analysis ....................................................................................................180 Table 23. Summary of studies reporting on more than one study ...........................................184 Table 24. Summary of comparative effectiveness of oral diabetes medications......................194 Figures Figure 1. Conceptual framework of medication activity for adults with type 2 diabetes..........23 Figure 2. Summary of literature search for systematic reviews (number of articles)..............124 Figure 3. Summary of literature search for primary literature (number of articles) ................125 Figure 4. Meta-analysis of post-treatment difference in hemoglobin A1c between thiazolidinediones and metformin in patients with type 2 diabetes..........................................127 Figure 5. Meta-analysis of post-treatment difference in hemoglobin A1c between thiazolidinediones and second generation sulfonylureas in patients with type 2 diabetes .......128 Figure 6. Meta-analysis of post-treatment difference in hemoglobin A1c between metformin and second generation sulfonylureas in patients with type 2 diabetes....................129 Figure 7. Meta-analysis of post-treatment difference in hemoglobin A1c between metformin and metformin plus a thiazolidinedione in patients with type 2 diabetes ...............130 Figure 8. Meta-analysis of post-treatment difference in hemoglobin A1c between metformin and metformin plus a second generation sulfonylurea in patients with type 2 diabetes .....................................................................................................................................131 Figure 9. Meta-analysis of post-treatment difference in hemoglobin A1c between glyburide/glibenclamide and other second generation sulfonylureas in patients with type 2 diabetes .....................................................................................................................................132
ix
Figure 10. Meta-analysis of post-treatment difference in hemoglobin A1c between second generation sulfonylureas and repaglinide in patients with type 2 diabetes...............................133 Figure 11. Meta-analysis of post-treatment difference in hemoglobin A1c between second generation sulfonylureas and thiazolidinediones plus a second generation sulfonylurea in patients with type 2 diabetes .....................................................................................................134 Figure 12. Meta-analysis of post-treatment difference in hemoglobin A1c between second generation sulfonylureas and metformin plus a second generation sulfonylurea in patients with type 2 diabetes ..................................................................................................................135 Figure 13. Meta-analysis of post-treatment difference in weight between thiazolidinediones and metformin in patients with type 2 diabetes..........................................138 Figure 14. Meta-analysis of post-treatment difference in weight between thiazolidinediones and second generation sulfonylureas in patients with type 2 diabetes .......139 Figure 15. Meta-analysis of post-treatment difference in weight between metformin and second generation sulfonylureas for randomized controlled trials greater than or equal to 24 weeks in duration in patients with type 2 diabetes ..............................................................140 Figure 16. Meta-analysis of post-treatment difference in weight between metformin and second generation sulfonylureas for randomized controlled trials less than 24 weeks in duration in patients with type 2 diabetes...................................................................................141 Figure 17. Meta-analysis of post-treatment difference in weight between metformin and metformin plus a second generation sulfonylurea in patients with type 2 diabetes..................142 Figure 18. Meta-analysis of post-treatment difference in weight between second generation sulfonylureas and meglitinides in patients with type 2 diabetes.............................143 Figure 19. Meta-analysis of post-treatment difference in weight between second generation sulfonylureas and metformin plus a second generation sulfonylurea in patients with type 2 diabetes .....................................................................................................144 Figure 20. Meta-analysis of post-treatment difference in systolic blood pressure effect between thiazolidinediones and metformin in patients with type 2 diabetes............................146 Figure 21. Meta-analysis of post-treatment difference in systolic blood pressure effect between thiazolidinediones and second generation sulfonylureas in patients with type 2 diabetes .....................................................................................................................................147 Figure 22. Meta-analysis of post-treatment difference in systolic blood pressure effect between metformin and second generation sulfonylureas in patients with type 2 diabetes .....148 Figure 23. Meta-analysis of post-treatment difference in systolic blood pressure effect between second generation sulfonylureas and metformin plus a second generation sulfonylurea in patients with type 2 diabetes............................................................................149 Figure 24. Meta-analysis of post-treatment difference in low density lipoprotein effect between pioglitazone and metformin in patients with type 2 diabetes .....................................150 Figure 25. Meta-analysis of post-treatment difference in low density lipoprotein effect between pioglitazone and second generation sulfonylureas in patients with type 2 diabetes ..151 Figure 26. Meta-analysis of post-treatment difference in low density lipoprotein effect between metformin and second generation sulfonylureas in patients with type 2 diabetes .....152 Figure 27. Meta-analysis of post-treatment difference in low density lipoprotein effect between metformin and metformin plus rosglitazone in patients with type 2 diabetes............153 Figure 28. Meta-analysis of post-treatment difference in low density lipoprotein effect between metformin and metformin plus a second generation sulfonylurea in patients with type 2 diabetes...........................................................................................................................154
x
Figure 29. Meta-analysis of post-treatment difference in low density lipoprotein effect between second generation sulfonylureas and metformin plus a second generation sulfonylurea in patients with type 2 diabetes............................................................................155 Figure 30. Meta-analysis of post-treatment difference in triglycerides between pioglitazone and metformin in patients with type 2 diabetes ........................................................................159 Figure 31. Meta-analysis of post-treatment difference in triglycerides between pioglitazone and second generation sulfonylureas in patients with type 2 diabetes......................................160 Figure 32. Meta-analysis of post-treatment difference in triglycerides between pioglitazone and second generation sulfonylureas in patients with type 2 diabetes in the three comparably-dosed studies.........................................................................................................161 Figure 33. Meta-analysis of post-treatment difference in triglycerides between metformin and second generation sulfonylureas in patients with type 2 diabetes......................................162 Figure 34. Meta-analysis of post-treatment difference in triglycerides between metformin and metformin plus rosiglitazone in patients with type 2 diabetes...........................................163 Figure 35. Meta-analysis of post-treatment difference in triglycerides between metformin and metformin plus a second generation sulfonylurea in patients with type 2 diabetes...........164 Figure 36. Meta-analysis of post-treatment difference in triglycerides between second generation sulfonylureas and repaglinide in patients with type 2 diabetes...............................165 Figure 37. Meta-analysis of post-treatment difference in triglycerides between second generation sulfonylureas and metformin plus a second generation sulfonylurea in patients with type 2 diabetes ..................................................................................................................166 Figure 38. Incidence of subjects with hypoglycemia in randomized controlled trials comparing thiazolidinediones with second generation sulfonylureas ......................................169 Figure 39. Incidence of subjects with hypoglycemia in randomized controlled trials less than or equal to one year in duration comparing metformin with second generation sulfonylureas .............................................................................................................................170 Figure 40. Incidence of subjects with hypoglycemia in randomized controlled trials less than or equal to one year in duration comparing metformin with the combination of metformin plus a second generation sulfonylurea ....................................................................171 Figure 41. Incidence of subjects with hypoglycemia in randomized controlled trials comparing metformin with the combination of metformin plus a thiazolidinedione ...............172 Figure 42. Incidence of subjects with hypoglycemia in randomized controlled trials less than or equal to one year in duration comparing glyburide/glibenclamide with other second generation sulfonylureas ...........................................................................................................173 Figure 43. Incidence of subjects with hypoglycemia in randomized controlled trials less than or equal to one year in duration comparing second generation sulfonylureas with meglitinides...............................................................................................................................174 Figure 44. Incidence of subjects with hypoglycemia in randomized controlled trials less than or equal to one year in duration comparing a second generation sulfonylurea with the combination of metformin plus a second generation sulfonylurea...........................................175 Figure 45. Incidence of subjects with hypoglycemia in randomized controlled trials comparing a second generation sulfonylurea with the combination of a second generation sulfonylurea plus a thiazolidinedione .......................................................................................176
xi
Appendixes Appendix A. Technical Experts and Peer Reviewers Appendix B. Hand Searched Journals Appendix C. Detailed Electronic Database Search Strategies for Systematic Reviews Appendix D. Excluded Articles Appendix E. Sample Forms Appendix F. Evidence Tables Appendix G. Placebo-Controlled Meta-Analyses Appendix H. List of Studies Included in Meta-Analyses

1
Executive Summary Background Type 2 diabetes is characterized by insulin resistance accompanied by progressive deficiency in insulin secretion. Type 2 diabetes is an increasingly common disease that is closely associated with obesity. In 2005, the prevalence of Americans with diagnosed type 2 diabetes was 2.4 percent for adults aged 20-39 years, 10 percent for adults aged 40-59 years, and 21 percent for adults aged 60 years or over. From 1980 through 2004, the number of Americans diagnosed with diabetes more than doubled, from 5.8 million to 14.7 million. Observational studies and clinical trials show that improved glycemic control reduces microvascular complications (e.g., complications involving the eyes, kidneys, or nerves) and may reduce macrovascular complications (e.g., heart attack); however, the effects of specific oral diabetes medications on these outcomes are less certain. As new classes of medications have become available for the treatment of diabetes, clinicians and patients have faced a bewildering array of oral medications with different mechanisms of action. The first oral diabetes medications were sulfonylureas, which were introduced into the market in 1955. The second-generation sulfonylureas, which are used today, were introduced in 1984. Metformin (a biguanide) was introduced in 1995, meglitinides in 1997, alpha-glucosidase inhibitors in 1998, and thiazolidinediones in 1999. Although most experts consider the alpha-glucosidase inhibitors to be inferior to the other drug classes in terms of efficacy, clinicians may find it difficult to choose between the other four drug classes that are now in common use. Generally, clinicians must choose between older, less expensive medications such as a second-generation sulfonylurea or metformin and the newer, more expensive medications such as a thiazolidinedione or meglitinide. In addition, clinicians must consider concerns about specific medications conferring excess cardiovascular risks when compared with other oral diabetes medications or placebo. The well-known United Kingdom Prospective Diabetes Study (UKPDS) demonstrated that oral diabetes medications may have similar effects on cardiovascular morbidity and mortality when they have similar effects on glycemic control. However, the UKPDS was conducted prior to the emergence of thiazolidinediones and statins. Several systematic reviews of oral diabetes medications shed light on differences in short-term and long-term outcomes. However, only two reviews have compared all of the oral diabetes medications used commonly in the United States. In 2002, Inzucchi and colleagues from Yale University found that: (1) most diabetes medications lower hemoglobin A1c (HbA1c) by an absolute reduction of 1-2 percent,a with equivalent efficacy across medications, except for alpha-glucosidase inhibitors, which decrease HbA1c by 0.5-1 percent; (2) medications in combination confer additional glycemic benefits; (3)
a One characteristic of type 2 diabetes is an elevation of the proportion of HbA1c in the blood from a normal level of 6.5-7 percent to an elevated level of >6.5 to 7 percent (e.g. 10 percent). In this report, an "absolute" reduction of 1 percent means a reduction of one percentage point in that proportion (e.g. from 10 percent to 9 percent).
2
long-term micro- or macrovascular risk reduction was demonstrated only with sulfonylureas and metformin. In 2004, Buse and colleagues from the University of North Carolina compared effects on serum lipid levels among all the oral diabetes medications. They found that only metformin, acarbose, voglibose, rosiglitazone, and pioglitazone had significant effects on the lipid profile. Metformin at high doses and pioglitazone both reduced triglycerides, while acarbose, rosiglitazone, and pioglitazone increased high-density lipoproteins. Lastly, acarbose decreased low-density lipoproteins, while rosiglitazone increased low-density lipoproteins. Many outcomes besides HbA1c and lipid levels are important when evaluating and comparing oral diabetes medications, such as blood pressure control, weight changes, microvascular and macrovascular disease, adverse events, and mortality. It is critical to evaluate adverse events, since these affect adherence as well as morbidity and mortality. Additionally, certain diabetes medications may be less safe for patients with comorbid conditions. For instance, biguanides such as metformin are contraindicated in patients with renal or liver failure because of a potentially higher risk of lactic acidosis. To date, no study has evaluated proximal clinical measures, long-term effects, and adverse events among oral diabetes medications used in the United States. If they could compare the short- and long-term effects as well as the adverse effects of these medications, clinicians might have a better sense of when to use which oral diabetes medication. This review will be helpful as new classes of oral diabetes medications, such as the dipeptidyl peptidase IV (DPP-IV) inhibitors, emerge on the market. Furthermore, it may help policymakers and insurers to have better insight when deciding on policies relating to medication coverage. This report summarizes the available evidence comparing the efficacy and safety of oral diabetes medications in the treatment of type 2 diabetes. The report addresses the following key questions:
1. Do oral diabetes medications for the treatment of adults with type 2 diabetes differ in their ability to affect the following proximal clinical outcomes: glycated hemoglobin, weight, blood pressure, serum lipid levels, and 2-hour postprandial glucose (PPG) levels?
2. Do oral diabetes medications for the treatment of adults with type 2 diabetes differ in
their ability to affect distal diabetes-related complications including mortality and the following macrovascular and microvascular complications: coronary artery disease, myocardial infarction, stroke, transient ischemic attack, arrhythmia, coronary artery stenosis and in-stent restenosis, retinopathy, nephropathy, neuropathy, and peripheral arterial disease?
3. Do oral diabetes medications for the treatment of adults with type 2 diabetes differ in
their ability to influence other health outcomes, including quality of life and functional status?
4. Do oral diabetes medications for the treatment of adults with type 2 diabetes differ in
terms of risk of the following life-threatening adverse events: life-threatening hypoglycemia leading to emergency care or death; liver failure; congestive heart failure (CHF); severe lactic acidosis; cancer; anemia, thrombocytopenia, or leucopenia requiring transfusion; and allergic reactions leading to hospitalization or death?
3
5. Do oral diabetes medications for the treatment of adults with type 2 diabetes differ in their safety for the following adverse events that are not life threatening: hypoglycemia requiring any assistance; elevated aminotransferase levels; pedal edema; hypervolemia; anemia, thrombocytopenia, and leucopenia not requiring transfusion; mild lactic acidosis; and gastrointestinal (GI) problems?
6. Do safety and effectiveness of oral diabetes medications for the treatment of adults with
type 2 diabetes differ across particular adult populations, such as those based on demographic factors (e.g., race/ethnicity, age greater than 65 years, or gender) or comorbid conditions (e.g., renal insufficiency, CHF, liver disease, obesity, depression, or schizophrenia)?
Conclusions
Summary Table A presents the main conclusions from published evidence regarding the comparative effectiveness of oral diabetes medications, organized by key question and type of outcome. The summary table also includes our rating of the level of evidence that supports each conclusion. Meta-regression was conducted using study-level characteristics such as dose of medication, study duration, and study quality. When important differences arose based on these characteristics, we reported them in the table. In Summary Table B we present a short synopsis of the comparative effectiveness of the oral diabetes medications used most often and for which there were sufficient data to make comparisons. In each column of the summary table, we indicate the medication that had a better effect on the listed outcome or note when there were at least a moderate number of studies in which no apparent difference was detected. The text below summarizes the conclusions regarding the main comparisons of interest by outcome, and qualifies points noted in the summary tables. Comparisons of effects of oral diabetes medications Glycemic control (hemoglobin A1c). Based on direct data from randomized controlled trials, most oral diabetes medications (thiazolidinediones, second-generation sulfonylureas, metformin, and repaglinide) had similar reductions in hemoglobin A1c (~1-percent absolute reduction) compared with one another as monotherapy. Indirect data, in addition to a few head-to-head trials, showed that nateglinide and alpha-glucosidase inhibitors were less efficacious in reducing hemoglobin A1c as monotherapy (~0.5-percent absolute reduction). Combination therapies had an additive effect and were better at reducing HbA1c compared with monotherapy regimens (~1-percent absolute reduction). Weight. Weight increased by 1-5 kg with most of the oral diabetes medications (thiazolidinediones, second-generation sulfonylureas, and repaglinide), but not for metformin and acarbose, which had no effect on weight in placebo-controlled trials. In direct comparisons with thiazolidinediones and second-generation sulfonylureas, metformin caused relative weight loss. However, this might be an artifact reflecting the withdrawal from a prior sulfonylurea (and
4
withdrawal of its weight-increasing effect) that often occurred in head-to-head trials. There were too few comparative studies of nateglinide to draw conclusions. Different types of weight gain (central vs. peripheral) may have different effects on morbidity, with central adiposity considered to have greater prediction of cardiovascular outcomes. Only a few studies evaluated whether weight gain was related to increases in visceral adipose tissue, subcutaneous fat, or plasma volume. Therefore, it is unclear whether the weight gains caused by the different medications are physiologically equivalent. Systolic and diastolic blood pressure. Most oral diabetes medications (thiazolidinediones, second-generation sulfonylureas, and metformin) had similarly minimal effects on systolic and diastolic blood pressure (<5 mm Hg). Too few studies compared meglitinides and acarbose with other oral diabetes medications to draw firm conclusions. There was a suggestion of decreased blood pressure in the thiazolidinedione group when compared with second-generation sulfonylureas and acarbose. However, the clinical relevance of these small nonsignificant between-group differences of 3-5 mmHg is questionable. Low-density lipoprotein. Only thiazolidinediones consistently increased low-density lipoprotein (by about 10 mg/dL), while only metformin consistently decreased low-density lipoprotein (by about 10 mg/dL). Of the two thiazolidinediones, rosiglitazone increased low-density lipoprotein cholesterol more than pioglitazone (difference of about 10-15 mg/dL). In addition, second-generation sulfonylureas showed similar minimal effects on low-density lipoprotein cholesterol when compared with repaglinide and alpha-glucosidase inhibitors. Too few studies on nateglinide were available to draw conclusions. High-density lipoprotein. Only thiazolidinediones increased high-density lipoprotein. Thiazolidinediones increased high-density lipoprotein by about 3-5 mg/dL, compared with metformin or second-generation sulfonylureas, which had little effect on high-density lipoprotein. Meglitinides had little effect on high-density lipoprotein, but there were too few trials to draw comparative conclusions. Combination therapy with thiazolidinediones increased high-density lipoprotein similarly to monotherapy with thiazolidinediones, while combination therapies without thiazolidinediones had little effect on high-density lipoprotein levels. Triglyceride levels. Most oral diabetes medications (pioglitazone, metformin, second-generation sulfonylureas, acarbose, and repaglinide) decreased triglycerides, except for rosiglitazone, which generally increased triglycerides. Pioglitazone decreased triglycerides more than metformin (difference of about 26 mg/dL), and metformin decreased triglycerides to a greater degree than second-generation sulfonylureas (difference of about 10 mg/dL). These small differences in triglyceride reduction may reflect differences between groups in initial triglyceride levels that were present despite randomization. Repaglinide and acarbose had similar reductions in triglycerides when compared with second-generation sulfonylureas. There were too few comparisons for nateglinide to draw conclusions. All-cause mortality. There were too few studies to support any conclusions about how mortality differed between the medications. It was unclear whether effects on mortality differed between the combination of metformin with a sulfonylurea and monotherapy with a sulfonylurea or metformin, due to lack of adjustment for key confounders in cohort studies and lack of studies
5
evaluating this combination. Other comparisons between drugs had too few studies to draw conclusions. Cardiovascular mortality and morbidity. There were too few studies to support any conclusions about how cardiovascular morbidity or mortality differed between the medications. It was unclear whether cardiovascular mortality differed between the combination of metformin with a sulfonylurea and monotherapy with a sulfonylurea or metformin, due to lack of adjustment for key confounders in cohort studies and lack of studies evaluating this combination. Only pioglitazone and metformin improved cardiovascular morbidity when compared with placebo or diet (one study each, PROactive and UKPDS). Peripheral vascular disease. Only two randomized controlled trials reported information on peripheral vascular disease making it difficult to draw conclusions. In the largest of the two trials (PROactive), pioglitazone had no effect on peripheral vascular disease when compared with placebo in subjects with a history of cardiovascular disease. Microvascular outcomes. Few studies examined how microvascular outcomes differed between the medications, but some differences were reported. In the UKPDS, glibenclamide decreased the need for photocoagulation and had a protective effect on combined microvascular outcomes (retinopathy plus nephropathy) compared with the conventional arm (diet), while metformin showed no effect on retinopathy compared with the conventional arm. Pioglitazone may be better at reducing short-term nephropathy compared with metformin, based on two short-duration randomized controlled trials. Quality of life and functional status. No conclusions could be drawn regarding the comparative effects of the medications on quality of life and functional status because of a limited number of studies and differences in the questionnaires used to assess quality of life. Hypoglycemia. Minor and major hypoglycemic episodes were more frequent in subjects taking second-generation sulfonylureas (especially glyburide) than in subjects taking other oral diabetes medications except repaglinide. Reported percentages of subjects experiencing minor or major hypoglycemic episodes ranged from 0 to 58 percent for second-generation sulfonylureas, vs. 0 to 21 percent for metformin and 0 to 24 percent for thiazolidinediones. The absolute risk difference was 5-10 percent when comparing second-generation sulfonylureas with metformin or thiazolidinediones. Glyburide/glibenclamide had a higher risk of hypoglycemia compared with other second-generation sulfonylureas (absolute risk difference of ~2 percent). Repaglinide and second-generation sulfonylureas had a similar incidence of subjects with hypoglycemia. However, repaglinide may be associated with less serious hypoglycemia in the elderly and in people who skip meals. Data were sparse on the comparisons between acarbose or nateglinide with other oral diabetes medications. The incidence of minor and major hypoglycemia was higher with combinations that included sulfonylureas, compared with metformin or sulfonylurea monotherapy (absolute risk differences of 8-14 percent). The combination of metformin plus rosiglitazone had a similar risk of minor hypoglycemia compared with metformin monotherapy, and no serious events occurred in either of these treatment groups.
6
Gastrointestinal adverse events/problems. Metformin and acarbose were generally associated with a higher percent of subjects with GI adverse events (range 2-63 percent and 15-30 percent, respectively) compared with other oral diabetes medications (thiazolidinediones: range 0-36 percent, second-generation sulfonylureas: range 0-32 percent, and meglitinides: range 8-11 percent). The absolute risk differences ranged from 5 to 15 percent when comparing metformin or acarbose with these other oral diabetes medications (thiazolidinediones, second-generation sulfonylureas, or meglitinides). Metformin monotherapy was associated with more frequent adverse events compared with the combination of metformin plus a second-generation sulfonylurea or metformin plus a thiazolidinedione if the metformin component was at a lower dose than the metformin monotherapy arm. Elevated aminotransferase levels/liver failure. Several oral diabetes medications (thiazolidinediones, second-generation sulfonylureas, and metformin) had similarly low rates (less than 1 percent) of clinically relevant elevated aminotransferase levels (greater than 1.5 to 2 times the upper limit of normal). Insufficient studies evaluated or reported on the effects of meglitinides on serum aminotransferase levels, but their effects appeared to be similar to the effects of other oral diabetes medications. The evidence was insufficient to compare oral diabetes medications on the outcome of liver failure since there were too few events. Congestive heart failure. Thiazolidinediones were associated with greater risk of CHF compared with metformin or sulfonylureas (two head-to-head randomized controlled trials with absolute risk differences of 1-2 percent; cohort studies had a range in odds ratios of 1.06-2.27, which was significant in four of five head-to-head studies). Metformin and second-generation sulfonylureas had similarly little impact on the incidence of CHF. CHF was reported mostly in cohort studies that did not adjust for key confounders, such as duration of diabetes, HbA1c level, blood pressure level, and medication adherence. However, the cohort studies were consistent with one another and were consistent with the data found in the randomized controlled trials, making these conclusions likely to be accurate. Edema. Edema was more frequent in subjects taking thiazolidinediones (range 0-26 percent) than in subjects taking second-generation sulfonylureas (range 0-8 percent) or metformin (range 0-4 percent). The absolute risk differences ranged from 2 to 21 percent when comparing thiazolidinediones with second-generation sulfonylureas or metformin. No cases of macular edema were identified in the studies reviewed; however, case reports were excluded from the review, and this is where most macular edema cases have been identified. Cohort studies are needed to explore the issue of macular edema further. Data were too sparse to draw conclusions about how the incidence of edema may differ between other oral diabetes medications. Lactic acidosis. Despite traditional concerns, the rate of lactic acidosis was similar between metformin and other oral diabetes medications or placebo (8.4 vs. 9 cases per 100,000 patient-years). We did not have enough information on subjects taking metformin with chronic conditions such as chronic renal insufficiency, chronic liver disease, congestive heart failure, or severe pulmonary disease; therefore, we were unable to determine the safety of taking metformin in the presence of comorbid conditions that predispose subjects to lactic acidosis.

7
Anemia, thrombocytopenia, and leucopenia. Thiazolidinediones may be associated with an increased risk of anemia (range 0-7 percent) compared with other oral diabetes medications (range 0-3 percent). The absolute risk differences ranged from ~1-5 percent when comparing thiazolidinediones with other oral diabetes medications. The decrease in hematocrit was small (1 g/dL) and would not be clinically relevant except for subjects with severe or borderline severe anemia. Only one study reported an adverse event of thrombocytopenia and leucopenia, making comparisons between medications impossible. Differences in effectiveness between subgroups of patients with type 2 diabetes Data were insufficient to support any conclusions regarding differences in effectiveness of the medications between subgroups of patients with type 2 diabetes. Remaining Issues
The review of existing evidence identified a number of issues requiring further research. These specific research issues are grouped by key question below. For Key Question 1 (proximal clinical outcomes)
● Future studies should examine effects of medications on glycemic variability using standardized methods to better compare effects across medications. Studies should consistently report 2-hour postprandial glucose as well as measure effects over time pre- and post-treatment.
● There were few extended studies to characterize the persistence of effects on glycemic
control, weight, and lipids over time. Evaluating the durability of effects on proximal outcomes will be helpful in determining the clinical relevance of different effects on lipids, weight, and glycemic control. Linking these effects to cardiovascular outcomes will also help clarify the clinical relevance.
● More head-to-head monotherapy trials of rosiglitazone with metformin and sulfonylurea
monotherapy are needed to better assess potential differences in lipid effects. ● Future studies on weight should attend to effects on body composition and partition
effects on weight or body mass index as an increase in fluid, subcutaneous tissue, or visceral adipose tissue, as these may have different effects on health. If possible, investigators should then link these with hard outcomes, such as morbidity and mortality. Furthermore, since sulfonylureas and thiazolidinediones increase weight as monotherapy, future studies need to identify whether there would be an additive or synergistic effect on weight for combinations of sulfonylureas with thiazolidinediones.
8
For Key Question 2 (distal diabetes-related complications)
● More randomized controlled trials and prospective cohort studies should compare the effects of oral diabetes medications on the long-term outcomes of all cause and cardiovascular mortality, cardiovascular disease morbidity, microvascular disease, and peripheral vascular disease.
● Such studies should examine surrogate markers of cardiovascular disease such as carotid
intimal media thickness using ultrasound imaging, as well as restenosis rates and arrhythmias.
● To determine whether oral diabetes medications differ in their effects on mortality and
cardiovascular morbidity, a long-term head-to-head randomized controlled trial should compare thiazolidinediones, metformin, sulfonylurea, and metformin plus a sulfonylurea in subjects with a history of mild macrovascular disease.
● To improve understanding of the effects of oral diabetes medications on peripheral
vascular disease, studies should use earlier clinically relevant outcomes for peripheral vascular disease, such as ankle brachial index, distance to onset of pain, stopping time during standardized walking, and symptoms, as well as distal outcomes of amputation and death from peripheral vascular disease.
● To improve understanding of the effects of oral diabetes medications on nephropathy,
studies should evaluate long-term clinically relevant nephropathy outcomes (such as time to dialysis) as well as short-term proteinuria outcomes.
For Key Question 3 (quality of life)
● More studies should examine the effects of oral diabetes medications on health-related quality of life using standardized, validated questionnaires, especially since quality of life may affect whether patients adhere to medications.
For Key Questions 4 and 5 (adverse effects)
● Studies on oral diabetes medications need to report consistently withdrawals and reasons for withdrawals to improve understanding of potential differences in adverse effects.
● Studies on oral diabetes medications need to report their definitions of adverse events
more thoroughly, and consistently report all adverse events (not using aggregated events). ● Additional observational studies of metformin compared with other oral diabetes
medications in subjects prone to lactic acidosis would help determine the safety of using this medication in populations with co-morbid diseases.
9
● Further observational studies should evaluate the incidence of (1) macular edema with thiazolidinediones, (2) anemia requiring transfusion or hospital admission for thiazolidinediones compared with other oral agents, and (3) allergic reactions in all oral diabetes medications.
● Further observational studies should evaluate cancer and allergic reactions for all oral
diabetes medications. For Key Question 6 (differences across specific populations)
● To determine differences in medication effectiveness based on comorbidity or demographics, analyses should be stratified or adjusted based on comorbidity or demographics. Specific areas to focus on would be effects of medications in the elderly and in subjects with and without renal disease, congestive heart failure, liver disease, or psychiatric disease.
Other general issues
● Future observational studies could improve understanding of the effects of oral diabetes medications on adverse events and distal outcomes if they carefully assess key confounders, such as duration of diabetes, adherence to medications, dosing of medications, hemoglobin A1c levels, and blood pressure levels.
● Studies need to report consistently between-group changes from baseline, as well as
measures of dispersion such as standard errors. ● Further head-to-head trials are needed to compare (1) nateglinide with all other oral
diabetes medications and (2) repaglinide with other oral diabetes medications besides second-generation sulfonylureas.
● More studies should compare one combination of oral diabetes medications directly with
another combination (specifically metformin, sulfonylureas, and thiazolidinediones in dual combinations as starting therapy) for all outcomes, as many clinicians have started using combinations as initial treatment in persons with diabetes.
● Further research is needed on the effects of oral diabetes medications on beta cell
function over a 3-5 year period or longer, using standardized outcomes, such as c-peptide and insulin levels, and time to requiring insulin.
● A systematic review of drug-drug interactions in subjects with diabetes would help
clinicians with treatment decisions. ● Future studies comparing oral diabetes medications must consider any new oral diabetes
medications that may be placed on the market, such as the dipeptidyl peptidase IV (DPP-IV) inhibitor sitagliptin, which has just been approved by the Food and Drug Administration.
10
● Lastly, studies comparing combinations of older diabetes medications, such as sulfonylureas and metformin, with combinations of newer oral diabetes medications such as thiazolidinediones in combination with DPP-IV inhibitors or meglitinides would be interesting, especially given the cost associated with newer oral diabetes medications.
Synopsis
Several clinical trials have investigated short-term outcomes of various preparations of oral medications for type 2 diabetes. Compared to newer medications, such as thiazolidinediones and meglitinides, metformin had similar or superior effects on a range of clinically relevant short-term outcomes. For these same outcomes, second-generation sulfonylureas generally were comparable to thiazolidinediones and meglitinides. In terms of safety, each medication was associated with specific adverse events, although thiazolidinediones and second-generation sulfonylureas were associated with more serious adverse events, such as congestive heart failure and serious hypoglycemia, respectively. Repaglinide may be associated with less serious hypoglycemia in the elderly and in people who skip meals. Lactic acidosis rates were similar for metformin in comparison with other oral diabetes medications. Thus, metformin may be associated with less risk of serious adverse events than second-generation sulfonylureas or thiazolidinediones. When oral diabetes medications were combined, the effects with respect to HbA1c levels and adverse events were generally additive. If each individual drug was used at a lower dose in the combination, fewer adverse events were seen. Not much evidence exists that might enable one to know a priori which medications are most likely to be effective in identifiable subgroups of patients with diabetes, nor does much evidence exist to predict which particular patients may be most susceptible to the adverse events associated with particular drugs. Additional information on serious but infrequent adverse treatment effects will have to come from observational studies, particularly case-control studies. Remarkably, we found only one case-control study that qualified for inclusion in this review. Well-done observational studies may also be helpful in elucidating long-term outcomes, although confounding by indication may be difficult to adjust for in such studies. In the absence of compelling evidence from long-term trials that include assessment of cardiovascular disease outcomes, clinicians should use data on short-term outcomes and safety to guide treatment decisions for oral diabetes medications. Physicians and patients can feel comfortable using older medications such as metformin and second-generation sulfonylureas, as monotherapy or in combination, before newer diabetes medications such as thiazolidinediones or meglitinides, especially when cost is a factor. Future research should focus on comparing combinations of newer medications (DPP-IV inhibitors, meglitinides, and thiazolidinediones) with combinations of older medications (metformin and second-generation sulfonylureas) with respect to long-term effectiveness and safety.
11
Addendum
Two high-profile original studies and one meta-analysis on this topic have been published since this review was completed.b,c,d One 4-year double-blind randomized trialb compared rosiglitazone monotherapy with metformin or glyburide monotherapy and showed a significant difference in HbA1c favoring rosiglitazone (between-group absolute difference of -0.42 percent for rosiglitazone vs. glyburide and -0.13 percent for rosiglitazone vs. metformin). However, the incidence of cardiovascular events was lower with glyburide than with rosiglitazone or metformin (1.8 percent, 3.4 percent, and 3.2 percent, respectively; p < 0.05). This effect was mainly driven by significantly fewer congestive heart failure events and a nonsignificantly lower rate of nonfatal myocardial infarction events in the glyburide group. The high loss to followup (40 percent) may account for some differences between groups, since the loss to followup was disproportionate between the groups. This study illustrates the importance of having more long-term followup data on cardiovascular outcomes. At a minimum, clinicians should not assume that a small benefit measured in terms of HbA1c reduction will be associated with an improvement in cardiovascular outcomes. Indeed, this study suggests that cardiovascular outcomes could be worse with rosiglitazone despite its having a more beneficial effect on HbA1c. Of note, the fracture rate among women was higher in the rosiglitazone group than in the metformin and sulfonylurea groups (9.3 percent, 5.1 percent, and 3.5 percent, respectively; p < 0.01).b We did not find any reported fractures in shorter duration trials, and this will be an important area for future research. For other outcomes reported in this article, the results were similar to those included in our report. In the meta-analysis,c the authors reported that, in comparison with other oral diabetes medications or placebo, rosiglitazone was associated with a borderline-significant increased risk of myocardial infarction (odds ratio, 1.43; 95-percent confidence interval (CI), 1.03 to 1.98) and a nonsignificant association with cardiovascular death (odds ratio, 1.64; 95-percent CI, 0.98 to 2.74). When they analyzed specific drug-drug or drug-placebo comparisons, their results were not statistically significant. Similarly, our report did not find any statistically significant differences between specific oral diabetes medications in cardiovascular outcomes other than congestive heart failure. The authors acknowledged several limitations of their study: (1) there were small numbers of absolute events; (2) the primary outcomes of the short-term trials were not cardiovascular events; and (3) the authors had no access to original source data. Among additional limitations that influenced their conclusions was their decision to include studies with diverse patient populations. They pooled studies that examined use of rosiglitazone for conditions other than type 2 diabetes, including studies of patients with chronic psoriasis, Alzheimer’s disease, type 2
b Kahn SE, Haffner SM, Heise MA, et al., ADOPT Study Group. Glycemic durability of rosiglitazone, metformin, or glyburide monotherapy. N Engl J Med 2006 Dec 7;355(23):2427-43. c Nissen SE, Wolski K. Effect of rosiglitazone on the risk of myocardial infarction and death from cardiovascular causes. N Engl J Med 2007;356. Accessed on May 21, 2007, at www.nejm.org. d Home PD, Pocock SJ, Beck-Nielsen H, et al., RECORD Study Group. Rosiglitazone evaluated for cardiovascular outcomes–an interim analysis. N Engl J Med 2007. Accessed on June 5, 2007, at www.nejm.org.
12
diabetes, and impaired glucose tolerance. Had the authors excluded data from the DREAM trial,e which was conducted in adults with prediabetes, the pooled estimate of risk associated with rosiglitazone would have fallen short of statistical significance. They also included a study in which the patients had a history of congestive heart failure, even though rosiglitazone is currently contraindicated in these subjects. Inclusion of these data may have produced a higher apparent risk than would be expected in practice today. They also excluded six studies that reported no cardiovascular events in either group, thereby biasing their results against finding no difference. Given the limitations of the analysis, the effects of rosiglitazone on cardiovascular mortality and myocardial infarction are still uncertain. After the release of the meta-analysis on rosiglitazone and cardiovascular risk,c an interim analysis of the RECORD studyd was published. This randomized trial of subjects with uncontrolled type 2 diabetes compared addition of rosiglitazone to existing metformin or sulfonylurea monotherapy vs. the combination of metformin plus sulfonylurea (control group). This analysis yielded a hazard ratio of 1.08 (95-percent CI, 0.89 to 1.31) for the primary end point of hospitalization or death from cardiovascular disease after a mean followup of 3.7 years. The hazard ratio was driven by more congestive heart failure in the rosiglitazone group than in the control group (absolute risk, 1.7 percent vs. 0.8 percent). In Kaplan-Meier curves, the risk of hospitalization or death from myocardial infarction was slightly lower in the control group than in the rosiglitazone group, but the difference was not statistically significant. One limitation of this interim analysis was the lack of power to detect differences because of lower numbers of cardiovascular events than initially predicted. The RECORD study may now have trouble reaching the desired power for detecting a difference in cardiovascular risk if patients withdraw from the rosiglitazone arm of the study. Overall, these recent reports are consistent with our review, which found no conclusive evidence of worse cardiovascular morbidity or mortality, outside of the higher risk of congestive heart failure with thiazolidinediones than with other oral medications. These new studies substantiate our call for more vigorous post-marketing surveillance and long-term comparative assessments of major clinical outcomes. For example, such studies should pay attention to the risk of myocardial infarction with rosiglitazone compared with other oral diabetes medications.
e DREAM (Diabetes REduction Assessment with ramipril and rosiglitazone Medication) Trial Investigators. Effect of rosiglitazone on the frequency of diabetes in patients with impaired glucose tolerance or impaired fasting glucose: a randomised controlled trial. Lancet 2006 Sep 23;368(9541):1096-105.
13
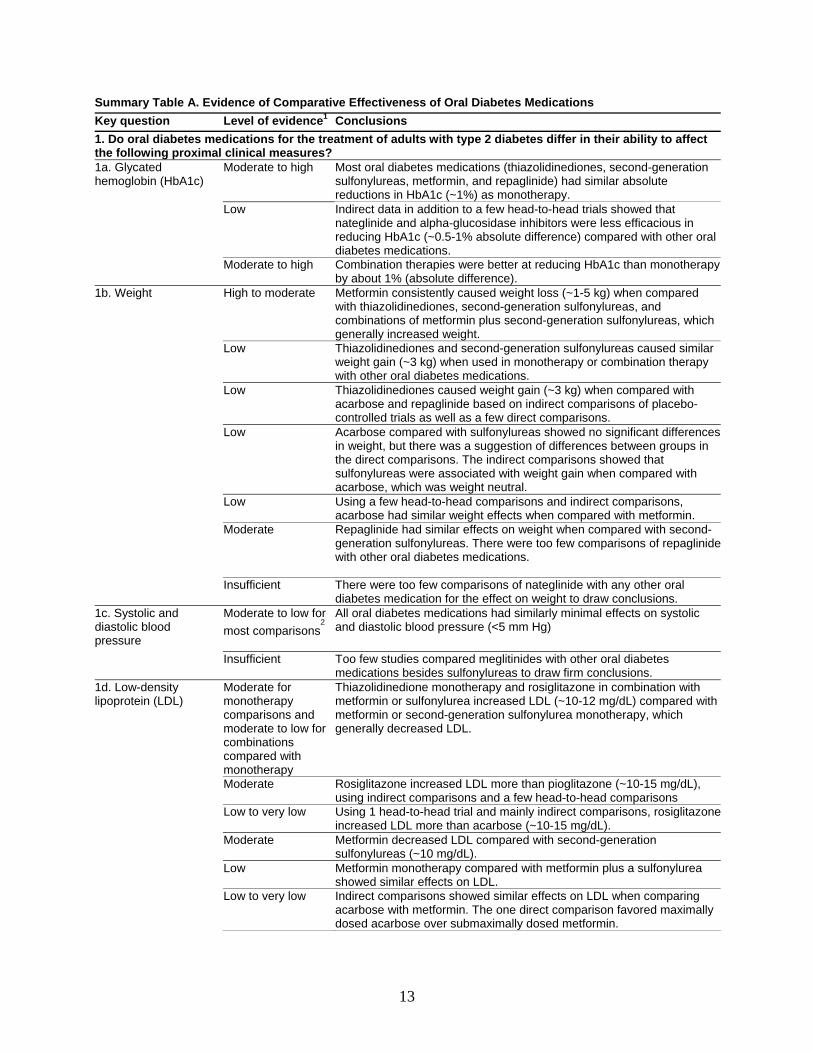
Summary Table A. Evidence of Comparative Effectiveness of Oral Diabetes Medications Key question Level of evidence1 Conclusions 1. Do oral diabetes medications for the treatment of adults with type 2 diabetes differ in their ability to affect the following proximal clinical measures? 1a. Glycated hemoglobin (HbA1c)
Moderate to high
Most oral diabetes medications (thiazolidinediones, second-generation sulfonylureas, metformin, and repaglinide) had similar absolute reductions in HbA1c (~1%) as monotherapy.
Low Indirect data in addition to a few head-to-head trials showed that nateglinide and alpha-glucosidase inhibitors were less efficacious in reducing HbA1c (~0.5-1% absolute difference) compared with other oral diabetes medications.
Moderate to high Combination therapies were better at reducing HbA1c than monotherapy by about 1% (absolute difference).
1b. Weight High to moderate Metformin consistently caused weight loss (~1-5 kg) when compared with thiazolidinediones, second-generation sulfonylureas, and combinations of metformin plus second-generation sulfonylureas, which generally increased weight.
Low Thiazolidinediones and second-generation sulfonylureas caused similar weight gain (~3 kg) when used in monotherapy or combination therapy with other oral diabetes medications.
Low Thiazolidinediones caused weight gain (~3 kg) when compared with acarbose and repaglinide based on indirect comparisons of placebo-controlled trials as well as a few direct comparisons.
Low Acarbose compared with sulfonylureas showed no significant differences in weight, but there was a suggestion of differences between groups in the direct comparisons. The indirect comparisons showed that sulfonylureas were associated with weight gain when compared with acarbose, which was weight neutral.
Low Using a few head-to-head comparisons and indirect comparisons, acarbose had similar weight effects when compared with metformin.
Moderate
Repaglinide had similar effects on weight when compared with second-generation sulfonylureas. There were too few comparisons of repaglinide with other oral diabetes medications.
Insufficient There were too few comparisons of nateglinide with any other oral diabetes medication for the effect on weight to draw conclusions.
1c. Systolic and diastolic blood pressure
Moderate to low for most comparisons
2
All oral diabetes medications had similarly minimal effects on systolic and diastolic blood pressure (<5 mm Hg)
Insufficient Too few studies compared meglitinides with other oral diabetes medications besides sulfonylureas to draw firm conclusions.
1d. Low-density lipoprotein (LDL)
Moderate for monotherapy comparisons and moderate to low for combinations compared with monotherapy
Thiazolidinedione monotherapy and rosiglitazone in combination with metformin or sulfonylurea increased LDL (~10-12 mg/dL) compared with metformin or second-generation sulfonylurea monotherapy, which generally decreased LDL.
Moderate Rosiglitazone increased LDL more than pioglitazone (~10-15 mg/dL), using indirect comparisons and a few head-to-head comparisons
Low to very low Using 1 head-to-head trial and mainly indirect comparisons, rosiglitazoneincreased LDL more than acarbose (~10-15 mg/dL).
Moderate Metformin decreased LDL compared with second-generation sulfonylureas (~10 mg/dL).
Low Metformin monotherapy compared with metformin plus a sulfonylurea showed similar effects on LDL.
Low to very low Indirect comparisons showed similar effects on LDL when comparing acarbose with metformin. The one direct comparison favored maximally dosed acarbose over submaximally dosed metformin.
14
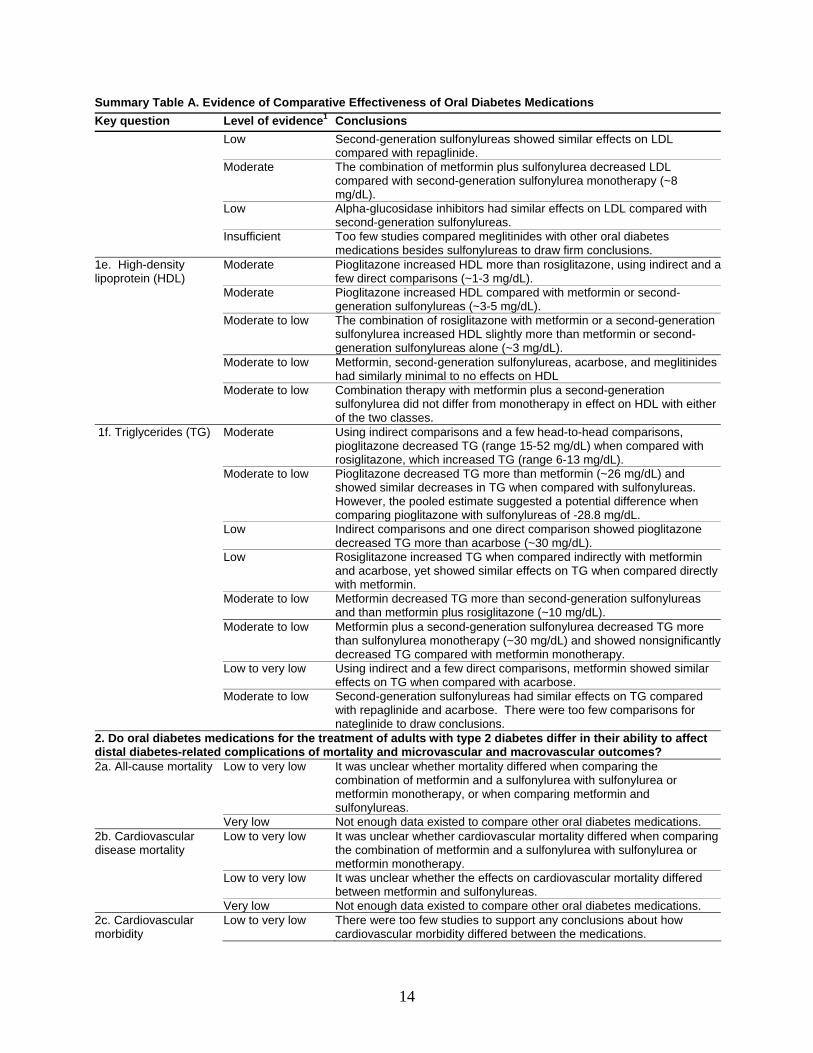
Summary Table A. Evidence of Comparative Effectiveness of Oral Diabetes Medications Key question Level of evidence1 Conclusions Low Second-generation sulfonylureas showed similar effects on LDL
compared with repaglinide. Moderate The combination of metformin plus sulfonylurea decreased LDL
compared with second-generation sulfonylurea monotherapy (~8 mg/dL).
Low Alpha-glucosidase inhibitors had similar effects on LDL compared with second-generation sulfonylureas.
Insufficient Too few studies compared meglitinides with other oral diabetes medications besides sulfonylureas to draw firm conclusions.
1e. High-density lipoprotein (HDL)
Moderate Pioglitazone increased HDL more than rosiglitazone, using indirect and a few direct comparisons (~1-3 mg/dL).
Moderate Pioglitazone increased HDL compared with metformin or second-generation sulfonylureas (~3-5 mg/dL).
Moderate to low The combination of rosiglitazone with metformin or a second-generation sulfonylurea increased HDL slightly more than metformin or second-generation sulfonylureas alone (~3 mg/dL).
Moderate to low Metformin, second-generation sulfonylureas, acarbose, and meglitinides had similarly minimal to no effects on HDL
Moderate to low Combination therapy with metformin plus a second-generation sulfonylurea did not differ from monotherapy in effect on HDL with either of the two classes.
1f. Triglycerides (TG) Moderate
Using indirect comparisons and a few head-to-head comparisons, pioglitazone decreased TG (range 15-52 mg/dL) when compared with rosiglitazone, which increased TG (range 6-13 mg/dL).
Moderate to low Pioglitazone decreased TG more than metformin (~26 mg/dL) and showed similar decreases in TG when compared with sulfonylureas. However, the pooled estimate suggested a potential difference when comparing pioglitazone with sulfonylureas of -28.8 mg/dL.
Low Indirect comparisons and one direct comparison showed pioglitazone decreased TG more than acarbose (~30 mg/dL).
Low Rosiglitazone increased TG when compared indirectly with metformin and acarbose, yet showed similar effects on TG when compared directly with metformin.
Moderate to low Metformin decreased TG more than second-generation sulfonylureas and than metformin plus rosiglitazone (~10 mg/dL).
Moderate to low Metformin plus a second-generation sulfonylurea decreased TG more than sulfonylurea monotherapy (~30 mg/dL) and showed nonsignificantly decreased TG compared with metformin monotherapy.
Low to very low Using indirect and a few direct comparisons, metformin showed similar effects on TG when compared with acarbose.
Moderate to low Second-generation sulfonylureas had similar effects on TG compared with repaglinide and acarbose. There were too few comparisons for nateglinide to draw conclusions.
2. Do oral diabetes medications for the treatment of adults with type 2 diabetes differ in their ability to affect distal diabetes-related complications of mortality and microvascular and macrovascular outcomes? 2a. All-cause mortality Low to very low It was unclear whether mortality differed when comparing the
combination of metformin and a sulfonylurea with sulfonylurea or metformin monotherapy, or when comparing metformin and sulfonylureas.
Very low Not enough data existed to compare other oral diabetes medications. 2b. Cardiovascular disease mortality
Low to very low It was unclear whether cardiovascular mortality differed when comparing the combination of metformin and a sulfonylurea with sulfonylurea or metformin monotherapy.
Low to very low It was unclear whether the effects on cardiovascular mortality differed between metformin and sulfonylureas.
Very low Not enough data existed to compare other oral diabetes medications. 2c. Cardiovascular morbidity
Low to very low There were too few studies to support any conclusions about how cardiovascular morbidity differed between the medications.
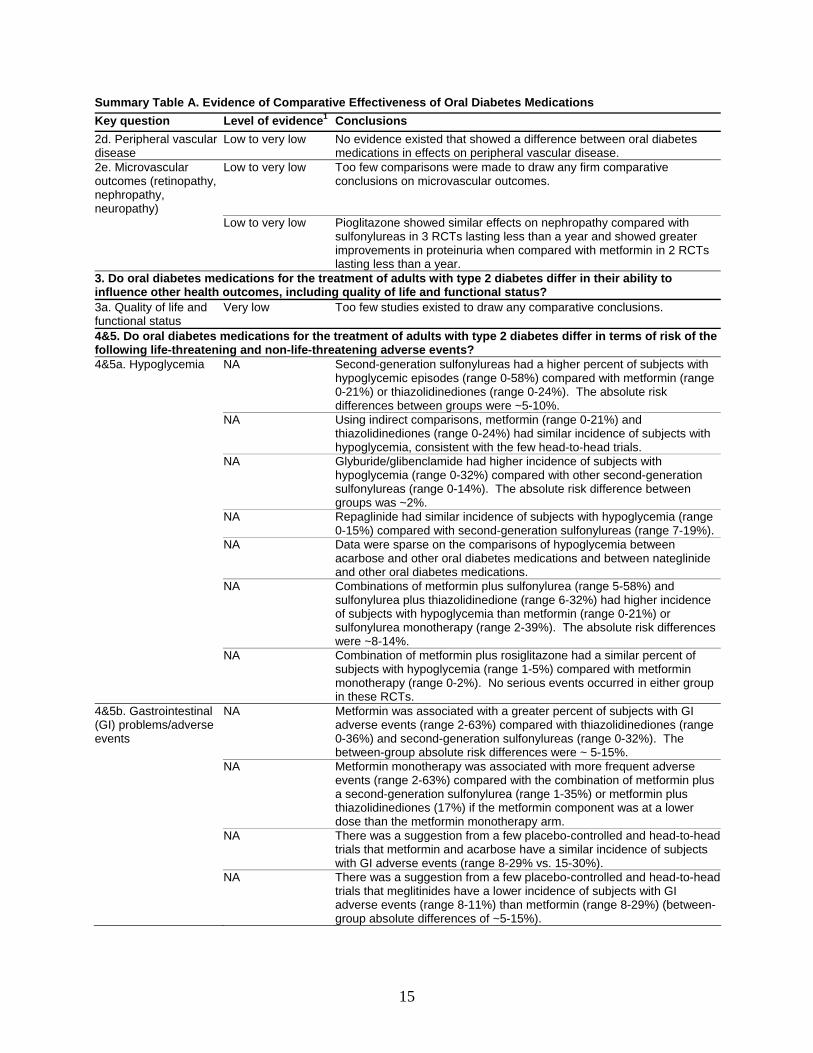
15
Summary Table A. Evidence of Comparative Effectiveness of Oral Diabetes Medications Key question Level of evidence1 Conclusions 2d. Peripheral vascular disease
Low to very low No evidence existed that showed a difference between oral diabetes medications in effects on peripheral vascular disease.
2e. Microvascular outcomes (retinopathy, nephropathy, neuropathy)
Low to very low Too few comparisons were made to draw any firm comparative conclusions on microvascular outcomes.
Low to very low Pioglitazone showed similar effects on nephropathy compared with sulfonylureas in 3 RCTs lasting less than a year and showed greater improvements in proteinuria when compared with metformin in 2 RCTs lasting less than a year.
3. Do oral diabetes medications for the treatment of adults with type 2 diabetes differ in their ability to influence other health outcomes, including quality of life and functional status? 3a. Quality of life and functional status
Very low Too few studies existed to draw any comparative conclusions.
4&5. Do oral diabetes medications for the treatment of adults with type 2 diabetes differ in terms of risk of the following life-threatening and non-life-threatening adverse events? 4&5a. Hypoglycemia NA Second-generation sulfonylureas had a higher percent of subjects with
hypoglycemic episodes (range 0-58%) compared with metformin (range 0-21%) or thiazolidinediones (range 0-24%). The absolute risk differences between groups were ~5-10%.
NA Using indirect comparisons, metformin (range 0-21%) and thiazolidinediones (range 0-24%) had similar incidence of subjects with hypoglycemia, consistent with the few head-to-head trials.
NA Glyburide/glibenclamide had higher incidence of subjects with hypoglycemia (range 0-32%) compared with other second-generation sulfonylureas (range 0-14%). The absolute risk difference between groups was ~2%.
NA Repaglinide had similar incidence of subjects with hypoglycemia (range 0-15%) compared with second-generation sulfonylureas (range 7-19%).
NA Data were sparse on the comparisons of hypoglycemia between acarbose and other oral diabetes medications and between nateglinide and other oral diabetes medications.
NA Combinations of metformin plus sulfonylurea (range 5-58%) and sulfonylurea plus thiazolidinedione (range 6-32%) had higher incidence of subjects with hypoglycemia than metformin (range 0-21%) or sulfonylurea monotherapy (range 2-39%). The absolute risk differences were ~8-14%.
NA Combination of metformin plus rosiglitazone had a similar percent of subjects with hypoglycemia (range 1-5%) compared with metformin monotherapy (range 0-2%). No serious events occurred in either group in these RCTs.
4&5b. Gastrointestinal (GI) problems/adverse events
NA Metformin was associated with a greater percent of subjects with GI adverse events (range 2-63%) compared with thiazolidinediones (range 0-36%) and second-generation sulfonylureas (range 0-32%). The between-group absolute risk differences were ~ 5-15%.
NA Metformin monotherapy was associated with more frequent adverse events (range 2-63%) compared with the combination of metformin plus a second-generation sulfonylurea (range 1-35%) or metformin plus thiazolidinediones (17%) if the metformin component was at a lower dose than the metformin monotherapy arm.
NA There was a suggestion from a few placebo-controlled and head-to-head trials that metformin and acarbose have a similar incidence of subjects with GI adverse events (range 8-29% vs. 15-30%).
NA There was a suggestion from a few placebo-controlled and head-to-head trials that meglitinides have a lower incidence of subjects with GI adverse events (range 8-11%) than metformin (range 8-29%) (between-group absolute differences of ~5-15%).
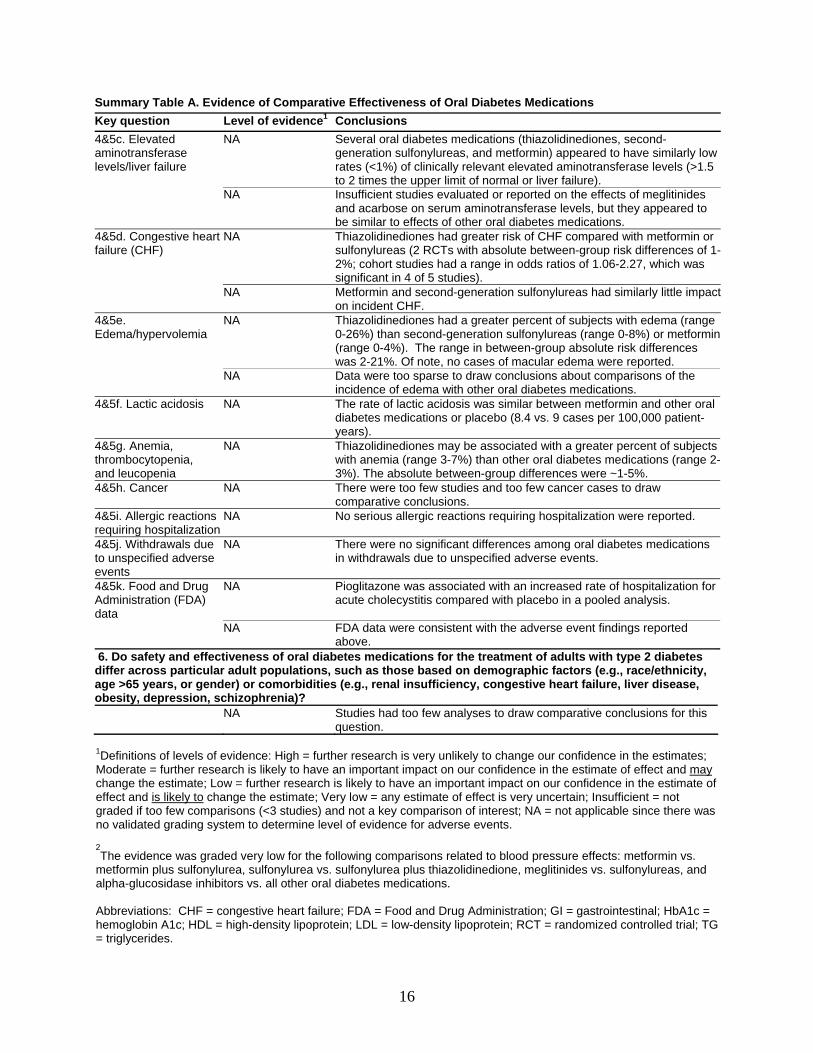
16
Summary Table A. Evidence of Comparative Effectiveness of Oral Diabetes Medications Key question Level of evidence1 Conclusions 4&5c. Elevated aminotransferase levels/liver failure
NA Several oral diabetes medications (thiazolidinediones, second-generation sulfonylureas, and metformin) appeared to have similarly low rates (<1%) of clinically relevant elevated aminotransferase levels (>1.5 to 2 times the upper limit of normal or liver failure).
NA Insufficient studies evaluated or reported on the effects of meglitinides and acarbose on serum aminotransferase levels, but they appeared to be similar to effects of other oral diabetes medications.
4&5d. Congestive heart failure (CHF)
NA Thiazolidinediones had greater risk of CHF compared with metformin or sulfonylureas (2 RCTs with absolute between-group risk differences of 1-2%; cohort studies had a range in odds ratios of 1.06-2.27, which was significant in 4 of 5 studies).
NA Metformin and second-generation sulfonylureas had similarly little impact on incident CHF.
4&5e. Edema/hypervolemia
NA Thiazolidinediones had a greater percent of subjects with edema (range 0-26%) than second-generation sulfonylureas (range 0-8%) or metformin (range 0-4%). The range in between-group absolute risk differences was 2-21%. Of note, no cases of macular edema were reported.
NA Data were too sparse to draw conclusions about comparisons of the incidence of edema with other oral diabetes medications.
4&5f. Lactic acidosis NA The rate of lactic acidosis was similar between metformin and other oral diabetes medications or placebo (8.4 vs. 9 cases per 100,000 patient-years).
4&5g. Anemia, thrombocytopenia, and leucopenia
NA Thiazolidinediones may be associated with a greater percent of subjects with anemia (range 3-7%) than other oral diabetes medications (range 2-3%). The absolute between-group differences were ~1-5%.
4&5h. Cancer NA There were too few studies and too few cancer cases to draw comparative conclusions.
4&5i. Allergic reactions requiring hospitalization
NA No serious allergic reactions requiring hospitalization were reported.
4&5j. Withdrawals due to unspecified adverse events
NA There were no significant differences among oral diabetes medications in withdrawals due to unspecified adverse events.
4&5k. Food and Drug Administration (FDA) data
NA Pioglitazone was associated with an increased rate of hospitalization for acute cholecystitis compared with placebo in a pooled analysis.
NA FDA data were consistent with the adverse event findings reported above.
6. Do safety and effectiveness of oral diabetes medications for the treatment of adults with type 2 diabetes differ across particular adult populations, such as those based on demographic factors (e.g., race/ethnicity, age >65 years, or gender) or comorbidities (e.g., renal insufficiency, congestive heart failure, liver disease, obesity, depression, schizophrenia)? NA Studies had too few analyses to draw comparative conclusions for this
question. 1Definitions of levels of evidence: High = further research is very unlikely to change our confidence in the estimates; Moderate = further research is likely to have an important impact on our confidence in the estimate of effect and may change the estimate; Low = further research is likely to have an important impact on our confidence in the estimate of effect and is likely to change the estimate; Very low = any estimate of effect is very uncertain; Insufficient = not graded if too few comparisons (<3 studies) and not a key comparison of interest; NA = not applicable since there was no validated grading system to determine level of evidence for adverse events. 2The evidence was graded very low for the following comparisons related to blood pressure effects: metformin vs.
metformin plus sulfonylurea, sulfonylurea vs. sulfonylurea plus thiazolidinedione, meglitinides vs. sulfonylureas, and alpha-glucosidase inhibitors vs. all other oral diabetes medications. Abbreviations: CHF = congestive heart failure; FDA = Food and Drug Administration; GI = gastrointestinal; HbA1c = hemoglobin A1c; HDL = high-density lipoprotein; LDL = low-density lipoprotein; RCT = randomized controlled trial; TG = triglycerides.
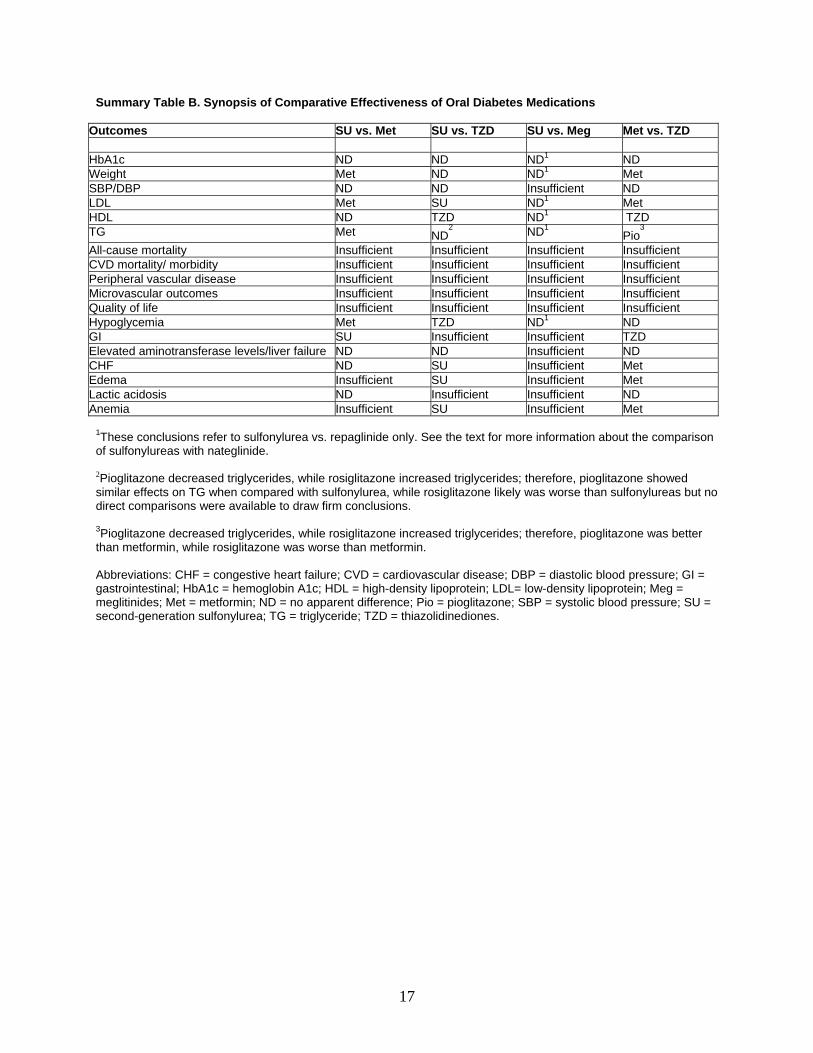
17
Summary Table B. Synopsis of Comparative Effectiveness of Oral Diabetes Medications
Outcomes SU vs. Met SU vs. TZD SU vs. Meg Met vs. TZD HbA1c ND ND ND1 ND Weight Met ND ND1 Met SBP/DBP ND ND Insufficient ND LDL Met SU ND1 Met HDL ND TZD ND1 TZD TG Met ND
2 ND1 Pio3
All-cause mortality Insufficient Insufficient Insufficient Insufficient CVD mortality/ morbidity Insufficient Insufficient Insufficient Insufficient Peripheral vascular disease Insufficient Insufficient Insufficient Insufficient Microvascular outcomes Insufficient Insufficient Insufficient Insufficient Quality of life Insufficient Insufficient Insufficient Insufficient Hypoglycemia Met TZD ND1 ND GI SU Insufficient Insufficient TZD Elevated aminotransferase levels/liver failure ND ND Insufficient ND CHF ND SU Insufficient Met Edema Insufficient SU Insufficient Met Lactic acidosis ND Insufficient Insufficient ND Anemia Insufficient SU Insufficient Met
1These conclusions refer to sulfonylurea vs. repaglinide only. See the text for more information about the comparison of sulfonylureas with nateglinide. 2Pioglitazone decreased triglycerides, while rosiglitazone increased triglycerides; therefore, pioglitazone showed similar effects on TG when compared with sulfonylurea, while rosiglitazone likely was worse than sulfonylureas but no direct comparisons were available to draw firm conclusions. 3Pioglitazone decreased triglycerides, while rosiglitazone increased triglycerides; therefore, pioglitazone was better than metformin, while rosiglitazone was worse than metformin. Abbreviations: CHF = congestive heart failure; CVD = cardiovascular disease; DBP = diastolic blood pressure; GI = gastrointestinal; HbA1c = hemoglobin A1c; HDL = high-density lipoprotein; LDL= low-density lipoprotein; Meg = meglitinides; Met = metformin; ND = no apparent difference; Pio = pioglitazone; SBP = systolic blood pressure; SU = second-generation sulfonylurea; TG = triglyceride; TZD = thiazolidinediones.


19
Introduction Background
Type 2 diabetes is characterized by insulin resistance, which is accompanied by a progressive deficiency in insulin secretion. Type 2 diabetes is an increasingly common disease that is closely associated with obesity.1, 2 In 2005, the prevalence of Americans with diagnosed type 2 diabetes was 2.4% in the United States for adults aged 20 to 39 years, 10% for adults aged 40 to 59 years, and 21% in adults aged 60 years or over.3 From 1980 through 2004, the number of Americans with diagnosed diabetes more than doubled, from 5.8 million to 14.7 million.4 There were similar incidence rates of diabetes for men and women in the Third National Health and Nutrition Survey (NHANES III), but the rates for non-Hispanic blacks and Mexican-Americans were 1.6 and 1.9 times the rate for non-Hispanic whites.1
Randomized controlled trials (RCTs) and observational studies have shown that improved glycemic control reduces microvascular complications and may reduce macrovascular complications;5-9 however, the effects of specific oral diabetes medications on these outcomes are less certain. As oral diabetes medications such as the thiazolidinediones and meglitinides have become available for the treatment of diabetes, clinicians and patients have been forced to choose from a bewildering array of medications. Confusion has increased because of emerging concerns that particular medications confer excess cardiovascular risks when compared to other oral diabetes medications or placebo.10-14
The well-known results of the United Kingdom Prospective Diabetes Study (UKPDS) indicated that when oral diabetes medications have similar effects on glycemic control, these medications have similar effects on cardiovascular morbidity and mortality.15, 16 However, the UKPDS was conducted prior to the emergence of thiazolidinediones.7 In addition, several systematic reviews of oral diabetes medications have shed light on differences in short-term and long-term outcomes of different oral diabetes medications.17-25 However, only two reviews have compared all of the oral diabetes medications commonly used in the United States.24, 25 A systematic review by Inzucchi et al., in 2002, found that: 1) with the exception of the alpha-glucosidase inhibitors, which decrease hemoglobin A1c (HbA1c) by 0.5-1%, most diabetes medications lower HbA1c to a similar extent, producing an absolute reduction of about 1-2%; 2) when medications are used in combination, additional glucose-lowering benefits are seen; and 3) long-term vascular risk reduction can be demonstrated only with sulfonylureas and metformin.24 In 2004, Buse et al. compared the effects on serum lipid levels of all the oral diabetes medications. They found that only metformin, acarbose, voglibose, rosiglitazone, and pioglitazone had significant effects on serum lipid levels. Metformin at high doses and pioglitazone both reduced triglycerides (TGs), while acarbose, rosiglitazone, and pioglitazone increased high density lipoproteins (HDLs). Finally, acarbose decreased low density lipoprotein (LDL), while rosiglitazone increased LDL.25
Many other outcomes in addition to HbA1c and lipid levels are important to consider when oral diabetes medications are being compared. These outcomes include blood pressure, weight, microvascular and macrovascular disease, and mortality. Evaluation of adverse events is critical because adverse events affect adherence as well as morbidity and mortality. Certain diabetes
20
medications may be less safe for persons with comorbid conditions. For instance, biguanides such as metformin are contraindicated in patients with renal or liver failure because of a potentially higher risk of lactic acidosis.26 To date, no study has comprehensively evaluated all of the major short-term and long-term clinical effects of all the oral diabetes medications used in the United States.
We have therefore performed a systematic review of published studies on the comparative effectiveness and safety of all oral diabetes medications. By comparing the short-term and long-term clinical effects of these medications, clinicians may have a better sense of how to choose among the oral diabetes medications. This review should be helpful as new classes of oral diabetes medications come on the market, such as the dipeptidyl peptidase-IV (DPP-IV) inhibitors. In addition, the results presented here may provide policymakers and insurers with better insight as they consider policies relating to medication coverage. Conceptual Model
Our conceptual model (see Figure 1) summarizes the oral diabetes medications, their main physiologic actions, and their effects on proximal clinical measures and distal clinical outcomes, including potential adverse effects. Thiazolidinediones’ main physiologic action is increased uptake of glucose by cells. Sulfonylureas and insulin secretagogues both work on the pancreatic beta cell to release insulin. Metformin works by inhibiting glucose production by the liver, and alpha-glucosidase inhibitors decrease the absorption of glucose in the gut.
These medications were developed to affect proximal clinical measures, such as glycated hemoglobin or glycemic variability, that are associated with important distal clinical outcomes. They may also affect other proximal clinical measures, such as blood pressure and lipid levels, which have been associated with distal outcomes, including mortality and complications of diabetes.27, 28 Glycated hemoglobin is a way to measure glucose control over the past 3 months in persons with diabetes. Glycated hemoglobin is a general term for any hemoglobin that has glucose bound to it, and it can refer either to HbA1c or hemoglobin A1 (HbA1), an older way to measure hemoglobin with bound glucose. These laboratory measures have been used to measure glycemic control. Most studies report HbA1c in both the research and clinical setting. Clinical guidelines in the U.S. suggest that in order to minimize morbidity and mortality in patients with diabetes, the HbA1c should be less than 6.5% or less than 7%, depending on the organization issuing the guideline.29-31 Another measure, 2-hour postprandial glucose (PPG), a measure of glycemic variability, is an independent predictor of cardiovascular disease and is of special importance in patients with normal or near-normal HbA1c.32
Hyperglycemia has been linked to microvascular and macrovascular complications through a variety of mechanisms: 1) increased glycosylation of proteins, which adversely affects organs such as the kidney, vascular beds, and connective tissue; 2) increased production of sorbitol, which generates reactive oxygen species and causes cellular and enzyme dysfunction that can affect vessels and organs; 3) increased formation of diacylglycerol, which not only increases protein kinase C, thereby altering the transcription of genes for proteins involved in endothelial cells and neurons, but may also increase growth factors that play a role in microvascular disease; and 4) increased production of fructose-6-phosphate, which increases growth factor levels and glycosylation of proteins, both of which in turn adversely affect vessels and organs.33 These
21
effects on cells, tissues, and organs lead to the macrovascular and microvascular complications seen in diabetes.
We did not evaluate the proximal clinical measures of insulin and C-peptide levels in this report. The clinical question addressed here is whether different pharmaceutical agents affect the rate of decline in beta cells that occurs with type 2 diabetes. To answer this question, there is a need for a long-term (5-10 year) controlled study evaluating C-peptide and insulin levels at multiple points in time using glucose clamp tests, not just fasting C-peptide and insulin levels measured once after 3 months. Currently, no studies exist to answer this clinically relevant question; therefore, we excluded this clinical measure from our review. Also, proximal measures of inflammatory markers such as C-reactive protein were excluded from our review. Although this is an interesting area that is currently being explored, it would be premature to suggest that decreasing inflammation improves diabetes-related morbidity and mortality.
We have included an evaluation of potential adverse effects of oral diabetes medications, such as hypoglycemia, congestive heart failure (CHF), and lactic acidosis. All diabetes medications may cause hypoglycemia, since each one has a mechanism of action that is designed to reduce hyperglycemia. Some adverse events, such as CHF or lactic acidosis, may be a complication of diabetes or a side-effect of a medication.
We also sought to evaluate the effects of oral diabetes medications on health-related quality of life and functional status, since the macrovascular and microvascular complications of diabetes and the adverse effects of treatment can affect quality of life or functional status. While all of these complications have an economic impact, we did not evaluate the effect of treatment on costs. Instead, we provide limited information on the cost of medications, so that readers can make indirect determinations related to economic impact (see Table 1). We have not assessed the data on adherence to oral diabetes medications, since this subject is beyond the scope of the present report. In general, adherence is improved with lowered pill burdens and fewer doses per day of medication, and we can assume that this relationship holds true for diabetes medications.34
Finally, we sought to determine the extent to which comorbid conditions such as renal and liver disease may alter the effects of oral diabetes medications. For instance, if a medication is cleared by the kidney, its effects may be potentiated in a person with kidney disease.
Scope and Key Questions
This systematic review was commissioned by the Agency for Healthcare Research and Quality (AHRQ) to address the following key questions:
1. Do oral diabetes medications for the treatment of adults with type 2 diabetes differ in their ability to affect the following proximal clinical outcomes: glycated hemoglobin, weight, blood pressure, serum lipid levels, and 2-hour PPG levels?
2. Do oral diabetes medications for the treatment of adults with type 2 diabetes differ in their ability to affect distal diabetes-related complications, including mortality and the following macrovascular and microvascular complications: coronary artery disease, myocardial infarction, stroke, transient ischemic attack, arrhythmia, coronary artery
22
stenosis and in-stent re-stenosis, retinopathy, nephropathy, neuropathy, and peripheral arterial disease?
3. Do oral diabetes medications for the treatment of adults with type 2 diabetes differ in their ability to influence other health outcomes, including quality of life and functional status?
4. Do oral diabetes medications for the treatment of adults with type 2 diabetes differ in
terms of risk of the following life-threatening adverse events: life-threatening hypoglycemia leading to emergency care or death; liver failure; CHF; severe lactic acidosis; cancer; anemia, thrombocytopenia, or leucopenia requiring transfusion; and allergic reactions leading to hospitalization or death?
5. Do oral diabetes medications for the treatment of adults with type 2 diabetes differ in their safety with regard to the following adverse events that are not life-threatening: hypoglycemia requiring any assistance; elevated aminotransferase levels; pedal edema; hypervolemia; anemia, thrombocytopenia, and leucopenia not requiring transfusion; mild lactic acidosis; and gastrointestinal (GI) problems?
6. Do the safety and effectiveness of oral diabetes medications for the treatment of adults with type 2 diabetes differ across particular adult populations, such as those based on demographic factors (e.g., race/ethnicity, age greater than 65 years, or gender) or comorbid conditions (e.g., renal insufficiency, CHF, liver disease, obesity, depression, or schizophrenia)?
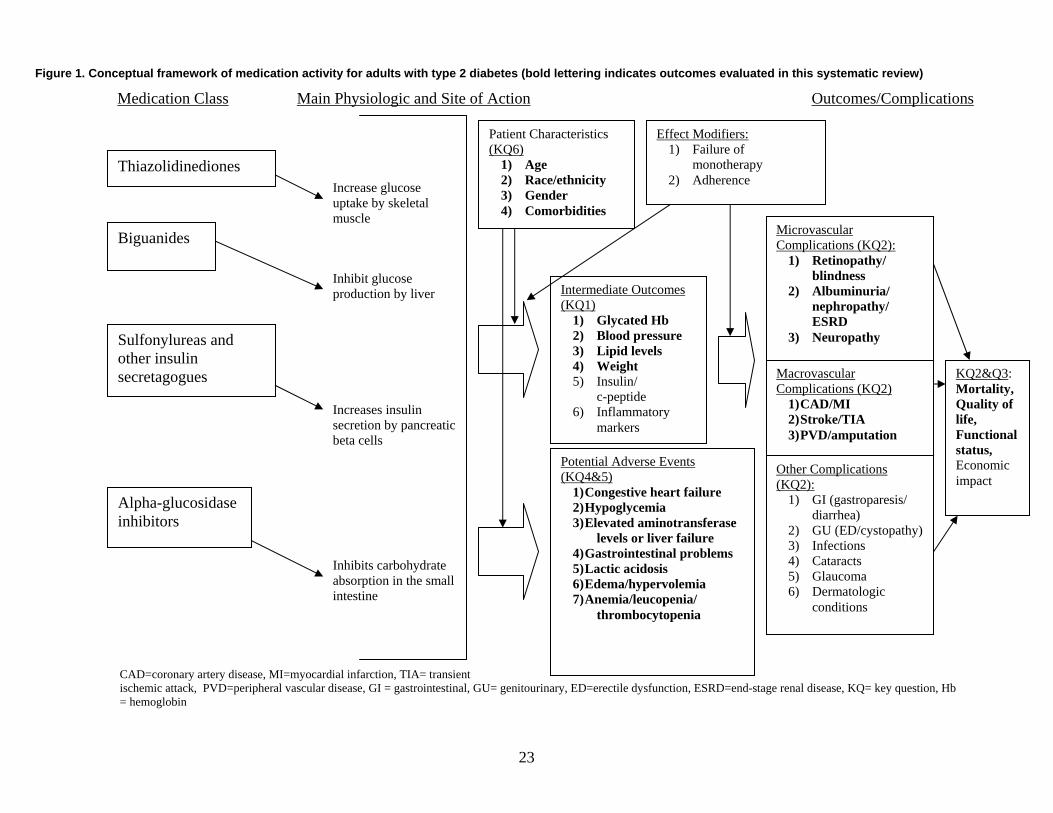
23
Figure 1. Conceptual framework of medication activity for adults with type 2 diabetes (bold lettering indicates outcomes evaluated in this systematic review)
CAD=coronary artery disease, MI=myocardial infarction, TIA= transient ischemic attack, PVD=peripheral vascular disease, GI = gastrointestinal, GU= genitourinary, ED=erectile dysfunction, ESRD=end-stage renal disease, KQ= key question, Hb = hemoglobin
Thiazolidinediones
Biguanides
Sulfonylureas and other insulin secretagogues
Alpha-glucosidase inhibitors
Intermediate Outcomes (KQ1)
1) Glycated Hb 2) Blood pressure 3) Lipid levels 4) Weight 5) Insulin/ c-peptide 6) Inflammatory
markers
Medication Class
Increase glucose uptake by skeletal muscle
Inhibit glucose production by liver
Increases insulin secretion by pancreatic beta cells
Inhibits carbohydrate absorption in the small intestine
Main Physiologic and Site of Action Outcomes/Complications
Macrovascular Complications (KQ2)
1) CAD/MI 2) Stroke/TIA 3) PVD/amputation
Potential Adverse Events (KQ4&5)
1) Congestive heart failure 2) Hypoglycemia 3) Elevated aminotransferase
levels or liver failure 4) Gastrointestinal problems 5) Lactic acidosis 6) Edema/hypervolemia 7) Anemia/leucopenia/
thrombocytopenia
Patient Characteristics (KQ6)
1) Age 2) Race/ethnicity 3) Gender 4) Comorbidities
Effect Modifiers: 1) Failure of
monotherapy 2) Adherence
Microvascular Complications (KQ2):
1) Retinopathy/ blindness
2) Albuminuria/ nephropathy/ ESRD
3) Neuropathy
Other Complications (KQ2):
1) GI (gastroparesis/ diarrhea)
2) GU (ED/cystopathy) 3) Infections 4) Cataracts 5) Glaucoma 6) Dermatologic
conditions
KQ2&Q3: Mortality, Quality of life, Functional status, Economic impact
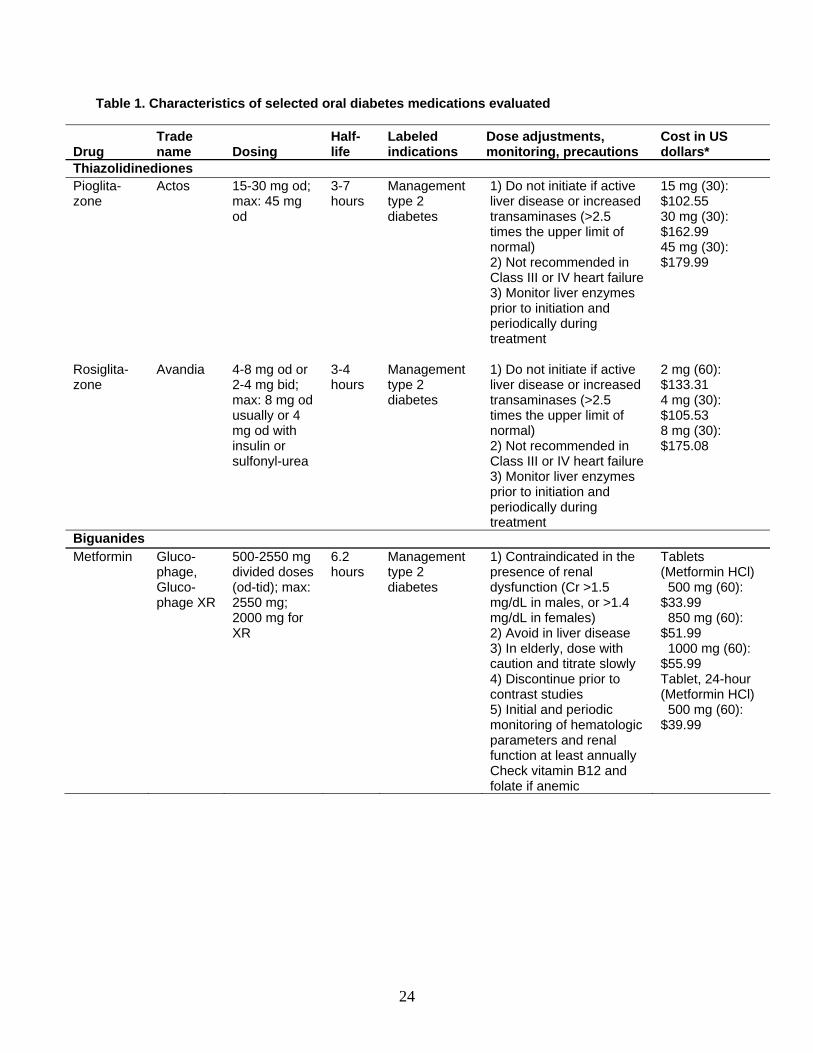
24
Table 1. Characteristics of selected oral diabetes medications evaluated
Drug Trade name Dosing
Half-life
Labeled indications
Dose adjustments, monitoring, precautions
Cost in US dollars*
Thiazolidinediones Pioglita-zone
Actos 15-30 mg od; max: 45 mg od
3-7 hours
Management type 2 diabetes
1) Do not initiate if active liver disease or increased transaminases (>2.5 times the upper limit of normal) 2) Not recommended in Class III or IV heart failure 3) Monitor liver enzymes prior to initiation and periodically during treatment
15 mg (30): $102.55 30 mg (30): $162.99 45 mg (30): $179.99
Rosiglita-zone
Avandia 4-8 mg od or 2-4 mg bid; max: 8 mg od usually or 4 mg od with insulin or sulfonyl-urea
3-4 hours
Management type 2 diabetes
1) Do not initiate if active liver disease or increased transaminases (>2.5 times the upper limit of normal) 2) Not recommended in Class III or IV heart failure 3) Monitor liver enzymes prior to initiation and periodically during treatment
2 mg (60): $133.31 4 mg (30): $105.53 8 mg (30): $175.08
Biguanides Metformin Gluco-
phage, Gluco-phage XR
500-2550 mg divided doses (od-tid); max: 2550 mg; 2000 mg for XR
6.2 hours
Management type 2 diabetes
1) Contraindicated in the presence of renal dysfunction (Cr >1.5 mg/dL in males, or >1.4 mg/dL in females) 2) Avoid in liver disease 3) In elderly, dose with caution and titrate slowly 4) Discontinue prior to contrast studies 5) Initial and periodic monitoring of hematologic parameters and renal function at least annually Check vitamin B12 and folate if anemic
Tablets (Metformin HCl) 500 mg (60): $33.99 850 mg (60): $51.99 1000 mg (60): $55.99 Tablet, 24-hour (Metformin HCl) 500 mg (60): $39.99
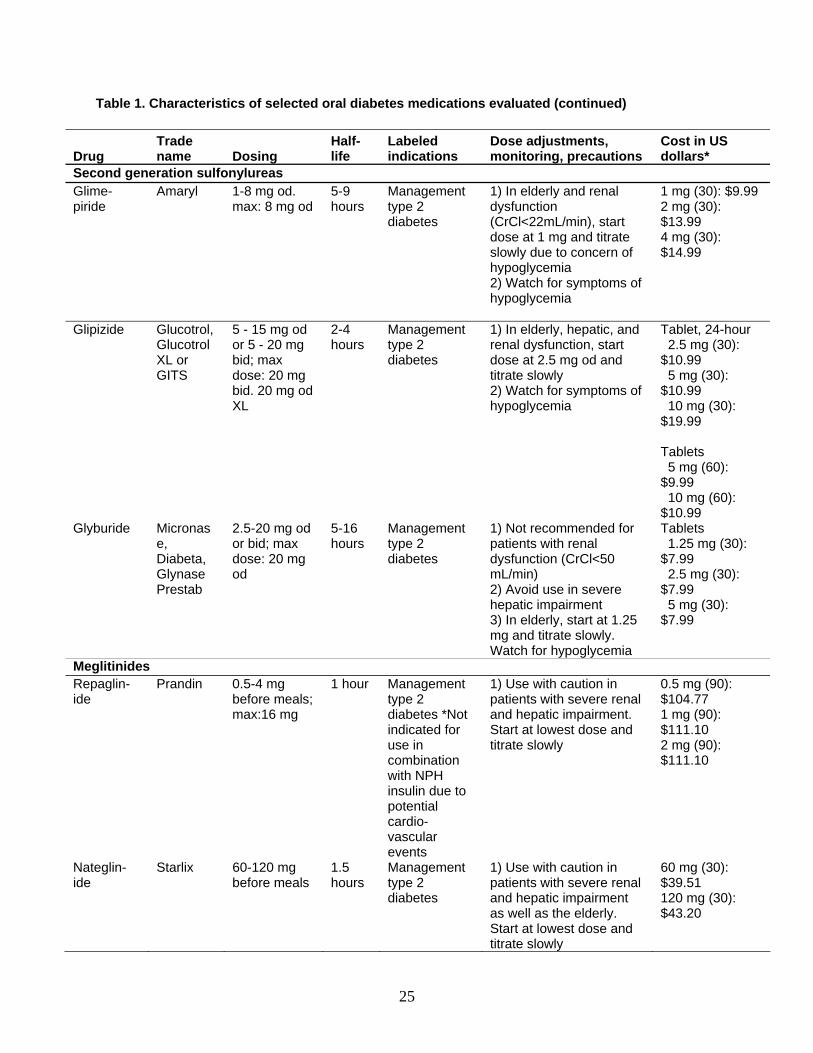
25
Table 1. Characteristics of selected oral diabetes medications evaluated (continued)
Drug Trade name Dosing
Half-life
Labeled indications
Dose adjustments, monitoring, precautions
Cost in US dollars*
Second generation sulfonylureas Glime-piride
Amaryl 1-8 mg od. max: 8 mg od
5-9 hours
Management type 2 diabetes
1) In elderly and renal dysfunction (CrCl<22mL/min), start dose at 1 mg and titrate slowly due to concern of hypoglycemia 2) Watch for symptoms of hypoglycemia
1 mg (30): $9.99 2 mg (30): $13.99 4 mg (30): $14.99
Glipizide Glucotrol, Glucotrol XL or GITS
5 - 15 mg od or 5 - 20 mg bid; max dose: 20 mg bid. 20 mg od XL
2-4 hours
Management type 2 diabetes
1) In elderly, hepatic, and renal dysfunction, start dose at 2.5 mg od and titrate slowly 2) Watch for symptoms of hypoglycemia
Tablet, 24-hour 2.5 mg (30): $10.99 5 mg (30): $10.99 10 mg (30): $19.99 Tablets 5 mg (60): $9.99 10 mg (60): $10.99
Glyburide Micronase, Diabeta, Glynase Prestab
2.5-20 mg od or bid; max dose: 20 mg od
5-16 hours
Management type 2 diabetes
1) Not recommended for patients with renal dysfunction (CrCl<50 mL/min) 2) Avoid use in severe hepatic impairment 3) In elderly, start at 1.25 mg and titrate slowly. Watch for hypoglycemia
Tablets 1.25 mg (30): $7.99 2.5 mg (30): $7.99 5 mg (30): $7.99
Meglitinides Repaglin-ide
Prandin 0.5-4 mg before meals; max:16 mg
1 hour Management type 2 diabetes *Not indicated for use in combination with NPH insulin due to potential cardio-vascular events
1) Use with caution in patients with severe renal and hepatic impairment. Start at lowest dose and titrate slowly
0.5 mg (90): $104.77 1 mg (90): $111.10 2 mg (90): $111.10
Nateglin-ide
Starlix 60-120 mg before meals
1.5 hours
Management type 2 diabetes
1) Use with caution in patients with severe renal and hepatic impairment as well as the elderly. Start at lowest dose and titrate slowly
60 mg (30): $39.51 120 mg (30): $43.20
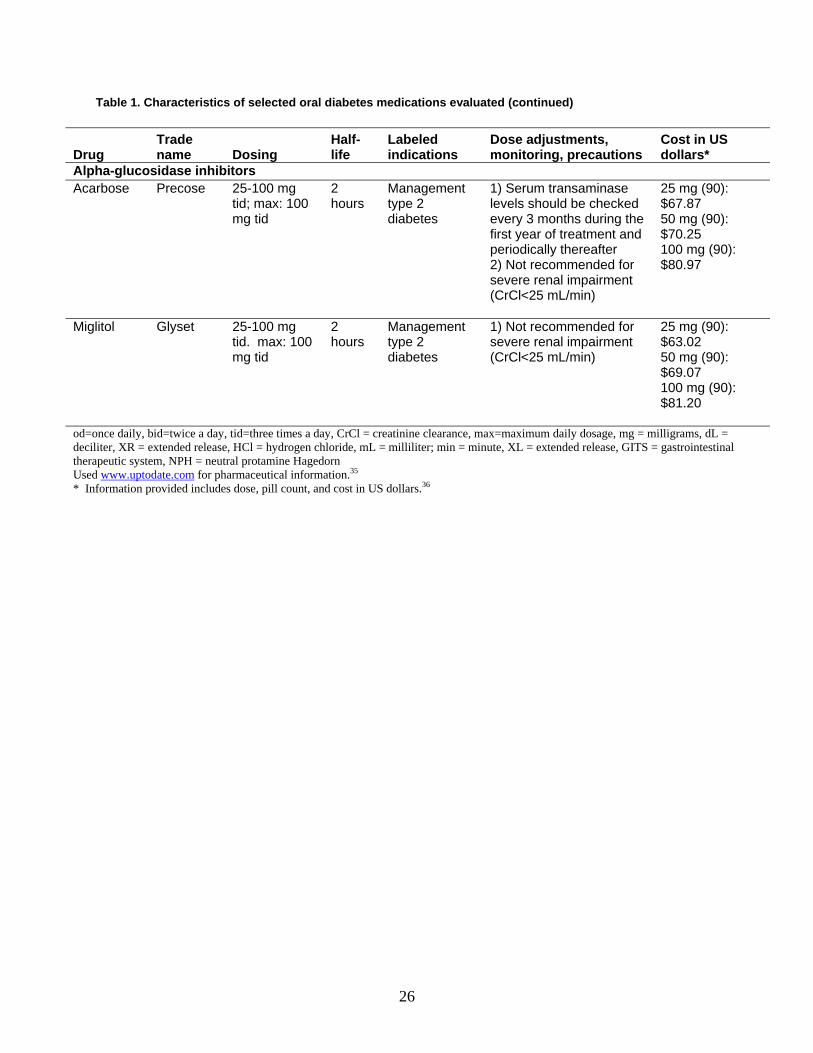
26
Table 1. Characteristics of selected oral diabetes medications evaluated (continued)
Drug Trade name Dosing
Half-life
Labeled indications
Dose adjustments, monitoring, precautions
Cost in US dollars*
Alpha-glucosidase inhibitors Acarbose Precose 25-100 mg
tid; max: 100 mg tid
2 hours
Management type 2 diabetes
1) Serum transaminase levels should be checked every 3 months during the first year of treatment and periodically thereafter 2) Not recommended for severe renal impairment (CrCl<25 mL/min)
25 mg (90): $67.87 50 mg (90): $70.25 100 mg (90): $80.97
Miglitol Glyset 25-100 mg tid. max: 100 mg tid
2 hours
Management type 2 diabetes
1) Not recommended for severe renal impairment (CrCl<25 mL/min)
25 mg (90): $63.02 50 mg (90): $69.07 100 mg (90): $81.20
od=once daily, bid=twice a day, tid=three times a day, CrCl = creatinine clearance, max=maximum daily dosage, mg = milligrams, dL = deciliter, XR = extended release, HCl = hydrogen chloride, mL = milliliter; min = minute, XL = extended release, GITS = gastrointestinal therapeutic system, NPH = neutral protamine Hagedorn Used www.uptodate.com for pharmaceutical information.35 * Information provided includes dose, pill count, and cost in US dollars.36
27
Methods In response to Section 1013 of the Medicare Modernization Act, AHRQ requested an evidence report to synthesize the evidence on the comparative effectiveness of oral diabetes medications. Our EPC established a team and a work plan to develop the evidence report. The project consisted of recruiting technical experts, formulating and refining the specific questions, performing a comprehensive literature search, summarizing the state of the literature, constructing evidence tables, synthesizing the evidence, and submitting the report for peer review. Topic Development The topic for this report was nominated in a public process. At the beginning of the project, we recruited a panel of internal and external technical experts to give input on key steps including the selection and refinement of the questions to be examined. The panel included two internal technical experts from the Johns Hopkins University who have strong expertise in various aspects of the efficacy and/or safety of oral diabetes medications, and external experts who have expertise in diabetes research (see Appendix A). We worked with the technical experts and representatives of AHRQ to develop the Key Questions that are presented in the Scope and Key Questions section of the Introduction. The final Key Questions focus on the differences among oral diabetes medications in their ability to affect proximal clinical measures, distal diabetes-related complications, quality of life, and adverse events. Draft Key Questions were posted to a public website for additional feedback.
Search Strategy
We searched the following databases for primary studies for the periods in parentheses: MEDLINE® (1966 to January 2006), EMBASE® (1974 to January 2006), and the Cochrane Central Register of Controlled Trials (1966 to January 2006). We also searched for systematic reviews until November 2005. Our search strategy combined terms for type 2 diabetes and oral diabetes medications. The search for systematic reviews also included terms for study design, but the search strategy for primary studies did not include these types of terms.
In addition, we received the following material from the Scientific Resource Center that gives support to AHRQ’s EPCs:
• Statistical and medical reviews of rosiglitazone, pioglitazone, nateglinide, metformin, the
combination of rosiglitazone plus second generation sulfonylureas, the combination of metformin plus glyburide, the combination of metformin plus glipizide, and extended
28
release metformin obtained from the website of the United States Food and Drug Administration (FDA).
• Public registries of clinical trials, such as Clinical Study Results website
(www.clinicalstudyresults.org) and ClinicalTrials.gov (www.clinicaltrials.gov). • Unpublished trials on glipizide gastrointestinal therapeutic system (GITS) from Pfizer
Inc. (New York, NY), on rosiglitazone and the combination of rosiglitazone plus metformin from GlaxoSmithKline (Triangle Park, NC), and on the combination of metformin plus glyburide from Bristol-Myers Squibb (New York, NY).
We hand searched 15 journals that were most likely to publish articles on this topic (see
Appendix B), scanning the table of contents of each issue for relevant citations from December 2005 through February 2006. We also reviewed the reference lists of included articles. We developed a search strategy for MEDLINE, accessed via PubMed, based on an analysis of the medical subject headings (MeSH) terms and text words of key articles identified a priori. The PubMed strategy formed the basis for the strategies developed for the other electronic databases (see Appendix C). The results of the searches were downloaded and imported into ProCite® version 5 (ISI ResearchSoft, Carlsbad, CA). From ProCite, the articles were uploaded to SRS 3.0 (TrialStat! Corporation, Ottawa, Ontario, Canada), a web-based software package developed for systematic review data management. We scanned for exact article duplicates, author/title duplicates, and title duplicates using the duplication check feature in both ProCite® and SRS 3.0. Additionally, this database was used to track the search results at title review, abstract review, article inclusion/exclusion, and data abstraction levels. A list of excluded articles is presented in Appendix D. Study Selection
Study selection proceeded in two phases: title review and abstract review. Two independent reviewers conducted title scans in a parallel fashion. For a title to be eliminated at this level, both reviewers had to indicate that it was ineligible. If the two reviewers did not agree on the eligibility of an article, it was promoted to the next level (see Appendix E, Title Review Form). The title review phase was designed to capture as many studies as possible reporting on the efficacy or safety of oral diabetes medications. All titles that were thought to address efficacy, effectiveness, or safety were promoted to the abstract review phase. The abstract review phase was designed to identify studies reporting on the effects of oral diabetes medications on proximal clinical outcomes, distal diabetes-related complications, quality of life, or adverse events. Abstracts were reviewed independently by two investigators, and were excluded if both investigators agreed that the article met one or more of the exclusion criteria (see inclusion and exclusion criteria listed in Table 2). Differences in opinions regarding abstract inclusion or exclusion were resolved through consensus adjudication. Full-text articles initially selected on the basis of abstract review underwent another independent parallel review by investigators to determine if they should be included for full data
29
abstraction. At this phase of the review, investigators determined which of the Key Questions each article addressed (see Appendix E, Article Inclusion/Exclusion Form). Differences in opinions regarding article inclusion were resolved through consensus adjudication.
Data Abstraction
We used a systematic approach for extracting data to minimize the risk of bias in this process. By creating standardized forms for data extraction, we sought to maximize consistency in identifying all pertinent data available for synthesis. If reviewers determined that an article addressed both efficacy and safety, multiple data abstraction forms were used. Each article underwent double review by study investigators of data abstraction and assessment of study quality. The second reviewer confirmed the first reviewer’s data abstraction forms for completeness and accuracy. Reviewer pairs were formed to include personnel with both clinical and methodological expertise. A third reviewer re-reviewed a random sample of articles by the first two reviewers to ensure consistency in the data abstraction of the articles. Reviewers were not masked to the articles’ authors, institution, or journal.37 In most instances, data were directly abstracted from the article. If possible, relevant data were also abstracted from figures. Differences in opinion were resolved through consensus adjudication. For assessments of study quality, each reviewer independently judged study quality and rated items on quality assessment forms (see Appendix E, Data Abstraction Review Forms). For all articles containing original data, reviewers extracted information on general study characteristics (e.g., study design, study period and followup), study participants (e.g., age, gender, race, weight/body mass index (BMI), HbA1c levels, and duration of diabetes), eligibility criteria, interventions (e.g., initial, maximum, and mean doses, frequency of use, and duration of use), outcome measures and the method of ascertainment, and the results of each outcome, including measures of variability (see Appendix E, Data Abstraction Review Forms). We also abstracted data from systematic reviews that specifically applied to our Key Questions (see Appendix E, Data Abstraction Review Forms). Several recent systematic reviews have been published to address the efficacy and safety of oral diabetes medications.1,7,19, 38, 39 Data from systematic review articles were abstracted including: 1) the types of medications and comparisons included in the review, 2) exclusion criteria, 3) search strategies (databases, search terms), 4) range of publication dates of reviewed articles, 5) number of articles in the review, 6) assessment of publication bias, 7) outcomes evaluated, and 8) main conclusions. All information from the article review process was entered into the SRS 3.0 database by the individual completing the review. Reviewers entered comments into the system whenever applicable. The SRS 3.0 database was used to maintain and clean the data, as well as to create detailed evidence tables and summary tables (see Appendix F and Summary Tables).
Quality Assessment
Article quality was assessed differently for RCTs and systematic reviews. For RCTs the dual,
independent review of article quality was based on the Jadad criteria:40 1) appropriateness of the
30
randomization scheme, 2) appropriateness of the blinding, and 3) description of withdrawals and drop-outs. For each RCT, we created a score between 5 (high quality) to 0 (low quality). We had 85 percent consistency between the primary and secondary reviewer; therefore, we report only the second reviewers’ quality scores (the second reviewers generally had more research experience than the primary reviewers). We used study quality to help assess differences between study results.
The quality of each systematic review was assessed using the following criteria: 1) whether the question being addressed by the review was clearly stated; 2) comprehensiveness of search methods used and described in the report; 3) whether inclusion/exclusion criteria were clearly defined and appropriate; 4) whether analyses were conducted to measure variability in efficacy; 5) whether study quality was assessed and done appropriately (using validated instruments); 6) whether differences in how outcomes were reported and analyzed across studies were taken into consideration; 7) whether the study methodology was reproducible; and 8) whether conclusions were supported by the data presented.41
We did not assess the quality of observational studies or non-randomized trials. There is little agreement on the methods for assessing study quality of observational studies.42 Because observational studies and non-randomized trials are inherently weaker study designs than RCTs, we synthesized these results separately from the RCT results. The results of these studies were assessed for congruence with the RCTs. If results were inconsistent with RCTs or there were few RCTs, we then described these studies in more depth including any adjustments for confounding. Applicability
Throughout the report, we discuss the applicability of studies in terms of how well the study population seems consistent with the type 2 diabetes general population. Additionally, we report on dosing and study duration in the text, and use metaregression to identify potential differences in results based on these characteristics. We then discuss these applicability issues in our limitations sections.
Data Analysis and Synthesis
For each Key Question, we created a set of detailed evidence tables containing all information extracted from eligible studies. For the proximal clinical measures (Key Question 1), we conducted meta-analyses for the following higher priority outcomes when there were sufficient data (> 2 or 3 trials) and studies were homogenous with respect to key variables (population characteristics, study duration, and drug dose): HbA1c, weight, systolic blood pressure (SBP), LDL, and TG. The outcomes of 2 hour PPG, diastolic blood pressure (DBP), and HDL were similar to other outcome measures (HbA1c, SBP, and LDL respectively), and we did not conduct meta-analyses since they were generally redundant. We recorded the mean difference between groups along with its measure of dispersion. If this was not reported, we calculated the point estimate using the mean difference from baseline for each group. If the mean difference from baseline was not reported, we calculated this from
31
the baseline and final values for each group. If no measure of dispersion was reported for the between-group difference, we then calculated it using the sum of the variances for the mean difference from baseline for each group. If there were no measures of dispersion for the mean difference from baseline for each group, we then calculated the variance using the standard deviation of the baseline and final values, assuming a correlation between baseline and final values of 0.5. If data were only presented in graphical form, we abstracted data from the graphs. For trials that had more than one dosing arm, we chose the arm that was most consistent with dosing in the other trials. When more than one follow-up interval was reported in the UKPDS we used the data from the followup most similar to the other trials. We then reported the rest of the UKPDS results in a narrative fashion. Pooled estimates (weighted mean differences) of the RCTs were determined using a random effects model with the DerSimonian and Laird formula for calculating between-study variance.43 The random effects model was used due to unmeasured heterogeneity that likely exists among trials, and the 95 percent confidence interval (CI) reports the range of potential point estimates. When data were not sufficient to combine studies in a meta-analysis, we summarized the outcomes by reporting the ranges of values for mean differences from baseline or mean differences between groups (when possible). For diabetes-related complications and quality of life (Key Questions 2 and 3) there were too few similar trials for each drug comparison to combine these results in a meta-analysis. For Key Questions 4 and 5, we were unable to conduct meta-analyses on most of the adverse events due to methodologic diversity among the trials such as differences in definitions of selected adverse events or lack of sufficient numbers of trials to combine. When there were sufficient data on one of the primary adverse events (e.g., hypoglycemia) and the studies were considered to be similar with respect to important variables (population characteristics, drug comparisons, drug dosage, definition of adverse event, and followup time), we performed meta-analyses. Almost all the trials were less than one year. UKPDS was described separately since this RCT was very different from the other trials, and had a much longer study duration (mean followup 10.7 years).15 16 For trials that had more than one dosing arm, we chose the arm that was most consistent with dosing in the other trials. We represented the pooled data using absolute risk differences since this may be more easily interpreted than a relative risk in the clinical setting. We calculated pooled effect estimates of the absolute risk difference between trial arms from the RCTs, with each study weighted by the inverse of the study variance, using a random effects model with the DerSimonian and Laird formula for calculating between-study variance.43 Heterogeneity among the trials in all the meta-analyses was tested using a standard chi-squared test using a significance level of alpha less than or equal to 0.10. We also examined heterogeneity among studies with an I2 statistic, which describes the variability in effect estimates that is due to heterogeneity rather than random chance.44 A value greater than 50 percent may be considered to have substantial variability. If heterogeneity was found, we attempted to determine potential reasons by conducting metaregression using study level characteristics such as double-blinding, study duration, and dose ratio (dose ratio of drug 1 divided by dose ratio of drug 2). The dose ratio for each drug was calculated as the dose given in the study divided by the maximum approved dose of drug. We conducted sensitivity analyses by omitting one study at a time to assess the influence of any single study on the pooled estimate. Additionally, we conducted indirect comparisons when there were too few direct comparison results (<3 trials), and there were sufficient placebo-controlled trials (>2 trials) for each drug
32
being compared. The indirect comparison point estimates were calculated as the difference between the placebo-controlled trial pooled estimates, and the measures of variability were calculated using the sum of the variances from the placebo-controlled trial meta-analyses.45 Because statistically significant findings are more likely to be published than studies without statistically significant results (publication bias), we examined whether there was evidence that smaller, negative studies appeared to be missing from the literature. We therefore conducted formal tests for publication bias using Begg’s46 and Eggers tests47 including evaluation of the asymmetry of funnel plots for each comparison of interest for the following outcomes where meta-analyses were conducted: A1c, weight, SBP, LDL, TGs, and hypoglycemia. All statistical analyses were conducted using STATA (Intercooled, version 8.0, StataCorp, College Station, TX). Data Entry and Quality Control
After a second reviewer reviewed data that had been entered into SRS® 3.0, adjudicated data were re-entered into web-based data collection forms by the second reviewer. Second reviewers were generally more experienced members of the research team. In addition, a lead investigator examined a random sample of the reviews to identify problems with data abstraction. If problems were recognized in a reviewer’s data abstraction, the problems were discussed at a meeting with the reviewers. In addition, research assistants used a system of random data checks to assure data abstraction accuracy. Rating the Body of Evidence At the completion of our review, we graded the quantity, quality and consistency of the best available evidence addressing Key Questions 1, 2 and 3 by adapting an evidence grading scheme recommended by the GRADE Working Group.48 We applied evidence grades to bodies of evidence on each type of intervention comparison for each major type of outcome. We assessed the strength of the study designs with RCTs considered best, followed by non-RCTs, and observational studies. To assess the quantity of evidence, we focused on the number of studies with the strongest design. We also assessed the quality and consistency of the best available evidence, including assessment of limitations to individual study quality (using individual quality scores), certainty regarding the directness of the observed effects in studies, precision and strength of findings, and availability (or lack thereof) of data to answer the Key Question. We classified evidence bodies pertaining to Key Questions 1-3 into four basic categories: 1) “high” grade (indicating confidence that further research is very unlikely to change our confidence in the estimated effect in the abstracted literature); 2) “moderate” grade (indicating that further research is likely to have an important impact on our confidence in the estimates of effects and may change the estimates in the abstracted literature); 3) “low” grade (indicating further research is very likely to have an important impact on confidence in the estimates of effects and is likely to change the estimates in the abstracted literature); and 4) “very low” grade
33
(indicating any estimate of effect is very uncertain). We graded the body of evidence as “insufficient” if a drug comparison had less than 3 studies. We did not grade the body of evidence for Key Questions 4, 5 and 6 since the system for grading of the body of evidence was developed for questions of efficacy not safety. Peer Review and Public Commentary
A draft of the completed report was sent to the technical experts and peer reviewers, as well as to the representatives of AHRQ and the Scientific Resource Center. Based on comments from AHRQ, revisions were made to the draft report and posted to a website for public comment. In response to the comments of the technical experts, peer reviewers, and the public, revisions were made to the evidence report, and a summary of the comments and their disposition was submitted to AHRQ.
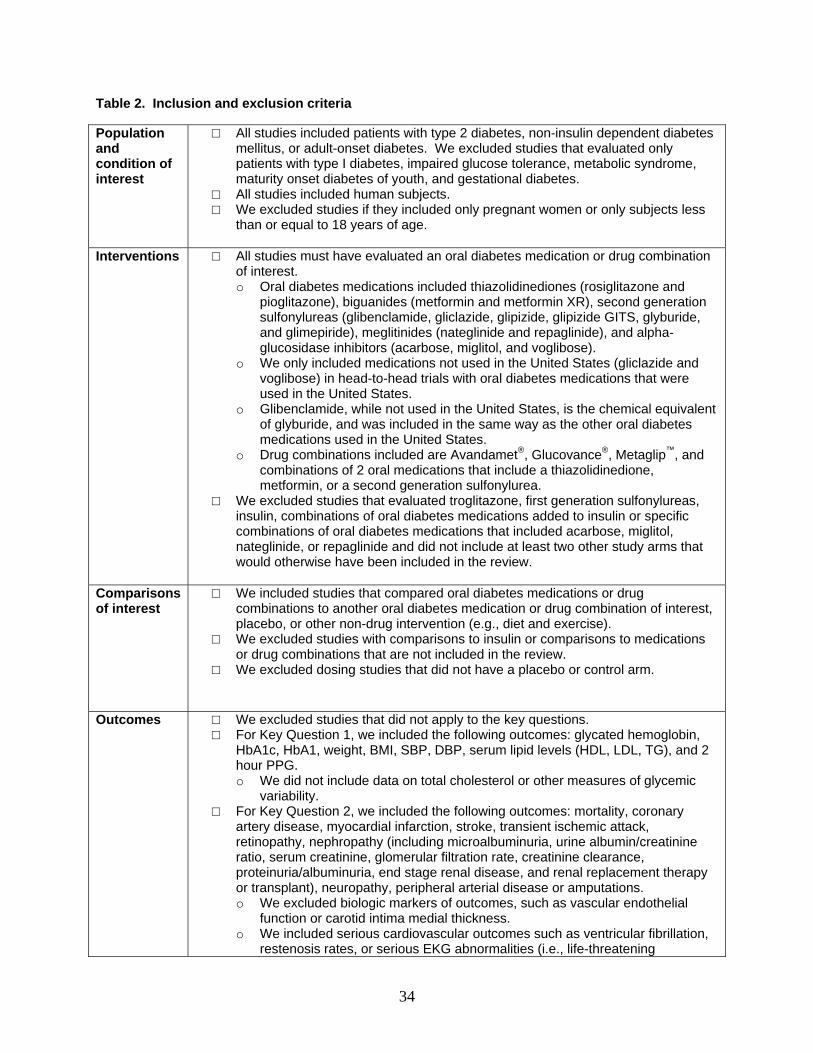
34
Table 2. Inclusion and exclusion criteria Population and condition of interest
□ All studies included patients with type 2 diabetes, non-insulin dependent diabetes mellitus, or adult-onset diabetes. We excluded studies that evaluated only patients with type I diabetes, impaired glucose tolerance, metabolic syndrome, maturity onset diabetes of youth, and gestational diabetes.
□ All studies included human subjects. □ We excluded studies if they included only pregnant women or only subjects less
than or equal to 18 years of age.
Interventions □ All studies must have evaluated an oral diabetes medication or drug combination of interest. o Oral diabetes medications included thiazolidinediones (rosiglitazone and
pioglitazone), biguanides (metformin and metformin XR), second generation sulfonylureas (glibenclamide, gliclazide, glipizide, glipizide GITS, glyburide, and glimepiride), meglitinides (nateglinide and repaglinide), and alpha-glucosidase inhibitors (acarbose, miglitol, and voglibose).
o We only included medications not used in the United States (gliclazide and voglibose) in head-to-head trials with oral diabetes medications that were used in the United States.
o Glibenclamide, while not used in the United States, is the chemical equivalent of glyburide, and was included in the same way as the other oral diabetes medications used in the United States.
o Drug combinations included are Avandamet®, Glucovance®, Metaglip™, and combinations of 2 oral medications that include a thiazolidinedione, metformin, or a second generation sulfonylurea.
□ We excluded studies that evaluated troglitazone, first generation sulfonylureas, insulin, combinations of oral diabetes medications added to insulin or specific combinations of oral diabetes medications that included acarbose, miglitol, nateglinide, or repaglinide and did not include at least two other study arms that would otherwise have been included in the review.
Comparisons of interest
□ We included studies that compared oral diabetes medications or drug combinations to another oral diabetes medication or drug combination of interest, placebo, or other non-drug intervention (e.g., diet and exercise).
□ We excluded studies with comparisons to insulin or comparisons to medications or drug combinations that are not included in the review.
□ We excluded dosing studies that did not have a placebo or control arm.
Outcomes
□ We excluded studies that did not apply to the key questions. □ For Key Question 1, we included the following outcomes: glycated hemoglobin,
HbA1c, HbA1, weight, BMI, SBP, DBP, serum lipid levels (HDL, LDL, TG), and 2 hour PPG. o We did not include data on total cholesterol or other measures of glycemic
variability. □ For Key Question 2, we included the following outcomes: mortality, coronary
artery disease, myocardial infarction, stroke, transient ischemic attack, retinopathy, nephropathy (including microalbuminuria, urine albumin/creatinine ratio, serum creatinine, glomerular filtration rate, creatinine clearance, proteinuria/albuminuria, end stage renal disease, and renal replacement therapy or transplant), neuropathy, peripheral arterial disease or amputations. o We excluded biologic markers of outcomes, such as vascular endothelial
function or carotid intima medial thickness. o We included serious cardiovascular outcomes such as ventricular fibrillation,
restenosis rates, or serious EKG abnormalities (i.e., life-threatening
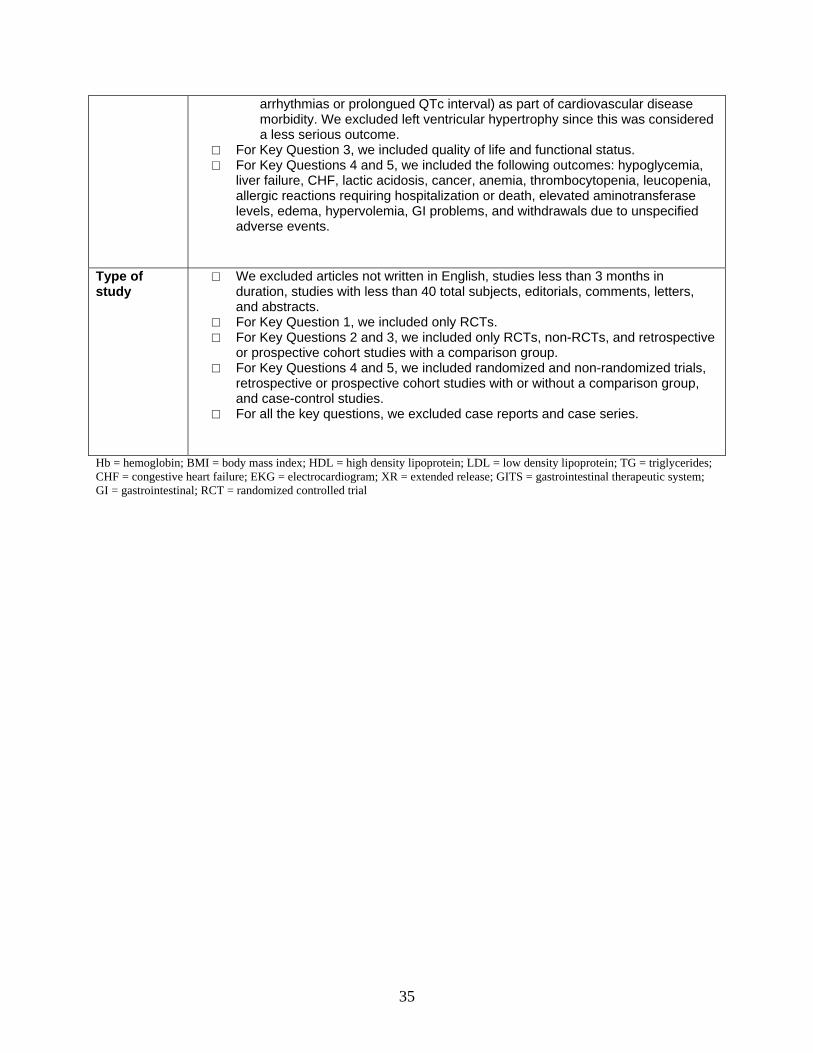
35
arrhythmias or prolongued QTc interval) as part of cardiovascular disease morbidity. We excluded left ventricular hypertrophy since this was considered a less serious outcome.
□ For Key Question 3, we included quality of life and functional status. □ For Key Questions 4 and 5, we included the following outcomes: hypoglycemia,
liver failure, CHF, lactic acidosis, cancer, anemia, thrombocytopenia, leucopenia, allergic reactions requiring hospitalization or death, elevated aminotransferase levels, edema, hypervolemia, GI problems, and withdrawals due to unspecified adverse events.
Type of study
□ We excluded articles not written in English, studies less than 3 months in duration, studies with less than 40 total subjects, editorials, comments, letters, and abstracts.
□ For Key Question 1, we included only RCTs. □ For Key Questions 2 and 3, we included only RCTs, non-RCTs, and retrospective
or prospective cohort studies with a comparison group. □ For Key Questions 4 and 5, we included randomized and non-randomized trials,
retrospective or prospective cohort studies with or without a comparison group, and case-control studies.
□ For all the key questions, we excluded case reports and case series.
Hb = hemoglobin; BMI = body mass index; HDL = high density lipoprotein; LDL = low density lipoprotein; TG = triglycerides; CHF = congestive heart failure; EKG = electrocardiogram; XR = extended release; GITS = gastrointestinal therapeutic system; GI = gastrointestinal; RCT = randomized controlled trial

37
Results Results of Search and Quality of Systematic Reviews
We identified 28 systematic reviews of oral diabetes medications evaluating one or more outcomes of interest (see Figure 2). Most systematic reviews clearly stated their question and described their search techniques (see Appendix F, Evidence Table 1). About two-thirds had appropriate eligibility criteria, yet few reported on their assessment of study quality. The Cochrane systematic reviews scored the highest in quality. We included two Cochrane systematic reviews to supplement our report where appropriate as these reviews matched our eligibility criteria.38, 49 Results of Primary Literature Review
A total of 216 primary literature articles are included in this review (see Figure 3). An overview of the number of head-to-head comparisons is presented in Table 3. A list of the studies included in the meta-analyses is included in Appendix H. Key Question 1: Do oral diabetes medications for the treatment of adults with type 2 diabetes differ in their ability to affect the following proximal clinical outcomes: glycated hemoglobin, weight, blood pressure, serum lipid levels, and 2 hour PPG levels? Study Design and Population Characteristics
About one-third of the trials answering Key Question 1 occurred in the United States either exclusively or in combination with other countries. The study durations ranged from 12 weeks to 10 years, although most studies were relatively short in duration, lasting 12 to 24 weeks. Exclusion criteria were similar among studies: significant renal, cardiovascular, and hepatic disease. Study participants were mainly middle-aged, overweight or obese adults who had diabetes for more than two years. There was a diverse gender mix among the studies. The mean baseline HbA1c among study subjects varied from 6 to12 percent, with most subjects having a mean baseline HbA1c between 7 and 9 percent. Many trials did not report race and when race was reported, most subjects were Caucasian. Lastly, about two-thirds of studies were supported by a pharmaceutical company (see Appendix F, Evidence Tables 2 and 3). These study population characteristics were similar to the general population of patients with diabetes.50
38
Hemoglobin A1c Results Key points
• Most oral diabetes medications had similar efficacy in reducing HbA1c as monotherapy. • A few head-to-head comparisons in addition to indirect comparisons suggested that
nateglinide and alpha-glucosidase inhibitors were less efficacious in reducing HbA1c compared with other oral diabetes medications. More direct data were needed on meglitinides and alpha-glucosidase inhibitors compared to other oral diabetes medications to make firmer conclusions about these two classes of agents.
• All combination therapies were better at reducing HbA1c than monotherapy regimens by
about 1%. More direct data were needed on comparisons between combination therapies. Evidence grades (see Appendix F, Evidence Table 4)
• The evidence for the above key points was graded high for the following comparisons: thiazolidinediones versus metformin, metformin versus second generation sulfonylureas, metformin versus metformin plus second generation sulfonylureas, and second generation sulfonylureas versus metformin plus second generation sulfonylureas.
• The evidence was graded moderate for the following comparisons: thiazolidinediones
versus second generation sulfonylureas, second generation sulfonylureas versus repaglinide, pioglitazone versus rosiglitazone, metformin versus metformin plus thiazolidinediones, and second generation sulfonylurea versus second generation sulfonylurea plus thiazolidinediones.
• The evidence was graded low for the following comparisons: thiazolidinediones versus
alpha-glucosidase inhibitors, metformin versus alpha-glucosidase inhibitors, and second generation sulfonylureas versus alpha-glucosidase inhibitors.
• The evidence was graded insufficient for the following comparisons due to the limited
number of direct comparisons: nateglinide compared with other oral diabetes medications.
Results from direct comparisons between drugs (see Appendix F, Evidence Table 5)
Thiazolidinedione versus thiazolidinedione. Two RCTs compared pioglitazone with rosiglitazone at comparable doses and showed no clinically relevant between-group differences in HbA1c (range of -0.1% to 0.1%).51, 52 One study continued prior diabetes treatment in both groups.52 A third double-blind one year RCT comparing pioglitazone plus glimepiride versus rosiglitazone plus glimepiride showed no difference between groups (0.1%) confirming the monotherapy trials’ results.53
39
Thiazolidinedione versus metformin. There were no between-group differences in the seven RCTs directly comparing a thiazolidinedione with metformin, with a pooled mean difference in HbA1c between groups of -0.04% (95% CI -0.23% to 0.15%) (see Figure 4).54-60 No single study markedly influenced the results. Metaregression suggested that dose differences may explain some of the heterogeneity (p<0.06). Three studies had higher doses in the thiazolidinedione arms compared with the metformin arms.54, 55, 57 Removal of these three studies gave similar results, with a pooled mean difference of 0.06% (95% CI -0.14% to 0.25%).
Thiazolidinedione versus second generation sulfonylureas. Both thiazolidinediones
(pioglitazone and rosiglitazone) and second generation sulfonylureas (gliclazide, glibenclamide, glimepiride, and glyburide) had similar effects on HbA1c, with a pooled mean difference of -0.05% (95% CI -0.13% to 0.02%) (see Figure 5).54, 55, 57, 61-70 Two trials allowed these medications to be added to existing oral diabetes medications.68, 70 We excluded one study that favored pioglitazone over glimepiride with an adjusted 95% CI of 0.23% to 0.66%, since it was a one-year extension trial including 98 out of the 208 original centers in the study by Charbonnel et al., which showed no differences between groups at one year.63 Removing the study by Charbonnel et al., markedly influenced the results in favor of thiazolidinediones (95% CI -0.21 to -0.01%);63 however, this was one of the largest and highest quality trials in this comparison. Limiting our analysis to the three double-blind RCTs gave results similar to the main meta-analysis.57, 63, 69 Metaregression did not reveal significant sources of heterogeneity. When we combined the four studies with comparable dosing54, 63, 69, 70 the results were similar with a weighted mean difference of -0.06% (95% CI -0.16 to 0.05%). Glipizide was the only second generation sulfonylurea that was not evaluated in head-to-head trials with the thiazolidinediones.
Thiazolidinedione plus metformin versus second generation sulfonylureas plus metformin.
Two RCTs compared rosiglitazone plus metformin with a second generation sulfonylurea (one with glimepiride and the other with glibenclamide) plus metformin, showing no consistent effects favoring one of the combination arms.71, 72 Both double-blinded studies may have slightly underdosed the metformin plus second generation sulfonylurea arms, yet the 24-week study with glibenclamide plus metformin still favored the second generation sulfonylurea combination arm over the rosiglitazone plus metformin arm by 0.4%.71
Thiazolidinedione versus meglitinides. Two 24-week similar quality head-to-head trials
compared thiazolidinediones with repaglinide specifically, and showed no consistent effects favoring one of the medications.73, 74 These inconsistent results may be due to different thiazolidinediones, or different dosing. One study with slightly lower doses of pioglitazone (30 mg fixed dose) versus uptitration of repaglinide to a max of 12 mg/day favored repaglinide monotherapy (between-group difference of 0.5%)73 while the other study with more comparable dosing between rosiglitazone and repaglinide favored rosiglitazone with a between-group difference of 0.39%.74
Thiazolidinedione versus alpha-glucosidase inhibitors. In the systematic review by Van de
Laar et al., no trials compared a thiazolidinedione to an alpha-glucosidase inhibitor.38 Two studies have been published since their review that compare pioglitazone with acarbose or voglibose.64, 75 The study comparing pioglitazone to acarbose at comparable dosing showed a significantly and clinically greater reduction in mean HbA1c from baseline in the pioglitazone
40
group compared with the acarbose group (1.2% versus 0.5% reduction, respectively).75 No significant or clinically important difference was noted between pioglitazone and voglibose, however.64
Other thiazolidinedione comparisons. One RCT compared rosiglitazone monotherapy with
rosiglitazone plus glimepiride showing a significantly and clinically greater reduction in Hba1c by 0.9% in the combination arm compared with the monotherapy arm.76 Two RCTs compared addition of rosiglitazone or pioglitazone to existing oral diabetes medications versus upward titration of existing medications (usual care), and showed no significant differences in the change in HbA1c between groups.77, 78
Metformin versus second generation sulfonylureas. We combined 18 studies (in 21 publications) comparing metformin with a second generation sulfonylurea and showing similar changes in HbA1c in both groups, with a pooled mean difference of 0.09% (95% CI -0.1% to 0.3%) (see Figure 6).54, 55, 57, 79-94, 15, 95 Removing the one year study by DeFronzo et al., changed the results of the meta-analysis, favoring second generation sulfonylureas with a pooled mean difference of 0.17% (95% CI 0.05% to 0.28%)88; however, this comparably dosed study was one of the larger and higher quality studies in this comparison. Metaregression suggested that study duration may explain some of the heterogeneity (p=0.09). The shorter duration studies (<6 months) slightly favored second generation sulfonylureas, and the longer duration studies (6 months to 1 year) showed no differences between groups when pooled separately.
The UKPDS91-93 had the longest followup (up to 10 years) while most of the other studies had a followup of only 3 to 12 months. The UKPDS was a multi-center trial conducted in the United Kingdom comparing different types of treatment for type-2 diabetes. Patients were recruited starting in 1977, and initially put on a diet with 50% carbohydrates, high fiber, reduced calories if obese, and low saturated fat. After 3 months, subjects were randomized to treatment arms or diet based on the fasting plasma glucose. If subjects had very high serum glucose values and symptoms of hyperglycemia prior to the 3-month main randomization, they were randomized to treatment early without a diet arm (the primary diet failure group). Both groups (the main randomization and the primary diet failure groups) were randomized to medications stratified by weight. If subjects were overweight based on ideal body weight, they could be randomized to insulin, chlorpropamide, glibenclamide, metformin, or diet. If they were not overweight, they could be randomized to insulin, diet, chlorpropamide, or glibenclamide. No metformin arm was available if the patient was not overweight. Metformin, glibenclamide, and insulin could be added to any of the groups if a participant was still hyperglycemic based on study protocols. Losses to followup were less than or equal to 5% in both the primary diet failure and main randomization groups.
The 1-year, 3-year, 6-year, and 10-year data all showed similar changes in HbA1c between groups.15, 91-93 After 10 years, the change in median Hba1c from baseline was similar in both the metformin and glibenclamide arms for the main randomization group as reported in a figure (1.3% versus 1.0%).15 The median HbA1c results were not broken down by medication type in the primary diet failure group at 10 years. After 6 years, the reported 95% CI for the mean final HbA1c was 7.1% to 9.4% for metformin and 6.8% to 9.7% for glibenclamide/chlorpropamide in overweight patients in the primary diet failure group.93 Of note, the main randomization group of UKPDS demonstrated that HbA1c was reduced within the first few years of the study for patients on either glibenclamide or metformin then began to rise again for all medications.15
41
Metformin versus meglitinides. Two RCTs lasting 6 months to 1 year compared metformin with meglitinides, showing similar effects on HbA1c.96, 97 However, the higher quality study favored the slightly underdosed metformin arm compared with the nateglinide arm (0.3% between-group difference).96 The other study evaluating metformin and repaglinide at comparable doses showed a non-meaningful between-group difference of 0.1%.97
Metformin versus alpha-glucosidase inhibitors. Metformin reduced HbA1c more than
miglitol, yet showed no consistent difference from acarbose. In one study from the systematic review by Van de Laar et al.,38 and in one study since their review98 metformin showed greater reductions in HbA1c compared with miglitol at comparable doses (range in between-group differences, 0.6% to 0.9%). However, one study from the Van de Laar systematic review and one study published since that review compared submaximal doses of metformin with maximal doses of acarbose, and showed no meaningful or consistent effects on HbA1c (between-group differences ranging from -0.2% to 0.25%).21, 99
Metformin versus metformin plus thiazolidinediones. Four studies compared metformin with
metformin plus a thiazolidinedione (all rosiglitazone),100-103 showing a greater improvement in HbA1c with the combination, with a pooled mean difference of 0.62% (95% CI 0.23% to 1%) (see Figure 7). No single study markedly affected the results. We did not stratify or conduct meta-regression using baseline HbA1c due to the small number of studies, and concerns about ecologic fallacy. However, both studies with smaller between-group differences had a mean baseline HbA1c of less than 8%100, 101 while the two studies with larger between-group differences had a mean baseline HbA1c of greater than 8% which may explain much of the heterogeneity. Metaregression did not detect significant sources of heterogeneity. One of the two studies102 with greater than one combination arm showed dose-response gradients favoring higher dose combination over lower dose combination by 0.5%.103
Metformin versus metformin plus second generation sulfonylureas. Eleven RCTs (10 double-
blinded) compared metformin with metformin plus a second generation sulfonylurea with all of the studies favoring the combination arm over monotherapy, with a pooled mean difference of 1.0% (95% CI 0.76% to 1.34%) (see Figure 8).79-82, 84, 87-89, 94, 95, 104 No single study markedly influenced the results. Metaregression showed that dose contributed to the heterogeneity (p=0.003). Lower dose combinations had smaller between-group differences. The study by Blonde et al., showed the greatest between-group differences since this study used a high dose combination and started with the highest baseline HbA1c compared with other studies.81 Three of the five dose-response studies showed a dose-response gradient favoring greater reductions in HbA1c with a higher dose combination than with a lower dose combination.81, 84, 87 One crossover study initially showed a difference between groups at the first crossover and then a negative rebound effect when changing the combination to monotherapy.95
Other metformin comparisons. One study compared metformin immediate release to two
different doses of metformin extended release (XR)105 and the different regimens had similar effects on HbA1c up to 24 weeks.
Second generation sulfonylureas versus second generation sulfonylureas. Nine RCTs (1 with
3 arms) compared one second generation sulfonylurea with another second generation
42
sulfonylurea, showing no differences between them.106-114 All of the trials had one arm comprised of glyburide or its chemical equivalent, glibenclamide, except one.106 Only two studies showed clinically meaningful differences between medications.113, 114 One study showed that the modified release form of gliclazide was better in reducing mean HbA1c over 16 weeks compared with glibenclamide.114, 115 The difference in glycemic control may have been due to the reported greater adherence to the once daily gliclazide than the twice a day glibenclamide.114 The other study compared 3 different second generation sulfonylureas (glipizide, glibenclamide, and gliclazide) evaluating HbA1 (an old measurement of glycated hemoglobin) in a small sample of participants (about 20 in each group) in an unblinded study over one year. It had a significant post-treatment difference in Hba1c, favoring gliclazide by 4.3% and glibenclamide by 3.4% over glipizide.113 Due to a hypothesis that glyburide may have stronger effects on HbA1c than other second generation sulfonylureas, we combined the studies comparing glyburide or glibenclamide (chemical equivalent to glyburide) to other second generation sulfonylureas, showing no differences between groups with a pooled mean difference of -0.03% (95% CI -0.13% to 0.07%) (see Figure 9). We excluded one of the studies by Harrower et al., from this meta-analysis due to its clinical diversity and low quality as described above; however, adding this trial did not change the conclusions of no difference between groups.113 No single study strongly influenced the results. Metaregression did not find any significant source of heterogeneity.
Second generation sulfonylurea versus meglitinides. Six RCTs compared a second generation
sulfonylurea with repaglinide, showing a pooled mean difference of 0.06% (95% CI -0.18% to 0.30%) (see Figure 10).116-121 No single study markedly influenced these results. Metaregression did not reveal any significant source of heterogeneity. One 12-week double-blind RCT compared submaximally dosed glibenclamide with maximally dosed nateglinide, favoring glibenclamide nonsignificantly over nateglinide by 0.5%.122 We did not include this study in the meta-analysis due to potential differences in glycemic control between nateglinide and repaglinide. There were no differences in results when only evaluating the studies using comparable doses.116, 118, 120
Second generation sulfonylurea versus second generation sulfonylureas plus
thiazolidinediones. All four studies comparing second generation sulfonylurea with a second generation sulfonylurea plus a thiazolidinedione (all rosiglitazone)123-126 reported greater improvement in mean HbA1c in the combination arm compared with the monotherapy arm, with a pooled mean difference of 1.0% (95% CI 0.69 to 1.3%) (see Figure 11). No single study markedly influenced the results. Metaregression did not identify any significant source of heterogeneity.
Second generation sulfonylurea versus second generation sulfonylureas plus metformin. We
combined the 11 shorter duration RCTs that compared a second generation sulfonylurea with a second generation sulfonylurea plus metformin, showing a pooled mean difference favoring the combination arm of 1.0% (95% CI 0.67% to 1.34%) (see Figure 12).79-82, 84, 87-89, 94, 95, 127 No single study markedly influenced the results. Metaregression did not detect a significant source of heterogeneity. If we only pool the 4 highest quality RCTs (quality score>=4), the pooled estimate remains similar at 0.75% (95% CI 0.24% to 1.3%).79, 80, 87, 95 We excluded UKPDS from the meta-analysis due to its 3-year duration.128 UKPDS randomized subjects receiving second generation sulfonylureas in either the main randomization group or primary diet failure group to receive metformin early (when fasting plasma glucose was >6 mmol/l and <15 mmol/l) versus
43
continuation of second generation sulfonylurea (with later addition of metformin and then insulin if patients became markedly hyperglycemic). After 3 years, they found that the median increase in HbA1c was lower in the early addition of metformin arm compared with the second generation sulfonylurea arm (0.13% versus 0.5% respectively, p=0.03).128 While the shorter duration studies (< 1 year) were consistent with these results in favoring the combination arm, they showed reductions as opposed to increases in HbA1c. We excluded a study by Gregorio et al., from the meta-analysis since they compared uptitration of existing second generation sulfonylurea with uptitration of metformin added to an existing second generation sulfonylurea as opposed to the other studies where both combinations and monotherapy were started at the same time or an existing second generation sulfonylurea was continued without uptitration of dosing in the second generation sulfonylurea arms. The study by Gregorio et al., showed a non-meaningful between-group difference of 0.05% more similar to the metformin versus second generation sulfonylurea monotherapy trials.129 Lastly, a dose-response gradient was seen in 3 of the 5 dosing studies with higher reductions in HbA1c in the higher dose combination arms.81, 84,
87 Second generation sulfonylurea versus alpha-glucosidase inhibitors. In the systematic review
on alpha-glucosidase inhibitors38 the comparison of acarbose with first and second generation sulfonylureas yielded a non-significant weighted mean difference between groups of 0.4% (95% CI -0.0% to 0.8%). They then removed the 4 studies comparing acarbose to glibenclamide at higher doses (3 or 5 mg three times a day) due to heterogeneity between these studies and the others. This left an effect size of 0.6% (95% CI 0.3% to 1.0%) favoring second generation sulfonylureas.38 However, removing the studies with higher doses of second generation sulfonylureas left the meta-analysis biased to the results of the tolbutamide studies (first generation second generation sulfonylureas) which showed significant improvements compared to acarbose in HbA1c outcomes. When one compares only the second generation sulfonylureas to acarbose, the differences in mean HbA1c may favor acarbose slightly; however, the dosing for the second generation sulfonylureas were almost always submaximal. In the review by Van de Laar et al.,38 only one study compared miglitol at maximum dose to glibenclamide at submaximal dose, and non-significantly favored glibenclamide. Additionally, one study compared voglibose to a lower dose of glyburide and reported that voglibose had a better effect on HbA1c, but it was not statistically significant. We found 2 additional studies in our review comparing acarbose or voglibose with second generation sulfonylureas.64, 130 The 26-week study comparing equivalent dosing of glimepiride to acarbose showed a significant improvement in mean HbA1c favoring glimepiride by 0.7%.130 The 3-month study compared voglibose at equivalent doses to glibenclamide, and showed a calculated non-meaningful difference in mean final HbA1c of 0.1%.64
Nateglinide versus repaglinide. Only one unblinded 16-week RCT compared nateglinide
with repaglinide and showed greater improvement in HbA1c for repaglinide by 0.3%.131
44
Results from placebo-controlled trials and indirect comparisons (see Appendix F, Evidence Table 5 and Appendix G, Figure 1)
The placebo-controlled trials supported conclusions drawn in the direct comparisons that
monotherapy with most of the diabetes medications similarly reduce HbA1c, except for nateglinide and alpha-glucosidase inhibitors (see Table 4).
We made indirect comparisons where there were few direct comparisons: nateglinide, repaglinide, acarbose, and miglitol versus other oral diabetes medications. These results supported that nateglinide had less reduction in HbA1c than all other oral diabetes medications except alpha-glucosidase inhibitors (see Table 5). Additionally, it supported that repaglinide had similar reductions in HbA1c compared with all other oral diabetes medications except alpha-glucosidase inhibitors, where repaglinide had slightly better reductions in HbA1c (see Table 6). Acarbose had less reduction in HbA1c compared with rosiglitazone, metformin, and second generation sulfonylureas, and a non-significant suggestion of less reduction in HbA1c compared with repaglinide and pioglitazone (see Table 7). Lastly, miglitol had less reduction in HbA1c than all other oral diabetes medications except pioglitazone and acarbose; however, there was a non-significant suggestion of less reduction in HbA1c with miglitol than pioglitazone (see Table 8).
One RCT compared placebo with different doses of metformin plus glyburide, and showed a significantly greater improvement in the combination arms than in the placebo arm (range -1.48% to -1.54%).79 This supports the direct comparison results which showed that combination therapy improves glycemic control better than monotherapy, since the monotherapy pooled differences versus placebo are generally closer to 1%. Two-Hour Postprandial Glucose Key points
• Using head-to-head and placebo-controlled trials, oral diabetes medications as monotherapy all decreased 2 hour PPG similarly.
• Combination therapy with metformin and a second generation sulfonylurea lowered PPG
more than monotherapy with either medication.
• Acarbose and second generation sulfonylureas showed no evidence of a difference in their effects on PPG; an insufficient number of studies compared alpha-glucosidase inhibitors to other oral diabetes medications.
Evidence grades (see Appendix F, Evidence Table 4)
• The evidence for the key points on PPG was graded the same as for HbA1c since both measure glycemic control and had similar results.
• However, the following comparisons were graded as having insufficient evidence due to
lack of direct comparisons (<3 trials): thiazolidinediones versus metformin, thiazolidinediones versus second generation sulfonylureas, alpha-glucosidase inhibitors
45
versus all other diabetes medications except second generation sulfonylureas, and meglitinides versus all other oral diabetes medications.
Direct comparison results (see Appendix F, Evidence Table 6)
Thiazolidinedione versus other diabetes medications. We found only one study for each of the following comparisons of effects on PPG: thiazolidinedione versus second generation sulfonylurea (between-group difference of 19.8 mg/dL);55 thiazolidinedione versus metformin (between-group difference of -18 mg/dL);55 rosiglitazone plus a second generation sulfonylurea versus pioglitazone plus a second generation sulfonylurea (between-group difference of 5.9 mg/dL);53 and a thiazolidinedione plus metformin versus a second generation sulfonylurea plus metformin(between-group difference of -6 mg/dL).72 None of these studies reported on the significance of between-group differences.
Metformin versus second generation sulfonylureas. In the seven trials comparing second
generation sulfonylureas with metformin, no differences were seen between groups (range in between-group differences of -7.4 to 37.8 mg/dL).55, 79-81, 86, 89, 90 While five of the 7 trials that compared metformin with a second generation sulfonylurea found similar between-group differences in PPG (<10 mg/dL), two trials showed a clinically relevant difference favoring second generation sulfonylureas (>20 mg/dL).55, 132
Metformin versus metformin plus second generation sulfonylureas. All 6 sub-arm
comparisons (in 4 articles) of metformin versus metformin plus a second generation sulfonylurea reported a greater reduction in PPG in the combination arm compared with metformin monotherapy (range in between-group differences of 12.5 to 75.6 mg/dL), 79-81, 89 The between-group differences were reported as significant and had clinically relevant differences (>20 mg/dL) in two of the trials.79, 80
Second generation sulfonylurea versus metformin plus second generation sulfonylureas.
Similarly, in all 7 sub-arm comparisons (in 5 articles) of a second generation sulfonylurea with a second generation sulfonylurea plus metformin reported a greater reduction in PPG with the combination (range in between-group differences of 15 to 63 mg/dL),79-81, 89, 127 and the between-group differences were statistically significant in 4 trials.80, 81, 89, 127
Second generation sulfonylurea versus second generation sulfonylureas. The following
comparisons of second generation sulfonylureas with one another showed little between-drug differences in PPG: glyburide versus glyburide using different formulations (between-group difference of 11.4 mg/dL, p-value not reported)108; glyburide versus glimepiride (between-group difference of -2 mg/dL, p-value not reported)107; and glibenclamide versus gliclazide (between-group difference of 12.5 mg/dL, p-value>0.05).133
Repaglinide versus other diabetes medications. In all comparisons of repaglinide with
metformin (1 trial, between-group difference of -7 mg/dL, p < 0.05)97 or with a second generation sulfonylurea (3 trials, range in between-group differences of -27 to -18 mg/dL; p < .05118; p>0.05121; p-value not reported120), repaglinide caused a greater reduction in PPG than the other medications.
46
Alpha-glucosidase inhibitors versus other diabetes medications. A Cochrane review identified one study comparing acarbose to metformin with a between-group difference of 8 mg/dL in PPG (p < .05) favoring acarbose.38 The meta-analyses in this review found no significant between-group differences in PPG for the following comparisons: acarbose versus second generation sulfonylureas (8 trials, weighted mean difference between groups -1.8 mg/dL and 95% CI -7.7 to 4.0 mg/dL); miglitol versus second generation sulfonylurea (1 trial); miglitol versus metformin (1 trial); and miglitol versus voglibose (1 trial).38 We did not identify any other direct comparisons of the effects of alpha-glucosidase inhibitors on PPG. Placebo-controlled trials (see Appendix F, Evidence Table 6)
The results of placebo-controlled trials were consistent with those of the head-to-head comparisons. A modest number of studies compared drugs to placebo and all showed that treatment reduced PPG more than placebo. The range of mean differences from placebo were as follows: metformin (-47 mg/dL),79 second generation sulfonylureas (-110 to -29 mg/dL),79, 134-137 metformin plus second generation sulfonylureas (-67 to -65 mg/dL),79 acarbose (-15 mg/dL),138 and repaglinide (-104 mg/dL).139 Additionally, the Cochrane review38 found 22 studies that favored acarbose over placebo (pooled estimate of -41.8 mg/dL and 95% CI -49.1 to -34.6 mg/dL), and 2 studies showing no evidence of a significant difference between miglitol and placebo (pooled estimate -48.6 mg/dL and 95% CI -99.7 to 2.5 mg/dL). Two studies reported that pioglitazone reduced PPG significantly compared to placebo140, 141 one of which showed a between-group percentage change difference of -12.8%.140 Weight/BMI Key points
• Metformin consistently caused weight loss when compared directly with thiazolidinediones, second generation sulfonylureas, and metformin/second generation sulfonylurea combinations, which generally increased body weight.
• Thiazolidinediones and second generation sulfonylureas caused similar weight gain when
used in monotherapy or in combination with other oral diabetes medications.
• Thiazolidinediones caused weight gain when compared with acarbose and repaglinide based on indirect comparisons of placebo-controlled trials as well as a few direct comparisons.
• Acarbose compared with second generation sulfonylureas showed no significant
differences in weight in the direct comparisons, but there was a suggestion of differences between groups in the direct comparsions. The indirect comparisons of placebo-controlled trials showed that second generation sulfonylureas were associated with weight gain when compared with acarbose which was weight neutral.
• Using a few head-to-head comparisons and indirect comparisons, acarbose had similar
weight effects when compared with metformin.
47
• Repaglinide had similar effects on weight when compared with second generation sulfonylureas. There were few comparisons with other oral diabetes medications.
• No between-group differences exceeded 5 kg.
Evidence grades (see Appendix F, Evidence Table 4)
• The evidence for the above key points was graded high for the following comparisons: metformin versus second generation sulfonylureas, and metformin versus metformin plus second generation sulfonylureas.
• The evidence was graded moderate for the following comparisons: thiazolidinediones
versus metformin, and second generation sulfonylureas versus repaglinide, and second generation sulfonylureas versus metformin plus second generation sulfonylureas.
• The evidence was graded low for the following comparisons: thiazolidinediones versus
second generation sulfonylureas, second generation sulfonylureas versus alpha-glucosidase inhibitors, metformin versus alpha-glucosidase inhibitors, thiazolidinediones versus alpha-glucosidase inhibitors, and metformin versus metformin plus thiazolidinediones.
• The evidence was graded very low for the following comparisons: piogitazone versus
rosiglitazone, and second generation sulfonylureas versus second generation sulfonylureas plus thiazolidinediones.
• The evidence was graded insufficient for the following comparisons due to the limited
number of direct comparisons: nateglinide and repaglinide compared with other oral diabetes medications, except for repaglinide compared with second generation sulfonylureas. Also, insufficient evidence exists comparing different combinations.
Direct comparison results (see Appendix F, Evidence Tables 7 and 8)
Thiazolidinedione versus thiazolidinedione (weight). Two studies compared the thiazolidinedione pioglitazone with rosiglitazone;51, 52 and none reported a significant between-group difference (range in between-group differences of -0.4 to 0 kg). Both studies showed an increase in weight from baseline, ranging from 1.6 to 2 kg for both thiazolidinediones.52, 142
Thiazolidinedione versus thiazolidinedione (BMI). One study comparing
glimepiride/pioglitazone versus glimepiride/rosiglitazone showed significant increases in mean BMI for both arms (1.2 to 1.5 kg/m2), but no significant differences between groups (0.3 kg/m2).53
Thiazolidinedione versus metformin (weight). Six studies in 7 papers compared weight
between thiazolidinediones and metformin, favoring metformin with a pooled between-group difference of 1.9 kg (95% CI 0.5 to 3.3 kg) (see Figure 13).55, 56, 58-60, 143, 144 All the metformin arms had small decreases in weight while the thiazolidinedione arms had mild increases in
48
weight except for one study.55 A sensitivity analysis showed that removing either of two studies would markedly change the conclusions to no difference between groups with 95% CIs that cross zero and have an upper limit up to -0.1 kg.59, 60 However, these were both double-blind studies with comparable dosing between medications, so we would not want to remove them from the main analysis.59, 60 The tests for heterogeneity were significant, and we were unable to find a source of the heterogeneity using metaregression.
Thiazolidinedione versus metformin (BMI). Four studies comparing thiazolidinediones to
metformin generally favored metformin, with a range in between-group differences of -0.2 to 2.1 kg/m2.54, 55, 57, 143 Of these, the study with the longest followup (1 year) found no significant mean change in BMI from baseline for each medication. This article did not report on the significance of the between-group difference; however, there is a calculated 1.6 kg/m2 difference in mean BMI favoring metformin compared to pioglitazone.57 Only 1 of the 3 studies with shorter followup found a statistically significant decrease in BMI from baseline to followup in the metformin group while there were no statistically significant differences between baseline and followup in the thiazolidinedione group.54 The one study that favored pioglitazone over metformin (mean difference from baseline, -0.4 kg/m2 vs -0.2 kg/m2), was conducted in India and did not allow for higher doses of metformin.55
Thiazolidinedione versus second generation sulfonylureas (weight). Five studies reported
direct comparisons of a thiazolidinedione with a second generation sulfonylurea, with no apparent differences between groups.55, 61, 63, 65, 67 We were able to combine 3 studies in a meta-analysis, showing a pooled between-group difference of 1.1 kg (95% CI -0.9 to 3.1 kg) (see Figure 14).55, 65, 67 We did not include the study by Tan et al., since this was a one-year extension of the Charbonnel et al., study, yet only had 98 out of 208 of the original centers.61 The between-group difference for this study was minimal and consistent with the above results (-0.3 kg). The parent study by Charbonnel et al., was also excluded since it did not report any measures of dispersion nor could one be calculated.63 The between-group difference for this study was 0.9 kg.63 Removing the study by Ramachandran et al.,55 markedly changed the results in favor of second generation sulfonylureas with a pooled between-group difference of 1.6 kg (95% CI 0.3 to 3.0 kg); however, this would then limit the analysis to 2 studies. Heterogeneity tests were not significant, and no sources of heterogeneity were revealed in metaregression.
Thiazolidinedione versus second generation sulfonylureas (BMI). Five studies (represented
by 7 articles) compared a thiazolidinedione to a second generation sulfonylurea showing no relevant between-group differences (range of -1.1 to 1.4 kg/m2).54, 55, 57, 62, 68, 145, 146 One of these allowed the continuation of pre-existing oral diabetes medications.145 One study reported no significant differences between-groups62 one study reported a significant difference between-groups favoring second generation sulfonylurea68 and the rest of the studies did not report on between-group differences.55, 57, 146 One of these 3 studies reported a significant mean increase in BMI from baseline in both groups of 1.5 kg/m2 and 1.9 kg/m2 respectively,54 while the other two reported either no significant differences from baseline in either group57 or did not report on the significance of the mean difference from baseline55 making it difficult to draw firm conclusions.
Thiazolidinedione plus metformin versus second generation sulfonylureas plus metformin
(weight). Two double-blind short duration RCTs compared a thiazolidinedione plus metformin
49
versus a second generation sulfonylurea plus metformin, and favored the combination of thiazolidinedione plus metformin (range in between-group differences of -1.5 to -1.4 kg).71, 72
Thiazolidinedione plus metformin versus second generation sulfonylureas plus metformin
(BMI). One of these RCTs showed no significant difference in BMI between metformin/glimepiride and metformin/rosiglitazone (-0.5 kg/m2).72 However, this study with metformin in both treatment arms showed a significant mean decrease in BMI from baseline in both arms.72
Thiazolidinedione versus meglitinides (weight). Two non-blinded 24-week RCTs compared a
thiazolidinedione with repaglinide,73, 74 and both reported greater weight gain in the thiazolidinedione groups (range in between-group differences of 0.7 to 1.7 kg, p-values not reported). No studies evaluated BMI.
Other thiazolidinedione comparisons (weight). One study was identified for each of the
following comparisons: thiazolidinedione versus acarbose (between-group difference of 3.3 kg, p<0.05)75; and thiazolidinedione versus thiazolidinedione plus a second generation sulfonylurea (between-group difference of -2.7 kg, p>0.05).76 No studies evaluated BMI.
Metformin versus second generation sulfonylureas (weight). We identified 17 direct
comparisons (in 16 reports) of metformin with a second generation sulfonylurea, favoring metformin with regard to body weight.55, 79-89, 92-94 We stratified the meta-analyses on study duration, since this was a significant source of heterogeneity when we pooled all the studies. In the four RCTs with study duration greater than or equal to 24 weeks, the studies favored metformin with a pooled between-group difference of -3.5 kg (95% CI -4.0 to -3.0 kg) (see Figure 15).83, 87, 88, 94 Heterogeneity tests were not significant, and metaregression did not identify any additional source of heterogeneity. No single study markedly influenced the results. Eight RCTs with study duration less than 24 weeks were combined and favored metformin less strongly, with a pooled between-group difference of -1.9 kg (95% CI -2.4 to -1.4 kg) (see Figure 16).55, 79, 80, 82, 84-86, 89 Heterogeneity tests were not significant, and no additional source of heterogeneity was found in metaregression. No single study markedly influenced these results. An additional study by Blonde et al., showed that subjects taking metformin decreased weight by 2 kg, and the subjects on second generation sulfonylurea had a weight gain of less than 1 kg.81 We were unable to calculate a point estimate so did not include this study in the meta-analysis.
Furthermore, the UKPDS reported weight changes in 3 articles that were consistent with these results favoring metformin.15, 92, 93 We report this separately since the study duration was greater than 3 years compared with the other studies which had study durations of less than or equal to one year. In the 3-year followup of UKPDS in the obese subjects from the primary diet failure and main randomization groups combined, the between-group difference was -2 kg.92 In the 6-year followup in the primary diet failure group only, the between-group difference was -5 kg comparing obese subjects taking metformin with obese and non-obese subjects taking glibenclamide.93 In the 10-year followup comparing obese subjects on metformin with obese and non-obese subjects on glibenclamide, the between-group difference still favored metformin at -2 kg.15 None of these papers reported the statistical significance of these differences except as it relates to diet or insulin. Of note, most of the weight gain in the glibenclamide group
50
occurred in the first two years, while metformin maintained weight in the first two years and then had some weight gain after that.15
Metformin versus second generation sulfonylureas (BMI). Similarly, seven studies reported
BMI changes in direct comparisons of metformin with second generation sulfonylureas, most favoring metformin with a range in between-group differences of -2.5 to 0.1 kg/m2.54, 55, 57, 89, 90,
94, 95 The mean changes from baseline BMI ranged from -0.7 to -0.1 kg/m2 in the metformin groups and -0.7 to 1.9 kg/m2 in the second generation sulfonylurea groups. Three of the seven studies found a significant between-group difference favoring the metformin group.89, 94, 95 One small study found a mean difference between groups of -0.5 kg/m2 favoring metformin (p > .05),57 while the other three studies did not report on between-group differences.54, 55, 90 One of these three showed no clinically relevant differences between groups (0.1 kg/m2),90 one study favored metformin but has questionable clinical relevance (between-group difference of -0.9 kg/m2),55 while one reported a significant decrease from baseline in the metformin group and a significant rise in BMI from baseline in the second generation sulfonylurea group.54
Metformin versus meglitinides (weight/BMI). One study compared metformin with
repaglinide and found a non-significant -1.6 kg between-group difference in favor of metformin.97 This same study reported no significant differences in BMI as well.97
Metformin versus alpha-glucosidase inhibitors (weight). The meta-analyses by Van de Laar
et al.,38 included 1 study comparing acarbose with metformin with respect to body weight and found no statistically significant between-group difference (pooled estimate of -0.3 kg and 95% CI -5.5 to 4.9 kg). Van de Laar et al.,38 also found no significant between-group weight differences for miglitol versus metformin (weighted mean difference of 0.4 kg and 95% CI -0.5 to 1.2 kg). We identified one additional study comparing acarbose with metformin reporting no significant between-group differences (1.3 kg) in mean body weight.99 No studies evaluated BMI.
Metformin versus metformin plus thiazolidinediones (weight). Two studies compared a
thiazolidinedione plus metformin with metformin alone.101, 103 In both, combination therapy caused a mean weight gain (ranging from 0.7 to 1.9 kg) while metformin alone caused weight loss (ranging from -1.4 to -0.9 kg); in one study, the between-group difference was reported as significant.103 No studies evaluated BMI.
Metformin versus metformin plus second generation sulfonylureas (weight). Ten RCTs
comparing metformin with metformin plus a second generation sulfonylurea favored metformin monotherapy, with a pooled estimate of -2.4 kg (95% CI -3.6 to -1.1 kg) (see Figure 17). 79-82, 84,
87-89, 94, 104 No single study markedly influenced the results. Metaregression did not identify any significant sources of heterogeneity. Studies with lower baseline weight had smaller between-group differences than studies with higher baseline weight; however, we were limited in assessing heterogeneity based on this individual characteristic since studies did not stratify their results based on baseline weight.
Metformin versus metformin plus second generation sulfonylureas (BMI). Similar to weight,
four studies compared metformin alone to metformin plus a second generation sulfonylurea,
51
favoring metformin monotherapy (range in between-group differences of -0.9 to -0.3 kg/m2).89, 94,
95, 104 One of these allowed the continuation of previous study medications.104 In three studies, the between-group differences were reported as significant.89, 95, 104
Second generation sulfonylureas versus second generation sulfonylureas (weight). Six direct
comparisons (in four articles) of individual second generation sulfonylureas to one another found no significant mean differences in weight between groups (range in between-group differences of -1.17 to 1.85 kg).106, 111, 113, 147 No studies evaluated BMI.
Second generation sulfonylureas versus meglitinides (weight). Five RCTs comparing second
generation sulfonylureas with repaglinide showed no differences between groups, with a pooled between-group difference of 0.03 kg (95% CI -0.96 to 1.01 kg) (see Figure 18).116-118, 120, 121 No single study markedly influenced the results. Heterogeneity tests were not significant, and metaregression did not identify any additional source of heterogeneity. The three studies with comparable dosing showed similar results.116, 118, 120
Second generation sulfonylurea versus meglitinides (BMI). One of these studies also reported
a non-significant between-group difference between glimepiride and repaglinide of -0.6 kg/m2.118 Second generation sulfonylurea versus second generation sulfonylureas plus
thiazolidinediones (weight). Two RCTs compared second generation sulfonylurea monotherapy with second generation sulfonylurea plus rosiglitazone, showing a range in between-group differences of -5.5 to -3.4 kg favoring second generation sulfonylurea monotherapy.124, 126 One study reported this difference as significant126 and the other study did not report on statistical significance.124 However, both appear to be clinically relevant differences.
Second generation sulfonylurea versus second generation sulfonylureas plus
thiazolidinediones (BMI). One additional study with 2 combination arms compared BMI changes between glimepiride with glimepiride/rosiglitazone showing no clinically relevant (<1 kg/m2) differences between groups (-0.4 to -0.2 kg/m2).123
Second generation sulfonylurea versus metformin plus second generation sulfonylureas
(weight). Ten RCTs comparing second generation sulfonylurea with metformin plus second generation sulfonylurea showed no significant differences between groups, with a pooled between-group difference of 0.05 kg (95% CI -0.5 to 0.6 kg) (see Figure 19).79, 80, 82, 84, 87-89, 94, 127,
129 No single study markedly influenced the results. Heterogeneity tests were not significant, and metaregression did not reveal any source of heterogeneity. Two studies were excluded from the meta-analysis.81, 128 The study by Blonde et al., reported that the second generation sulfonylurea and metformin plus second generation sulfonylurea groups both had increased weight over the course of the study of less than 1 kg, yet we were unable to calculate a point estimate.81 These results are consistent with the results of the meta-analysis. UKPDS had an article reporting 3-year followup data comparing subjects on glibenclamide or chlorpropamide versus early addition of metformin to a second generation sulfonylurea, showing a between-group difference of 0.3 kg which was not statistically significant.128 We reported this separately due to differences in study duration compared with the shorter duration studies; however, the results are consistent with the pooled analysis.
52
Second generation sulfonylurea versus metformin plus second generation sulfonylureas (BMI). Similarly, three studies compared a second generation sulfonylurea to a metformin/second generation sulfonylurea combination with regard to BMI change, showing no between-group differences (range in between-group differences of 0.04 to 0.9 kg/m2).89, 94, 95 None of these studies reported a statistically significant or clinically relevant (>1 kg/m2) between-group difference, although one study found that both arms had statistically significant increases in BMI.94
Second generation sulfonylurea versus alpha-glucosidase inhibitor (weight). In the Van de
Laar review38 five studies compared acarbose with a second generation sulfonylurea and showed no differences between groups, with a pooled estimate of -1.90 kg (95% CI, -4.01 to 0.21). Van de Laar et al.,38 also found no significant between-group weight differences for miglitol versus second generation sulfonylurea (weighted mean difference of 0.5 kg and 95% CI -0.5 to 1.4 kg), or voglibose versus a second generation sulfonylurea (pooled estimate of 0.6 kg and 95% CI of -9.7 to 10.9 kg). We identified one additional study comparing acarbose with glimepiride and found decreased body weight in both arms that was significant in the acarbose arm only.130
Second generation sulfonylurea versus alpha-glucosidase inhibitor (BMI). The review by
Van de Laar et al.,38 reported acarbose was favored non-significantly in comparisons with second generation sulfonylureas (4 studies, pooled between-group difference of -0.4 kg/m2 and 95% CI of -0.8 to 0.05 kg/m2). In one comparison of voglibose and second generation sulfonylureas, no between-group differences were noted (1 study, weighted mean difference of 0.0 kg/m2 and 95% CI of -2.4 to 2.4 kg/m2).38
Repaglinide versus nateglinide (weight). The one study comparing meglitinides to one
another with respect to body weight found a significantly greater increase in weight with repaglinide (1.8 kg) than with nateglinide (0.7 kg).131 No studies evaluated BMI.
Meglitinides versus alpha-glucosidase inhibitors (weight). The one study in the review by
Van de Laar et al.,38 comparing acarbose with a meglitinide reported a significant -0.7 kg mean body weight difference favoring acarbose. No studies evaluated BMI. Placebo-controlled trial results (see Appendix F, Evidence Table 8 and 10 and Appendix G, Figure 2)
Weight. The placebo-controlled trials were generally consistent with the head-to-head trials (see Table 9). Thiazolidinediones and second generation sulfonylureas were associated with weight gain compared with placebo/diet while metformin, acarbose, and meglitinides were weight neutral compared with placebo/diet. Metformin was weight neutral in the placebo-controlled trials suggesting that the weight loss associated with metformin was only significant in comparison with oral diabetes medications that had contrasting effects on weight. Many of the placebo groups were on a diet so there may have been less significant effects on weight by metformin when compared to diet.
We conducted indirect comparisons for acarbose versus the other oral diabetes medications since there were few direct comparisons for this medication, and sufficient placebo-controlled trials to conduct comparisons. Acarbose was associated with lower weight when compared with rosiglitazone, pioglitazone, and second generation sulfonylureas, yet had similar effects on
53
weight when compared with metformin (see Table 10). We were unable to do this with meglitinides due to the small number of placebo-controlled trials.
Additionally, two comparisons (1 study) of metformin plus a second generation sulfonylurea versus placebo showed a significantly greater weight gain in the combination therapy arm (range in between-group differences of 2.1 to 2.6 kg).79 This is consistent with direct comparisons which showed combination therapy with metformin plus second generation sulfonylurea had increased weight gain when compared with metformin monotherapy.
BMI. Similarly, the results of the placebo-controlled trials suggested that differences in BMI
between medications were likely seen when there were slight but opposing effects on BMI such as with metformin and thiazolidinediones. BMI results were reported for the following comparisons: metformin versus placebo/diet (4 studies, range in between-group differences -0.8 to 0 kg/m2),143, 148-150 and thiazolidinediones versus placebo/diet/control (3 studies, range in between-group differences 0.2 to 0.5 kg/m2).143 151 152 One study comparing pioglitazone versus uptitration of existing medications showed a non-significant between-group difference in BMI of 0.1 kg/m2.78 In a meta-analysis by Van de Laar et al., of 14 studies, they found a significant difference between acarbose and placebo (pooled estimate of -0.2 kg/m2 and 95% CI of -0.3 to -0.1 kg/m2).38 We identified one additional RCT of acarbose that found no difference in BMI (between-group difference of -0.3 kg/m2).153 The review by Van de Laar et al.,. also found one study that found no significant difference in BMI between voglibose and diet (weighted mean difference of 0.0 kg/m2 and 95% CI -2.3 to 2.3kg/m2).38
Systolic Blood Pressure Key points • All oral diabetes medications had similarly minimal effects on SBP (<5 mmHg). Evidence grades (see Appendix F, Evidence Table 4)
• The evidence for the above key point was graded moderate for the comparison of thiazolidinediones with second generation sulfonylureas.
• The evidence was graded low for the following comparisons: thiazolidinediones versus
metformin, metformin versus second generation sulfonylureas, and second generation sulfonylureas versus metformin plus a second generation sulfonylurea.
• The evidence was graded very low for the following comparisons: second generation
sulfonylureas versus meglitinides, pioglitazone versus rosiglitazone, thiazolidinediones versus alpha-glucosidase inhibitors, second generation sulfonylureas versus alpha-glucosidase inhibitors, second generation sulfonylureas versus meglitinides, metformin versus metformin plus a second generation sulfonylurea, and second generation sulfonylurea versus second generation sulfonylurea plus thiazolidinedione.
• The evidence was graded insufficient for the following comparisons due to the limited
number of direct comparisons: metformin versus metformin plus thiazolidinediones,
54
metformin versus alpha-glucosidase inhibitors, and meglitinides compared with other oral diabetes medications except second generation sulfonylureas.
Direct comparison results (see Appendix F, Evidence Table 9)
Thiazolidinedione versus metformin. Four RCTs comparing SBP between a thiazolidinedione and metformin showed no significant differences between groups with a pooled estimate of 0.1 mmHg (95% CI -2.5 to 2.7 mmHg) (see Figure 20).57-59, 144 No single study markedly influenced the results. An additional RCT found no significant differences in blood pressure from baseline in either group but no data were shown.56
Thiazolidinedione versus second generation sulfonylureas. Five RCTs (in six articles)
reported changes in SBP comparing thiazolidinediones with a second generation sulfonylurea, showing no significant differences between groups with a pooled estimate of -3.1 mmHg (95% CI -6.6 to 0.4 mmHg) (see Figure 21).57, 64, 65, 67, 145, 146 All of the thiazolidinedione doses were higher than the second generation sulfonylurea doses. In a sensitivity analysis, removing the study by Tan et al.,65 changed the results to favor the thiazolidinediones with a pooled estimate of -5.5 mmHg (95% CI -9.8 to -1.2 mmHg). However, there were no major differences between this trial and the other studies. Heterogeneity tests were not significant, although study duration was a significant source of heterogeneity in the metaregression with longer duration studies having smaller differences between groups. One study was excluded from the above meta-analysis since no point estimate could be calculated.62 The authors reported no significant difference in SBP between groups.62
Thiazolidinedione versus alpha-glucosidase inhibitors. Both of the SBP comparisons of a
thiazolidinedione with an alpha-glucosidase inhibitor found greater SBP reductions in the thiazolidinedione group (mean change from baseline, -6 and -5.6 mmHg versus 4 and 0.4 mmHg);64, 75 the between-group difference was reported as significant for one comparison.75
Metformin versus second generation sulfonylureas. Five RCTs compared SBP between
metformin and a second generation sulfonylurea showing no significant differences between groups, with a pooled between-group difference of -1.7 mmHg (95% CI -5.0 to 1.5 mmHg) (see Figure 22).57, 85, 87, 89, 90 A sensitivity analysis showed that removing the double-blind study by Hermann et al.,87 changed the pooled estimate to -2.8 mmHg (95% CI -5.7 to -0.01 mmHg), favoring metformin over second generation sulfonylureas. However, there were no major differences between this study and the other studies. Heterogeneity tests were not significant, and metaregresion found no significant source of heterogeneity. An additional study reported that blood pressure did not change at all during the study, but we were unable to include this in the meta-analysis due to insufficient data to calculate a point estimate.88
Second generation sulfonylurea versus metformin plus second generation sulfonylureas.
Three studies compared SBP between a second generation sulfonylurea and metformin plus a second generation sulfonylurea, showing no differences between groups with a pooled between-group difference of 1.1 mmHg (95% CI -1.4 to 3.5 mmHg) (see Figure 23).87, 89, 129 No single study markedly influenced the results. Heterogeneity tests were not significant, and metaregresion found no significant sources of heterogeneity. We excluded the UKPDS results
55
since the study duration was three years compared with the shorter duration of the other studies (less than or equal to 1 year); however, UKPDS is consistent with these results and showed a non-significant between-group difference of -1.8 mmHg.128 Additionally, one further study reported no differences between groups but no data were shown.88
Other comparisons. Of the three studies comparing metformin versus metformin plus a
second generation sulfonylurea (between-group difference ranging from -0.5 to 6 mmHg),87-89 none reported a significant between-group difference in SBP. One did not report any quantitative data so we were not able to combine these studies in a meta-analysis.88 In two comparisons of repaglinide and a second generation sulfonylurea,117, 118 there were no significant between-group differences in SBP. The Van de Laar et al., systematic review of alpha-glucosidase inhibitors did not evaluate blood pressure.38
We identified one report for each of the following comparisons, none of which found a significant between-group difference: pioglitazone versus rosiglitazone (authors stated no difference between groups, no data shown)52; thiazolidinedione plus metformin versus metformin plus a second generation sulfonylurea (between-group difference of -2.2 mmHg)72; a second generation sulfonylurea versus thiazolidinedione plus a second generation sulfonylurea (2 comparisons, difference between groups ranging from 0 to -2 mmHg)123; repaglinide and metformin (between-group difference of 4 mmHg)97; and a second generation sulfonylurea with an alpha-glucosidase inhibitor (between-group difference of -2 mmHg).64 Placebo-controlled trial results (see Appendix F, Evidence Table 9 and Appendix G, Figure 3)
Consistent with the head-to-head comparisons, the placebo-controlled trials gave little evidence for significant SBP changes with any oral diabetes medication. None of these studies reported a significant between-group difference in SBP. We did not conduct indirect comparisons since there were too few placebo-controlled trials for the oral diabetes medications where there were too few direct comparisons such as acarbose and meglitinides. In studies reporting comparisons of an oral diabetes medication with placebo or diet, we identified four comparisons for thiazolidinedione with a pooled between-group difference of -2.6 mmHg (95% CI -6.4 to 1.2 mmHg);58, 144, 151, 152 eight comparisons in six RCTs for metformin58, 88, 144, 150, 154,
155 (three studies had sufficient data to combine in a meta-analysis)5,8 144, 155 with a pooled between-group difference of 0.96 mmHg (95% CI -6.4 to 8.3 mmHg); and one comparison for acarbose (between-group difference of 1.6 mmHg).153 We found no studies comparing SBP effects between second generation sulfonylureas and placebo. Neither of the meta-analyses had significant heterogeneity. Diastolic Blood Pressure Key points
• All oral diabetes medications had similarly minimal effects on DBP (<5 mmHg). • Data were sparse on the effects of meglitinides and alpha-glucosidase inhibitors on DBP.

56
Evidence grades (see Appendix F, Evidence Table 4)
• The evidence for the above key point was graded moderate for the comparison of thiazolidinediones with second generation sulfonylureas.
• The evidence was graded low for the following comparisons: thiazolidinediones versus
metformin, metformin versus second generation sulfonylureas, and second generation sulfonylureas versus metformin plus a second generation sulfonylurea.
• The evidence was graded very low for the following comparisons: second generation
sulfonylureas versus meglitinides, pioglitazone versus rosiglitazone, thiazolidinediones versus alpha-glucosidase inhibitors, second generation sulfonylureas versus alpha-glucosidase inhibitors, second generation sulfonylureas versus meglitinides, metformin versus metformin plus a second generation sulfonylurea, and second generation sulfonylurea versus second generation sulfonylurea plus thiazolidinedione.
• The evidence was graded insufficient for the following comparisons due to the limited
number of direct comparisons: metformin versus metformin plus thiazolidinediones, metformin versus alpha-glucosidase inhibitors, and meglitinides compared with other oral diabetes medications except second generation sulfonylureas.
Direct comparison results (see Appendix F, Evidence Table 10)
Thiazolidinedione versus metformin. Only one144 of the five DBP comparisons of a thiazolidinedione with metformin found a significant or clinically relevant between-group difference (range in between-group differences of -4 to 0 mmHg).56-59, 144
Thiazolidinedione versus second generation sulfonylureas. Four of the six DBP comparisons
(in 7 articles) of a thiazolidinedione with a second generation sulfonylurea found greater DBP reductions in the thiazolidinedione group (range in between-group differences of -5 to 0 mmHg);57, 62, 64, 65, 67, 145 146 two of these reported between-group differences were statistically significant.67, 146
Thiazolidinedione versus alpha-glucosidase inhibitors. Both of the studies comparing a
thiazolidinedione with an alpha-glucosidase inhibitor reported a slightly greater DBP reduction in the thiazolidinedione group (range in between-group differences of -6 to -1.8 mmHg, p > 0.05).64, 75
Metformin versus second generation sulfonylureas. Six studies compared DBP between
metformin and the second generation sulfonylureas. Three of the six comparisons reported a slightly greater reduction in DBP in the metformin group (range in between-group differences of -15 to 1.2 mmHg).57, 85, 87-90 In one of these the between-group difference was clinically (>5 mmHg) and statistically significant85 while the rest showed no differences between groups.
Metformin versus metformin plus second generation sulfonylureas. Of the three studies
comparing metformin versus metformin plus a second generation sulfonylurea,87-89 none reported
57
a significant or clinically relevant between-group difference in DBP (range of -1.4 to 2.6 mmHg).
Second generation sulfonylurea versus metformin plus second generation sulfonylureas. Of
the four short duration studies comparing a second generation sulfonylurea versus metformin plus a second generation sulfonylurea,87-89, 129 none reported a significant or clinically relevant between-group difference in DBP (range in between-group differences of -2.5 to 2.5 mmHg). In the three year followup of UKPDS, early addition of metformin to second generation sulfonylurea was compared with second generation sulfonylurea showing a non-significant between-group difference of -0.12 mmHg.128
Other comparisons. Two comparisons of second generation sulfonylureas with repaglinide117
118 showed no significant between-group differences (range of -1 to 2 mmHg). We identified one report for each of the following comparisons, none of which found a clinically or statistically significant between-group difference: pioglitazone versus rosiglitazone (authors stated no differences between groups, no data shown);52 thiazolidinedione plus a second generation sulfonylurea versus metformin plus a second generation sulfonylurea (authors stated no clinically relevant differences between groups, no data shown);60 a thiazolidinedione plus a second generation sulfonylurea versus a second generation sulfonylurea (between-group difference of 0 mmHg);123 metformin versus repaglinide (between-group difference of -2 mmHg);97 and a second generation sulfonylurea versus an alpha-glucosidase inhibitor (between-group difference of -1 mmHg).64 As noted above, the systematic review by Van de Laar et al., on alpha-glucosidase inhibitors did not evaluate blood pressure outcomes.38 Placebo-controlled trial results (see Appendix F, Evidence Table 10)
Consistent with the head-to-head comparisons, the placebo-controlled trials gave little evidence for clinically significant DBP changes: four comparisons of thiazolidinediones versus placebo/diet (range in between-group differences of -6.6 to -1.3 mmHg);58, 144, 151, 152 six comparisons (in five articles) for metformin versus placebo/diet (range in between-group differences of -6.2 to 5 mmHg);58, 88, 144, 150, 155 and one comparison for acarbose (between-group difference of 1.8 mmHg).153 We did not conduct formal indirect comparisons since there were too few placebo-controlled trials for the oral diabetes medications where there were too few direct comparisons such as acarbose and meglitinides. Low Density Lipoprotein Cholesterol Key points
• Rosiglitazone increased LDL cholesterol more than pioglitazone using indirect and a few head-to-head comparisons.
• Pioglitazone increased LDL compared with metformin or second generation
sulfonylureas which generally decreased LDL.

58
• Rosiglitazone increased LDL compared with metformin using a few head-to-head and indirect comparisons, and increased LDL compared with second generation sulfonylureas in a few head-to-head trials.
• The addition of rosiglitazone to metformin or second generation sulfonylurea therapy was
associated with increased LDL cholesterol compared with metformin or second generation sulfonylurea monotherapy.
• Using one head-to-head trial and mainly indirect comparisons, rosiglitazone increased
LDL more than acarbose.
• Metformin decreased LDL cholesterol compared with second generation sulfonylureas.
• Metformin monotherapy compared with metformin plus a second generation sulfonylurea showed similar effects on LDL cholesterol.
• Indirect comparisons showed similar effects on LDL when comparing acarbose with
metformin. The one direct comparison favored maximally dosed acarbose over submaximally dosed metformin.
• Second generation sulfonylureas showed similar effects on LDL cholesterol compared
with repaglinide.
• Second generation sulfonylurea monotherapy increased LDL cholesterol compared with the combination of metformin plus second generation sulfonylurea.
• Alpha-glucosidase inhibitors had similar small effects on LDL cholesterol compared with
second generation sulfonylureas.
• Too few studies compared meglitinides with other oral diabetes medications to draw firm conclusions.
Evidence grades (see Appendix F, Evidence Table 4)
• The evidence for the above key points was graded moderate for the following comparisons: thiazolidinediones versus second generation sulfonylureas, thiazolidinediones versus metformin, pioglitazone versus rosiglitazone, metformin versus second generation sulfonylureas, and second generation sulfonylureas versus metformin plus second generation sulfonylureas.
• The evidence was graded low for the following comparisons: second generation
sulfonylureas versus meglitinides, thiazolidinediones versus alpha-glucosidase inhibitors, metformin versus alpha-glucosidase inhibitors, second generation sulfonylureas versus alpha-glucosidase inhibitors, metformin versus metformin plus thiazolidinediones, second generation sulfonylureas versus second generation sulfonylureas plus
59
thiazolidinediones, and metformin versus metformin plus second generation sulfonylureas.
• The evidence was graded insufficient for the following comparison due to the limited
number of direct comparisons: meglitinides compared with other oral diabetes medications besides second generation sulfonylureas.
Direct comparison results (see Appendix F, Evidence Table 11)
Thiazolidinedione versus thiazolidinedione. Two short duration non-blinded RCTs with comparably-dosed drugs compared pioglitazone with rosiglitazone, favoring pioglitazone, with a calculated mean difference between groups ranging from -16 to -9 mg/dL.51, 52 The LDL increased from baseline in both groups in one study52 and decreased from baseline in both groups in the other study.51 Consistent with this, one comparison of rosiglitazone plus glimepiride versus pioglitazone plus glimepiride also found a significant difference between groups, favoring pioglitazone by -35 mg/dL (mean difference from baseline of -15 mg/dL in the pioglitazone arm versus +20 mg/dL in the rosiglitazone arm).156 Due to these potential differences between rosiglitazone and pioglitazone, we report pioglitazone and rosiglitazone comparisons separately for the rest of the LDL section.
Thiazolidinedione versus metformin. Four RCTs (3 comparably-dosed) in five articles
directly compared LDL effects of pioglitazone with metformin, favoring metformin with a pooled between-group difference of 12.5 mg/dL (95% CI 8.8 mg/dL to 16.2 mg/dL) (see Figure 24).54, 56, 59, 60, 157 No single study significantly influenced the results. Metaregression did not find any significant source of heterogeneity. Two RCTs compared rosiglitazone with metformin and found similar results, favoring metformin with a range in between-group differences of 10 mg/dL to 31.2 mg/dL.143, 144 Four of the six studies comparing thiazolidinediones with metformin reported a mean decrease in LDL from baseline in the metformin group56, 59, 60, 143 compared with all studies showing a mean increase in LDL from baseline for the pioglitazone group.
Thiazolidinedione versus second generation sulfonylureas. Five RCTs (reported in eight
articles) compared pioglitazone with second generation sulfonylureas and found more favorable effects on LDL levels in the second generation sulfonylurea arms, with a pooled between-group difference of 10.4 mg/dL (95% CI 7.3 mg/dL to 13.6 mg/dL) (see Figure 25).54, 63, 65, 68, 70, 145, 146,
157 No single study significantly influenced the results. Study blinding was a significant source of heterogeneity, with higher between-group differences in the 2 double-blinded studies (pooled estimate of 13.0 mg/dL with 95% CI of 9.6 to 16.5 mg/dL) compared with the 3 non-blinded studies (pooled estimate of 6.6 mg/dL with 95% CI of 4.7 to 8.4 mg/dL). Four of the five RCTs showed a mean increase in LDL from baseline for the pioglitazone groups whereas all 5 studies showed a mean decrease in LDL from baseline for the second generation sulfonylurea groups. One additional double-blind RCT by Betteridge et al., compared pioglitazone with glimepiride after 2 years, but could not be included in the meta-analysis since no point estimate was reported or could be derived.157 Additionally, the one year data by Matthews et al., was included in our meta-analysis.70 The study by Betteridge et al., reported a significant difference in LDL between groups favoring glimepiride which is consistent with the results from the meta-analysis.157
60
Additionally, one non-blinded year-long RCT compared rosiglitazone with glyburide showing a higher between-group difference of 15.2 mg/dL favoring glyburide.67
Thiazolidinedione plus metformin versus second generation sulfonylureas plus metformin. In
two double-blinded short duration RCTs comparing rosiglitazone plus metformin with a second generation sulfonylurea plus metformin, the combination of second generation sulfonylurea plus metformin was favored over rosiglitazone plus metformin with a range in between-group differences of 14 mg/dL to 20 mg/dL.71, 158 One study reported this difference as non-significant while the second study did not discuss statistical significance. This is similar to the range seen in the rosiglitazone versus second generation sulfonylurea comparisons, and slightly higher than the pooled estimate for pioglitazone versus second generation sulfonylureas.
Thiazolidinedione versus meglitinide. Two non-blinded RCTs with comparably-dosed drugs
compared a thiazolidinedione with repaglinide and found non-significant differences in LDL changes: repaglinide (mean change from baseline, -6 to -1 mg/dL) versus thiazolidinedione (mean change from baseline, 10 mg/dL for pioglitazone and 14 mg/dL for rosiglitazone).73, 74
Other thiazolidinedione comparisons. We identified only one report for each of the following
comparisons, none of which reported a significant between-group difference: thiazolidinedione versus acarbose (-4 mg/dL)75; and thiazolidinedione versus thiazolidinedione plus a second generation sulfonylurea (-0.3 mg/dL).76
Metformin versus second generation sulfonylureas. Nine RCTs compared LDL effects of
metformin with second generation sulfonylureas, with a pooled between-group difference of -10 mg/dL (95% CI -13.1 to -6.9 mg/dL) favoring metformin (see Figure 26).54, 80, 82-84, 87, 88, 90, 159 No single study significantly influenced the results. Study duration was a significant source of heterogeneity, with longer duration studies having slightly greater effects on LDL. One additional study reported qualitatively that there were no differences in overall lipid levels between groups, but did not show their data.81 Only 3 studies had comparable dosing between groups82, 84, 88 but their results were similar to the studies where metformin was dosed higher than the second generation sulfonylureas.
Metformin versus metformin plus thiazolidinedione. Four double-blind RCTs compared
rosiglitazone plus metformin with metformin, showing a pooled between-group difference in LDL of -14.6 mg/dL (95% CI -15.8 to -13.3 mg/dL) (see Figure 27).100-103 No single study significantly influenced the results. No significant source of heterogeneity was identified. Two of these studies reported evidence of a dose-response gradient for the LDL effects of rosiglitazone plus metformin: LDL increased with higher doses of combination therapy.102, 103
Metformin versus metformin plus second generation sulfonylureas. Six RCTs compared
metformin with metformin plus a second generation sulfonylurea, 80, 82, 84, 87, 88, 159 finding no significant differences between groups (pooled estimate -1.6 mg/dL (95% CI -6.6 to 3.3 mg/dL) (see Figure 28). If the 1991 study by Hermann et al., was removed from the meta-analysis159 the pooled estimate changed to -3.3 mg/dL (95% CI -4.9 to -1.8 mg/dL) favoring metformin. However, this was a double-blinded short duration study with no obvious differences from the other studies.159 Additionally, this was a small between-group difference with questionable
61
clinical relevance. No significant source of heterogeneity was identified. One additional RCT stated qualitatively that there was no difference between groups in overall lipid levels but did not show their data.81
Other metformin comparisons. We found only one study for the following comparisons
showing minimal between-group differences in LDL: metformin versus extended release metformin (2 mg/dL),105 and metformin versus repaglinide (-3.12 mg/dL).97 In the systematic review by Van De Laar et al., one study compared acarbose and metformin, showing a weighted mean difference between groups in LDL of -37 mg/dL (95% CI of -59.28 mg/dL to -14.04 mg/dL) favoring acarbose.38
Second generation sulfonylurea versus meglitinides. Two double-blind year-long RCTs with
comparably-dosed drugs compared a second generation sulfonylurea with repaglinide, showing no significant between-group differences in LDL (range -1.48 to 1 mg/dL).116, 118 One additional RCT reported no difference between nateglinide and glibenclamide in LDL, yet no data was shown.122
Second generation sulfonylurea versus thiazolidinedione plus second generation
sulfonylureas. All three double-blind RCTs comparing a second generation sulfonylurea with the combination of a second generation sulfonylurea plus rosiglitazone favored the second generation sulfonylurea monotherapy arms.124-126 Two of the shorter duration studies reported a range in between-group differences of -19.5 to -11.7 mg/dL125, 126 and the one-year RCT reported a between-group difference in LDL of -4.6% favoring the second generation sulfonylurea monotherapy arm.124
Second generation sulfonylurea versus metformin plus second generation sulfonylureas.
Seven RCTs compared second generation sulfonylurea monotherapy to a combination of metformin plus a second generation sulfonylurea, showing a pooled between-group difference favoring the combination arms of 8.1 mg/dL (95% CI 3.1 to 13.1 mg/dL) (see Figure 29).80, 82, 84,
87, 88, 129, 159 No single study markedly influenced the results. Dosing of the medications was a significant source of heterogeneity with higher dose ratios (second generation sulfonylurea dose versus combination dose) having smaller differences between groups, and lower dose ratios having larger differences between groups. Of note, studies with larger between-group differences had generally higher baseline LDL than studies with smaller between-group differences. We did not assess this using metaregression due to concerns of ecologic fallacy.
Second generation sulfonylurea versus alpha-glucosidase inhibitors. The meta-analyses by
Van de Laar et al.,38 found no between-group differences in LDL levels comparing second generation sulfonylureas with acarbose in four RCTs, with a pooled estimate of 3.9 mg/dL (95% CI -2.73 to 10.5 mg/dL).38
Other second generation sulfonylurea comparisons. One RCT compared glimepiride and
gliclazide showing a between-group difference of 3.9 mg/dL. They did not comment on the statistical significance between-groups, yet did report no significant difference from baseline in either group.
62
Results from placebo-controlled trials and indirect comparisons (see Appendix F, Evidence Table 11 and Appendix G, Figure 4)
The placebo-controlled trials generally confirmed results from the direct comparisons (see Table 11). Rosiglitazone compared with placebo/diet increased LDL while comparisons between metformin and placebo suggested a decrease in LDL. Surprisingly, we did not find differences between pioglitazone and placebo/diet. This may have been due to a limited number of studies. Additionally, effects on LDL may be more pronounced for pioglitazone when being compared with a comparator that is associated with decreases in LDL.
We conducted indirect comparisons for the oral diabetes medication comparisons with few head-to-head trials, and where there were sufficient placebo-controlled trials to warrant it. Acarbose had similar effects on LDL compared with pioglitazone and metformin in contrast to the one head-to-head trial for each comparison; however, rosiglitazone increased LDL when compared with acarbose, pioglitazone, and metformin, which is consistent with the direct comparisons (see Tables 12 and 13). The heterogeneity and small number of trials for some of these placebo-controlled trials may explain the inconsistencies between direct and indirect comparisons for acarbose compared with pioglitazone and metformin.
Furthermore, we identified only one comparison with placebo for the following medications: second generation sulfonylurea (reported an increase in LDL in the placebo group with no change in the second generation sulfonylurea group, but no data shown),88 and metformin plus second generation sulfonylurea (-6 mg/dL favoring placebo).88 These trials are consistent with direct comparison data. High Density Lipoprotein Cholesterol Key points
• Pioglitazone increased HDL levels more than rosiglitazone. • Pioglitazone increased HDL levels compared with metformin or second generation
sulfonylureas.
• The combination of rosiglitazone with metformin or a second generation sulfonylurea increased HDL levels slightly more than metformin or a second generation sulfonylurea alone.
• Metformin, second generation sulfonylureas, acarbose, and meglitinides have similar
minimal to no effects on HDL levels.
• Combination therapy with metformin plus a second generation sulfonylurea does not differ in effect on HDL from monotherapy with either of the two classes.
• Other comparisons between drugs had too few comparisons to draw conclusions.
63
Evidence grades (see Appendix F, Evidence Table 4)
• The evidence for the above key points was graded moderate for the following comparisons: thiazolidinediones versus second generation sulfonylureas, thiazolidinediones versus metformin, pioglitazone versus rosiglitazone, metformin versus second generation sulfonylureas, and second generation sulfonylureas versus metformin plus second generation sulfonylureas.
• The evidence was graded low for the following comparisons: second generation
sulfonylureas versus meglitinides, thiazolidinediones versus alpha-glucosidase inhibitors, metformin versus alpha-glucosidase inhibitors, second generation sulfonylureas versus alpha-glucosidase inhibitors, metformin versus metformin plus thiazolidinediones, second generation sulfonylurea versus second generation sulfonylurea plus thiazolidinedione, and metformin versus metformin plus second generation sulfonylureas.
• The evidence was graded insufficient for the following comparison due to the limited
number of direct comparisons: meglitinides compared with other oral diabetes medications besides second generation sulfonylureas.
Direct comparison results (see Table 14 and Appendix F, Evidence Table 12)
Thiazolidinedione versus thiazolidinedione. Two studies compared pioglitazone and rosiglitazone with regard to HDL cholesterol levels; both found a greater mean increase from baseline in the pioglitazone arm (range in between-group difference of -2.8 to -0.5 mg/dL), and the largest of these two studies (n=719) found a significant between-group difference.51, 52 One study comparing pioglitazone plus glimepiride versus rosiglitazone plus glimepiride found similar results, reporting a significantly greater HDL increase in the pioglitazone group (between-group difference of -5 mg/dL).156
Thiazolidinedione vs metformin. Two studies compared rosiglitazone with metformin
showing no clinically relevant (>3 mg/dL) or statistically significant differences between groups (range of 0 to 0.4 mg/dL);143, 144 however, six studies comparing pioglitazone with metformin showed increased HDL in the pioglitazone arms (range in between-group differences of 0.78 to 5 mg/dL).54-57, 59, 60 Four of these studies showed clinically relevant differences between groups (>3 mg/dL).54, 56, 57, 59 The between-group differences were significant in 4 of these comparisons54, 56,
59, 60 not significant in one57 and not reported in one.55 One study added pioglitazone versus placebo to existing second generation sulfonylureas, but had results consistent with the monotherapy trials (between-group difference of 2.7 mg/dL).60
Thiazolidinedione versus second generation sulfonylureas. Six of the seven studies (reported
in 9 articles) 54, 55, 57, 63, 65, 68, 145, 146, 157 of pioglitazone with a second generation sulfonylurea showed clinically important (> 3 mg/dL) and statistically significant differences favoring the thiazolidinedione arm with regard to effects on HDL levels (overall range in between-group differences of -1.17 to 7.02 mg/dL). Only one study favored pioglitazone over second generation sulfonylurea; however, this study used lower doses of second generation sulfonylurea than they used for pioglitazone.55 With this study removed, the range in between-group differences
64
changed to 4.3 to 7.0 mg/dL.54, 57, 63, 65, 68, 145, 146 One additional study reported no significant differences between-groups, but no data was shown.62
Thiazolidinedione plus metformin versus second generation sulfonylureas plus metformin.
Consistent with this, both comparisons of rosiglitazone plus metformin versus a second generation sulfonylurea plus metformin favored combination therapy with rosiglitazone with regard to HDL effects (range in between-group differences of 2 to 4 mg/dL).72, 158 One of these studies reported clinically important and statistically significant between-group differences.158
Thiazolidinedione versus meglitinides. We identified two studies comparing a
thiazolidinedione (one on rosiglitazone and one on pioglitazone) with a repaglinide (between-group differences of 1.3 to 7.0mg/dL respectively). 73, 74 Both reported a greater HDL increase in the thiazolidinedione group without accompanying statistical comparisons, and only the pioglitazone with repaglinide comparison had clinically important differences (> 3 mg/dL).73
Thiazolidinedione versus alpha-glucosidase inhibitors. We found only one study that
compared pioglitazone with acarbose (between-group difference of 8.6 mg/dL), and the analysis of its 265 participants found a significantly and clinically important HDL increase with pioglitazone.75
Other thiazolidinedione comparisons. One study compared rosiglitazone with uptitration of
usual medications showing no between-group differences (1.17 mg/dL).77 Metformin versus second generation sulfonylureas. Of 13 direct comparisons of the effects
on HDL levels of metformin versus a second generation sulfonylurea, none had clinically relevant (>3 mg/dL) between-group differences (range of -1.95 to 1.56 mg/dL).54, 55, 57, 80-85, 87-90 Most studies did not report on the statistical significance of these slight differences.
Metformin versus alpha-glucosidase inhibitors. The meta-analyses by Van de Laar et al.,38
found no overall between-group differences for acarbose versus metformin (1 study, weighted mean difference of 9.4 mg/dL and 95% CI.-0.78 to 19.5 mg/dL).38 We identified no other studies for this comparison beyond those included in the Van de Laar review.
Metformin versus metformin plus thiazolidinedione. Consistent with this, all 6 comparisons
(in 4 studies) of metformin alone versus metformin plus rosiglitazone found an HDL increase in the combination therapy arm compared with minimal changes in the metformin monotherapy arms (range in between-group differences of 2.5 to 6.9 mg/dL).100-103 Only two studies reported a between-group analysis and found this difference to be clinically (>3 mg/dL) and statistically significant.160, 161 Additionally, two of the studies reported evidence of a dose-response gradient.102, 103
Metformin versus metformin plus second generation sulfonylureas. Similarly, we found no
overall difference in HDL effects between metformin monotherapy and metformin plus a second generation sulfonylurea (range in between-group differences of -1.2 to 3.12 mg/dL). None of eleven comparisons (in 8 articles) reported significant between-group differences,80-82, 84, 87-89, 104
65
and only 2 RCTs had clinically relevant differences (>3 mg/dL) each favoring opposite medication groups.87, 89
Other metformin comparisons. The one comparison of metformin with repaglinide found no
significant between-group difference (-4.29 mg/dL) with regard to HDL effects.97 Additionally, the two sub-arm comparisons (in 1 article) of metformin and extended release metformin found no significant between-group differences (range of 2 to 4 mg/dL).105
Second generation sulfonylureas versus second generation sulfonylureas. We found only two
studies directly comparing two second generation sulfonylureas, neither of which found significant between-group differences (0.9 mg/dL in one study, and authors stated no between-group difference in second study but no data was shown).111, 133
Second generation sulfonylurea versus meglitinides. Similarly, none of the 8 second
generation sulfonylurea versus meglitinide comparisons (in 6 articles) reported a significant or clinically relevant between-group difference for HDL effects (range of -1.17 to 1.17 mg/dL).116-
119, 121, 122 Second generation sulfonylurea versus thiazolidinedione plus second generation
sulfonylureas. Three studies comparing second generation sulfonylurea monotherapy and combination therapy with rosiglitazone plus a second generation sulfonylurea reported similarly minimal HDL between-group differences.124-126 Two studies reported percent difference in HDL of 1.1% to 6.8%, yet neither study reported on the statistical significance of this small difference.125, 126 The third study reported a non-significant between-group difference of 0 mg/dL.124
Second generation sulfonylurea versus metformin plus second generation sulfonylurea. None
of the 10 second generation sulfonylurea versus second generation sulfonylurea plus metformin comparisons (in 8 articles) showed significant between-group differences with regard to HDL effects (range of -0.5 to 3.9 mg/dL).80-82, 84, 87-89, 129 Additionally, only one of the 5 RCTs with data on mean differences between-groups showed clinically relevant between-group differences (>3 mg/dL).129
Second generation sulfonylurea versus alpha-glucosidase inhibitors. The meta-analyses by
Van de Laar et al.,38 found no overall between-group differences for acarbose versus second generation sulfonylurea (7 studies, weighted mean difference of 0.78 mg/dL and 95% CI -0.78 to 2.34 mg/dL); and miglitol versus second generation sulfonylurea (1 study, weighted mean difference of -0.39 mg/dL and 95% CI -10.1 to 9.36 mg/dL). We identified no other studies for these comparisons beyond those included in the review by Van de Laar and colleagues. Placebo-controlled trial results (see Appendix F, Evidence Table 12)
The placebo-controlled trials were consistent with the head-to-head comparisons. Pioglitazone increased HDL levels more than placebo in 12 of 14 subarm comparisons (9 articles, range in between-group differences of -1.95 to 8.7 mg/dL).140, 151, 160-166 Additionally, a clinically relevant difference (>3 mg/dL) was reported in five of the seven articles that reported
66
data on mean differences between groups.160-162, 165, 166 Only one study favored pioglitazone with a between-group difference of -1.95 mg/dL; however, this study compared pioglitazone with a control arm (without placebo) which may account for this difference.151
Rosiglitazone was favored in only 9 of 15 comparisons (and 5 of 9 articles) with placebo/diet (range in between-group differences of -1.17 to 3.9 mg/dL).143, 144, 152, 167-172 This was clinically relevant (>3 mg/dL) in 4 of 8 articles where data were reported.144, 167, 170, 171 However, none of these studies had clinically relevant differences favoring placebo/diet.
Metformin increased HDL levels slightly more than placebo in 4 of 6 studies (range in between-group differences of 0 to 2.7 mg/dL). 88, 143, 144, 149, 150, 173 However, this difference was not clinically relevant in any of these studies. Additionally, only one study favored placebo slightly with a between-group difference of -3 mg/dL.173
A meta-analysis of 14 studies by Van de Laar et al., found no significant difference between acarbose and placebo in HDL effects (pooled between-group difference of 0.00 mg/dL and 95% CI – 1.56 to 1.56 mg/dL).38 We identified 2 additional comparisons of acarbose with placebo with generally consistent results, (range in between-group differences of 2.9 to 3.9 mg/dL).138, 153 Van de Laar and colleagues found only one comparison of voglibose with diet and found no significant between-group difference for HDL effects, with a weighted mean difference of -15.6 mg/dL (95% CI -31.59 to 0.39 mg/dL).38
We identified only one of the following comparisons, none of which showed a significant between-group difference: a second generation sulfonylurea with placebo (between-group difference of 1 mg/dL);136 and repaglinide with placebo (between-group difference of -0.3 mg/dL).139 Triglycerides Key points
• Using head-to-head results and indirect comparisons, pioglitazone decreased TG levels while rosiglitazone increased TGs.
• Pioglitazone decreased TGs more than metformin, and showed similar decreases in TG
when compared with second generation sulfonylureas. Additionally, indirect comparisons and one direct comparison showed pioglitazone decreased TGs more than acarbose.
• Rosiglitazone increased TGs when compared indirectly with metformin, yet showed
similar effects on TGs when compared directly.
• Rosiglitazone increased TGs when compared with acarbose in indirect comparisons.
• Metformin decreased TGs more than second generation sulfonylureas and more than metformin plus rosiglitazone.
• Metformin plus a second generation sulfonylurea decreased TGs more than second
generation sulfonylurea monotherapy, and showed a non-significant suggestion of decreased TGs when compared with metformin monotherapy.
67
• Using a few direct comparisons and indirect comparisons, metformin showed similar effects on TGs when compared with acarbose.
• Second generation sulfonylureas had similar effects on TGs compared with meglitinides
and acarbose.
• Other comparisons had too few comparisons to draw conclusions. Evidence grades (see Appendix F, Evidence Table 4)
• The evidence for the above key points was graded moderate for the following comparisons: thiazolidinediones versus metformin, pioglitazone versus rosiglitazone, metformin versus second generation sulfonylureas, and second generation sulfonylureas versus metformin plus second generation sulfonylureas.
• The evidence was graded low for the following comparisons: thiazolidinediones versus
second generation sulfonylureas, second generation sulfonylureas versus meglitinides, thiazolidinediones versus alpha-glucosidase inhibitors, metformin versus alpha-glucosidase inhibitors, second generation sulfonylureas versus alpha-glucosidase inhibitors, metformin versus metformin plus thiazolidinediones, second generation sulfonylurea versus second generation sulfonylurea plus thiazolidinedione, and metformin versus metformin plus second generation sulfonylureas.
• The evidence was graded insufficient for the following comparison due to the limited
number of direct comparisons: meglitinides compared with other oral diabetes medications besides second generation sulfonylureas.
Direct comparison results (see Appendix F, Evidence Table 13)
Thiazolidinedione versus thiazolidinedione. Two comparisons of rosiglitazone versus pioglitazone reported a greater beneficial effect on TGs in the pioglitazone arm (mean change from baseline -52 and -15 mg/dL versus 6 and 13 mg/dL), and the largest of these studies reported a significant between-group difference.51, 52 Similarly, the one study comparing glimepiride added to either rosiglitazone or pioglitazone found a significantly greater TG reduction in the pioglitazone group.53
Thiazolidinedione versus metformin. Six RCTs compared pioglitazone with metformin,
favoring pioglitazone with a pooled between-group difference of -25.5 mg/dL (95% CI -29.8 to -21.1 mg/dL) (see Figure 30).54-57, 59, 60 No single study markedly influenced the results. No source of heterogeneity was found in metaregression. Neither of the two studies comparing rosiglitazone with metformin found a significant between-group difference (range of -27 to 47 mg/dL).143, 144
Thiazolidinedione versus second generation sulfonylureas. Six RCTs compared pioglitazone
with a second generation sulfonylurea, favoring pioglitazone with a pooled between-group difference of -24.2 mg/dL (95% CI -45.7 to -2.6 mg/dL) (see Figure 31).54, 55, 57, 63, 65, 68, 157
68
However, when the study by Yamanouchi et al., was removed, the between-group difference changed to -22.9 mg/dL (95% CI -48.2 to 2.2 mg/dL).57 This study had a higher dose of thiazolidinedione compared with a lower dose of second generation sulfonylurea. When the three studies with comparable dosing were combined only, they showed no significant differences between-groups although it did still show a suggestion of a difference favoring pioglitazone (pooled estimate of -28.8 mg/dL, 95% CI -66 to 8.5 mg/dL) (see Figure 32).54, 63, 157 One additional small RCT compared pioglitazone with gliclazide and showed no differences between-groups.62 We excluded this from the meta-analysis since we were unable to calculate a point estimate based on data reported in the article.62
Additionally, we identified only one comparison of rosiglitazone with a second generation sulfonylurea, which reported a non-significantly greater TG reduction in the second generation sulfonylurea arm.67
Thiazolidinedione plus metformin versus second generation sulfonylurea plus metformin.
Similarly, neither of the two comparisons of metformin plus rosiglitazone compared with metformin plus a second generation sulfonylurea reported significant between-group differences (-16 and 9 mg/dL).71, 72
Thiazolidinediones versus meglitinides. We identified only one comparison of repaglinide
with each of the two thiazolidinediones, showing differing effects between groups. 73, 74 Rosiglitazone caused a greater absolute increase in TG when compared with repaglinide while pioglitazone caused a greater absolute TG reduction when compared to repaglinide (between-group differences of 23 mg/dL and -96 mg/dL respectively), yet the studies did not report on the statistical significance of these differences.73, 74
Thiazolidinediones versus alpha-glucosidase inhibitors. The one comparison of a
thiazolidinedione with acarbose reported a significantly greater TG reduction in the pioglitazone arm (between-group difference of -33 mg/dL).75
Other thiazolidinedione comparisons. Two RCTs compared thiazolidinediones (one with
rosiglitazone and one with pioglitazone) with uptitration of existing diabetes medications, favoring the thiazolidinediones (between-group difference of -23 and -30 mg/dL).77, 78 This difference was reported as non-significant in one study.78 One other RCT compared rosiglitazone with rosiglitazone plus glimepiride, favoring the combination arm non-significantly by 29.1 mg/dL.76
Metformin versus second generation sulfonylureas. Thirteen RCTs compared metformin with
second generation sulfonylureas, favoring metformin with a pooled between-group difference of -9.1 mg/dL (95% CI -16.0 to -2.1 mg/dL) (see Figure 33).54, 55, 57, 80, 82-90 No single study markedly influenced the results. No significant source of heterogeneity was identified in metaregression. One additional RCT reported no quantitative data but mentioned that no significant changes in lipids were seen in either group.81
Metformin versus meglitinides. We identified only one study comparing a meglitinide with metformin, which found no significant difference between groups (difference of -8 mg/dL).97
69
Metformin versus alpha-glucosidase inhibitors. The meta-analysis by Van de Laar et al.,38 found no significant difference in TGs for acarbose versus metformin (one study, pooled between-group difference of -24.9 mg/dL and 95% CI -71.2 to 21.4 mg/dL). We identified an additional comparison of metformin and acarbose that found a non-significantly greater TG reduction in the acarbose arm (between-group difference of 12.5 mg/dL).99
Metformin versus metformin plus thiazolidinedione. Four RCTs compared metformin with
metformin plus rosiglitazone favoring metformin with a pooled between-group difference of -11.3 mg/dL (95% CI -15.8 to -6.8 mg/dL) (see Figure 34).100-103 No single study markedly influenced the results. No source of heterogeneity was found in metaregression.
Metformin versus metformin plus second generation sulfonylureas. Six RCTs compared
metformin with metformin plus second generation sulfonylurea, and non-significantly favored the combination arm (pooled between-group difference of 6.9 mg/dL (95% CI -1.2 to 14.9 mg/dL) (see Figure 35).80, 82, 84, 87-89 Removing the study by Marre et al.,84 markedly changed the results to significantly favor the combination arm, with a pooled between-group difference of 8.9 mg/dL (95% CI 0.2 to 17.7 mg/dL). However, this study was a large double-blind study with no obvious differences from the other studies, so should remain in the meta-analysis. No source of heterogeneity was identified in metaregression, although dose showed a suggestion of being significant (p=0.07). The two studies with a combination arm dose that was 1.5 to 2 times the dose of the monotherapy arm showed larger between-group differences favoring the combination arm.80, 89 Additionally, two studies not included in the meta-analysis reported no differences in lipids between groups, yet no data was shown.81, 104
Second generation sulfonylureas versus second generation sulfonylureas. Two RCTs
compared glibenclamide with another second generation sulfonylurea, favoring the other second generation sulfonylurea slightly (between-group differences of 2 and 16 mg/dL).111, 133 However, neither study assessed the significance of these calculated differences. One other study showed similarly no effects on TGs in either the glimepiride or gliclazide arms (between-group difference of 0 mg/dL).106
Second generation sulfonylurea versus meglitinides. Three RCTs compared second
generation sulfonylureas with repaglinide, showing no differences between groups (pooled estimate of 0.2 mg/dL; 95% CI -3.9 to 4.3 mg/dL) (see Figure 36).116, 118, 119 No single study markedly influenced the results. Two other RCTs (one with repaglinide and one with nateglinide) reported no significant differences in lipids between groups, yet no measure of dispersion was reported for one study and the other study had no quantitative data, so we were unable to include these in the meta-analysis.117, 122
Second generation sulfonylureas versus second generation sulfonylureas plus
thiazolidinediones. Three RCTs compared second generation sulfonylurea with second generation sulfonylurea plus thiazolidinediones (all rosiglitazone), showing no differences between groups.124-126 Two studies reported percent change from baseline favoring second generation sulfonylurea monotherapy slightly (between-group differences of -4.2 to -14.9%)124,
126 while the third study reported similar effects on TGs (between-group difference of 1.8 mg/dL).125
70
Second generation sulfonylureas versus metformin plus second generation sulfonylureas. Six RCTs compared second generation sulfonylurea versus metformin plus second generation sulfonylurea, favoring the combination arm with a pooled between-group difference of 30.1 mg/dL (95% CI 15.3 to 44.9 mg/dL) (see Figure 37).80, 82, 84, 87-89 No single study markedly influenced the results. No source of heterogeneity was identified with metaregression. We excluded three RCTs from the meta-analysis.81, 128, 129 One study by Gregorio et al.,129 with a between-group difference of -0.9 mg/dL, compared uptitration of existing second generation sulfonylurea with uptitration of metformin added to an existing second generation sulfonylurea, in contrast to the other studies where both combinations and monotherapy were started at the same time or an existing second generation sulfonylurea was continued without uptitration of dosing in the second generation sulfonylurea. However, inclusion of this study did not markedly change the results (pooled estimate of 25 mg/dL, 95% CI 10.8 to 39 mg/dL).129 A second study reported no differences in lipids between-groups, yet no data was shown.81. UKPDS was excluded due to differences in study duration and study design.128
The UKPDS compared early addition of metformin to second generation sulfonylurea versus continuation of second generation sulfonylurea, showing no differences between groups at the 3-year followup.128 This difference between UKPDS and the other studies may be due to the longer study duration than the other trials, or to differences in study arms since other oral agents (usually metformin) could be added to the second generation sulfonylurea monotherapy arm if the subject became sufficiently hyperglycemic.
Second generation sulfonylureas versus alpha-glucosidase inhibitors. The meta-analyses by
Van de Laar et al., found no significant mean differences between groups in TGs for the following comparisons: acarbose versus a second generation sulfonylurea (eight studies, pooled estimate of 0.89 mg/dL and 95% CI -16.0 to 17.8 mg/dL); and miglitol versus a second generation sulfonylurea (one study, pooled estimate of -3.6 mg/dL and 95% CI -35.6 to 28.5 mg/dL).38 We found no additional studies on this comparison.
Other comparisons. We identified one study for each of the following direct comparisons,
none of which found a significant between-group difference: metformin versus metformin XR; and rosiglitazone with and without glimepiride.76, 105 Results of placebo-controlled trials and indirect comparisons (see Appendix F, Evidence Table 13 and Appendix G, Figure 5)
The placebo-controlled trials were consistent with the head-to-head trials. Pioglitazone, metformin, repaglinide, and acarbose decreased TGs compared with placebo, while rosiglitazone increased TGs compared with placebo (see Table 15).
We conducted indirect comparisons for the oral diabetes medications where there were few direct comparisons and where sufficient placebo-controlled trial data existed. Rosiglitazone increased TGs compared with pioglitazone, metformin, and acarbose (see Table 16). This was consistent with the small amount of head-to-head data for pioglitazone versus rosiglitazone, yet differed from the two direct comparisons of metformin vs rosiglitazone. There were no direct comparisons of rosiglitazone versus acarbose. The inconsistency may be due to the fact that rosiglitazone versus placebo was added to existing second generation sulfonylureas, or due to differences in placebo groups of the trials. Acarbose increased TGs when compared with
71
pioglitazone, and showed similar effects on TGs when compared with metformin (see Table 17). These results were consistent with the few direct comparison results.
We identified only one comparison of a second generation sulfonylurea with placebo, which favored placebo (between-group difference of 14 mg/dL).136
Study Quality (see Appendix F, Evidence Table 14)
While all of the trials were randomized, only 16% of them described their randomization techniques. Of the 61% of studies that reported double-blinding, 72% did not describe the double-blinding technique or mention active placebo or double dummies in their methods. Twenty-four percent of the trials did not describe the losses to followup or reasons for withdrawal. Slightly less than half (40%) scored less than 3 on a 5-point quality scale, yet only 12% scored less than or equal to 1.
Key Limitations
Data were sparse on direct comparisons of certain medication classes such as meglitinides and alpha-glucosidase inhibitors, and specific outcomes such as 2 hour PPG. Additionally, many of the studies were performed with pharmaceutical support, which could have biased the results toward a particular drug.174 However, we evaluated dose ratios when deciding to combine studies as well as evaluated dosing in metaregression. Generally, we did not find much difference in results between studies with comparable and non-comparable dosing. When we noticed a difference, we stated this in our results. Since many studies did not report on between-group differences or measures of dispersion, we had to calculate these to conduct the meta-analyses, using assumptions about correlation between baseline and final values. This may have lead to wider confidence intervals since we chose a conservative correlation of 0.5. However, we used conservative assumptions, conducted sensitivity analyses, and used a random effects model to indicate the range of pooled point estimates for each outcome. Several studies reported that there were no effects on a specific outcome such as weight or lipids, yet did not report quantitative data. Also, a few studies reported data in a way that we were unable to use in the combined analysis (e.g., as percent change without a baseline value, or only reported data for one group). Without quantitative data, we could not combine smaller studies to get one larger effect estimate. Furthermore, we were limited in our assessment of baseline values as contributors to between-study heterogeneity since metaregression using individual level characteristics may lead to ecologic fallacy. However, while this may have led to some unexplained heterogeneity in the results, it did not affect the direction of the pooled estimate. Differences in baseline values would have only contributed to smaller or larger between-group differences. Additionally, using the random effects model helped take this heterogeneity into account. The indirect comparisons must be viewed with caution because indirect comparisons tend to overestimate effects.175 Also, were were unable to fully assess the heterogeneity in the placebo groups. While the study populations were similar to the general diabetes population, many studies excluded subjects with significant comorbidity making the results less generalizable to people with significant cardiovascular, hepatic, or renal disease. Lack of reporting of withdrawals in a quarter of the trials may have impacted the results, especially if greater withdrawals occurred in one arm or if intention to treat analyses were not used. However, we did conduct meta-regression using
72
specific quality aspects such as double-blinding, and reported when these may have affected the results. Key Question 2: Do oral diabetes medications for the treatment of adults with type-2 diabetes differ in their ability to affect distal diabetes-related complications including mortality and the following macrovascular and microvascular complications: coronary artery disease, myocardial infarction, stroke, transient ischemic attack, arrhythmia, coronary artery stenosis and in-stent re-stenosis, retinopathy, nephropathy, neuropathy, and peripheral arterial disease? Study Design and Population Characteristics
Slightly more than half of the studies were RCTs while the rest were cohort studies or pre-post studies. The majority of studies occurred in the U.S., Canada, or Europe. About half of the studies had support from a pharmaceutical company. Most of the cohort studies had followup for more than one year; a few of the RCTs were longer than 1 year. Most subjects were overweight or obese middle-aged to older adults; mean age ranged from 53 to 77 years. The mean duration of diabetes varied from 2 to 15 years. Exclusion criteria varied, and half the studies excluded subjects with a history of cardiovascular, liver, or kidney disease (see Appendix F, Evidence Tables 15 and 16). These study population characteristics were similar to the general population of patients with diabetes.50 All Cause Mortality Key points
• Combination effects of metformin with a second generation sulfonylurea on mortality compared with second generation sulfonylurea or metformin monotherapy, as well as comparisons between metformin and second generation sulfonylurea were not clear.
Evidence grades (see Appendix F, Evidence Tables 17)
• The evidence was graded very low or very low to low for the following comparisons: metformin versus second generation sulfonylureas, pioglitazone versus second generation sulfonylureas, metformin plus second generation sulfonylurea versus second generation sulfonylurea or metformin monotherapy, thiazolidinediones versus metformin, and meglitinides versus second generation sulfonylureas.
• The evidence was graded insufficient for all other comparisons.
73
Direct comparison results (see Appendix F, Evidence Tables 18 and 19)
RCTs Second generation sulfonylureas versus metformin plus second generation
sulfonylureas. UKPDS had the longest duration of all of the RCTs and less than 5% of subjects were lost to followup. In the median 6.6 year followup of UKPDS, they directly compared early addition of metformin to subjects previously randomized but not under good glycemic control with a second generation sulfonylurea versus continuation of second generation sulfonylurea, and subjects in the early addition of metformin to second generation sulfonylurea arm were 1.6 times more likely to die than subjects in the second generation sulfonylurea arm (95% CI 1.02 to 2.52).15 Due to this result, they also conducted an adjusted epidemiologic analysis of all patients on combination therapy with second generation sulfonylurea plus metformin (5181 person-years out of a total of 45, 527 person-years) versus all other diabetes treatment including insulin. In this analysis, no differences were seen between-groups in diabetes-related deaths; however, the number of events were generally small.15
Other direct comparisons between drugs. Only 1 to 2 short duration RCTs exist for each
of the direct medication comparisons, making it difficult to draw conclusions given the extremely small numbers of deaths in each of these trials.56, 80, 82, 100, 60, 77, 105, 112, 116, 176 Additionally, a prior systematic review reported only 0 to 2 RCTs comparing acarbose with each oral diabetes medication, making it difficult to determine if there was any survival advantage for acarbose compared to other oral diabetes medications.38
Non-RCTs and Cohorts Metformin or second generation sulfonylurea monotherapy versus metformin plus
second generation sulfonylureas. Four retrospective cohort studies directly compared metformin or second generation sulfonylurea monotherapy to a combination of metformin plus second generation sulfonylurea showing conflicting results.12, 177-179 One 5-year retrospective cohort compared 8,886 new users (no diabetes prescription in the past year and had prescription benefits) of metformin or metformin plus a second generation sulfonylurea with an unspecified second generation sulfonylurea using vital statistics files and claims data for a Canadian population, and showed a 30-40% relative decrease in the odds of death in both the metformin and metformin plus second generation sulfonylurea groups compared to second generation sulfonylurea alone, after adjusting for multiple confounders including age, sex, nitrate use, and a modified chronic disease score.12 Another retrospective cohort study used the same Saskatchewan claims database to identify 1,833 Canadian diabetic subjects with CHF and prescription benefits.179 They followed the patients for an average of 2.5 years, and reported a 39% decreased risk of death in the combination therapy arm compared with second generation sulfonylurea monotherapy (hazard ratio (HR) 0.61, 95% CI 0.52 to 0.72) after adjustment for age, sex, chronic disease score, and drug therapies.179 A 6-year retrospective cohort of 11,587 new users of oral diabetes medications showed no differences in mortality rates for combination therapy versus monotherapy with either metformin or a second generation sulfonylurea using a database from 263 practices in the United Kingdom, Wales, Ireland, and Scotland, and after adjusting for potential confounders using propensity scores.177 Another 6-year retrospective
74
cohort study of 2,348 new users of oral diabetes medications derived from medical record abstraction in 2 primary health care centers and 2 private practices in Sweden showed an increased risk of death in patients who were using combination therapy versus an unspecified second generation sulfonylurea alone using the Swedish mortality register, after adjustment for multiple confounders: age, sex, study srea, year of inclusion, BMI, glycemic control, and duration of diabetes.178 We found an additional important 5-year retrospective cohort study published after our search was completed which used medical records, prescription databases, and the General Registrar to obtain data on diabetic patients in Scotland.180 They reported an increased mortality for the 985 subjects taking metformin with later addition of second generation sulfonylurea compared with the 2,286 subjects taking metformin (relative risk (RR) 2.47, 95% CI 1.88 to 3.25) after adjusting for extensive confounders. Additionally, they reported an increased mortality for the 1252 subjects taking second generation sulfonylurea with later addition of metformin compared with the 2,286 subjects taking metformin (RR 2.16, 95% CI 1.68 to 2.78). The conflicting results from these studies may be due to differences in study populations, or differing adjustments for potential confounders. However, the two studies that adjusted for the most confounders were consistent with results from UKPDS.178, 180
Metformin plus second generation sulfonylureas versus other oral diabetes medications.
One prospective cohort single center study followed Italian outpatients with diabetes for an average followup of 55.1 months with only two patients lost to followup. They reported a 1.7 to 2 times increased risk of death in the combination arm (metformin plus second generation sulfonylurea) compared with other diabetes treatment (second generation sulfonylurea, metformin, or insulin), after adjustment for multiple confounders including age, duration of diabetes, coronary artery disease, hypertension, respiratory insufficiency, renal failure,BMI, total and HDL cholesterol, TGs, mean HbA1c during followup, and duration of insulin therapy.181
Metformin versus second generation sulfonylureas. One retrospective cohort study used
the Saskatchewan claims database to identify 1,833 Canadian diabetic subjects with CHF and prescription benefits that they followed for an average of 2.5 years.179 They reported a 30% decreased risk of death in the metformin arm compared with the second generation sulfonylurea arm (HR 0.7, 95% CI 0.54 to 0.91), after adjustment for age, sex, chronic disease score, nitrate use, and drug therapies.179 We found an additional important 5-year retrospective cohort study published after our search was completed which used medical records, prescription databases, and the General Registrar to obtain data on diabetic patients in Scotland.180 They reported an increased mortality for the 3,331 subjects taking second generation sulfonylurea compared with 2,286 subjects taking metformin (RR 1.43, 95% CI 1.15 to 1.77) after adjusting for an extensive number of confounders.
Second generation sulfonylureas versus other. Four studies compared second generation
sulfonylurea with other oral diabetes medications with no consistent results.10, 11, 182, 183 One retrospective cohort compared mortality rates after acute myocardial infarction with angioplasty in 185 patients taking glibenclamide compared with diabetic patients taking other oral diabetes medications.10 The study found a significant difference in in-hospital mortality between the patients on glibenclamide and patients on other oral diabetes medications (odds ratio (OR) 2.53, 95% CI 1.13 to 5.67) after adjustment for multiple confounders.10 However, no between-group differences were seen when they evaluated late mortality (after mean followup of 3.7 years).
75
Another study evaluated 232 diabetic patients after admission to the coronary care unit, and found a significantly greater incidence of in-hospital mortality in the non-glibenclamide group compared with the glibenclamide group (25% vs 11% respectively) without adjustment for potential confounders.11 One prospective cohort study followed 152 subjects with a prior history of diabetes admitted to an intensive care unit in Germany for acute myocardial infarction, and used patients, family members, general practitioners, and neighbors as sources of vital statistics.182 They compared subjects taking second generation sulfonylurea therapy to subjects taking other diabetes medications, and found no differences in survival after 3 years, without adjustment for confounders.182 An additional retrospective cohort study of 175 subjects admitted to the hospital with acute myocardial infarction showed no difference between diabetic subjects taking glibenclamide and diabetic subjects not taking glibenclamide for in-hospital mortality (32.9% vs 32.6% respectively, p=0.97).183
Thiazolidinedione or metformin versus other. One retrospective cohort study of 24,953
Medicare beneficiaries evaluated a thiazolidinedione and/or metformin compared to other oral diabetes medications (not metformin and not thiazolidinediones) in diabetic patients one year after acute myocardial infarction using claims and medical record data.184 This study found similar mortality rates comparing metformin or thiazolidinediones to other oral diabetes medications. When the investigators combined metformin and thiazolidinedione users into one group, they found a 48% decreased likelihood of mortality (HR 0.52, 95% CI 0.34-0.82) compared to subjects using other oral diabetes medications after adjusting for age, race, sex, comorbidities from medical record abstraction, and clinical data from hospitalization such as blood pressure and lab data.184 Comparisons between drug and placebo/diet (see Appendix F, Evidence Tables 18 and 19)
Given the lack of consistent head-to-head data on mortality, we included studies that
compared the oral diabetes medications to placebo/diet to help evaluate potential differences between medications.
RCTs Metformin or second generation sulfonylureas versus placebo/diet. The UKPDS was the
longest RCT comparing different types of oral diabetes medications. After 10 years of followup, subjects randomized to metformin had a 36% decreased likelihood of death compared with subjects randomized to diet therapy, (HR 0.64, 95% CI 0.45 to 0.91).15 Furthermore, subjects in the glibenclamide-only arm were equally likely to die after 10 years compared with subjects in the diet arm (HR 0.91, 95% CI 0.73 to 1.15).16 However, subjects with hyperglycemia or who were symptomatic on diet alone did receive additional therapy with an oral diabetes medication which was frequently a second generation sulfonylurea. One additional short duration RCT compared continuing existing metformin versus stopping metformin and showed no significant differences in mortality between-groups (32% versus 34%, respectively).150
Pioglitazone versus placebo/diet. The prospective pioglitazone trial in macrovascular events
(PROactive) study was the largest and longest RCT evaluating mortality for pioglitazone.185 The study randomized 5238 patients to pioglitazone or matching placebo in addition to their
76
preexisting oral diabetes regimen and followed them an average of 34.5 months, with only 2 subjects lost to followup in each group. The primary combined endpoint included all-cause mortality, non-fatal myocardial infarction (including silent myocardial infarction), stroke, acute coronary syndrome, endovascular or surgical intervention in the coronary or leg arteries, and amputation above the ankle. There were no differences between groups for the primary endpoint (HR 0.90, 95%CI 0.80-1.02). The secondary combined endpoint included all-cause mortality, non-fatal myocardial infarction, and stroke. Subjects given pioglitazone had a 16% decreased likelihood of having the secondary endpoint compared with placebo (HR 0.84, 95% CI 0.72 to 0.98). Therefore, the investigators stopped the study early. When evaluating all-cause mortality alone, there was no statistically significant difference between pioglitazone and placebo. This may have been due to lack of completion of the study as planned or truly no differences exist.185 One other smaller study randomized patients already on existing oral diabetes medications to pioglitazone or placebo, and followed them for 6 months to elucidate mechanisms behind in-stent restenosis rates in the two arms. This study reported that there were no deaths in either arm.151
Alpha-glucosidase inhibitors versus placebo/diet. In the Van de Laar et al. review,
acarbose and miglitol only had 2 studies each evaluating mortality with no statistically significant difference compared with placebo, yet few deaths occurred.38
Non-RCTs and Cohorts Metformin or second generation sulfonylureas versus placebo/diet. Three cohort studies
compared mortality indirectly between metformin and a second generation sulfonylurea, showing second generation sulfonylureas to generally have increased mortality compared with placebo/diet in 2 out of 3 studies, yet no increase in mortality for metformin compared with placebo/diet in all 3 studies.14, 186, 187 One retrospective cohort study (mean followup 4.8 years) using the Saskatchewan claims database of 5,795 Canadian diabetic subjects with prescription benefits showed increased mortality when comparing high dose glyburide to low dose glyburide while reporting no differences in mortality for high dose metformin compared with low dose metformin, after adjusting for age, sex, chronic disease score, nitrate use, hospital visits, and physician visits.14 A prospective cohort study of 2,275 Israeli subjects with diabetes and proven coronary artery disease (mean followup of 7.7 years) showed a 22% increased risk of mortality in 953 patients on glyburide compared with diet (HR 1.22, 95% CI 1.02 to 1.45), while there was a 26% increased risk of mortality in 79 patients on metformin compared with diet (HR 1.26, 95% CI 0.81 to 1.96), after adjustment for confounders.186 A third prospective cohort of 447 diabetic subjects in a New Zealand clinic were followed 10 years with a 6.3% loss to followup.187 It showed no significant increases in mortality for metformin or for an unspecified second generation sulfonylurea compared with diet.187
Metformin plus second generation sulfonylureas versus placebo/diet. A prospective
cohort study of 2,275 Israeli subjects with diabetes and proven coronary artery disease (mean followup of 7.7 years) showed a 53% increased risk of mortality in 253 patients on combination second generation sulfonylurea plus metformin compared with diet (HR 1.53, 95% CI 1.20 to 1.96), after adjustment for confounders.186 An additional prospective cohort of 447 diabetic subjects in a New Zealand clinic was followed 10 years with a 6.3% loss to followup.187 It
77
showed no significant increases in mortality for metformin plus an unspecified second generation sulfonylurea compared with diet.187 Cardiovascular Disease Mortality Key points
● Combination effects of metformin with a second generation sulfonylurea on cardiovascular mortality compared with second generation sulfonylurea or metformin monotherapy were not clear.
• Metformin effects on cardiovascular mortality compared with second generation
sulfonylurea were unclear. • Relatively little evidence exists on the comparative effectiveness of other oral diabetes
medications in terms of cardiovascular mortality.
Evidence grades (see Appendix F, Evidence Table 17)
• The evidence was graded very low or very low to low for the following comparisons: metformin versus second generation sulfonylureas, pioglitazone versus second generation sulfonylureas, metformin plus second generation sulfonylurea versus second generation sulfonylurea or metformin monotherapy, thiazolidinediones versus metformin, and meglitinides versus second generation sulfonylureas.
• The evidence was graded insufficient for all other comparisons.
Direct comparison results (see Appendix F, Evidence Tables 20 and 21)
RCTs. We had insufficient data to support meaningful quantitative pooling of the data for each comparison.15, 54, 77, 88, 96, 101, 103, 112, 124, 126 UKPDS had the longest duration of all of the RCTs with less than 5% of subjects lost to followup. In the median 6.6 year followup of UKPDS, they directly compared early addition of metformin to second generation sulfonylurea versus continuation of second generation sulfonylurea; subjects in the early addition of metformin to second generation sulfonylurea arm were 1.79 times more likely to have a fatal myocardial infarction than those subjects on second generation sulfonylurea monotherapy (95% CI, 0.64 to 4.99). Similar results were found when evaluating sudden death and fatal stroke.15
Non-RCTs and Cohorts Metformin versus second generation sulfonylureas. A prospective cohort study of 2,275
Israeli subjects with diabetes and proven coronary artery disease (mean followup of 7.7 years) showed a slightly higher age-adjusted cardiovascular mortality rate of 30 per 1000 person-years for metformin compared with 24.5 per 1000 person-years for glyburide.186 One 5-year retrospective Canadian cohort (reported in 2 articles) compared cardiovascular mortality in 8,886 new users of metformin with an unspecified second generation sulfonylurea (no diabetes
78
prescription in the past year and had prescription benefits).12, 13 They showed a significant 16% decreased risk of cardiovascular death for metformin users compared with second generation sulfonylurea users, after adjusting for age, sex, nitrate use, and a modified chronic disease score.12 In the second article using the same database, they showed a 24% decreased risk of cardiovascular death in the metformin arm compared with the second generation sulfonylurea arm (HR 0.76, 95% CI 0.58 to 1.00), using a propensity score, age, sex, nitrate use, and a modified chronic disease score to adjust.13
We found an additional important 5-year retrospective cohort study published after our search was completed which used medical records, prescription databases, and the General Registrar to obtain data on diabetic patients in Scotland.180 They reported increased cardiovascular mortality for the 3,331 subjects taking second generation sulfonylurea compared with 2,286 subjects taking metformin (RR 1.70, 95% CI 1.18 to 2.45) after adjusting for an extensive number of confounders.
Second generation sulfonylurea versus other. Two cohort studies favored second
generation sulfonylurea over other oral diabetes medications for in-hospital cardiovascular mortality after recent cardiac events.10, 11 One retrospective cohort compared in-hospital mortality rates after acute myocardial infarction post-angioplasty in 185 patients taking glibenclamide compared with diabetic patients taking other oral diabetes medications.10 The study found a higher risk of death in patients taking other oral diabetes medications compared with taking glibenclamide (OR 2.53, 95% CI 1.13 to 5.67).10 All of these deaths were due to cardiovascular causes (either pump dysfunction or arrhythmia).10 Another study evaluated 232 diabetic patients after admission to the coronary care unit without adjusting for potential confounders. They found greater in-hospital deaths from arrhythmia in the non-glibenclamide group (11% vs 0%), yet a higher rate of death from reinfarction (0% vs 8%) or cardiac rupture (0% vs 8%) in the glibenclamide groups.11
Second generation sulfonylurea or metformin versus metformin plus second generation
sulfonylureas. Four cohort studies (reported in 5 publications) compared metformin or second generation sulfonylurea with combinations of metformin plus second generation sulfonylurea generally showing worse cardiovascular outcomes with combination therapy compared with monotherapy; however, confounding by indication may be an issue in several of these studies.13,12, 178, 180, 186 One 5-year retrospective Canadian cohort (reported in 2 publications) compared cardiovascular mortality in 8,886 new users of metformin plus second generation sulfonylurea with an unspecified second generation sulfonylurea (no diabetes prescription in the past year and had prescription benefits).12, 13 They showed a significant 30-40% decreased risk of cardiovascular death in the combination arm compared with the second generation sulfonylurea arm, after adjusting for age, sex, nitrate use, and a modified chronic disease score.13,12
A prospective cohort study of 2,275 Israeli subjects with diabetes and proven coronary artery disease (mean followup of 7.7 years) showed a similar age-adjusted cardiovascular mortality rate of 31.2 per 1000 person-years for the combination of metformin plus a second generation sulfonylurea compared with 30 per 1000 person-years for metformin, and slightly higher than the glyburide monotherapy arm of 24.5 per 1000 person-years.186
Another 6-year retrospective cohort study of 2,348 new users of oral diabetes medications derived from medical record abstraction in 2 primary health care centers and 2 private practices
79
in Sweden showed an increased risk of fatal stroke and fatal ischemic heart disease in patients who were using combination therapy versus an unspecified second generation sulfonylurea alone using the Swedish mortality register, after adjustment for multiple confounders: age, sex, study srea, year of inclusion, BMI, glycemic control, and duration of diabetes.178
We found an additional important 5-year retrospective cohort study published after our search was completed which used medical records, prescription databases, and the General Registrar to obtain data on diabetic patients in Scotland.180 They reported an increased mortality for the 985 subjects taking metformin with later addition of second generation sulfonylurea compared with the 2,286 subjects taking metformin (RR 2.29, 95% CI 1.45 to 3.61) after adjusting for extensive confounders. Additionally, they reported an increased mortality for the 1252 subjects taking second generation sulfonylurea with later addition of metformin compared with the 2,286 subjects taking metformin (RR 2.43, 95% CI 1.61 to 3.66). Comparisons between drug and placebo/diet (see Appendix F, Evidence Tables 20 and 21)
RCTs Thiazolidinedione versus placebo/diet. One short duration RCT compared rosiglitazone
versus placebo added to existing oral diabetes medications, and found 1 fatal myocardial infarction in the high dose rosiglitazone arm compared with no deaths in any other study arm.188
Metformin or second generation sulfonylureas versus placebo/diet. After a median
duration of 10.7 years in UKPDS, overweight subjects randomized to metformin showed no difference in fatal myocardial infarction compared with subjects on diet therapy alone (RR 0.50, 95% CI 0.23 to 1.09).15 This also held true for sudden death and fatal stroke. Subjects on glibenclamide showed no difference in fatal myocardial infarction compared with subjects on diet therapy alone (RR 0.82, 95% CI 0.51 to 1.33).16 This also held true for sudden death and fatal stroke. Therefore, metformin appeared to be similar in effects on cardiovascular mortality compared with glibenclamide. Similar to UKPDS, four other shorter duration RCTs compared either metformin or second generation sulfonylureas with placebo finding similar numbers of subjects with cardiovascular mortality in each group.88, 96, 150, 189
Meglitinides versus placebo. Three RCTs compared meglitinides with placebo, showing
similar events between-groups.96, 139, 190 Two of the three RCTs reported one cardiovascular death in the arm with meglitinides versus no events in the placebo arms139, 190 while one study had no deaths in either arm.96
Non-RCTs and Cohorts Metformin or second generation sulfonylureas compared with placebo/diet or high-dose
versus low-dose. Two cohort studies showed conflicting results.14, 187 One retrospective cohort study (mean followup 4.8 years) using the Saskatchewan claims’ database of 5,795 Canadian diabetic subjects with prescription benefits showed increased cardiovascular mortality when comparing high dose glyburide to low dose glyburide while reporting no differences in cardiovascular mortality for high dose metformin compared with low dose metformin, after adjusting for age, sex, chronic disease score, nitrate use, hospital visits, and physician visits.14 A
80
prospective cohort of 447 diabetic subjects in a New Zealand clinic were followed 10 years with a 6.3% loss to followup.187 They showed no significant increases in cardiovascular mortality for metformin or for an unspecified second generation sulfonylurea compared with diet.187
Metformin plus second generation sulfonylureas versus placebo/diet. A prospective
cohort of 447 diabetic subjects in a New Zealand clinic was followed 10 years with a 6.3% loss to followup.187 They showed no significant increases in cardiovascular mortality for metformin plus an unspecified second generation sulfonylurea compared with diet.187 Cardiovascular Morbidity Key points
• There were too few studies to support any conclusions about how cardiovascular morbidity differed between the medications.
• Only pioglitazone and metformin improved cardiovascular morbidity when compared
with placebo/diet (1 study each, PROactive and UKPDS). Evidence grades (see Appendix F, Evidence Tables 17)
• The evidence was graded very low or very low to low for the following comparisons: metformin versus second generation sulfonylureas, pioglitazone versus second generation sulfonylureas, metformin plus second generation sulfonylurea versus second generation sulfonylurea or metformin monotherapy, thiazolidinediones versus metformin, and meglitinides versus second generation sulfonylureas.
• The evidence was graded insufficient for all other comparisons.
Direct comparison results (see Appendix F, Evidence Tables 22 and 23)
This group of studies used inconsistent definitions of cardiovascular morbidity and mortality, but most relied on standardized methods for outcome assessment such as standardized diagnosis codes and/or death certificate data. We will discuss cerebrovascular disease together with coronary heart disease due to the limited number of studies and similar etiologies of disease.
RCTs Thiazolidinediones versus second generation sulfonylureas. Two RCTs comparing a
thiazolidinedione with a second generation sulfonylurea reported similarly small numbers of subjects (<10) with nonfatal myocardial infarction or heart disease in the two groups, ranging from 0% to 8.7% in the thiazolidinedione group versus 4.5% to 5% in the second generation sulfonylurea groups.54, 67
Thiazolidinediones versus metformin. Three RCTs (reported in 4 publications) of a
thiazolidinedione and metformin reported similar numbers of subjects with nonfatal myocardial
81
infarction or heart disease in both groups. Two studies reported no cases in the thiazolidinedione groups versus 0 to 1 cases in the metformin groups, 54, 58, 143 and one large study (N=639) reported 3.1% in the pioglitazone group versus 4.1% in the metformin group.60
Metformin versus second generation sulfonylureas. Two RCTs of a metformin compared
with a second generation sulfonylurea showed similar cardiac events in both groups (N<4), ranging from 0% to 5% in the metformin groups compared with 4.5% to 9% in the second generation sulfonylurea groups.54, 87
Second generation sulfonylureas versus metformin plus second generation
sulfonylureas. UKPDS compared the combination of early metformin added to an unspecified second generation sulfonylurea with a second generation sulfonylurea arm. After 6.6 years of followup, the study found no difference in nonfatal myocardial infarction, coronary heart disease, and non-fatal stroke between these two groups.15 One 6-month RCT (N=106) was consistent with these results, showing similar numbers of cardiac events between second generation sulfonylurea monotherapy and combination therapy (9% vs 14%).87
Metformin versus other. Two studies lasting 1 to 4 years compared metformin with either
usual care or to a group where metformin was stopped, and found similar cardiac event rates in both groups.150, 176
Other comparisons. All other head-to-head medication comparisons only had 1 to 3 studies,
mostly showing similar event rates but with small numbers of outcomes.87, 96, 100-102, 105, 108, 116, 117,
191 Non-RCTs and Cohorts Thiazolidinedione versus thiazolidiendione. One study switched subjects on troglitazone
to either rosiglitazone or pioglitazone, and followed them for a mean of 3.2 months mainly evaluating more proximal clinical measures such as HbA1c. They reported similar cardiovascular disease in both groups, with one cerebrovascular event in the pioglitazone group compared with none in the rosiglitazone group.192
Metformin versus second generation sulfonylureas. One cohort study was consistent with
the results found in the two RCTs.13 This cohort study compared combined cardiovascular hospitalizations between metformin and an unspecified second generation sulfonylurea after a mean followup of 4.7 years. Metformin had a significant 22% decreased risk of cardiovascular hospitalizations, and a significant 16% decreased risk of a composite endpoint of all cardiovascular disease compared with second generation sulfonylureas.13 The study adjusted for age, race, nitrate use, chronic disease scores, and propensity scores based on the above covariates; however, they were unable to adjust for duration of diabetes or HbA1c. This may have affected their results since metformin was a newer oral diabetes medication compared with first and second generation sulfonylureas.
Metformin plus second generation sulfonylureas versus second generation
sulfonylureas. In the same cohort study, metformin plus second generation sulfonylurea was compared with second generation sulfonylurea monotherapy after a mean followup of 4.7 years
82
for combined cardiovascular hospitalizations, and showed no differences between groups after adjustment for multiple covariates.13
Second generation sulfonylureas versus other. Two cohort studies showed results similar
to the UKPDS.10, 11 One retrospective cohort compared rates of ventricular fibrillation, recurrent myocardial infarction, angioplasty plus secondary coronary artery disease, and coronary artery bypass graft surgery after acute myocardial infarction post-angioplasty in 185 patients taking glibenclamide compared with diabetic patients taking other oral diabetes medications.10 They reported no differences between groups except for recurrent angioplasty which was higher in the subjects taking other oral diabetes medications compared with glibenclamide (46.7% vs 17.8% respectively, p=0.05). Another study evaluated 232 diabetic patients after admission to the coronary care unit without adjusting for potential confounders. They found slightly greater in-hospital arrhythmias (ventricular fibrillation and/or supraventricular tachycardia) in the non-glibenclamide group compared with the glibenclamide group (15% vs 6%, p<0.05).11
Thiazolidinedione or metformin versus other. One retrospective cohort study of 24,953
Medicare beneficiaries evaluated a thiazolidinedione and/or metformin compared to other oral diabetes medications (not metformin and not thiazolidinediones) in diabetic patients one year after acute myocardial infarction using claims and medical record data.184 This study found similar cardiovascular outcomes (readmission for nonfatal myocardial infarction and coronary artery disease) comparing metformin and/or thiazolidinediones to other oral diabetes medications, after adjusting for age, race, sex, comorbidities from medical record abstraction, and clinical data from hospitalization such as blood pressure and lab data.184 Comparisons between drug and placebo/diet (see Appendix F, Evidence Tables 22 and 23)
RCTs Thiazolidinedione versus placebo/diet. Nine RCTs compared nonfatal cardiovascular
outcomes for thiazolidinediones versus placebo/control with differing results.77, 78, 143, 151, 165, 166,
170, 172, 185 The majority of these trials added the thiazolidinedione to an existing oral diabetes regimen. The PROactive study was the longest trial comparing the secondary prevention of cardiovascular events between pioglitazone and placebo added to existing oral diabetes regimens. This study showed no difference between pioglitazone and placebo in the nonfatal cardiovascular disease single endpoints, yet the study was stopped early due to a favorable effect of pioglitazone on the secondary combined outcome of all cause mortality, non-fatal myocardial infarction, or stroke, as compared with placebo.185
Three of the studies evaluating re-stenosis rates found that thiazolidinediones, when added on to existing oral diabetes regimens, were more efficacious than placebo/control in decreasing cardiovascular events for patients at high risk of secondary cardiovascular events. These studies showed re-stenosis rates of 7.7% to 19% in the thiazolidinedione arms compared with 38.2% to 57.1% in the placebo arms.77, 78, 151 The mechanism of the apparent beneficial effects of thiazolidinediones on re-stenosis rates is unclear but may relate to improved glycemic control,151 a decrease in inflammatory markers,77 or improved lipid levels.78
83
Lastly, five short duration RCTs comparing thiazolidinediones with placebo showed a similar percent of subjects with cardiovascular events, ranging from 0% to 6% in the thiazolidinedione groups compared with 0% to 6.3% in the placebo groups.143, 165, 166, 170, 172
Metformin versus placebo/diet. Four RCTs evaluated metformin versus placebo or diet for
nonfatal cardiovascular outcomes.15, 96, 143, 155 After 10 years, the UKPDS found that metformin had a 39% decreased risk of the combined endpoint of fatal and nonfatal myocardial infarction compared with diet, (RR 0.61; 95% CI 0.41 to 0.89). For the endpoint of nonfatal myocardial infarction, metformin had a 31% decreased risk (RR 0.69; 95% CI 0.35 to 1.34). UKPDS also showed a 41% decreased risk of stroke compared with diet (RR 0.59; 95% CI 0.29 to 1.18).15 Three shorter duration RCTs (26 weeks and 2 years) comparing metformin with placebo or diet reported 1 subject in each of the metformin groups with a cardiac event while no cases were reported in the placebo or diet groups.96, 143, 155
Second generation sulfonylureas versus placebo/diet. UKPDS showed no difference in
cardiovascular outcomes after 10 years between glibenclamide and diet; however, there was a non-significant 26% decreased risk of nonfatal myocardial infarction compared with diet.16 One other shorter duration RCT showed similar results to the UKPDS for stroke outcomes.193
Meglitinides versus placebo/diet. Similar cardiovascular event rates were found in the 2
RCTs comparing meglitinides with placebo or diet.96, 194 Alpha-glucosidase inhibitors versus placebo/diet. In the Van de Laar et al., systematic
review, no studies were found that evaluated cardiovascular morbidity.38 In our review, we only found one RCT comparing acarbose with placebo and showed similar cardiovascular event rates between groups.138
Non-RCTs and Cohorts
Second generation sulfonylureas versus placebo/diet. One cohort study found that the incidence of prolonged QTc intervals was greater with glibenclamide than diet after 2 years of followup.195 However, patients placed on glibenclamide may have had more severe diabetes than those placed on diet alone, so results must be interpreted with caution. Peripheral Vascular Disease Key points
• No evidence existed that showed a difference between oral diabetes medications in their effects on peripheral vascular disease.
Evidence grades (see Appendix F, Evidence Table 17)
• The evidence was graded very low for the following comparisons: metformin versus second generation sulfonylureas, thiazolidinediones versus second generation
84
sulfonylureas, metformin plus second generation sulfonylurea versus metformin monotherapy, and thiazolidinediones versus metformin.
• The evidence was graded insufficient for all other comparisons.
Direct comparison results (see Appendix F, Evidence Table 24
RCTs Second generation sulfonylureas versus metformin plus second generation
sulfonylureas. UKPDS compared early addition of metformin to a second generation sulfonylurea compared with second generation sulfonylurea alone after 6.6 years of followup, and showed no difference between groups in peripheral vascular disease outcomes (RR 2.12, 95% CI 0.19 to 23.3).15 Comparisons between drug and placebo/diet (see Appendix F, Evidence Table 24)
RCTs Metformin or second generation sulfonylureas versus placebo/diet. After a median
followup of 10 years in UKPDS, glibenclamide showed no difference in amputation or death from peripheral vascular disease compared with placebo (RR 0.48, 95% CI 0.17 to 1.31)16 and metformin showed no difference compared with diet on peripheral vascular disease (RR 0.74, 95% CI 0.26 to 2.09).15 However, there were very few amputations or deaths due to peripheral vascular disease in UKPDS which hindered the ability to identify a difference in the above comparisons. The biggest problem in comparing arms of UKPDS indirectly was the heterogeneity between the study groups. The metformin group was all overweight while the glibenclamide arm included overweight and normal weight individuals.
Thiazolidinediones versus placebo/diet. The PROactive study was a one-year RCT that
found no difference in limb amputation or peripheral revascularization procedures for the pioglitazone group compared with placebo.185 One additional short duration RCT noted one adverse event of peripheral ischemia with rosiglitazone compared with none with placebo.188
Alpha-glucosidase inhibitor comparisons. In a systematic review by Van de Laar et al., no
studies were found reporting on peripheral vascular disease outcomes for acarbose.38 Retinopathy Key points
• Only metformin and second generation sulfonylureas were evaluated for retinopathy outcomes. No evidence existed that showed a difference between oral diabetes medications in their effects on retinopathy.
85
• Glibenclamide decreased the need for photocoagulation, and had a protective effect on the combined microvascular outcomes (retinopathy plus nephropathy) compared with diet alone in UKPDS.
• Metformin showed no significant effect on retinopathy outcomes compared with diet
alone in UKPDS. Evidence grades (see Appendix F, Evidence Table 17)
• The evidence was graded very low or very low to low for the following comparisons: metformin versus second generation sulfonylureas, thiazolidinediones versus second generation sulfonylureas, metformin plus second generation sulfonylurea versus metformin monotherapy, and thiazolidinediones versus metformin.
• The evidence was graded insufficient for all other comparisons.
Direct comparison results (see Appendix F, Evidence Table 25)
RCTs Second generation sulfonylureas versus second generation sulfonylureas. Two RCTs
compared one second generation sulfonylurea with another. In a well designed 24-week trial, glibenclamide was compared with gliclazide.133 On fundoscopic exam, there was no significant difference in improvement rates in existing retinopathy between the two groups. The gliclazide group, however, had a significantly smaller number of aggravated cases of retinopathy, with 11% versus 3%.
In a small, unblinded study of 60 subjects196 patients with mild retinopathy as defined by the authors (scored a 1 on a scale from 0 to 5 points; corresponds to Scott classification Ia or II) at baseline and with diabetes for greater than five years were randomized to gliclazide, their current unspecified second generation sulfonylurea, or diet. The incidence rate increased by 7.1% in the gliclazide group as compared with a statistically significant increase of 13.6% in the unspecified second generation sulfonylurea group. Severity of retinopathy was also worse in the “current” second generation sulfonylurea group as compared with the gliclazide group. There was a statistically significant increase in preproliferative retinopathy incidence in the “current” second generation sulfonylurea group as compared with the gliclazide group.
Second generation sulfonylureas versus metformin plus second generation
sulfonylureas. UKPDS showed no significant differences in retinopathy outcomes between the second generation sulfonylurea and second generation sulfonylurea plus metformin group after 6.6 years of followup.15 The UKPDS also compared early addition of metformin to second generation sulfonylurea versus second generation sulfonylurea monotherapy for the combined microvascular outcome (nephropathy and retinopathy) and found no significant differences between groups.15
86
Metformin versus other. One study compared retinopathy rates in a group on metformin to a group where metformin was stopped while other oral diabetes medications were continued. After four years, no significant differences were found between groups.150 Comparisons between drug and placebo/diet (see Appendix F, Evidence Table 25)
RCTs Metformin or second generation sulfonylureas versus placebo/diet. The UKPDS is the
longest RCT evaluating metformin and second generat ion second generation sulfonylureas. It reports on direct and indirect comparisons of retinopathy outcomes for conventional diet therapy, metformin, chlorpropamide, glibenclamide, insulin, or a second generation sulfonylurea given with metformin.15, 16 The metformin group had a lower rate of progression to retinopathy than the conventional group (diet arm) at 9 years, but there were no significant differences at twelve years.15 The risk for retinopathy requiring photocoagulation (RR 0.69, 95% CI 0.34 to1.39), and vitreous hemorrhage, (RR 0.75, 95% CI 0.07 to 7.62), decreased with metformin compared with conventional treatment. The glibenclamide group showed a non-significant decrease in vitreous hemorrhages, and a statistically significant reduction in the need for photocoagulation compared with conventional treatment.16 The UKPDS also combined retinopathy and nephropathy into a combined microvascular disease outcome and reported a significantly decreased risk of microvascular disease with glibenclamide compared with diet (RR 0.66, 95% CI 0.47 to 0.93). The UKPDS also compared metformin with diet and found no significant differences between groups for the combined microvascular outcome.15 In a small, unblinded study of 60 subjects,196 patients with mild retinopathy as defined by the authors (scored a 1 on a scale from 0 to 5 points; corresponds to Scott classification Ia or II) at baseline and with diabetes for greater than five years were randomized to gliclazide, their current unspecified second generation sulfonylurea, or diet. The incidence of mild retinopathy increased by 7.1% in the gliclazide group as compared with a statistically significant increase of 13.6% in the unspecified second generation sulfonylurea group, and a 21.7% increase in the diet group. Additionally, there was a statistically significant greater increase in preproliferative retinopathy incidence in the diet group when compared with the “current” second generation sulfonylurea group. Nephropathy Key points
• Insufficient data existed to draw firm conclusions about the comparative effectiveness of oral diabetes medications in slowing the development of nephropathy.
• Pioglitazone showed similar effects on nephropathy compared with second generation
sulfonylureas in 3 short duration RCTs, and showed greater improvements in proteinuria when compared with metformin in 2 short duration RCTs.
87
Evidence grades (see Appendix F, Evidence Table 17)
• The evidence was graded very low or very low to low for the following comparisons: metformin versus second generation sulfonylureas, thiazolidinediones versus second generation sulfonylureas, metformin plus second generation sulfonylurea versus metformin monotherapy, and thiazolidinediones versus metformin.
• The evidence was graded insufficient for all other comparisons.
Direct comparison results (see Appendix F, Evidence Table 26)
RCTs Thiazolidinedione versus second generation sulfonylureas. Three RCTs lasting 3 months
to one year compared thiazolidinediones with second generation sulfonylureas showing no differences between groups in albuminuria or proteinuria.62, 64, 66 Two of these studies showed no significant differences between treatment groups.62, 66 The other study showed a significant decrease in albuminuria in the pioglitazone arm with a non-significant decrease in the comparator arm.64 Two of these studies had higher doses in the thiazolidinedione arms compared with the second generation sulfonylurea arms.64, 66
Thiazolidinedione versus metformin. Two RCTS with comparably-dosed drugs56, 60
reported a significant difference in the decline in urinary albumin-to-creatinine ratio favoring pioglitazone compared with metformin, after 11-12 months of treatment.
Thiazolidinedione versus alpha-glucosidase inhibitors. One 3-month RCT with
comparably-dosed drugs64 reported a significant decline in proteinuria in the pioglitazone arm with no significant change in the voglibose arm.
Metformin versus second generation sulfonylureas. In a 3-month RCT with comparably-
dosed drugs, microalbuminuria decreased with metformin compared with a significant increase with glibenclamide.85 Additionally, metformin maintained glomerular filtration rates (GFR) while the glibenclamide arm showed a significant increase in GFR.85
Metformin versus other. A lower percent change from baseline for urinary albumin-to-
creatinine ratio and serum creatinine was noted when metformin was continued compared with stopping metformin, but there was no significant difference between groups at 4 years of followup.150 In a comparison of metformin to extended release metformin, two people on metformin developed proteinuria and one person withdrew due to this, compared with none with extended release metformin.105
Second generation sulfonylureas versus metformin plus second generation
sulfonylureas. In UKPDS, no significant differences were seen in renal failure or death from renal disease between groups comparing second generation sulfonylurea with metformin added early to a second generation sulfonylurea after 6.6 years of followup.15
88
Second generation sulfonylureas versus alpha-glucosidase inhibitor. One RCT with comparably-dosed drugs compared glibenclamide with voglibose. The author reported that both groups showed little change in proteinuria from baseline.64 Comparisons between drug and placebo/diet (see Appendix F, Evidence Table 26)
RCTs Metformin or second generation sulfonylureas versus placebo/diet. UKPDS combined
nephropathy into a microvascular complications group that also included retinopathy as noted above. Among obese patients, there was no significant difference in the proportion of subjects with a urinary albumin above 50 mg/L in the metformin arm versus the diet arm. Renal failure and death from renal disease occurred infrequently in both groups and there were no statistically significant differences between the two arms. Additionally, no significant differences were seen in renal failure or death from renal disease between groups in the UKPDS comparing glibenclamide with conventional diet treatment.16
Thiazolidinedione versus placebo/diet. Both the 2 mg per day and 4 mg per day arms of the
rosiglitazone study showed a statistically significant reduction from baseline in the urinary albumin-to-creatinine ratio compared with placebo which showed a slight increase.169 There was no overlap in 95% CIs for the highest dose of rosiglitazone compared with placebo.169 A second short duration RCT showed no significant differences between pioglitazone and placebo. 163 Neuropathy Key points
• Too few comparisons existed to compare the effects of different oral diabetes medications on neuropathy outcomes.
• Most of the studies that had data on this outcome did not define neuropathy adequately. Evidence grades (see Appendix F, Evidence Table 17)
• The evidence was graded very low or very low to low for the following comparisons: metformin versus second generation sulfonylureas, thiazolidinediones versus second generation sulfonylureas, metformin plus second generation sulfonylurea versus metformin monotherapy, and thiazolidinediones versus metformin.
• The evidence was graded insufficient for all other comparisons.
Direct comparison results (see Appendix F, Evidence Table 27)
RCTs. Two studies evaluated withdrawals due to neuropathy.102, 105 One study reported one withdrawal due to neuropathy from the metformin arm compared with no drop-outs due to neuropathy in the metformin and rosiglitazone combination arms.102 Another study reported one

89
withdrawal from one of the extended release metformin arms due to neuropathy compared with no neuropathy drop-outs in the immediate release metformin arm.105 Comparisons between drug and placebo/diet (see Appendix F, Evidence Table 27)
RCTs Metformin or second generation sulfonylureas versus placebo. We were unable to report
comparative UKPDS results for the outcome of neuropathy as, these results were reported by conventional (diet arm) versus intensive treatment (chlorpropamide, glibenclamide or insulin use) and did not break down outcomes further by medication type.
One RCT148 excluded patients with neuropathy, and then randomized half of the 120 patients to diet plus placebo and the other half to diet plus metformin. After four months, sympathovagal balance was assessed by heart rate variability. The metformin group showed a significant improvement compared with placebo. Study Quality (see Appendix F, Evidence Table 28)
Of the 55 RCTs that addressed Key Question 2, only 12 described the randomization process. The majority of the studies (62%), were double-blinded, yet only half of the double-blinded studies described the steps taken to ensure blinding or mentioned the words active placebo or double dummies in their methods. Reasons for withdrawals or losses to followup were accounted for in 43 of the 55 randomized studies. Overall, 31% of the studies had a quality score of 4 or higher while only 9% had a score of 1. Key Limitations
Data on Key Question 2 were relatively sparse. Meta-analysis was limited by the short duration of studies, small numbers of events, and lack of reporting on cardiovascular outcomes in many trials, even to state that there were none. Outcomes for cardiovascular morbidity and microvascular outcomes were reported in a heterogeneous manner, and patient populations differed in their history of heart disease. Microvascular disease outcomes such as retinopathy, nephropathy, and neuropathy were mainly reported as secondary or tertiary outcomes, not the primary endpoint. Even when microvascular disease was a primary endpoint of studies, the outcome measures were usually just surrogate measures.
While half the studies were RCTs, many of the comparisons came from cohort studies that used different statistical adjustments, enrolled different patient populations, and evaluated outcomes differently. Additionally, cohort studies many times did not adjust for key confounders such as duration of diabetes and glycemic control due to the problems inherent in capturing this data. Furthermore, there may be confounding by indication in many of the cohorts. For instance, subjects on metformin plus a second generation sulfonylurea are more likely to have worse diabetes than subjects on monotherapy. Therefore, combination medications of metformin plus second generation sulfonylurea may appear worse than monotherapy, when it is truly reflective of worse diabetes. Subjects on second generation sulfonylurea monotherapy may have had diabetes longer than subjects on metformin monotherapy in cohort studies making second generation sulfonylureas appear worse.
90
We relied heavily on the UKPDS which is the largest and longest RCT, yet this study had several limitations. This RCT had few long-term events; therefore, making it difficult to draw conclusions due to wide confidence intervals except for combined outcomes. Additionally, they compared metformin and glibenclamide with placebo, yet metformin was only used in obese subjects while glibenclamide was used in obese and non-obese subjects. Since obesity is a known risk factor for cardiovascular disease and may be associated with other comorbidities, conclusions on comparative effectiveness between glibenclamide and metformin must be viewed with caution. The PROactive study was another large, double-blind RCT that described withdrawals, yet it was stopped early leaving the reader with questions regarding their primary endpoint results. Additionally, lack of reporting by some RCTs on withdrawals may have led to underreporting of some events. Key Question 3: Do oral diabetes medications for the treatment of adults with type 2 diabetes differ in their ability to influence other health outcomes including quality of life and functional status? Study Design and Population Characteristics Five RCTs evaluated the effects of oral diabetes medications on health-related quality of life.101, 124, 161, 197, 198 Three were conducted in the U.S. while two were international multi-country studies. Four of the studies received support from a pharmaceutical company. Almost all the studies excluded subjects with a prior history of coronary artery disease. One study excluded subjects who had previously taken oral diabetes medications.197 Most participants were middle-aged obese men, although women constituted up to 45% of the population in some studies. The mean duration of diabetes ranged from 3 to 7 years. Most of the subjects were Caucasian; in one study, about 70% of subjects were of Asian ancestry (see Appendix F, Evidence Tables 29 and 30). These study population characteristics were similar to the general population of patients with diabetes.50 Quality of Life Key points
• The small number of studies and the use of different questionnaires across studies made it difficult to draw firm conclusions regarding the effects of oral diabetes medications on health-related quality of life.
Evidence grades (see Appendix F, Evidence Table 4)
• The evidence was graded insufficient for all comparisons on quality of life.
91
Direct and placebo-controlled trial results (see Appendix F, Evidence Table 31)
Two head-to-head trials and three placebo-controlled RCTs evaluated the effects of oral diabetes medications on health-related quality of life.101, 124, 161, 197, 198 They used different tools to measure quality of life such as the Diabetes Treatment Satisfaction Questionnaire, Well-being Questionnaire, Medical Outcomes Study Short Form-36, Visual Analog Scales (VAS), and others. In one study, five visual analogue scales measured perceived health, mental and emotional health, symptom distress, cognitive functioning and general health perceptions.198 On the overall visual analog scales, subjects taking extended release glipizide scored significantly better than subjects taking placebo.198 Another study evaluated the satiety and hunger visual analogue scale.161 Subjects taking pioglitazone scored no different than placebo on this scale.161 On the Diabetes Treatment Satisfaction Questionnaire, subjects taking repaglinide scored significantly better than subjects taking placebo; subjects taking metformin plus rosiglitazone scored significantly better than subjects taking metformin; and subjects taking glipizide plus rosiglitazone scored significantly better than subjects taking glipizide.101, 124, 197
Study Quality (see Appendix F, Evidence Table 32)
All five studies were randomized, and four of the five described their randomization technique.197 All studies reported that they were double-blind but only two studies described the double-blinding technique or mentioned active placebos or double dummies in their methods section.197 Most studies described the number and reasons for withdrawals. Key Limitations
While validated quality of life questionnaires were used in most of these studies, the studies
used different questionnaires making it difficult to compare medications. Overall, the data on the quality of life effects of oral diabetes medications were sparse. Key Questions 4 and 5: Do oral diabetes medications for the treatment of adults with type 2 diabetes differ in terms of risk of the following life-threatening adverse events: life-threatening hypoglycemia leading to emergency care or death; liver failure; CHF; severe lactic acidosis; cancer; anemia, thrombocytopenia, or leucopenia requiring transfusion; and allergic reactions leading to hospitalization or death? Do oral diabetes medications for the treatment of adults with type 2 diabetes differ in their safety for the following adverse events that are not life-threatening: hypoglycemia requiring any assistance; elevated aminotransferase levels; pedal edema;
92
hypervolemia; anemia, thrombocytopenia, and leucopenia not requiring transfusion; mild lactic acidosis; and GI problems? Study Design and Population Characteristics
About two-thirds of the studies on Key Questions 4 and 5 were RCTs, with cohort studies comprising most of the research. Very few studies were non-randomized trials, cross-sectional studies, or case-control studies. The studies occurred in many different countries with the majority involving the U.S. or Europe. Greater than half had support from a pharmaceutical company. Study duration varied widely from 3 months to greater than ten years. Most participants were middle-aged to older overweight or obese adults. Most studies had slightly more men than women, and had mostly Caucasian representation. Duration of diabetes varied widely from 1 year to 15 years, and mean baseline HbA1c levels were usually between 7% and 9% with a few outliers. Most RCTs excluded people with significant cardiovascular, hepatic, or renal disease (see Appendix F, Evidence Tables 33 and 34). These study population characteristics were similar to the general population of patients with diabetes.50 Hypoglycemia Key points
• Thiazolidinediones caused less hypoglycemia than second generation sulfonylureas. • Metformin was associated with less hypoglycemia compared with second generation
sulfonylureas (glyburide or glimepiride).
• Using indirect comparisons, metformin and thiazolidinediones had a similar incidence of hypoglycemia. This was consistent with the few head-to-head trials.
• Glyburide/glibenclamide caused hypoglycemia more often than other second generation
sulfonylureas. • Repaglinide had similar numbers of subjects with hypoglycemia compared with second
generation sulfonylureas.
• Using indirect comparisons, repaglinide was associated with higher hypoglycemia rates when compared with thiazolidinediones and metformin. This was consistent with the two direct comparisons of repaglinide with thiazoldinediones, while the one direct comparison of metformin with repaglinide showed no hypoglycemia in either group.
• Data were sparse on the comparisons of hypoglycemia between acarbose and other oral
diabetes medications, and between nateglinide and other oral diabetes medications.
93
• Combinations of metformin plus second generation sulfonylurea and second generation sulfonylurea plus thiazolidinedione had a higher incidence of hypoglycemia than metformin or second generation sulfonylurea monotherapy.
• The combination of metformin plus rosiglitazone had similar numbers of subjects with
hypoglycemia compared with metformin monotherapy.
• Few serious hypoglycemic events occurred in the RCTs of shorter duration, but were higher in the longer duration RCTs and the longer duration cohort studies.
• Second generation sulfonylurea monotherapy had a higher incidence of serious
hypoglycemia than metformin or thiazolidinedione monotherapy.
• The combination of metformin plus second generation sulfonylurea had a higher incidence of serious hypoglycemia compared with metformin monotherapy, and the combination of second generation sulfonylurea plus thiazolidinedione had a higher incidence of serious hypoglycemia compared with second generation sulfonylurea monotherapy.
• Too few comparisons existed to draw conclusions regarding serious hypoglycemia
among the other diabetes medications.
• As explained in the Methods section, we did not apply the evidence grade criteria to the evidence on the comparative risk of hypoglycemia associated with the medications because the criteria were designed for studies of efficacy not data on safety.
Direct comparison results (see Appendix F, Evidence Table 35)
RCTs Thiazolidinediones versus metformin. Only 2 RCTs compared the number of subjects with
hypoglycemia between thiazolidinediones and metformin. One study showed no hypoglycemic events.57 The other study comparing pioglitazone with metformin added these medications to second generation sulfonylureas and showed an incidence of hypoglycemia of 10.7% versus 14.1%, respectively.60 No serious events occurred in either study.
Thiazolidinediones versus second generation sulfonylureas. Five RCTs compared the
number of subjects with hypoglycemia between thiazolidinediones and second generation sulfonylureas, showing a pooled risk difference favoring the thiazolidinediones of -0.09 (95% CI -0.15 to -0.03) (see Figure 38).57, 63, 65, 67, 145 No single study markedly influenced the results. Heterogeneity tests were significant, yet no source of heterogeneity was identified through metaregression. Four studies reported no serious hypoglycemic events occurring in the thiazolidinedione groups, while 0 to 3 serious events occurred in the second generation sulfonylurea groups.57, 63, 67, 145
94
Thiazolidinedione plus metformin versus second generation sulfonylurea plus metformin. Similarly, one study compared metformin plus a thiazolidinedione with metformin plus a second generation sulfonylurea and reported a higher incidence of subjects with hypoglycemia in the arm with the second generation sulfonylurea.71
Thiazolidinediones versus meglitinides. Two RCTs compared thiazolidinediones with repaglinide, favoring the thiazolidinediones in both studies (range in percent difference between groups of -6 to -4%).73, 74
Other thiazolidinedione comparisons. One RCT reported no subjects with hypoglycemia in
the thiazolidinedione monotherapy arm compared with 1 subject in the combination arm (thiazolidinedione plus second generation sulfonylurea).76
Metformin versus second generation sulfonylureas. Ten RCTs (in 12 publications)
evaluated hypoglycemia comparing metformin with a second generation sulfonylurea (mostly glyburide and a few glimepiride studies).15, 57, 79-81, 84, 87-90, 92, 93 Three of these publications were arms of the UKPDS at 3-year, 6-year and 10-year followup with one arm at 6 years for the primary diet failure group and one arm for the main randomization group as described in more depth earlier in the report. All individual trials favored metformin over second generation sulfonylureas, except for a study with no reported subjects with hypoglycemia.90 The ten-year followup from UKPDS reported the proportion of subjects per year with hypoglycemia as 17.5% for the glibenclamide group overall (obese and non-obese subjects) compared with 4.2% in the metformin group (obese subjects).15 The proportion per year of subjects with major hypoglycemic events was 2.5% in the glibenclamide group (obese and non-obese subjects) and 0% in the metformin group (obese subjects).15 In three-year followup of UKPDS, the mean annual percent of obese subjects with hypoglycemia in the glibenclamide group was 26.8% versus 6.3% in the metformin group, and the mean annual percent of obese subjects with major hypoglycemic events was 1.3% for the glibenclamide group versus 0.5% for the metformin group.92 We pooled the shorter duration RCTs which favored metformin over second generation sulfonylureas, with a pooled risk difference of -0.04 (95% CI -0.09 to -0.003) (see Figure 39). No single study markedly influenced these results. Heterogeneity tests were significant, yet no source of heterogeneity was detected through metaregression. Removing Garber et al., reduced the heterogeneity, and slightly changed the pooled risk difference to -0.02 (95% CI -0.04 to 0.00). The study by Garber et al., was a high quality double-blind trial with no apparent differences from the other studies.80 These results support the results seen in the UKPDS favoring metformin; however, the absolute risk difference was lower than in UKPDS likely due to the differences in study duration and definitions of hypoglycemia. Additionally, one short duration RCT evaluated only the percent of subjects with serious hypoglycemic events and favored metformin (between-group difference of -14%).87 Metformin versus meglitinides. Two RCTs compared metformin with meglitinides (one repaglinide and one nateglinide), with no consistent effects. The study comparing repaglinide with metformin showed no subjects with hypoglycemia in either group after 12 weeks.97 The study comparing nateglinide with metformin showed a slightly lower incidence of hypoglycemia
95
in the metformin group (between-group difference -2.7%), yet they used submaximal doses of metformin.96
Metformin versus metformin plus second generation sulfonylureas. Nine RCTs (2 with 2 sub-arms, and one crossover study) evaluated the number of subjects with hypoglycemia comparing metformin with the combination of metformin and a second generation sulfonylurea, favoring metformin monotherapy with a pooled risk difference of -0.14 (95% CI -0.21 to -0.07) (see Figure 40).79-81, 84, 87-89, 95, 104 No single study markedly influenced the results. Heterogeneity tests were significant, yet no source of heterogeneity was identified with metaregression. Removing the study by Garber et al., reduced the heterogeneity, and slightly changed the pooled risk difference to -0.11 (95% CI -0.14 to -0.07). However, this was a high quality double-blind trial with no apparent clinical difference from the other studies.80 A few studies reported the number of subjects with serious or major events requiring help of a third party which was similar between groups, yet slightly favored the monotherapy arm (range in between-group differences 0 to 1.4%).84, 89, 104
Metformin versus metformin plus thiazolidinedione. Three short duration RCTs (1 with 2
sub-arms) compared metformin with the combination of metformin and a thiazolidinedione, showing no differences between groups with a pooled risk difference of 0.00 (-0.01 to 0.01) (see Figure 41).100, 101, 103 No single study markedly influenced the results. Heterogeneity tests were not significant. One study showed a dose-response gradient with higher numbers of subjects with hypoglycemia in the higher dose combination arm compared with monotherapy.103 No serious hypoglycemic events were reported.
Other metformin comparisons. One short duration RCT compared metformin immediate
release with extended release showing similar numbers of subjects with hypoglycemia.105 Second generation sulfonylureas versus second generation sulfonylureas. Glyburide or
glibenclamide had higher number of subjects with hypoglycemia than glimepiride, gliclazide, and glipizide in 6 studies (pooled risk difference 0.03 (95% CI 0.005 to 0.05)) (see Figure 42).107,
109, 112, 114, 133, 147 One trial reported no withdrawals in either group from hypoglycemia.110 Two additional RCTs compared two different types of second generation sulfonylureas with one another showing no clear differences between groups.106, 108
Second generation sulfonylureas versus meglitinides. We combined the five trials116, 117,
119-122 comparing the second generation sulfonylureas (mostly glyburide) to repaglinide in a meta-analysis which showed no differences in number of subjects with hypoglycemia between groups, with a pooled risk difference of 0.02 (95% CI -0.02 to 0.05) (see Figure 43). One additional RCT comparing nateglinide with second generation sulfonylurea reported only the number that withdrew due to hypoglycemia (0 vs 3, respectively), so we were unable to combine that in the meta-analysis.122 The number of participants that withdrew from these trials due to hypoglycemia showed no difference between groups, when reported.116, 119, 122 Only one RCT reported on serious or major events showing no events in either group.119 An additional 24 week open-label cross-over RCT was published since our search was completed, favoring repaglinide.199 This study evaluated episodes of symptomatic hypoglycemia and not numbers of subjects so we were unable to add this to our meta-analysis. They reported a higher incidence of
96
symptomatic hypoglycemic episodes (along with fingerstick glucose less than 60 mg/dL) in 88 elderly subjects (greater than 65 years of age) with glibenclamide compared with repaglinide (53 vs 24 episodes, p<0.0004). No serious hypoglycemic episodes occurred in either group.
Second generation sulfonylureas versus metformin plus second generation
sulfonylureas. Nine RCTs (2 with 2 sub-arms) compared hypoglycemia between a second generation sulfonylurea and the combination of a second generation sulfonylurea plus metformin, favoring second generation sulfonylurea monotherapy.79-81, 84, 87-89, 95, 129 Two articles describing UKPDS compared a second generation sulfonylurea (first and second generations combined) with a combination of a second generation sulfonylurea and metformin.15, 128 One article compared the rates after three years showing a mean annual rate of 2.5% for the second generation sulfonylurea group (chlorpropamide or glibenclamide) compared with a mean annual rate of 4.5% for the combination of second generation sulfonylurea and metformin.128 They also reported similar major hypoglycemic events for each arm (0 vs 1 case, respectively). The other article reported death from hypoglycemia as an outcome for the combination versus second generation sulfonylurea group, and reported no events in either group after 6.6 years.15 We pooled the eight similar RCTs (without UKPDS, since differences in study duration would affect the pooled risk estimate), and found that they were consistent with the UKPDS in showing a lower number of subjects with hypoglycemia in the second generation sulfonylurea arm compared with the combination of a second generation sulfonylurea and metformin (pooled risk difference was -0.11 (95% CI -0.14 to -0.07) (see Figure 44)).79-81, 84, 87-89, 95 No single study markedly influenced the results. Three studies favored the combination arms over the monotherapy arms,79, 87, 129 one of which we did not include in the meta-analysis129 because it compared the addition of metformin to an existing second generation sulfonylurea versus upward titration of the existing second generation sulfonylurea which may explain the higher incidence of hypoglycemia reported with the upward titration of second generation sulfonylurea arm.129 Only two of the shorter duration RCTs reported on the number of subjects with serious hypoglycemia showing a similar incidence between groups (range in between-group differences -1 to 0.6%).84, 89
Second generation sulfonylureas versus second generation sulfonylureas plus thiazolidinedione. Three RCTs compared second generation sulfonylurea with a combination of second generation sulfonylurea and thiazolidinedione, favoring second generation sulfonylurea monotherapy with a pooled risk difference of -0.08 (95% CI -0.15 to -0.0009) (see Figure 45).124-
126 Heterogeneity tests were significant, and dosing was a significant source of heterogeneity in metaregression. Removing the study by Rosenstock et al.,124 changed the confidence interval slightly to show no differences between groups; however, this was a high quality double-blind study similar to the other trials. Additionally, combination therapy had slightly higher rates of serious hypoglycemia compared with monotherapy in all three studies (range in between-group differences of -0.8 to -0.6%).
Alpha-glucosidase inhibitors comparisons. A systematic review by Van de Laar et al.,
reported total adverse events between acarbose and second generation sulfonylurea but did not break it down beyond GI effects.38 The few articles identified in addition to their review showed a similar effect on the number of subjects with hypoglycemia between metformin and acarbose99 and favored acarbose when compared with second generation sulfonylureas.130
97
Repaglinide versus nateglinide. One 16-week RCT with comparably-dosed drugs compared nateglinide with repaglinide showing a higher incidence of hypoglycemia in the repaglinide group (0 vs 7%).131
Non-RCTs or cohorts Thiazolidinedione versus other oral diabetes medications. One retrospective cohort study
in the elderly (>75 years old) compared pioglitazone (n=11), rosiglitazone (n=13), metformin (n=48), and second generation sulfonylureas (n=121) showing similar numbers of subjects with hypoglycemia for all groups except metformin which was lower (9.1%, 15.4%, 4.2%, and 14.9% respectively). However, about two-thirds of subjects taking pioglitazone were on additional medications, most of which were second generation sulfonylureas.200 Furthermore, the number of subjects taking thiazolidinediones were small (n=11 and 13) compared with metformin (n=48).
Metformin versus second generation sulfonylureas. Consistent with the RCT results, two
cohort studies also compared metformin with a second generation sulfonylurea and reported an incidence of subjects with hypoglycemia that favored metformin over the second generation sulfonylureas.200, 201 One retrospective cohort study in the elderly (>75 years old) in long-term care facilities compared metformin (n=48) with an unspecified second generation sulfonylurea (n=121), showing a higher incidence of hypoglycemia for the second generation sulfonylurea arm (4.2% vs 14.9%).200 The other cohort study compared cases of serious hypoglycemia between second generation sulfonylurea and metformin or diet, showing a higher incidence of serious hypoglycemia in subjects taking second generation sulfonylureas (0.9 per 100 person-years versus 0.05 per 100 person-years). However, since subjects on diet alone and metformin were mixed, these results must be viewed with caution. 201
Second generation sulfonylureas versus second generation sulfonylureas. Consistent with results in the RCTs, three cohort studies noted the incidence of hypoglycemia was greater with glyburide or glibenclamide compared with other second generation sulfonylureas.202-204 A fourth retrospective cohort study of 255 subjects during 20,715 person-years of followup compared the number of subjects with serious hypoglycemia in older adults (>65 years old) between glyburide and glipizide, and found moderately greater risk of serious hypoglycemia in subjects taking glyburide (RR 1.9, 95% CI 1.2 to 2.9).205 Comparisons between drug and placebo or cohorts without comparisons (see Appendix F, Evidence Table 35)
RCTs. In general, the placebo-controlled trials were consistent with the direct comparisons showing slightly higher numbers of subjects with hypoglycemia compared with placebo for second generation sulfonylureas and repaglinide, versus less hypoglycemia in placebo-controlled trials with metformin, pioglitazone, nateglinide, and acarbose (see Table 18). Rosiglitazone compared with placebo had slightly higher numbers of subjects with hypoglycemia than expected, yet these trials all compared rosiglitazone versus placebo in addition to existing second generation sulfonylureas. One additional RCT compared the combination of metformin plus second generation sulfonylurea with placebo in 2 doses, favoring the placebo arm (range in between-group percent differences 4.5 to 15.4%).79
98
We conducted indirect comparisons for the oral diabetes medications with few direct comparisons, and for which there were sufficient placebo-controlled trials. Repaglinide was associated with greater numbers of subjects with hypoglycemia than pioglitazone, rosiglitazone and metformin, which is consistent with the few head-to-head comparisons (see Table 19). Metformin was associated with similar numbers of subjects with hypoglycemia compared with pioglitazone and rosiglitazone, which was consistent with the few direct comparisons (see Table 20). Additionally, we did not combine the UKPDS in the meta-analysis due to its longer study duration. However, the results from the UKPDS are consistent with these results. In the UKPDS, the mean annual rate of hypoglycemia over 3 years was 6.3% for the metformin group versus 1.2% in the diet group.92 At 10-year followup there was 1 major hypoglycemic event in the metformin group compared with none in the diet group.15 The UKPDS also compared glibenclamide with diet and noted no deaths from hypoglycemia over 10 years in either group;15 however, the mean proportion of patients per year with any hypoglycemic episode was 17.7% for glibenclamide-treated subjects compared with 1.2% for diet treated subjects.16 The proportion per year of subjects with major hypoglycemic events was 2.5% in the glibenclamide group compared with 0% in the diet group.16
Non-RCTs and cohorts without a comparison group Second generation sulfonylureas. Two pre-post studies, one cohort study, and one cross-
sectional study evaluated hypoglycemia outcomes for a second generation or unspecified second generation sulfonylurea.206-209 One cohort and one pre-post study lasting 22-24 weeks showed absolute total symptomatic hypoglycemia rates ranging from 9% to 16%.206, 207 The cross-sectional survey reported a 3% incidence of serious or major hypoglycemia requiring the help of another person.208 One of the 2-year pre-post studies only reported the number that withdrew due to hypoglycemia which was less than 0.01%.209 These results were consistent with the range of hypoglycemia seen in the RCTs on second generation sulfonylureas.
Metformin plus second generation sulfonylurea. One cohort study and one pre-post study
evaluated hypoglycemia outcomes for metformin in combination with an unspecified second generation sulfonylurea.210, 211 One was 12 weeks in duration and the other was one year in duration. Both reported that less than 1% of patients had either serious or total hypoglycemic events. This incidence was lower than the 5-18% incidence of hypoglycemia seen in the RCTs. This may have been due to evaluating severe hypoglycemia in the retrospective cohort study as well as the method of ascertainment of medical record review, or due to the short duration in the pre-post study.
Nateglinide. One pre-post open-label 12 week study of 105 subjects taking nateglinide 120
mg thrice daily reported 12.4% hypoglycemic cases. This is consistent with results seen in the RCTs.212
Alpha-glucosidase inhibitors. In a 5 year post-marketing surveillance study of acarbose,
less than 1% of patients developed hypoglycemia.213
99
Metformin XR. One pre-post study switched subjects from immediate release metformin to extended release metformin and reported no episodes of major hypoglycemia after 4 months.214
Gastrointestinal Adverse Events Key points
• Metformin was associated with more frequent GI adverse events compared with thiazolidinediones, second generation sulfonylureas, and combination therapies that do not include metformin or acarbose.
• Metformin monotherapy was associated with more frequent adverse GI events compared
with the combination of metformin plus a second generation sulfonylurea or metformin plus thiazolidinediones if the metformin component is a lower dose than the metformin monotherapy arm.
• There was a suggestion from a few placebo-controlled and head-to-head trials that
metformin and acarbose may have a similar incidence of GI adverse events.
• There was a suggestion from a few placebo-controlled and head-to-head trials that meglitinides may have a lower incidence of GI adverse events than metformin.
Direct comparison results (see Appendix F, Evidence Table 35)
RCTs Thiazolidinedione versus thiazolidinedione. One RCT compared rosiglitazone and
pioglitazone and reported no significant difference in the incidence of subjects with transient flatulence (which occurred in about 4.8% of all participants).53
Thiazolidinedione versus metformin. Three RCTs compared pioglitazone with metformin,
favoring pioglitazone over metformin. The incidence of subjects with diarrhea in the pioglitazone group ranged from 2.5% to 3% compared to 4.2% to 16% in the metformin group.56,
59, 60 Nausea was approximately double in the metformin group in the one study which examined this outcome.56
Thiazolidinedione versus second generation sulfonylurea. One RCT compared
pioglitazone with gliclazide and reported a similar incidence of subjects with at least one GI adverse event. The study reported a 2.9% incidence of diarrhea in the pioglitazone group compared to 3.4% in the gliclazide group, and a 4.3% incidence of nausea in the pioglitazone group compared to 5.1% in the gliclazide group.63
Thiazolidinedione plus metformin versus second generation sulfonylurea plus
metformin. Similarly, two additional RCTs compared thiazolidinediones plus metformin versus second generation sulfonylureas plus metformin showing a similar incidence of subjects with GI
100
adverse events in the 2 groups: 3%-10% in the thiazolidinedione plus metformin group versus 4%-11% in the second generation sulfonylurea plus metformin group.71, 72
Thaizolidinedione versus meglitinides. One RCT compared rosiglitazone and repaglinide
showing the incidence of subjects with diarrhea in the 2 groups was similar, 3% versus 5%.73 Thiazolidinediones versus alpha-glucosidase inhibitors. One RCT compared the incidence
of abdominal distension/flatulence between pioglitazone and acarbose, and reported that no participants had GI adverse events in the pioglitazone group while 46 participants (34%) had GI adverse events in the acarbose group.75 One patient in the acarbose group withdrew from the study because of these symptoms.75
Metformin versus second generation sulfonylurea. Thirteen comparisons in 10 RCTs
compared the incidence of subjects with at least one GI adverse event between metformin and a second generation sulfonylurea (mostly glyburide) favoring second generation sulfonylureas (range in between-group differences of 1.6% to 14.3%).79-82, 84-89 One RCT compared the number that withdrew due to nausea and/or diarrhea between groups favoring the second generation sulfonylurea arm, 2 cases in the metformin arm versus 0 cases in the second generation sulfonylurea arm.90
Metformin versus meglitinides. Two RCTs compared nausea and diarrhea between
metformin and either nateglinide or repaglinide, favoring meglitinides slightly.96, 97 The incidence of withdrawals due to GI adverse events was similar in the metformin groups (3.3-3.6%) and only 0-1% in the meglitinide groups. Additionally, one of the trials reported the incidence of subjects with at least one GI adverse event of any kind as 19.7% in the metformin group versus none in the meglitinide groups.96
Metformin versus alpha-glucosidase inhibitors. In the review by Van de Laar et al., one
study comparing miglitol with metformin reported no significant differences between groups in GI adverse events. We found one additional RCT reporting the incidence of withdrawal due to GI adverse events for metformin and acarbose, favoring metformin. The incidence of withdrawal secondary to GI adverse events was 14.8% in the metformin group versus 58% in the acarbose group.99
Metformin versus metformin plus thiazolidinediones. Three RCTs compared the
incidence of subjects with at least one GI adverse event between metformin and a combination of metformin plus a thaizolidinedione showing conflicting results.100-102 Two RCTs showed a similar incidence between groups (between-group difference of -1.4% to 3%). One of these RCTs used a lower dose of metformin in the combination arm compared with the metformin monotherapy arm (2000 mg versus 3000 mg respectively).101 A third RCT did an intention to treat analysis of GI adverse events and showed a higher incidence in the metformin monotherapy group (OR 1.64, 95% CI 1.19 to 2.24).100 This study used a lower dose of metformin in the combination arm compared with the metformin monotherapy arm which may explain the differences (1000 mg vs 2000 mg).
101
Metformin versus metformin plus second generation sulfonylureas. Nine RCTs compared subjects with GI adverse events between metformin and a combination of metformin plus a second generation sulfonylurea, favoring the combination arm.79-82, 84, 87-89, 104 These studies reported several different GI outcomes, and many of the combination medications had a lower dose of metformin than the metformin monotherapy arms. Several of these studies reported a greater percentage of subjects with diarrhea in the metformin monotherapy group80, 88,
89 while other studies reported more nausea and vomiting in the metformin monotherapy group.79-81 One study showed a much greater incidence of subjects with total GI adverse events in the metformin monotherapy group (63% versus 35%)87 and another study reported more flatulence in the combination group (2.5%-6% versus 2%).81
Other metformin comparisons. One RCT compared subjects with GI adverse events
between metformin and extended release metformin. More flatulence and diarrhea were reported in the extended release metformin group, whereas more dyspepsia and heartburn were reported in the regular metformin group.105
Second generation sulfonylurea versus second generation sulfonylurea. One RCT
showed similar numbers of subjects with GI adverse events in both second generation sulfonylurea groups, 7% vs 6%.109
Second generation sulfonylurea versus metformin plus second generation sulfonylurea.
Ten RCTs compared the incidence of subjects with GI adverse events between a second generation sulfonylurea and the combination of a second generation sulfonylureas plus metformin favoring the second generation sulfonylurea monotherapy arm. There were significantly more subjects with GI adverse events in the combination group than in the second generation sulfonylurea monotherapy group (incidence ranging from 3% to 26% versus 0% to 6%).79-82, 84, 87-89, 128, 129 Only one RCT compared the incidence of flatulence between a second generation sulfonylurea and a combination of a second generation sulfonylurea plus a thiazolidinedione, and noted no significant difference between groups.172
Second generation sulfonylurea versus alpha-glucosidase inhibitors. In the review by
Van de Laar et al., no RCTs compared acarbose or miglitol with a second generation sulfonylurea with regard to GI adverse events. We found one RCT comparing the incidence of GI adverse events between glimepiride and acarbose, favoring glimepiride: 20% in the glimepiride group versus 51% in the acarbose group.130
Nateglinide versus repaglinide. One RCT reported that the incidence of withdrawal due to
diarrhea was similar for nateglinide and repaglinide, with 0% in the nateglinide group versus less than 1% in the repaglinide group.131
Non-RCTs or cohorts. These studies were generally consistent with results from the RCTs.
One study reported the results of a cross-sectional survey on diarrhea in subjects with diabetes at an outpatient diabetes clinic with results similar to the RCTs. It compared the incidence of diarrhea for metformin, second generation sulfonylureas, metformin plus a second generation sulfonylurea, and diet. It found a statistically significantly higher incidence of subjects with diarrhea in the metformin groups compared with second generation sulfonylurea or diet groups
102
(incidence of 20%, 20%, 6%, and 6% for metformin, metformin plus second generation sulfonylurea, second generation sulfonylurea, and diet, respectively).215 Additionally, a retrospective cohort study in the elderly (>75 years old) compared pioglitazone (n=11), rosiglitazone (n=13), metformin (n=48), and second generation sulfonylureas (n=121) showing similar numbers of subjects with nausea and vomiting for all groups (4, 0, 5, and 2 cases respectively). The pioglitazone group had the highest percent (36.4%), and metformin the second highest percent (10.4%). However, about two-thirds of subjects taking pioglitazone were on additional medications, most of which were second generation sulfonylureas.200 Furthermore, the number of subjects taking thiazolidinediones were small (n=11 and 13) compared with metformin (n=48). Another cross-sectional study compared GI adverse events using the validated Diabetes Bowel Symptom Questionnaire.216 They showed that metformin was associated with chronic diarrhea (OR 3.08; 95% CI 1.29 to 7.36) and fecal incontinence (OR 1.95; 95% CI 1.10 to 3.47) when compared with subjects not taking metformin, after adjusting for age, gender, smoking, diabetes complications, duration of diabetes, and other potential confounders. Additionally, they reported that second generation sulfonylureas were associated with less abdominal pain than subjects not taking second generation sulfonylureas (OR 0.40; 95% CI 0.19 to 0.82), after adjusting for multiple confounders.216 Comparisons between drug and placebo (see Appendix F, Evidence Table 35)
The placebo-controlled trials were consistent with the head-tohead comparisons. RCTs Thiazolidinedione versus placebo. One RCT reported similar numbers of subjects with
flatulence in both groups, 7 vs 6%.172 Metformin versus placebo. The incidence of subjects with at least one GI event in the
metformin groups was higher than in the placebo groups in ten RCTs, ranging from 14% to 29% in the metformin groups versus 1.4% to 13% in the placebo groups.79, 88, 88, 96, 99, 148-150, 154, 217 The incidence of withdrawal secondary to GI adverse events in the 2 groups ranged from 3% to 48% in the metformin group versus 1% to 9% in the placebo group.
Second generation sulfonylureas versus placebo. A higher incidence of subjects with both
nausea and diarrhea was observed in the second generation sulfonylurea groups (0-6%) compared with placebo (0%) in three of the four RCTs, but only when using high doses of the second generation sulfonylurea.79, 134, 136, 189 The fourth RCT showed no differences between groups.79
Meglitinides versus placebo. Two RCTs compared the incidence of subjects with GI
adverse events between meglitinides (range of 7.5-11%) and placebo (range of 3-4%), favoring placebo.139, 194 Two additional RCTs reported similar numbers of withdrawals due to GI adverse events between groups (0.6% to 1.5% in the meglitinide arms versus 0% to 1.7% in the placebo arms).96, 218
103
Alpha-glucosidase inhibitors versus placebo. In the systematic review by Van de Laar et al.,38 acarbose had an increased odds of GI adverse events compared with placebo in four studies (OR 3.3, 95% CI 2.31 to 4.71), and miglitol in 2 studies showed similar results compared with placebo.38 We found 3 additional RCTs that were consistent with these results, reporting more GI adverse events in the acarbose groups compared with the placebo groups.99, 138, 153
Metformin plus second generation sulfonylurea versus placebo. In one study, the
incidence of subjects with GI adverse events was dose dependent and ranged from 32% to 38% in the combination group versus 24% in the placebo group.79
Cohorts without comparisons. Four cohort studies, four pre-post studies, and one cross-
sectional study evaluated GI adverse events. One study evaluated pioglitazone, one acarbose, one metformin, one metformin extended release, one glimepiride, one nateglinide, and three metformin with an unspecified second generation sulfonylurea.206, 210-214, 219-221 The reported GI adverse event rates in these studies were consistent with what was reported in the RCTs, except for the study on nateglinide which reported slightly higher rates than reported in the RCTs, 21% with diarrhea, 11.4% with nausea, and 10.5% with abdominal pain.212 The highest rates were for metformin monotherapy, combinations using metformin, acarbose, and nateglinide. The lowest rates were reported for pioglitazone and glimepiride.
Elevated Serum Aminotransferase Levels Key points
• Several oral diabetes medications (thiazolidinediones, second generation sulfonylureas, and metformin) appeared to have similar low rates (<1%) of clinically relevant elevations of serum aminotransferase levels (> 1.5 to 2 times the upper limit of normal or liver failure).
• Insufficient studies evaluated or reported on the effects of meglitinides and acarbose on
serum aminotransferase levels, but they appeared to be similar to effects of other oral diabetes medications.
Direct comparison results (see Appendix F, Evidence Table 35)
RCTs Thiazolidinedione versus thiazolidinedione. One RCT compared rosiglitazone with
pioglitazone, and found elevations in aminotransferases in two patients (4.8%) in the rosiglitazone group and one patient (2.2%) in the pioglitazone group.53
Thiazolidinediones versus metformin. Three RCTs reported similar aminotransferase
elevations comparing pioglitazone with metformin.56, 57, 60 One study reported a 0.9% incidence of subjects with elevated aminotransferase levels in the pioglitazone group compared with 2.2% in the metformin group.56 This same study reported hepatotoxicity that resolved after withdrawing the oral diabetes medications in two subjects in the pioglitazone group compared
104
with one subject in the metformin group.56 Two additional studies reported no aminotransferase elevations in either group.57, 60
Thiazolidinedione versus second generation sulfonylurea. Three RCTs reported a similar
incidence of subjects with elevated aminotransferases when comparing a thiazolidinedione to a second generation sulfonylurea.57, 63, 67 Two studies reported no adverse effects on aminotransferase levels in either group.57, 67 One study reported a 0.5% incidence of aminotransferase abnormalities in the thiazolidinedione (pioglitazone) group compared to an incidence of 1.6% in the second generation sulfonylurea (gliclazide) group.63
Thiazolidinedione plus metformin versus second generation sulfonylurea plus
metformin. Conversely, one RCT compared rosiglitazone plus metformin with glimepiride plus metformin, and three aminotransferase elevations (6.3%) were reported in the rosiglitazone plus metformin group versus none in the glimepiride plus metformin group.72
Thiazolidinediones versus meglitinides. Two RCTs compared a thiazolidinedione with
repaglinide,73, 74 and one reported one serious elevation in aminotransferases in the repaglinide group.74 No other aminotranferase elevations were reported in either study.
Thiazolidinediones versus alpha-glucosidase inhibitors. One RCT reported two
withdrawals in the acarbose group due to aminotransferase elevations, and none in the pioglitazone group.75 No other aminotransferase elevations were reported in either group.75
Other thiazolidinedione comparisons. Two RCTs compared pioglitazone with uptitration
of other diabetes medications, showing no elevations more than 2 times the upper limit of normal in either group.78, 151
Metformin versus second generation sulfonylureas. One RCT compared metformin to
glimepiride, and reported no adverse effects on aminotransfereases in either group.57 Metformin versus metformin plus thiazolidinediones. Three RCTs compared metformin
with the combination of metformin plus rosiglitazone, reporting either no or similarly low incidence of aminotransferase abnormalities in both groups.100, 101, 103
Metformin or second generation sulfonylurea monotherapy versus metformin plus
second generation sulfonylurea. One crossover study reported one aminotransferase elevation in the glibenclamide arm compared with no events in the metformin or metformin plus glibenclamide arms.95
Second generation sulfonylurea versus second generation sulfonylurea. One RCT
compared one second generation sulfonylurea with another and showed the same number (4 cases) of aminotransferase elevations in both groups (3 vs 3%).133
Second generation sulfonylurea versus second generation sulfonylurea plus
thiazolidinedione. Three RCTs compared a second generation sulfonylurea with a second generation sulfonylurea plus a thiazolidinedione, reporting one case of aminotransferase
105
elevation in the second generation sulfonylurea monotherapy arm of one study, and no cases in any other groups.124-126
Non-RCTs or cohorts. The non-randomized trials and cohorts were consistent with the randomized trials.
Thiazolidinedione comparisons. One retrospective cohort study identified subjects newly prescribed rosiglitazone with and without abnormal liver function tests at baseline using linked lab and prescription data at three hospitals in Indiana, and followed them for 12 months.222 They reported that 10% of subjects in cohort 1 (subjects on rosiglitazone with elevated baseline aminotransferase levels) developed mild to moderate aminotransferase elevations (up to10 times the baseline value), while 6.6% of subjects in cohort 2 (subjects taking rosiglitazone with normal basleine values) developed mild to moderate aminotransferase elevations (up to 10 times the upper limit of normal). They also reported that 0.9% in cohort 1 versus 0.6% in cohort 2 had severe elevations in aminotransferase elevations (> 10 fold elevations from baseline or the upper limit of normal). Of note, the mean baseline aminotransferase levels in cohort 1 were only minimally elevated (<50 IU/L). However, of the 15 subjects with elevated baseline aminotransferase levels more than 2.5 times the upper limit of normal, none developed mild to moderate elevations in liver function tests. Additionally, 61% of cohort 1 normalized their liver enzymes over the course of a year.
An additional retrospective cohort study compared subjects taking pioglitazone with matched pairs of subjects taking rosiglitazone, metformin, or second generation sulfonylurea therapy based on a propensity score developed from confounders, and found no significant differences between groups in risk of liver failure or hepatitis. The two-year incidence rate of liver failure or hepatitis was 0.3% in the pioglitazone group, 0.4% in the rosiglitazone group, 0.5% in the metformin group, and 0.7% in the second generation sulfonylurea group. This was slightly less than the range seen in the RCTs.223
Metformin or second generation sulfonylurea comparisons. Another retrospective cohort
used claims data from five Health Maintenance Organizations to identify acute liver failure or injury, and compared metformin to no metformin (HR 1.37; 95% CI 0.49 to 3.78) and second generation sulfonylurea to no second generation sulfonylurea (HR 1.44; 95% CI 0.59 to 3.50), showing no significant differences between groups. The age- and sex- standardized incidence per 1000 person-years was 0.08 for second generation sulfonylurea-users versus 0.12 for metformin-users.224
Other comparisons. One non-randomized trial reported no aminotransferase adverse events
for the following comparisons: pioglitazone versus pioglitazone plus second generation sulfonylurea, pioglitazone versus gliclazide, and gliclazide versus pioglitazone plus gliclazide.225 Another non-randomized trial comparing rosiglitazone, pioglitazone and troglitazone reported one aminotransferase elevation (2.6%) in the rosiglitazone arm compared with no elevations in the other two arms.142
106
Comparisons between drugs and placebo or cohorts without comparisons (see Appendix F, Evidence Table 35)
RCTs. The placebo-controlled trial results were consistent with the head-to-head trials. Thiazolidinedione versus placebo/diet. Twelve RCTs compared a thiazolidinedione
(rosiglitazone or pioglitazone) with placebo, 140, 141, 160, 162, 165-170, 172, 188 and showed similarly low or no adverse events between the thiazolidinedione group and placebo except for one study.165 This double-blind multi-center study compared four different doses of pioglitazone with placebo, and only found a slight difference from placebo for the 30 mg once daily pioglitazone group (6% versus 4% aminotransferase elevation rates more than 1.5 times the upper limit of normal). In the same study, the 45mg per day pioglitazone group had no elevated aminotransferase levels more than 1.5 times the upper limit of normal.165
Second generation sulfonylurea versus placebo/diet. One RCT reported one withdrawal
due to abnormal aminotransferase levels in the 16 mg per day glimepiride group compared with no withdrawals in the groups with other doses of glimepiride or the placebo group. No other aminotransferase abnormalities were reported in this study.189 One other RCT mentioned that no adverse liver abnormalities occurred during the trial in either group.125
Meglitinides versus placebo/diet. Two RCTs compared meglitinides (nateglinide and
repaglinide) with placebo. There were no significant aminotransferase abnormalities in either group.190, 218
Alpha-glucosidase inhibitors versus placebo/diet. In the review by Van de Laar et al.,
evaluating alpha-glucosidase inhibitors, they reported GI adverse events and total adverse events only.38 The GI adverse events are discussed under that section of this report. We found no additional articles reporting on aminotransferase elevations comparing alpha-glucosidase inhibitors with placebo.
Cohorts or non-randomized trials Thiazolidinediones. Two cohort studies, and one pre-post study evaluated aminotransferase
elevations for pioglitazone, showing consistent results with the RCTs.219, 226 One study evaluated the incidence of elevated aminotransferase levels after patients were changed from troglitazone to pioglitazone. It found that one patient (0.3%) discontinued pioglitazone due to elevations in aminotransferase levels that were less then three times baseline values.219 In the second cohort, subjects on pioglitazone were mostly on pioglitazone in addition to other oral diabetes medications. After 16 weeks, 11% had some mild elevations in aminotransferase levels, but only 1.8% of subjects had levels more than 2.5 times the upper limit of normal.226 In one pre-post trial of metformin plus rosiglitazone, no elevated aminotransferase levels occurred.227
Alpha-glucosidase inhibitors. One cohort study reported one event of elevated
aminotransferase levels more than 2.5 times the upper limit of normal (0.05%) after five years in subjects taking acarbose. This was similar to event rates seen in the small number of RCTs evaluating acarbose.213
107
Congestive Heart Failure Key points
• Few long-term studies have addressed the comparative safety of oral diabetes medications in terms of the risk of CHF.
• Thiazolidinediones had greater risk of CHF compared with metformin or second
generation sulfonylureas.
• Metformin and second generation sulfonylureas had similar effects on the incidence of CHF.
Direct comparison results (see Appendix F, Evidence Table 35)
RCTs Thiazolidinedione versus second generation sulfonylurea. Two RCTs compared a
thiazolidinedione with a second generation sulfonylurea.67, 145 Both studies had 1-2 cases of CHF exacerbation or incident CHF in the thiazolidinedione groups compared with no cases in the second generation sulfonylurea groups over a time frame of 6 to 12 months.
Second generation sulfonylurea versus second generation sulfonylurea plus
thiazolidinedione. Three RCTs compared the combination of rosiglitazone plus second generation sulfonylureas with second generation sulfonlyurea monotherapy showing conflicting results.124-126 Two 26-week studies had 2 CHF cases in the rosiglitazone plus second generation sulfonylurea combination arms compared with no cases in the second generation sulfonylurea monotherapy arms.125, 126 The 2-year study had 4 total CHF cases and 2 serious CHF cases in the rosiglitazone plus glipizide combination arm compared with 3 total CHF cases and 1 serious CHF case in the glipizide monotherapy arm. A serious event meant hospitalization was required.124
Thiazolidinedione versus alpha-glucosidase inhibitors. One RCT reported no withdrawals
due to CHF in the pioglitazone group compared with 2 withdrawals due to CHF in the acarbose group.75
Metformin versus meglitinides. One RCT compared metformin with nateglinide and
reported no cases of CHF in either group.96 Second generation sulfonylurea versus second generation sulfonylurea plus metformin.
The UKPDS reported a non-significant increased RR (1.59) of incident CHF after 6.6 years comparing early addition of metformin to second generation sulfonylurea with second generation sulfonylurea monotherapy.15
108
Cohorts or non-randomized trials Thiazolidinediones versus other diabetes medications. One retrospective cohort study
compared thiazolidinedione with non-thiazolidinedione therapy (mostly metformin and/or second generation sulfonylureas) in subjects with type 2 diabetes.228 The cohort study showed a statistically significant increased relative hazard of CHF in the thiazolidinedione group compared with the non-thiazolidinedione group.228 When broken down by medication type, this association was similar for both thiazolidinedione medications. Rosiglitazone had a 2.27 times increased relative hazard of CHF with a 95% CI of 1.65 to 3.13 compared with the non-thiazolidinedione group, and pioglitazone had a 1.92 times increased relative hazard of CHF, with a 95% CI of 1.24 to 2.97 compared with the non-Thiazolidinedione group.228 The study found no relationship between the daily doses of each of the thiazolidinediones and the risk of heart failure.228 The absolute rate of incident CHF was 2.3% in the thiazolidinedione group compared with 1.4% in the non-thiazolidinedione group. The authors acknowledged that they were unable to adjust for several key confounders such as HbA1c levels, serum creatinine, and blood pressure due to the limitations of the claims data.
Another cohort study evaluated CHF admission rates after discharge for acute myocardial infarction in 24,953 Medicare beneficiaries taking thiazolidinediones or metformin separately or in combination compared with subjects taking non-insulin sensitizing (not metformin or thiazolidinedione) oral diabetes medications.184 The relative hazard of CHF admission one year after a myocardial infarction was 1.06 (95% CI 0.95 to 1.18) for metformin; 1.17 (95% CI 1.05 to 1.30) for thiazolidinediones; and 1.24 (95% CI 0.94 to 1.63) for both in combination, compared with non-insulin sensitizing oral diabetes medications. Even though readmission rates were slightly higher in the thiazolidinedione group, mortality rates were the same for all subjects regardless of the oral diabetes medications. The authors noted that one limitation of this study was that they captured medications at the time of discharge after acute myocardial infarction, and had no further assessment of adherence or changes to oral diabetes medications after discharge.
A third retrospective cohort study by Masoudi et al., evaluated 16,417 Medicare beneficiaries one year after a discharge from the hospital where the principal diagnosis was CHF. They compared subjects taking metformin or thiazolidinediones with subjects taking other diabetes medications (mostly insulin or second generation sulfonylureas). They reported a slightly higher risk of readmission for CHF in the thiazolidinedione group (HR 1.06, 95% CI 1.0 to 1.09), and a slightly lower risk of readmission for CHF in subjects taking metformin (HR 0.92, 95% CI 0.92 to 0.99) after adjustment for patient, physician, and hospital characteristics.229
Second generation sulfonylurea versus other diabetes medications. Lastly, a retrospective
cohort study evaluated 232 diabetic patients after admission to the coronary care unit without adjusting for potential confounders. They found greater in-hospital deaths from CHF in the non-glibenclamide group compared with the glibenclamide group (85% versus 50%, p<0.05).11
Metformin versus second generation sulfonylurea. One retrospective cohort study of
diabetics without CHF at baseline in the United States found no differences among metformin monotherapy, second generation sulfonylurea monotherapy, and their combination.230 However, the addition of metformin to diet and exercise significantly reduced the CHF incidence rate, while the addition of a second generation sulfonylurea to diet and exercise non-significantly reduced the CHF incidence rate.230

109
Other comparisons. One case control study compared thiazolidinediones, metformin, second generation sulfonylureas and acarbose with non-heart failure matched controls.231 Only thiazolidinediones had a marginal association with CHF (OR 1.37, 95% CI 0.98 to 1.92) compared with matched controls.231 The study reported that patients diagnosed with CHF were 1.4 times more likely than controls to be exposed to a high-dose thiazolidinedione.231 Comparisons between drug and placebo or cohorts without a comparison (see Appendix F, Evidence Table 35)
RCTs Thiazolidinedione versus placebo/diet. The prospective pioglitazone clinical trial in
macrovascular events (PROactive) study was one of the largest and longest RCTs comparing pioglitazone with placebo, added to existing oral diabetes medications.185 This study randomized 5238 patients with evidence of prior macrovascular disease to pioglitazone or matching placebo, and followed them an average of 34.5 months with only 2 subjects lost to followup in each group. The primary combined endpoint is described earlier in the report. The pioglitazone group had higher numbers of subjects with reported CHF (11% versus 8%, p<0.001). Pioglitazone was associated with significantly higher numbers when CHF was stratified by needing hospital admission (6% versus 4%, p=0.007) or not (5% versus 3%, p=0.003). Lastly, they evaluated fatal heart failure which was similar between the two groups (1% versus 1%, p=0.634).
Two additional shorter duration RCTs compared pioglitazone with placebo, without evidence of prior macrovascular disease.78, 151 These studies both reported no cases of CHF in either group.78, 151 In one study, 58% of the pioglitazone group and 61% of the control group were on alpha-glucosidase inhibitors (p=0.82), while 58% of the pioglitazone group and 43% of controls were on unspecified second generation sulfonylureas (p=0.28).151
Metformin versus placebo/diet. Two RCTs compared metformin with placebo or diet.15, 96
The UKPDS was the longest RCT reporting the rate of CHF, comparing metformin with conventional treatment (diet). After 10 years of followup, metformin had a non-significant 27% decreased relative risk of CHF compared with conventional treatment (diet).15 Consistent with this, one short-term RCT reported one serious episode of CHF in the placebo group with no cases in the metformin group.96
Second generation sulfonylurea versus placebo/diet. UKPDS also reported on incident
CHF for glibenclamide compared with conventional treatment (diet).16 Glibenclamide had a non-significant 1.2 times increased relative risk of CHF compared with conventional treatment (diet). There were very few total events after a median of 10.7 years of followup for any of the UKPDS groups.15, 16 No other RCTs compared second generation sulfonylureas to placebo.
Meglitinides versus placebo/diet. Two short-term RCTs compared meglitinides with
placebo and showed similar low rates of CHF in both groups.96, 139 Cohorts. One retrospective cohort study of newly diagnosed diabetics in the United
Kingdom showed similar rates of incident CHF for both metformin and second generation sulfonylurea monotherapy compared with diabetic subjects not on oral diabetes medications.
110
Metformin had a 4.58 times increased relative hazard of CHF in the first year (95% CI 3.09 to 7.12), and a total 3-year relative hazard of 1.58 (95% CI 1.26 to 1.98). Second generation sulfonylureas had a similar 4.73 times increased relative hazard of CHF in the first year (95% CI 3.53 to 6.34), and a total 3-year relative hazard of CHF of 1.53 (95%CI 1.30 to 1.79).232
Lastly, one other retrospective 6 month cohort study without a comparison group reported 1 case of CHF out of 143 subjects taking pioglitazone. This rate was consistent with rates in other short-term studies.233 Edema Key points
• Thiazolidinediones had greater risk of edema than second generation sulfonylureas or metformin.
• Very few cases of edema were considered serious, yet a number of withdrawals
from thiazolidinediones were due to edema.
• Data were too sparse to draw conclusions about comparisons of the incidence of edema with other oral diabetes medications.
• Of note, no cases of macular edema were found in this systematic review.
Direct comparison results (see Appendix F, Evidence Table 35)
RCTs Thiazolidinedione versus metformin. Four RCTS with comparably-dosed drugs reported
subjects with edema comparing pioglitazone with metformin, favoring metformin (range in between-group differences of 2.4% to 10.5%) (see Table 21).56, 57, 59, 60 Three studies reported a range of 1 to 5 subjects that withdrew from the study due to edema in the pioglitazone group compared with 0 to 2 subjects that withdrew in the metformin group.54, 56, 57
Thiazolidinediones versus second generation sulfonylurea. Five RCTs reported that
subjects taking thiazolidinediones had a higher incidence of edema compared with subjects taking second generation sulfonylureas, with a range in between-group differences of 4.2% to 21.2% (see Table 21).54, 63, 65, 67, 145 One of these studies allowed subjects to be on other oral diabetes medications.145 One additional study reported that 2 subjects withdrew in the pioglitazone group due to edema compared with no withdrawals in the second generation sulfonylurea group.57 In a third study, 2 cases of edema in the rosiglitazone group required diuretics.67
Thiazolidinediones versus meglitinides. Two RCTs compared thiazolidinediones with
meglitinides, favoring meglitinides: 2-3% of patients in the thiazolidinedione group developed peripheral edema compared with 0% of the repaglinide group (see Table 21).73, 74
111
Thiazolidinedione versus alpha-glucosidase inhibitors. One study comparing pioglitazone to acarbose reported 6 cases of edema in the pioglitazone arm, but did not report on whether there were any cases of edema in the acarbose arm.75
Metformin versus second generation sulfonylurea. Two RCTs compared metformin with a
second generation sulfonylurea, showing no differences between-groups. One reported no cases of edema in either group, and one reported no withdrawals due to edema in either group.54, 57
Metformin versus metformin plus thiazolidinedione. Three RCTs compared metformin
monotherapy with the combination of a thiazolidinedione plus metformin, favoring the metformin monotherapy arm (between-group differences of -2% to -5.2%) (see Table 21).100-102 One additional study reported two withdrawals due to edema in the combination arm compared with no withdrawals due to edema in the metformin arm.100
Second generation sulfonylurea versus second generation sulfonylurea plus
thiazolidinedione. Three RCTs reported on edema comparing second generation sulfonylurea monotherapy with the combination of rosiglitazone plus second generation sulfonylurea, favoring second generation sulfonylurea monotherapy (range in between-group differences of -14 to -6.6%) (see Table 21).124-126 In two studies, three subjects on combination therapy withdrew due to edema compared with no withdrawals due to edema in the second generation sulfonylurea groups.125, 126
Non-RCTs or cohorts. The non-randomized trials and cohorts were consistent with the
RCTs. Thiazolidinedione versus thiazolidinedione. In one non-RCT comparing rosiglitazone with
pioglitazone, there were 3 versus 2 cases of edema for rosiglitazone versus pioglitazone respectively.142 One cohort study compared rosiglitazone with pioglitazone and found similar rates of withdrawal due to edema in both groups.192 These rates were similar to what was seen in the non-randomized trial.
Thiazolidinediones versus other oral diabetes medications. One non-randomized trial
compared gliclazide, pioglitazone, and the combination of gliclazide plus pioglitazone.225 The authors reported that 3 cases of edema occurred in subjects taking pioglitazone compared with no cases in subjects taking gliclazide, yet they did not specify whether the cases occurred in the monotherapy or combination therapy arm.225 Another short duration non-randomized trial compared withdrawals due to edema or weight gain in rosiglitazone plus existing medications group (n=49) versus an existing medications without rosiglitazone group (n=69), and favored the existing medication group without rosiglitazone (10% vs 0% withdrew respectively). Additionally, one retrospective cohort study evaluated the charts of long-term care facility residents in New Jersey and compared the incidence of edema among subjects taking second generation sulfonylureas, metformin, rosiglitazone, and pioglitazone. Subjects taking pioglitazone had a 9% rate of edema compared with 0% for rosiglitazone, 4.2% for metformin, and 2.5% for second generation sulfonylureas. Very few subjects were taking thiazolidinediones compared with the other two medications so the results of this study should be interpreted with caution.200
112
Comparisons between drug and placebo or cohorts without comparisons (see Appendix F, Evidence Table 35)
RCTs Thiazolidinediones versus placebo/diet. Six141, 160-162, 164, 165 of eight studies141, 151, 160-165
reported a greater incidence of subjects with edema in the pioglitazone groups compared with the placebo groups (range in between-group differences of 0 to 3.4%). In three of these studies, participants were continued on existing oral diabetes regimens when randomized to pioglitazone or placebo.151, 160, 161 Two studies reported no differences between groups151, 163; one of these studies reported no cases of edema in either group.151 There was a dose-response gradient seen in one of the three dosing studies, with higher doses being associated with a larger percent of subjects with edema.141
Four RCTs compared rosiglitazone with placebo for effects on edema, favoring placebo (range in between-group differences of 2.5% to 17%).168, 169, 172, 188 Three studies reported withdrawals due to edema of 1 to 4% in the rosiglitazone group compared with none in the placebo groups.168, 170, 188 Three of the RCTs had rosiglitazone versus placebo added to existing second generation sulfonylureas.170, 172, 188 A dose-response gradient was seen in two of the three dosing studies.169, 188
Meglitinides versus placebo/diet. One RCT compared repaglinide to placebo, and reported
1 case of facial edema in the repaglinide group and no cases in the placebo group.218 Non-RCTs or Cohorts. Two cohort studies and one non-randomized trial lasting from 3 to 6
months evaluated the rates of edema for pioglitazone without a comparator group.219, 233, 234 The rates ranged from 6% to 9% which is consistent with rates seen in the RCTs. Also, two of the studies showed a withdrawal rate due to edema of 2-5%.219, 233 Additionally, a 16-week cohort study without a comparator group reported a rate of edema of less than 1% in subjects taking pioglitazone plus metformin.226 This rate may have been lower than in other studies because of the shorter study duration and differences in the patient populations. Lactic Acidosis Key point
• The rate of lactic acidosis was similar between metformin and other oral diabetes medications or placebo.
Results (see Appendix F, Evidence Table 35)
Salpeter et al., conducted a Cochrane systematic review and meta-analysis evaluating the incidence of fatal and nonfatal lactic acidosis with metformin compared with other oral diabetes medications and placebo.49 Pooled data from 176 comparative trials and cohort studies totaling 35,619 patient-years revealed no cases of fatal or nonfatal lactic acidosis in any medication group. Mean lactate levels in the metformin groups were not significantly different from the groups taking placebo or other oral diabetes medications except phenformin. Mean lactate levels
113
were slightly lower for metformin than phenformin. Since they found no cases of lactic acidosis, they calculated the upper limit of the true incidence of lactic acidosis for metformin and non-metformin treatment groups. The meta-analysis reported that this upper limit of the true incidence of clinical lactic acidosis was 8.4 cases per 100,000 patient-years for metformin and 9 cases per 100,000 patient-years for the non-metformin group. Therefore, the reviewers concluded that there was no evidence to suggest that metformin is associated with increased risk of lactic acidosis compared with other oral diabetes medications, taking into account contraindications.49 We found an additional 3 RCTs and 5 cohort studies evaluating cases of clinical lactic acidosis in patients taking oral diabetes medications.81, 82, 176, 210, 229, 235-237 All of these studies evaluated metformin alone or in combination with another oral diabetes medication compared with placebo or another oral diabetes medication, usually a second generation sulfonylurea. Three RCTs and two cohort studies were consistent with the systematic review showing no cases of lactic acidosis.81, 82, 176, 210, 236 Three other cohort studies found a small number of clinical lactic acidosis cases giving estimates in 2 studies ranging from 2.2 cases per 10,000 person-years to 4.5 cases per 100,000 person-years.235, 237 One of these cohort studies evaluated patients on metformin who could be on other oral diabetes medications. The other cohort study did not confirm claims reports with medical chart review. The third cohort study by Masoudi et al., evaluated readmissions due to metabolic acidosis in Medicare subjects within one year of a hospital admission for CHF.229 Subjects discharged with a prescription for metformin had similar readmissions for metabolic acidosis (2.3%) compared with subjects discharged with thiazolidinediones (2.2%), and subjects discharged on other diabetes medications (2.6%, mostly insulin or second generation sulfonylureas). These rates were consistent with the systematic review by Salpeter et al.49
An additional article did not meet our strict criteria for inclusion but deserved mention in this section.238 The cumulative incidence of metformin-associated acidosis was 0.6 cases per 10,000 patient-years238 which is consistent with the results in the systematic review by Salpeter et al.49 This article reported cases of metabolic acidosis in Sweden from 1977 to 1991, which had compulsory reporting of serious or new suspected adverse drug reactions since 1975. The medical records for these cases were then reviewed by a medical officer to help determine causality. Furthermore, they reported that acidosis only occurred in subjects with comorbidities, usually CHF.
Anemia/leucopenia/thrombocytopenia Key points
• Few studies reported on anemia, thrombocytopenia, or leucopenia. • Thiazolidinediones may be associated with a greater incidence of anemia than other oral
diabetes medications.
• Only one subject (taking a combination of thiazolidinedione plus second generation sulfonylurea) from all the studies of oral diabetes medications required hospitalization or transfusion due to anemia, thrombocytopenia, or leucopenia.
114
Direct comparison results (see Appendix F, Evidence Table 35)
Anemia: RCTs Metformin versus metformin plus thaizolidinedione. Three studies compared metformin
alone with metformin plus rosiglitazone, favoring metformin monotherapy.100, 102, 103 Two studies showed a mean decrease in hemoglobin level ranging from 0.5 to 0.8 g/dl in subjects in the rosiglitazone plus metformin group, which was reported as significant in only one of the studies.103 They also both demonstrated a dose-response gradient. One additional study reported a greater incidence of subjects with anemia in the combination arm (6 cases, 1.4%) compared with metformin monotherapy (0 cases).100 None of the studies reported on the significance of between-group differences.
Second generation sulfonylurea versus second generation sulfonylurea plus
thiazolidinediones. Two RCTs reported on anemia comparing the combination of thiazolidinediones plus second generation sulfonylureas with second generation sulfonylurea monotherapy, favoring second generation sulfonylurea monotherapy.124, 126 In one of the studies, anemia was observed in 2% of patients in the rosiglitazone plus gliclazide treatment group, and in only 0.8% of patients on gliclazide alone.126 The other study reported one hospitalization due to anemia in the combination arm versus none in the second generation sulfonylurea monotherapy arm.124
Other comparisons. Only one RCT reported on each of the following direct comparisons:
thiazolidinedione versus second generation sulfonylurea, thiazolidinedione versus meglitinide, and one second generation sulfonylurea versus another second generation sulfonylurea.67, 73, 133 Only one study showed differences between groups: rosiglitazone had a 7% incidence of anemia vs 2% in the glyburide group.67 The rest showed similar numbers of subjects with anemia between groups.
Thrombocytopenia: RCTs. Only one study reported on thrombocytopenia.188 It compared
the combination of thiazolidinedione plus second generation sulfonylurea with second generation sulfonylurea alone. The study showed a general increase in the percent of people with thrombocytopenia in each treatment group but with a higher percent in those taking thiazolidinediones.188
Leucopenia: RCTs. One crossover study reported a case of neutropenia in the metformin
plus glibenclamide group compared with no cases in the metformin or glibenclamide monotherpy arms.95 This resolved with the removal of concomitant medications for other conditions.95
Anemia: Non-RCTs or cohort studies Thiazolidinedione versus thiazolidinedione. One retrospective cohort study reported on
anemia for diabetic subjects receiving hemodialysis and taking thiazolidinediones. The study showed a statistically significant decrease in hematocrit levels in patients on rosiglitazone with a
115
decrease from 35% at baseline to 34% 3 months after rosiglitazone therapy (P = 0.024). The authors reported that there was no difference in hematocrit for subjects taking pioglitazone.239 Indirect comparison results (see Appendix F, Evidence Table 35)
Anemia: RCTs Thiazolidinediones versus placebo/diet. Seven RCTs compared thiazolidinediones (six
studies used rosiglitazone) with placebo for the outcome of anemia, all favoring placebo.165-169,
171, 188 All seven demonstrated a significant decrease in hemoglobin or hematocrit level with the use of thiazolidinediones; however, no serious events occurred in any of these studies. A dose-response gradient was reported in one study, with a decrease of 0.6 g/dl in the 2 mg twice a day rosiglitazone group and a decrease of 1 g/dl in the 4 mg twice a day rosiglitazone group.169 These results were consistent with the head-to-head trials. No other oral diabetes medications were compared with placebo. Cancer Key point
• Insufficient evidence existed to draw conclusions about the comparative effects of oral diabetes medications on the risk of cancer.
Results (see Appendix F, Evidence Table 35)
Four RCTs reported incident cancers as serious adverse events, but they could not be
combined because they evaluated different medications (second generation sulfonylureas, metformin, rosiglitazone, and repaglinide), and involved different types of cancer.105, 139, 176, 188 Most of these studies had only 1 event in one group. One RCT compared metformin with non-metformin diabetes medications and found a 1.3% incidence of cancer for both groups. The higher event rate seen in this study compared with the other three RCTs was likely due to combining benign and malignant disease as their outcome.176
The UKPDS reported on cancer mortality in two articles.15, 16 The study found that glibenclamide had a non-significant 9% decreased risk of cancer mortality compared with the conventional treatment arm (diet).16 Also, the study found that metformin had a non-significant 29% decreased risk of cancer mortality compared with the conventional treatment arm (diet).15 Lastly, the UKPDS found that addition of early metformin to subjects hyperglycemic on a second generation sulfonylurea was associated with a non-significant 2.47 times increased risk of cancer mortality compared with those subjects continuing second generation sulfonylurea alone.15 The absolute rates of cancer mortality were 4.4 per 1000 person-years, 3.4 per 1000 person-years, and 9.0 per 1000 person-years for glibenclamide, metformin, and metformin plus second generation sulfonylurea, respectively.
One retrospective cohort study evaluated cancer mortality from vital statistics files, and used claims data to identify second generation sulfonylurea and metformin users. This study found that the second generation sulfonylurea cohort had greater cancer-related mortality compared with the metformin cohort, (OR 1.3, 95% CI 1.1 to 1.6). This was after adjusting for age, sex,
116
insulin use and chronic disease score. The specific cancer mortality rates were 6.3 per 1000 person-years for metformin, and 9.7 per 1000 person-years for second generation sulfonylureas. The authors acknowledged that the use of an administrative database hindered their ability to capture key confounders such as glycemic control, race, and duration of diabetes.240 Allergic Reactions Key point
• No serious allergic reactions requiring hospitalization were reported.
Results (see Appendix F, Evidence Table 35) There were no allergic reactions requiring hospitalization. Two studies reported a skin
rash.105, 147 One person withdrew from one study due to a skin rash that developed while the subject was taking extended release metformin compared with no withdrawals due to skin rash in the metformin immediate release group.105 The second study compared glyburide with glipizide, and reported 3 episodes of a skin rash in the glyburide group compared with one episode in the glipizide group.147 Withdrawals Due to Unspecified Adverse Events Key points
• Withdrawals due to unspecified adverse events did not differ among the main classes of oral diabetes medications (thiazolidinediones, metformin, and second generation sulfonylureas) and did not differ in comparisons of metformin or second generation sulfonylurea monotherapy with the combination of metformin and a second generation sulfonylurea.
• Too few comparisons of other diabetes medications existed to draw conclusions.
Direct comparison results (see Appendix F, Evidence Table 35)
Thiazolidinediones versus metformin. Three RCTs compared thiazolidinediones with metformin and showed no differences between groups, with the range in withdrawals of 0-2% in both groups.59, 60
Thiazolidinediones versus second generation sulfonylureas.For comparisons between
thiazolidinediones and second generation sulfonylureas, we also found no difference between groups in four RCTs, ranging from 1% to 12% in the thiazolidinedione groups compared with 0% to 9% in the second generation sulfonylurea groups.61, 65, 67, 145 One additional RCT compared rosiglitazone plus metformin versus glibenclamide plus metformin showing similar results, 1.3% versus 5.6% withdrawals due to unspecified adverse events respectively.158
117
Thiazolidinediones versus meglitinides. Two RCTs compared thiazolidinediones with meglitinides showing no significant differences between groups (range of -3 to 3%).73, 74
Metformin versus second generation sulfonylurea. Four RCTs compared metformin to a
second generation sulfonylurea (mostly glyburide) and showed no differences in the number withdrawn due to an unspecified adverse event, ranging from 5% to 44% in the metformin groups versus 3% to 18% in the second generation sulfonylurea groups.79, 81, 89, 94
Metformin versus metformin plus second generation sulfonylureas. Four RCTs (2 with 2
sub-arms) compared metformin with the combination of metformin and a second generation sulfonylurea. The number withdrawn due to adverse events was no different between these two groups.79, 81, 89, 94 Events ranged from 5% to 9% in the metformin groups versus 3% to 11% in the metformin plus second generation sulfonylurea groups in all except one study. This study had a 44% (7 out of 16 subjects) withdrawal rate in the metformin group compared with 8% (1 out of 12 subjects) in one of the combination groups, and 0% in the other combination group.94
Metformin versus metformin plus thiazolidinediones. Three RCTs compared metformin
with metformin plus thiazolidinediones showing no differences between-groups (range of -5.3 to 3.7%).100-102
Second generation sulfonylureas versus second generation sulfonylureas. Three RCTs
compared a second generation sulfonylurea with another second generation sulfonylurea showing no between-group differences (range of -0.5 to 1%).106, 108, 109
Second generation sulfonylureas versus meglitinides. Two RCTs compared second
generation sulfonylureas with meglitinides showing no significant differences between groups (range of -0.4 to 1.9%).116, 121
Second generation sulfonylureas versus second generation sulfonylureas plus metformin.
There was no difference between groups in four RCTs (2 with 2 sub-arms) comparing a second generation sulfonylurea with the combination of a second generation sulfonylurea and metformin, ranging from 3% to 17.6% in the second generation sulfonylurea groups compared with 0% to 11.1% in the second generation sulfonylurea plus metformin groups.79, 81, 89, 94
Second generation sulfonylureas versus second generation sulfonylureas plus
thiazolidinediones. Three RCTs compared a second generation sulfonylurea with a second generation sulfonylurea plus a thiazolidinedione showing similar rates of withdrawals due to an unspecified adverse event, ranging from 6% to 7% in the second generation sulfonylurea groups versus 8% to 10% in the combination arms.124-126
Other comparisons. All of the following head-to-head medication comparisons only had 1
RCT which showed generally similar rates of withdrawals due to adverse events except for metformin versus acarbose: metformin versus acarbose (between-group difference of -43%);99 and nateglinide versus repaglinide (between-group difference of -2.6%).131
118
Comparisons between drug and placebo or cohorts without comparisons (see Appendix F, Evidence Table 35)
Data from indirect comparisons were consistent with data from direct comparisons. RCTs. All drug comparisons with placebo except acarbose and metformin plus second
generation sulfonylurea had similar withdrawals due to unspecified adverse events in both groups: thiazolidinediones versus placebo (9 studies, range in between-group differences -7 to 3.6%);164, 166, 170-172, 188 second generation sulfonylureas versus placebo (4 studies, range in between-group differences -5% to 5%);135 metformin versus placebo (5 studies, range in between-group differences of -2.4% to 15%);79 meglitinides versus placebo (3 studies, range in between-group differences of -3% to 3.3%);96, 139, 218, 241 One RCT136 using different doses of second generation sulfonylureas compared with placebo reported a lower rate of withdrawals due to unspecified adverse events for the second generation sulfonylurea arms of 5% to 12% compared with the placebo arm of 30%. The placebo rate was attributed to excessive hyperglycemia by the authors. Alpha-glucosidase inhibitors had slightly greater withdrawals due to unspecified adverse events than placebo (2 studies, range in between-group differences of 8% to 13%). The one RCT comparing metformin plus second generation sulfonylurea versus placebo showed a higher rate of withdrawals in the combination arms (incidence rates of 3.8% and 11.1% for the combination arms compared with 1.9% for placebo).79
Cohorts or non-randomized trials. Four pre-post or post-marketing surveillance studies
followed subjects on one oral diabetes medication over time, and reported the number that withdrew due to unspecified adverse events.209, 211, 226, 227 Each study evaluated a different oral diabetes medication so we were unable to assess differences across different medications. The incidence of withdrawals due to adverse events ranged from 0% to 6.1%. This was consistent with withdrawal rates reported in the RCTs. Summary of Food and Drug Administration Data, Pharmaceutical Company Information, and Ongoing Trials Key points
• Data accessed through the FDA and commercial sources did not identify any major safety concerns that were not apparent from our review of published studies on the following oral diabetes medications and combinations: metformin, extended release metformin, rosiglitazone, rosiglitazone plus second generation sulfonylurea, extended release glipizide, metformin plus glyburide, and metformin plus glipizide.
• One exception was that pioglitazone was associated with increased rates of
hospitalizations for acute cholecystitis compared with placebo in a pooled analysis.
• Several ongoing clinical trials are comparing the vascular effects of second generation sulfonylureas and rosiglitazone.
119
Results. After searching the FDA’s publicly available data on oral diabetes medications, and data from commercial sources such as pharmaceutical company information, we found a total of 81 studies with information about adverse events.
Metformin. We found 21 studies with a total of 602 participants evaluating metformin.
Nineteen were published studies and two were unpublished. The two unpublished studies had a total of 52 participants and reported results on adverse events consistent with results from other studies of metformin. No new safety issues arose.
Metformin XR. Six studies were found evaluating metformin extended release compared
with metformin immediate release or placebo. These studies had a total of 1612 participants, and confirmed several findings that we found in our systematic review. First, metformin extended release had similar GI adverse events compared with metformin immediate release. Additionally, metformin extended release had worse GI adverse events compared with placebo. Second, a safety update in August 2000 reported that about 10,000 patients taking metformin extended release had participated in clinical trials, and lactic acidosis was reported only in one case diagnosed by a low bicarbonate level after a fatal arrest. This rate of lactic acidosis was consistent with the findings from our review of published studies. Other adverse events reported were minimal and consistent with results of our review of published literature.
Rosiglitazone. Four studies evaluated rosiglitazone in a total of 4327 participants. Once
again, the studies confirmed findings seen in our report. Edema was more common among subjects taking rosiglitazone compared with metformin and glyburide. Hypoglycemia was more frequent in the glyburide group compared with the rosiglitazone group. Anemia developed more frequently with rosiglitazone when compared with glyburide or placebo. In one study, the hematocrit fell 1.92%, 3.33%, and 0.69% for two different doses of rosiglitazone compared with placebo respectively. Clinically relevant aminotransferase elevations occurred in 0.27% of subjects taking rosiglitazone versus 0.19% of subjects on placebo in a pooled analysis of all the participants. A safety update was submitted to the FDA in February 2000 based on 4696 patients on rosiglitazone monotherapy or combination therapy. The update identified no new safety issues but listed 3 patients with possible drug-associated hepatitis. By March 2000, the FDA had received 2 reports of deaths due to liver failure and no reports of liver transplants in patients taking rosiglitazone. It is unknown whether the case reports were related to rosiglitazone treatment or not. Other adverse events were either similar between groups or consistent with findings in our report.
Additionally, one unpublished study from the pharmaceutical company evaluated 224 patients with New York Heart Association Class I or II CHF in a 52 week double-blind echocardiographic study, showing more cardiovascular events with rosiglitazone compared with placebo in addition to existing oral diabetes medications. While cardiovascular death was similar between groups (5% vs 4%), the rosiglitazone group had higher numbers of subjects with CHF related-events (CHF exacerbation was 6% vs 4%, new or worsening edema was 25% vs 9%, new or worsening dyspnea was 26% vs 17%, increased medication for CHF was 33% vs 18%, and cardiovascular hospitalization was 19% vs 13%). These results are consistent with results reported in the CHF and edema sections of the report. In contrast to published studies, there was also an increased number of investigator-reported, unadjudicated ischemic adverse events in the rosiglitazone group (myocardial infarction 5% vs 2%, and angina 5% vs 3%).
120
Rosiglitazone plus second generation sulfonylurea. Three studies in 726 participants evaluated the combination of rosiglitazone and a second generation sulfonylurea from the FDA data. The reported rates of edema and anemia were similar to the rates reported in the published studies that we reviewed, and were similar to the rates reported for rosiglitazone monotherapy. One study reported one death due to subarachnoid hemorrhage in the placebo arm, and three deaths from acute myocardial infarction in the rosiglitazone arms. Another study reported one cardiac death in the rosiglitazone plus second generation sulfonylurea arm and in the glyburide arm, while a third study reported no deaths. A February 2000 safety update for metformin included a phase 3 study of rosiglitazone in patients on insulin, which reported that the rate of CHF per 100 patient-years was 0.6 (95 % CI 0.01-3.30), 0.7 (95% CI 0.4-1.09), and 0.6 (95% CI 0.2-1.5) in the placebo, rosiglitazone, and rosiglitazone plus second generation sulfonylurea groups, respectively.
Pioglitazone. Six RCTs and one continuation trial in 1526 participants evaluated
pioglitazone. Most adverse events were either similar between groups or similar to our previously reported findings. The pooled safety analysis included in the June 1999 FDA review reported hospitalization for acute cholecystitis in 12 pioglitazone subjects compared with one placebo subject, respectively. The rates of elevated alanine aminotransferase levels at least 3 times the upper limit of normal were 0.26% (4 out of 1526 subjects) and 0.25% (2 out of 793 subjects) in U.S. trials, and 0.7% (4 out of 570 subjects) and 0.7% (2 out of 280 subjects) in Japanese trials, for the pioglitazone and placebo groups, respectively. Mean hemoglobin levels fell 0.08 g/dL in the placebo groups and 0.38 in the pioglitazone groups; hematocrit decreases of at least 10% occurred in 5 of 599 patients on pioglitazone. Three patients taking pioglitazone in U.S. placebo-controlled trials had elevations in creatine phosphokinase of at least 10 times the upper limit of normal. Monotherapy studies reported edema in 29 of 606 subjects (4.8%) and 3 of 259 subjects (1.2%) taking pioglitazone and placebo, respectively.
Metformin plus glyburide. FDA data contained four RCTs with one open label extension
that evaluated the combination of metformin plus glyburide in 2440 participants. One unpublished RCT was from a pharmaceutical company directly. The trials had findings consistent with the studies described in this report. More GI events occurred for subjects on higher doses of metformin as part of the combination therapy. Safety data were available on 826 patients in the open label extension trial, 500 on metformin/glyburide 250/1.25mg and 326 on metformin/glyburide 500/2.5mg. Nineteen subjects (2.3%) were hospitalized for surgery or ischemic heart disease, and nineteen (2.3%) withdrew because of adverse events. One patient withdrew because of elevated lactate levels. A safety update was submitted in January 2000 based on 1303 patients on long-term open-label studies taking a combination of glyburide and metformin (mean exposure 212 days). No deaths were reported. Thirty-three patients (2.5%) had serious adverse events. Fifteen total patients (1.2%) discontinued the medication due to an adverse event. Two of these were hospitalizations for CHF, four patients had hypoglycemia, three had diarrhea, two had rashes and four patients had other unspecified adverse events.
Nateglinide. We identified 32 studies that evaluated nateglinide in the FDA data. These data
suggested that hypoglycemia may be less frequent with nateglinide than with second generation sulfonylureas, and that hypoglycemia rates with nateglinide are similar to the rates with metformin. One post-marketing study in Japan reported one case of hypoglycemia in a subject
121
with renal insufficiency. However, another study in subjects with renal insufficiency was stopped early when subjects who were switched from their existing oral diabetes medications to nateglinide showed hyperglycemia. The FDA documents supported the finding from the studies discussed in our report that nateglinide may have less benefit on HbA1c than metformin or second generation sulfonylureas. Nateglinide was also associated with weight gain compared with placebo, which may be attenuated slightly when used in combination with metformin.
Metformin plus glipizide. Two RCTs evaluated the combination of metformin plus glipizide.
One of these was published and one was unpublished. The unpublished study was consistent with findings from the published studies that we reviewed earlier in this report. Cardiovascular events were similar between the combination and monotherapy arms of the unpublished trial. Hypoglycemia was more common in the combination arm compared with monotherapy arms, consistent with our review of all published studies.
Glucotrol XL. Pfizer Inc. (New York, NY) reported on one unpublished study for Glucotrol
XL® (glipizide GITS) in two doses compared with placebo, in 108 participants. The results of this study were consistent with results reported for second generation sulfonylureas in this review. No serious adverse events occurred in this study. Additionally, there is one ongoing study of glipizide compared with rosiglitazone on reducing or slowing the development of atherosclerosis in the blood vessels of the heart. No results are available yet. Additionally, no FDA documents were available for review on glipizide GITS.
Glyburide. There is also one ongoing trial evaluating comparative vascular effects of
glyburide compared with rosiglitazone. No FDA documents were available for review of glyburide. Study Quality Most RCTs that had data relevant to Key Questions 4 or 5 (85%) did not give enough description of the randomization technique to determine whether the trial was appropriately randomized. About two-thirds (66%) of these RCTs were characterized as double-blind according to the authors. However, most of these trials (73%) did not describe the blinding procedure or make reference to using active placebos. Additionally, 18% of these RCTs did not report on withdrawals or losses to followup (see Appendix F, Evidence Table 46). Key Limitations
Eighteen percent of RCTs with data on Key Questions 4 or 5 did not report on withdrawals or losses to followup. This may have led to underestimation or overestimation of the adverse effects for one medication compared with another. We included the summary of data on withdrawals due to unspecified adverse events to make sure that the evidence report did not overlook these data. These data by themselves have limited usefulness because they did not identify specific reasons for the withdrawals. We therefore abstracted data separately on withdrawals due to specific adverse events and reported them in their appropriate sections. Additionally, RCTs many times had different definitions of the adverse events under discussion or only reported certain adverse events which made it difficult to compare side effects across
122
trials. For instance, GI adverse events could be reported as nausea, diarrhea, abdominal pain, vomiting, constipation, or flatulence. In some studies, these effects were lumped together while in other studies these were reported separately. Few RCTs evaluated certain outcomes such as elevated liver transaminases, CHF, anemia, cancer, and allergic reactions; therefore, we relied on a small number of cohort studies for many of these outcomes. The available cohort studies, however, have been limited by their ability to adjust for key confounders such as HbA1c levels, blood pressure, lab data, duration of diabetes, adherence to medications, and doses of medications. Most studies occurred in patients without standard contraindications such as renal or hepatic insufficiency; therefore, we cannot generalize these findings to those specific situations. The indirect comparison results for hypoglycemia must be viewed with caution because indirect comparisons tend to overestimate effects175 and we were unable to fully assess heterogeneity in the placebo groups.
Key Question 6: Do safety and effectiveness of oral diabetes medications for the treatment of adults with type 2 diabetes differ across particular adult populations such as those based on demographic factors (e.g., race/ethnicity, age greater than 65 years, or gender) or comorbid conditions (e.g., renal insufficiency, CHF, liver disease, obesity, depression, or schizophrenia)? Subgroup Analyses Results (see Table 22)
We were unable to draw conclusions based on subgroup analyses due to the small numbers
studies for each of the subgroups, the variability in outcomes, and the variety of oral diabetes medications evaluated. Seventeen studies conducted subgroup analyses relevant to Key Question 6. The outcomes most commonly evaluated included glycemic control (HbA1c) (8 studies), mortality (3 studies), CHF (2 studies) and changes in urinary albumin-to-creatinine ratio (2 studies). None of the articles we reviewed conducted subgroup analyses on liver disease, depression, or schizophrenia. Articles reporting more than one study
Seventeen studies reported on more than one trial.242-258 Many of these studies pooled data for studies already included in our review; therefore, we did not abstract information from these articles. We abstracted and reported results for articles that we did not have in our review. The conclusions from these studies are consistent with the findings of our review (see Table 23).
123
Grading of the Body of Evidence
The evidence grades varied for data on the comparative effectiveness of oral diabetes medications for all of the outcomes addressed in Key Questions 1, 2 and 3. We graded the body of evidence for the comparisons of greatest interest, and those results are reported in each section and in the body of the evidence tables (see Appendix F, Evidence Tables 4 and 17).
Publication Bias Results
Overall, we did not find strong evidence for publication bias in this literature. Across all analyses, there were only 2 statistically significant comparisons (p-value <0.05) by the less conservative Eggers test. Both of these were for studies of hypoglycemia: metformin versus second generation sulfonylurea (p =0.04, number of studies (N) =8); and repaglinide versus placebo (p=0.035, number of studies (N) =3). For all other comparisons, the funnel plots appeared roughly symmetrical and the Begg’s and Egger’s tests were not significant. It is important to note that in most cases the number of studies in each comparison was small and was unlikely to have had high power to detect moderate publication bias.
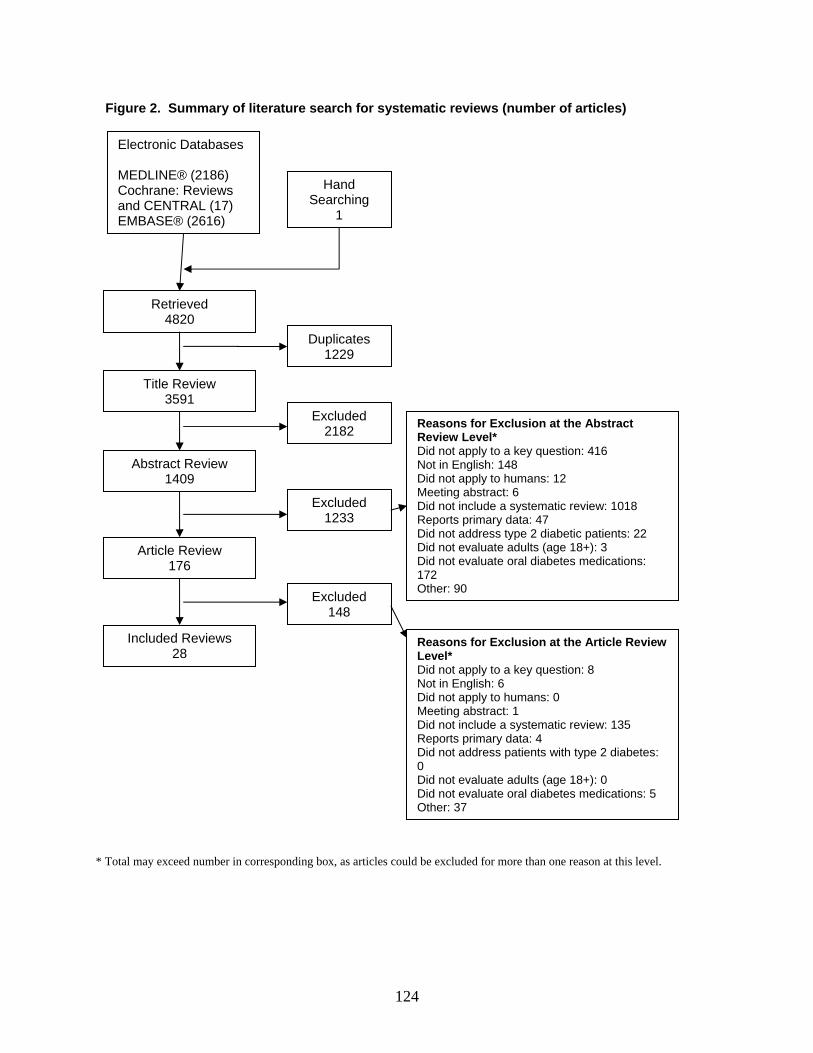
124
* Total may exceed number in corresponding box, as articles could be excluded for more than one reason at this level.
Figure 2. Summary of literature search for systematic reviews (number of articles)
Electronic Databases MEDLINE® (2186) Cochrane: Reviews and CENTRAL (17) EMBASE® (2616)
Hand Searching
1
Retrieved 4820
Title Review 3591
Duplicates 1229
Abstract Review 1409
Excluded 2182
Article Review 176
Excluded 1233
Included Reviews 28
Excluded 148
Reasons for Exclusion at the Abstract Review Level* Did not apply to a key question: 416 Not in English: 148 Did not apply to humans: 12 Meeting abstract: 6 Did not include a systematic review: 1018 Reports primary data: 47 Did not address type 2 diabetic patients: 22 Did not evaluate adults (age 18+): 3 Did not evaluate oral diabetes medications: 172 Other: 90
Reasons for Exclusion at the Article Review Level* Did not apply to a key question: 8 Not in English: 6 Did not apply to humans: 0 Meeting abstract: 1 Did not include a systematic review: 135 Reports primary data: 4 Did not address patients with type 2 diabetes: 0 Did not evaluate adults (age 18+): 0 Did not evaluate oral diabetes medications: 5 Other: 37
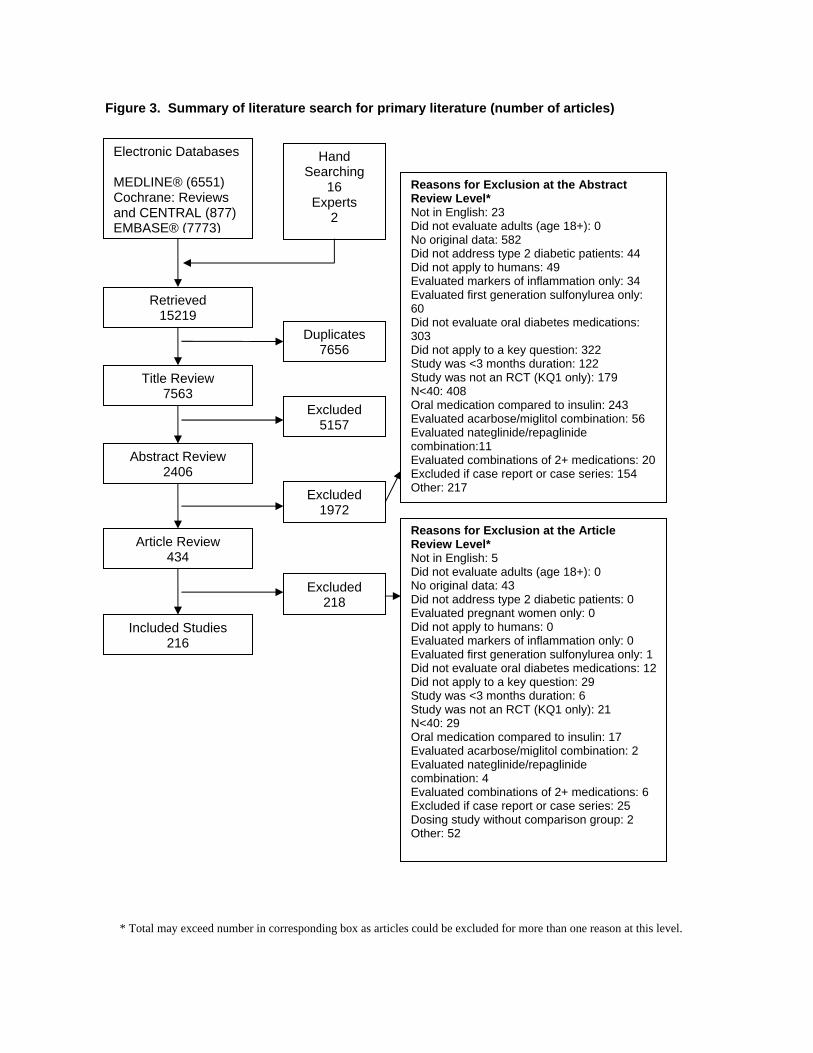
* Total may exceed number in corresponding box as articles could be excluded for more than one reason at this level.
Figure 3. Summary of literature search for primary literature (number of articles)
Electronic Databases MEDLINE® (6551) Cochrane: Reviews and CENTRAL (877) EMBASE®
Hand Searching
16 Experts
2 (7773)
Retrieved 15219
Title Review 7563
Duplicates 7656
Abstract Review 2406
Excluded 5157
Article Review 434
Excluded 1972
Included Studies 216
Excluded 218
Reasons for Exclusion at the Abstract Review Level* Not in English: 23 Did not evaluate adults (age 18+): 0 No original data: 582 Did not address type 2 diabetic patients: 44 Did not apply to humans: 49 Evaluated markers of inflammation only: 34 Evaluated first generation sulfonylurea only: 60 Did not evaluate oral diabetes medications: 303 Did not apply to a key question: 322 Study was <3 months duration: 122 Study was not an RCT (KQ1 only): 179 N<40: 408 Oral medication compared to insulin: 243 Evaluated acarbose/miglitol combination: 56 Evaluated nateglinide/repaglinide combination:11 Evaluated combinations of 2+ medications: 20 Excluded if case report or case series: 154 Other: 217
Reasons for Exclusion at the Article Review Level* Not in English: 5 Did not evaluate adults (age 18+): 0 No original data: 43 Did not address type 2 diabetic patients: 0 Evaluated pregnant women only: 0 Did not apply to humans: 0 Evaluated markers of inflammation only: 0 Evaluated first generation sulfonylurea only: 1 Did not evaluate oral diabetes medications: 12 Did not apply to a key question: 29 Study was <3 months duration: 6 Study was not an RCT (KQ1 only): 21 N<40: 29 Oral medication compared to insulin: 17 Evaluated acarbose/miglitol combination: 2 Evaluated nateglinide/repaglinide combination: 4 Evaluated combinations of 2+ medications: 6 Excluded if case report or case series: 25 Dosing study without comparison group: 2 Other: 52
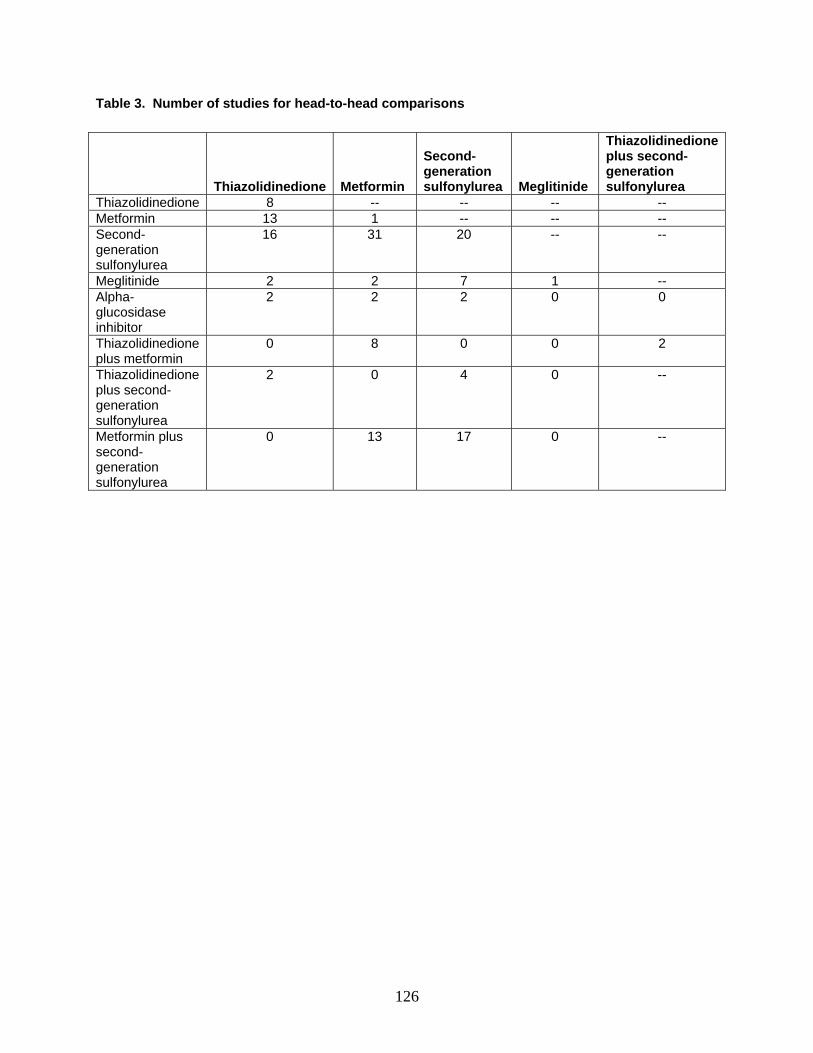
126
Table 3. Number of studies for head-to-head comparisons
Thiazolidinedione Metformin
Second-generation sulfonylurea Meglitinide
Thiazolidinedione plus second- generation sulfonylurea
Thiazolidinedione 8 -- -- -- -- Metformin 13 1 -- -- -- Second-generation sulfonylurea
16 31 20 -- --
Meglitinide 2 2 7 1 -- Alpha-glucosidase inhibitor
2 2 2 0 0
Thiazolidinedione plus metformin
0 8 0 0 2
Thiazolidinedione plus second-generation sulfonylurea
2 0 4 0 --
Metformin plus second-generation sulfonylurea
0 13 17 0 --
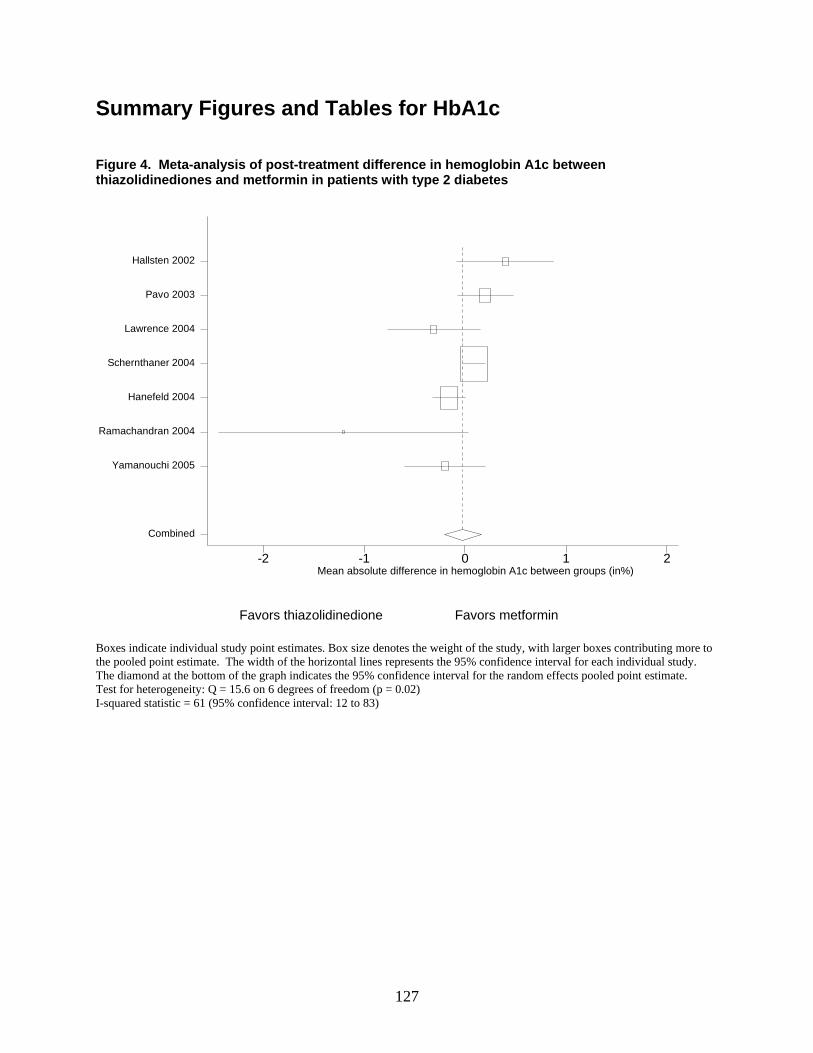
127
Summary Figures and Tables for HbA1c Figure 4. Meta-analysis of post-treatment difference in hemoglobin A1c between thiazolidinediones and metformin in patients with type 2 diabetes
mean diff in HbA1c btn groups-2 -1 0 1 2
Combined
Yamanouchi 2005
Ramachandran 2004
Hanefeld 2004
Schernthaner 2004
Lawrence 2004
Pavo 2003
Hallsten 2002
Favors thiazolidinedione Favors metformin
Boxes indicate individual study point estimates. Box size denotes the weight of the study, with larger boxes contributing more to the pooled point estimate. The width of the horizontal lines represents the 95% confidence interval for each individual study. The diamond at the bottom of the graph indicates the 95% confidence interval for the random effects pooled point estimate. Test for heterogeneity: Q = 15.6 on 6 degrees of freedom (p = 0.02) I-squared statistic = 61 (95% confidence interval: 12 to 83)
Mean absolute difference in hemoglobin A1c between groups (in%)
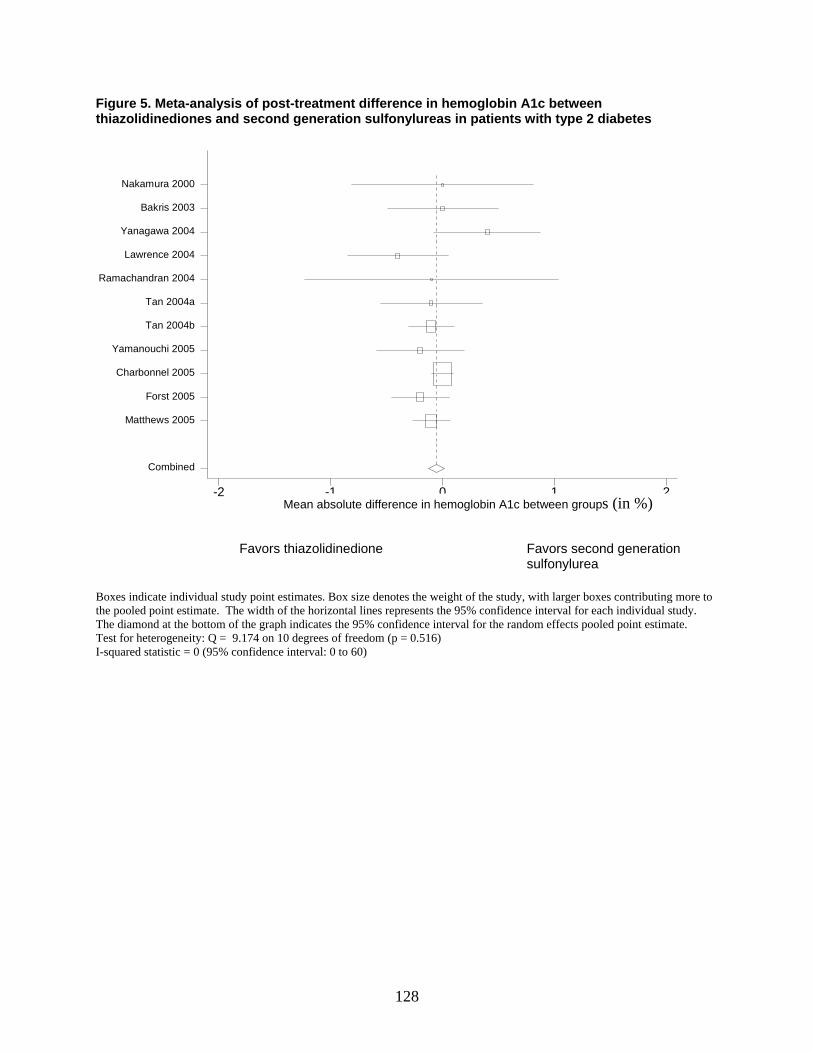
128
Figure 5. Meta-analysis of post-treatment difference in hemoglobin A1c between thiazolidinediones and second generation sulfonylureas in patients with type 2 diabetes
meandiff in HbA1c btn groups-2 -1 0 1 2
Combined
Matthews 2005
Forst 2005
Charbonnel 2005
Yamanouchi 2005
Tan 2004b
Tan 2004a
Ramachandran 2004
Lawrence 2004
Yanagawa 2004
Bakris 2003
Nakamura 2000
Favors thiazolidinedione Favors second generation sulfonylurea
Boxes indicate individual study point estimates. Box size denotes the weight of the study, with larger boxes contributing more to the pooled point estimate. The width of the horizontal lines represents the 95% confidence interval for each individual study. The diamond at the bottom of the graph indicates the 95% confidence interval for the random effects pooled point estimate. Test for heterogeneity: Q = 9.174 on 10 degrees of freedom (p = 0.516) I-squared statistic = 0 (95% confidence interval: 0 to 60)
Mean absolute difference in hemoglobin A1c between groups (in %)
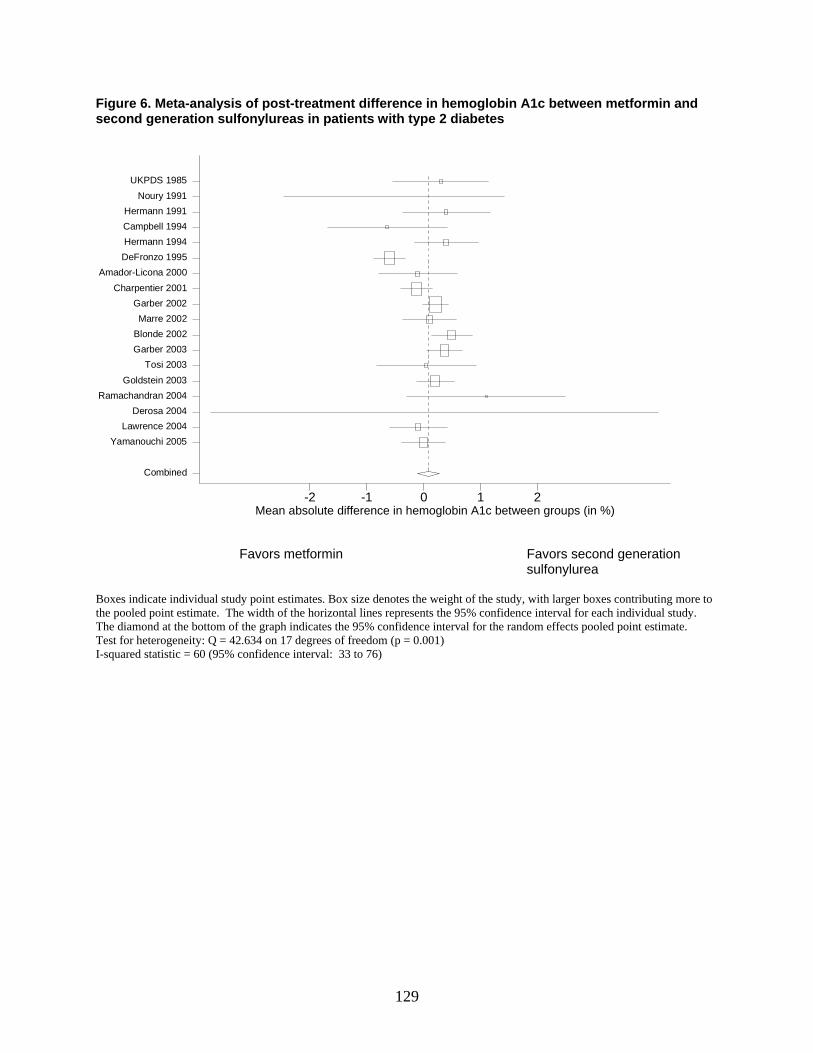
129
Figure 6. Meta-analysis of post-treatment difference in hemoglobin A1c between metformin and second generation sulfonylureas in patients with type 2 diabetes
mean diff in Hba1c btn groups-2 -1 0 1 2
Combined
Yamanouchi 2005 Lawrence 2004
Derosa 2004Ramachandran 2004
Goldstein 2003 Tosi 2003
Garber 2003 Blonde 2002 Marre 2002
Garber 2002 Charpentier 2001
Amador-Licona 2000 DeFronzo 1995 Hermann 1994 Campbell 1994 Hermann 1991
Noury 1991 UKPDS 1985
Favors metformin Favors second generation sulfonylurea
Boxes indicate individual study point estimates. Box size denotes the weight of the study, with larger boxes contributing more to the pooled point estimate. The width of the horizontal lines represents the 95% confidence interval for each individual study. The diamond at the bottom of the graph indicates the 95% confidence interval for the random effects pooled point estimate. Test for heterogeneity: Q = 42.634 on 17 degrees of freedom (p = 0.001) I-squared statistic = 60 (95% confidence interval: 33 to 76)
Mean absolute difference in hemoglobin A1c between groups (in %)
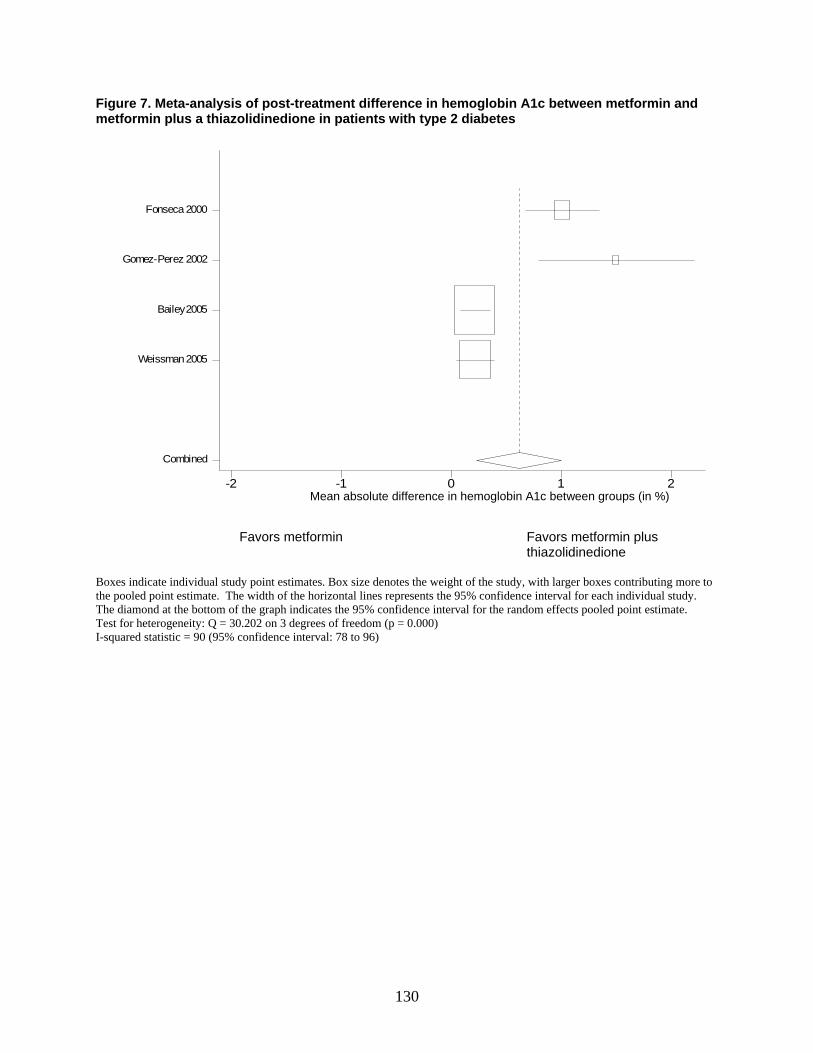
130
Figure 7. Meta-analysis of post-treatment difference in hemoglobin A1c between metformin and metformin plus a thiazolidinedione in patients with type 2 diabetes
mean diff in Hba1c btn groups-2 -1 0 1 2
Combined
Weissman 2005
Bailey 2005
Gomez-Perez 2002
Fonseca 2000
Favors metformin Favors metformin plus thiazolidinedione
Boxes indicate individual study point estimates. Box size denotes the weight of the study, with larger boxes contributing more to the pooled point estimate. The width of the horizontal lines represents the 95% confidence interval for each individual study. The diamond at the bottom of the graph indicates the 95% confidence interval for the random effects pooled point estimate. Test for heterogeneity: Q = 30.202 on 3 degrees of freedom (p = 0.000) I-squared statistic = 90 (95% confidence interval: 78 to 96)
Mean absolute difference in hemoglobin A1c between groups (in %)
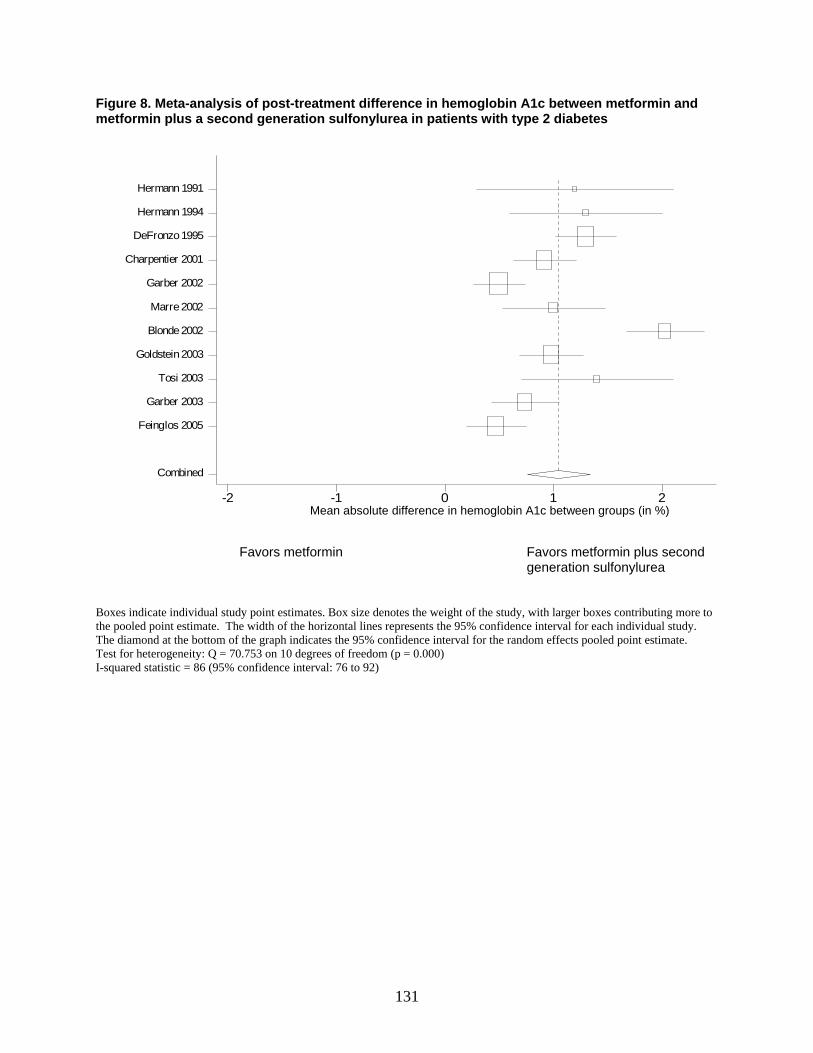
131
Figure 8. Meta-analysis of post-treatment difference in hemoglobin A1c between metformin and metformin plus a second generation sulfonylurea in patients with type 2 diabetes
mean diff in Hba1c btn groups-2 -1 0 1 2
Combined
Feinglos 2005
Garber 2003
Tosi 2003
Goldstein 2003
Blonde 2002
Marre 2002
Garber 2002
Charpentier 2001
DeFronzo 1995
Hermann 1994
Hermann 1991
Favors metformin Favors metformin plus second generation sulfonylurea
Boxes indicate individual study point estimates. Box size denotes the weight of the study, with larger boxes contributing more to the pooled point estimate. The width of the horizontal lines represents the 95% confidence interval for each individual study. The diamond at the bottom of the graph indicates the 95% confidence interval for the random effects pooled point estimate. Test for heterogeneity: Q = 70.753 on 10 degrees of freedom (p = 0.000) I-squared statistic = 86 (95% confidence interval: 76 to 92)
Mean absolute difference in hemoglobin A1c between groups (in %)
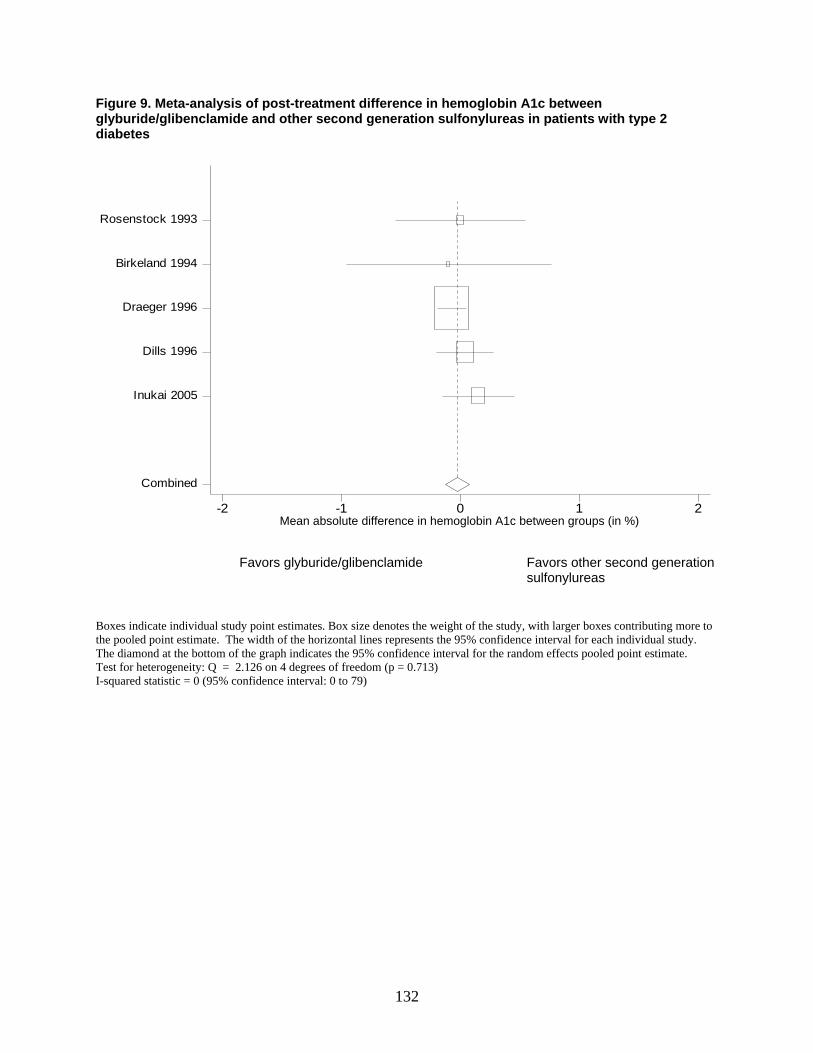
132
Figure 9. Meta-analysis of post-treatment difference in hemoglobin A1c between glyburide/glibenclamide and other second generation sulfonylureas in patients with type 2 diabetes
meandiff-2 -1 0 1 2
Combined
Inukai 2005
Dills 1996
Draeger 1996
Birkeland 1994
Rosenstock 1993
Favors glyburide/glibenclamide Favors other second generation sulfonylureas
Boxes indicate individual study point estimates. Box size denotes the weight of the study, with larger boxes contributing more to the pooled point estimate. The width of the horizontal lines represents the 95% confidence interval for each individual study. The diamond at the bottom of the graph indicates the 95% confidence interval for the random effects pooled point estimate. Test for heterogeneity: Q = 2.126 on 4 degrees of freedom (p = 0.713) I-squared statistic = 0 (95% confidence interval: 0 to 79)
Mean absolute difference in hemoglobin A1c between groups (in %)
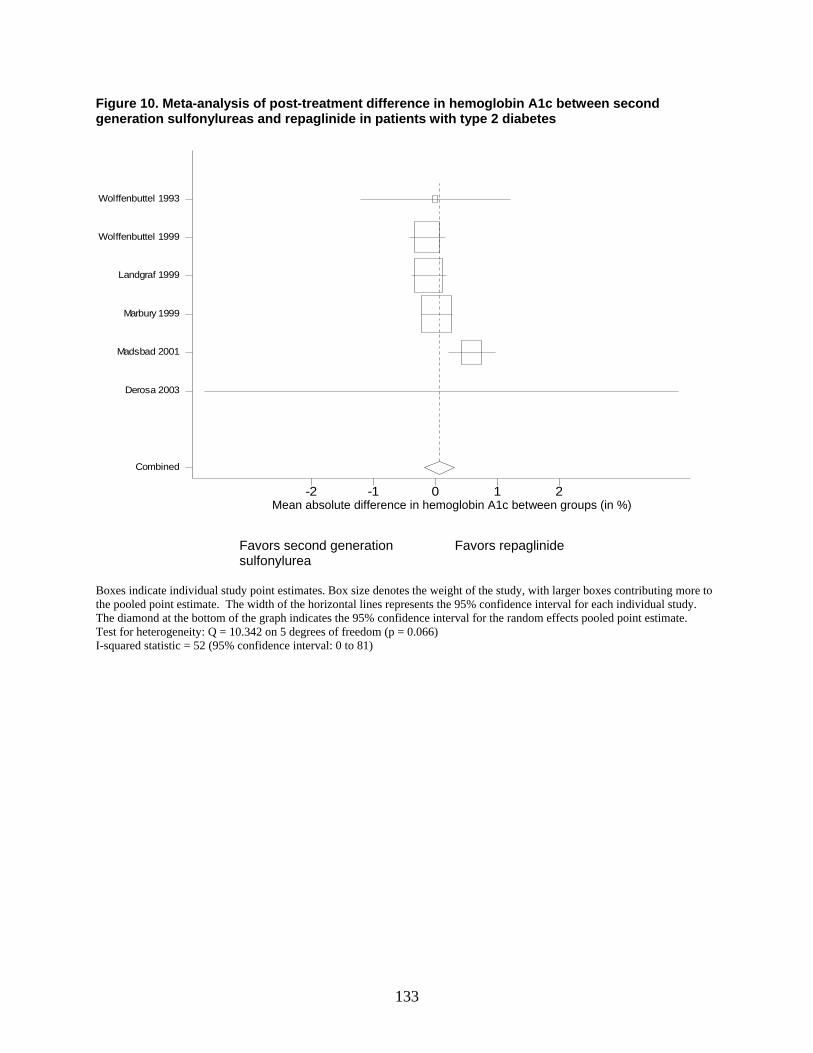
133
Figure 10. Meta-analysis of post-treatment difference in hemoglobin A1c between second generation sulfonylureas and repaglinide in patients with type 2 diabetes
meandiff-2 -1 0 1 2
Combined
Derosa 2003
Madsbad 2001
Marbury 1999
Landgraf 1999
Wolffenbuttel 1999
Wolffenbuttel 1993
Favors second generation Favors repaglinide sulfonylurea
Boxes indicate individual study point estimates. Box size denotes the weight of the study, with larger boxes contributing more to the pooled point estimate. The width of the horizontal lines represents the 95% confidence interval for each individual study. The diamond at the bottom of the graph indicates the 95% confidence interval for the random effects pooled point estimate. Test for heterogeneity: Q = 10.342 on 5 degrees of freedom (p = 0.066) I-squared statistic = 52 (95% confidence interval: 0 to 81)
Mean absolute difference in hemoglobin A1c between groups (in %)

134
Figure 11. Meta-analysis of post-treatment difference in hemoglobin A1c between second generation sulfonylureas and thiazolidinediones plus a second generation sulfonylurea in patients with type 2 diabetes
mean diff in Hba1c btn groups-2 -1 0 1 2
Combined
Pf utzner 2006
Rosenstock 2006
Kereny i 2004
Baksi 2004
Favors second generation sulfonylurea Favors thiazolidinedione plus second generation sulfonylurea
Boxes indicate individual study point estimates. Box size denotes the weight of the study, with larger boxes contributing more to the pooled point estimate. The width of the horizontal lines represents the 95% confidence interval for each individual study. The diamond at the bottom of the graph indicates the 95% confidence interval for the random effects pooled point estimate. Test for heterogeneity: Q = 15.448 on 3 degrees of freedom (p = 0.001) I-squared statistic = 81 (95% confidence interval: 49 to 93)
Mean absolute difference in hemoglobin A1c between groups (in %)
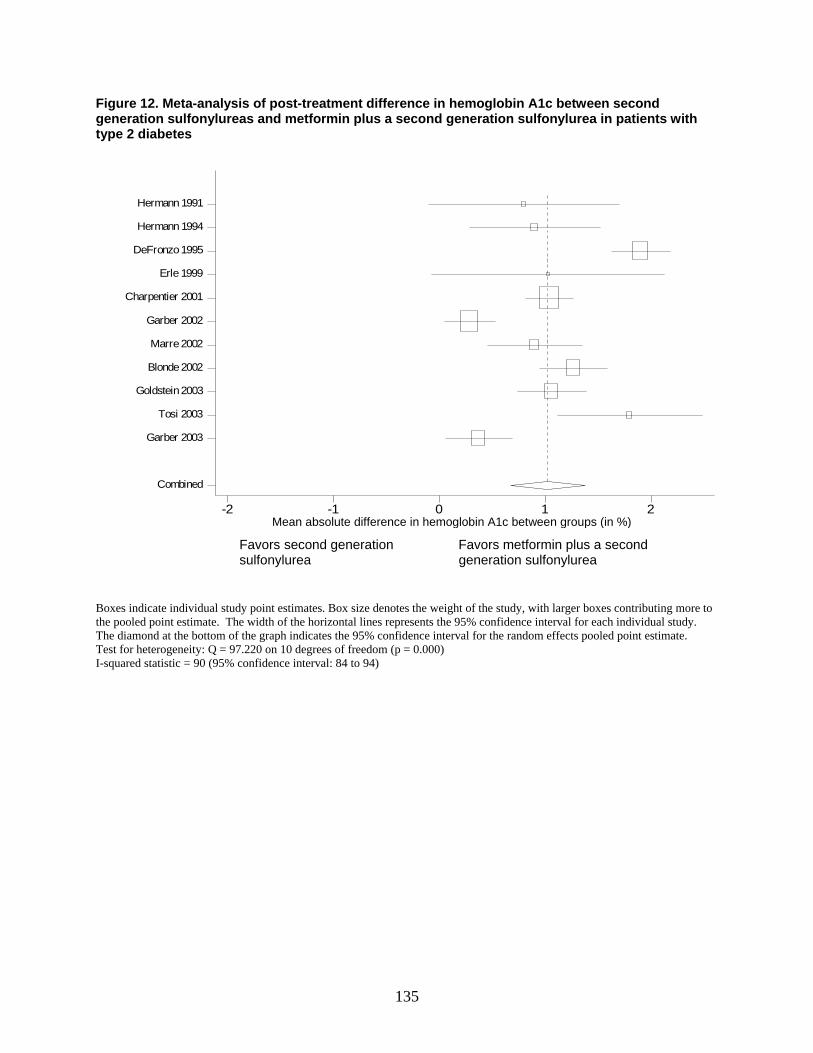
135
Figure 12. Meta-analysis of post-treatment difference in hemoglobin A1c between second generation sulfonylureas and metformin plus a second generation sulfonylurea in patients with type 2 diabetes
mean diff in Hba1c btn groups-2 -1 0 1 2
Combined
Garber 2003
Tosi 2003
Goldstein 2003
Blonde 2002
Marre 2002
Garber 2002
Charpentier 2001
Erle 1999
DeFronzo 1995
Hermann 1994
Hermann 1991
Favors second generation Favors metformin plus a second
sulfonylurea generation sulfonylurea
Boxes indicate individual study point estimates. Box size denotes the weight of the study, with larger boxes contributing more to the pooled point estimate. The width of the horizontal lines represents the 95% confidence interval for each individual study. The diamond at the bottom of the graph indicates the 95% confidence interval for the random effects pooled point estimate. Test for heterogeneity: Q = 97.220 on 10 degrees of freedom (p = 0.000) I-squared statistic = 90 (95% confidence interval: 84 to 94)
Mean absolute difference in hemoglobin A1c between groups (in %)
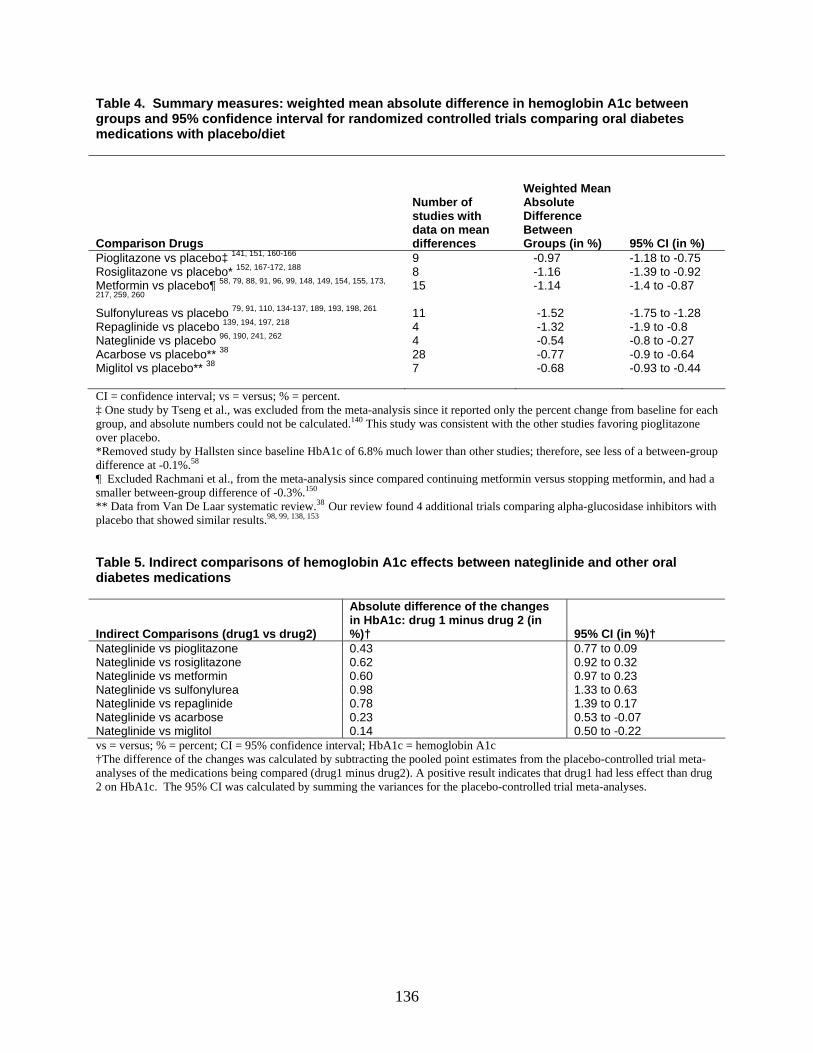
136
Table 4. Summary measures: weighted mean absolute difference in hemoglobin A1c between groups and 95% confidence interval for randomized controlled trials comparing oral diabetes medications with placebo/diet
Comparison Drugs
Number of studies with data on mean differences
Weighted Mean Absolute Difference Between Groups (in %) 95% CI (in %)
Pioglitazone vs placebo‡ 141, 151, 160-166 9 -0.97 -1.18 to -0.75 Rosiglitazone vs placebo* 152, 167-172, 188 8 -1.16 -1.39 to -0.92 Metformin vs placebo¶ 58, 79, 88, 91, 96, 99, 148, 149, 154, 155, 173,
217, 259, 260 15 -1.14 -1.4 to -0.87
Sulfonylureas vs placebo 79, 91, 110, 134-137, 189, 193, 198, 261 11 -1.52 -1.75 to -1.28 Repaglinide vs placebo 139, 194, 197, 218 4 -1.32 -1.9 to -0.8 Nateglinide vs placebo 96, 190, 241, 262 4 -0.54 -0.8 to -0.27 Acarbose vs placebo** 38 28 -0.77 -0.9 to -0.64 Miglitol vs placebo** 38
7 -0.68 -0.93 to -0.44
CI = confidence interval; vs = versus; % = percent. ‡ One study by Tseng et al., was excluded from the meta-analysis since it reported only the percent change from baseline for each group, and absolute numbers could not be calculated.140 This study was consistent with the other studies favoring pioglitazone over placebo. *Removed study by Hallsten since baseline HbA1c of 6.8% much lower than other studies; therefore, see less of a between-group difference at -0.1%.58 ¶ Excluded Rachmani et al., from the meta-analysis since compared continuing metformin versus stopping metformin, and had a smaller between-group difference of -0.3%.150 ** Data from Van De Laar systematic review.38 Our review found 4 additional trials comparing alpha-glucosidase inhibitors with placebo that showed similar results.98, 99, 138, 153 Table 5. Indirect comparisons of hemoglobin A1c effects between nateglinide and other oral diabetes medications
Indirect Comparisons (drug1 vs drug2)
Absolute difference of the changes in HbA1c: drug 1 minus drug 2 (in %)† 95% CI (in %)†
Nateglinide vs pioglitazone 0.43 0.77 to 0.09 Nateglinide vs rosiglitazone 0.62 0.92 to 0.32 Nateglinide vs metformin 0.60 0.97 to 0.23 Nateglinide vs sulfonylurea 0.98 1.33 to 0.63 Nateglinide vs repaglinide 0.78 1.39 to 0.17 Nateglinide vs acarbose 0.23 0.53 to -0.07 Nateglinide vs miglitol 0.14 0.50 to -0.22 vs = versus; % = percent; CI = 95% confidence interval; HbA1c = hemoglobin A1c †The difference of the changes was calculated by subtracting the pooled point estimates from the placebo-controlled trial meta-analyses of the medications being compared (drug1 minus drug2). A positive result indicates that drug1 had less effect than drug 2 on HbA1c. The 95% CI was calculated by summing the variances for the placebo-controlled trial meta-analyses.
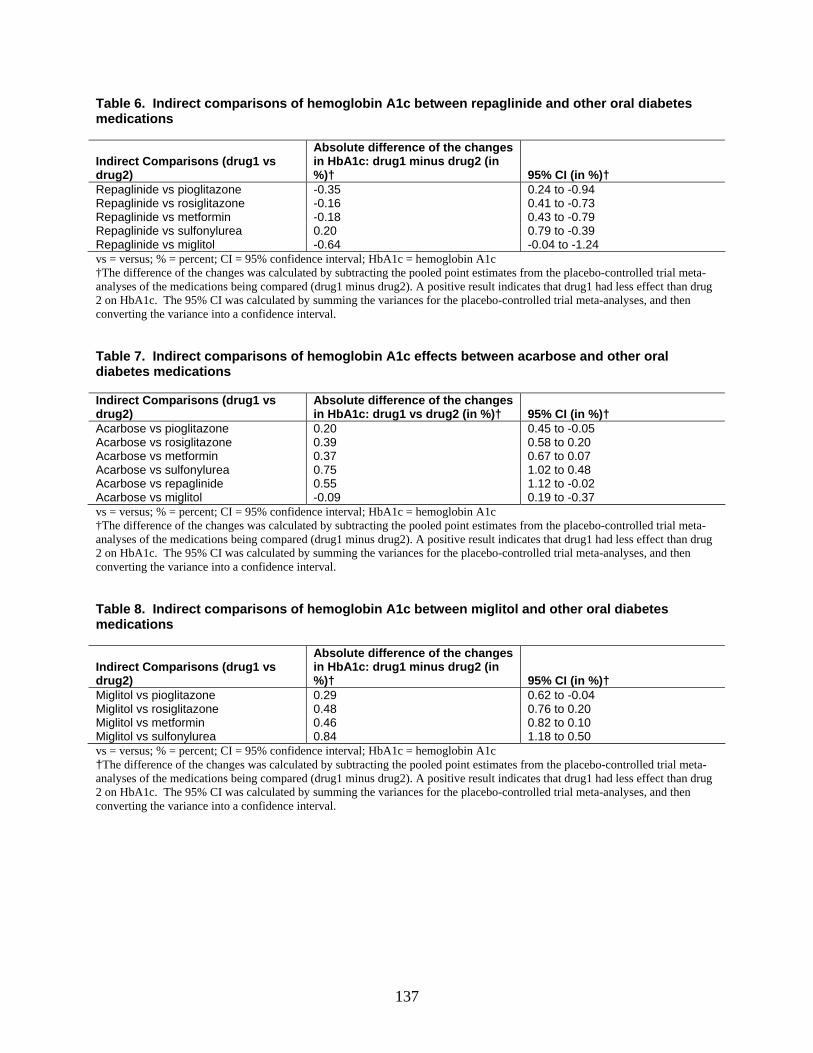
137
Table 6. Indirect comparisons of hemoglobin A1c between repaglinide and other oral diabetes medications
Indirect Comparisons (drug1 vs drug2)
Absolute difference of the changes in HbA1c: drug1 minus drug2 (in %)† 95% CI (in %)†
Repaglinide vs pioglitazone -0.35 0.24 to -0.94 Repaglinide vs rosiglitazone -0.16 0.41 to -0.73 Repaglinide vs metformin -0.18 0.43 to -0.79 Repaglinide vs sulfonylurea 0.20 0.79 to -0.39 Repaglinide vs miglitol -0.64 -0.04 to -1.24 vs = versus; % = percent; CI = 95% confidence interval; HbA1c = hemoglobin A1c †The difference of the changes was calculated by subtracting the pooled point estimates from the placebo-controlled trial meta-analyses of the medications being compared (drug1 minus drug2). A positive result indicates that drug1 had less effect than drug 2 on HbA1c. The 95% CI was calculated by summing the variances for the placebo-controlled trial meta-analyses, and then converting the variance into a confidence interval. Table 7. Indirect comparisons of hemoglobin A1c effects between acarbose and other oral diabetes medications Indirect Comparisons (drug1 vs drug2)
Absolute difference of the changes in HbA1c: drug1 vs drug2 (in %)† 95% CI (in %)†
Acarbose vs pioglitazone 0.20 0.45 to -0.05 Acarbose vs rosiglitazone 0.39 0.58 to 0.20 Acarbose vs metformin 0.37 0.67 to 0.07 Acarbose vs sulfonylurea 0.75 1.02 to 0.48 Acarbose vs repaglinide 0.55 1.12 to -0.02 Acarbose vs miglitol -0.09 0.19 to -0.37 vs = versus; % = percent; CI = 95% confidence interval; HbA1c = hemoglobin A1c †The difference of the changes was calculated by subtracting the pooled point estimates from the placebo-controlled trial meta-analyses of the medications being compared (drug1 minus drug2). A positive result indicates that drug1 had less effect than drug 2 on HbA1c. The 95% CI was calculated by summing the variances for the placebo-controlled trial meta-analyses, and then converting the variance into a confidence interval. Table 8. Indirect comparisons of hemoglobin A1c between miglitol and other oral diabetes medications
Indirect Comparisons (drug1 vs drug2)
Absolute difference of the changes in HbA1c: drug1 minus drug2 (in %)† 95% CI (in %)†
Miglitol vs pioglitazone 0.29 0.62 to -0.04 Miglitol vs rosiglitazone 0.48 0.76 to 0.20 Miglitol vs metformin 0.46 0.82 to 0.10 Miglitol vs sulfonylurea 0.84 1.18 to 0.50 vs = versus; % = percent; CI = 95% confidence interval; HbA1c = hemoglobin A1c †The difference of the changes was calculated by subtracting the pooled point estimates from the placebo-controlled trial meta-analyses of the medications being compared (drug1 minus drug2). A positive result indicates that drug1 had less effect than drug 2 on HbA1c. The 95% CI was calculated by summing the variances for the placebo-controlled trial meta-analyses, and then converting the variance into a confidence interval.
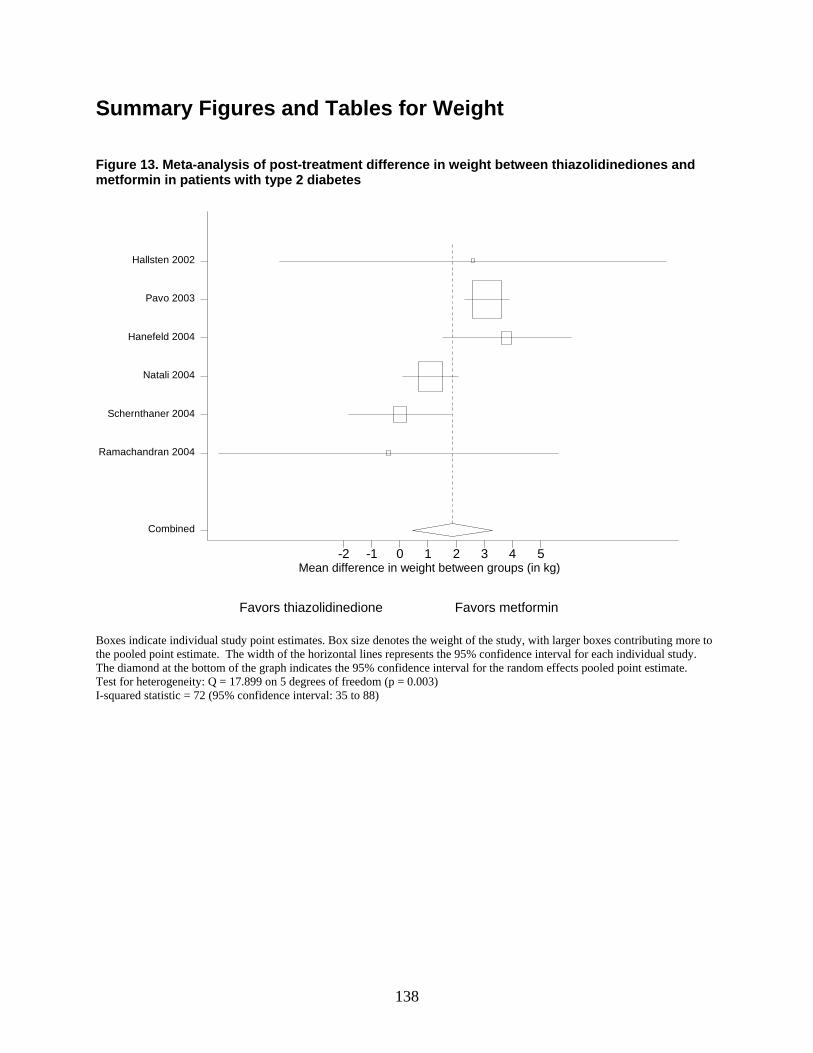
138
Summary Figures and Tables for Weight Figure 13. Meta-analysis of post-treatment difference in weight between thiazolidinediones and metformin in patients with type 2 diabetes
mean diff-2 -1 0 1 2 3 4 5
Combined
Ramachandran 2004
Schernthaner 2004
Natali 2004
Hanefeld 2004
Pavo 2003
Hallsten 2002
Favors thiazolidinedione Favors metformin
Boxes indicate individual study point estimates. Box size denotes the weight of the study, with larger boxes contributing more to the pooled point estimate. The width of the horizontal lines represents the 95% confidence interval for each individual study. The diamond at the bottom of the graph indicates the 95% confidence interval for the random effects pooled point estimate. Test for heterogeneity: Q = 17.899 on 5 degrees of freedom (p = 0.003) I-squared statistic = 72 (95% confidence interval: 35 to 88)
Mean difference in weight between groups (in kg)
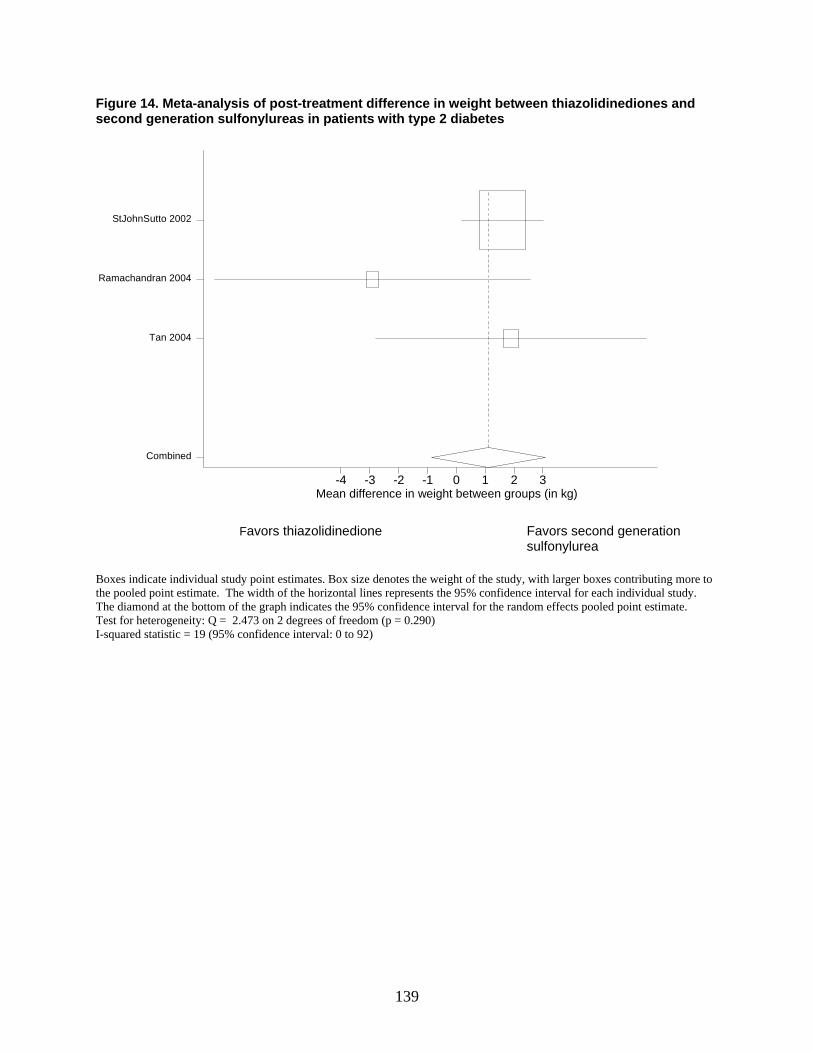
139
Figure 14. Meta-analysis of post-treatment difference in weight between thiazolidinediones and second generation sulfonylureas in patients with type 2 diabetes
mean diff in weight btn groups-4 -3 -2 -1 0 1 2 3
Combined
Tan 2004
Ramachandran 2004
StJohnSutto 2002
Favors thiazolidinedione Favors second generation
sulfonylurea Boxes indicate individual study point estimates. Box size denotes the weight of the study, with larger boxes contributing more to the pooled point estimate. The width of the horizontal lines represents the 95% confidence interval for each individual study. The diamond at the bottom of the graph indicates the 95% confidence interval for the random effects pooled point estimate. Test for heterogeneity: Q = 2.473 on 2 degrees of freedom (p = 0.290) I-squared statistic = 19 (95% confidence interval: 0 to 92)
Mean difference in weight between groups (in kg)
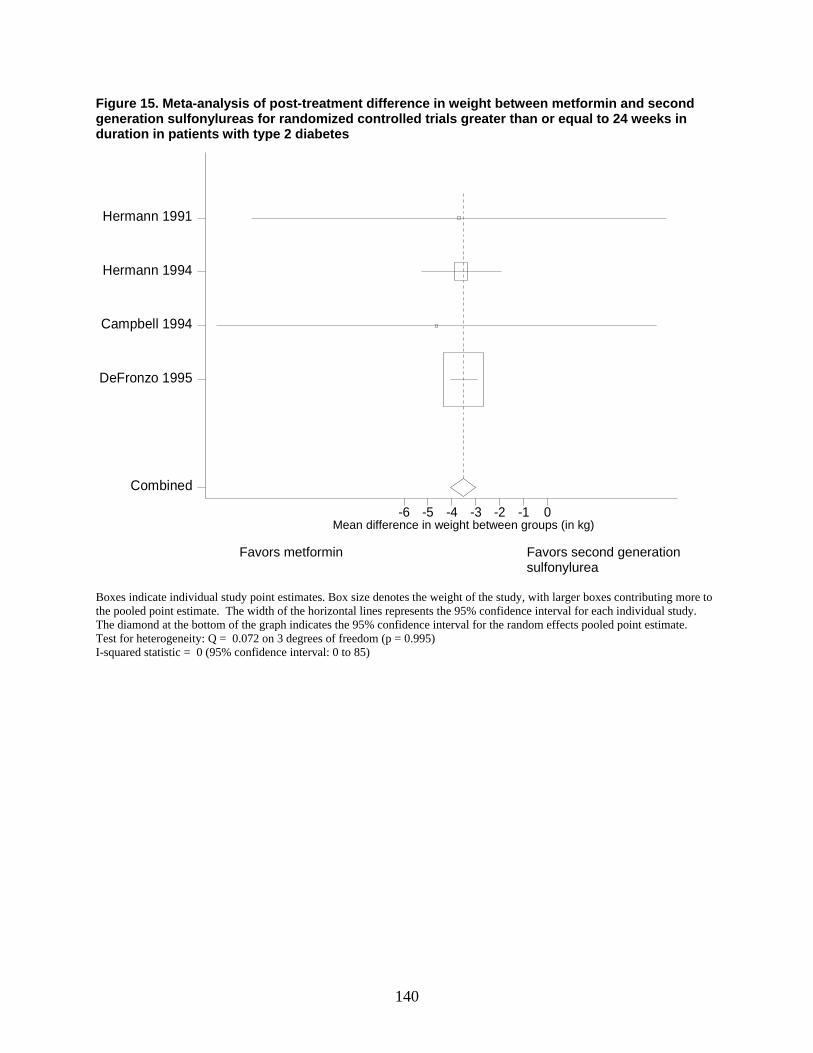
140
Figure 15. Meta-analysis of post-treatment difference in weight between metformin and second generation sulfonylureas for randomized controlled trials greater than or equal to 24 weeks in duration in patients with type 2 diabetes
mean diff in weight btn groups-6 -5 -4 -3 -2 -1 0
Combined
DeFronzo 1995
Campbell 1994
Hermann 1994
Hermann 1991
Favors metformin Favors second generation
sulfonylurea Boxes indicate individual study point estimates. Box size denotes the weight of the study, with larger boxes contributing more to the pooled point estimate. The width of the horizontal lines represents the 95% confidence interval for each individual study. The diamond at the bottom of the graph indicates the 95% confidence interval for the random effects pooled point estimate. Test for heterogeneity: Q = 0.072 on 3 degrees of freedom (p = 0.995) I-squared statistic = 0 (95% confidence interval: 0 to 85)
Mean difference in weight between groups (in kg)
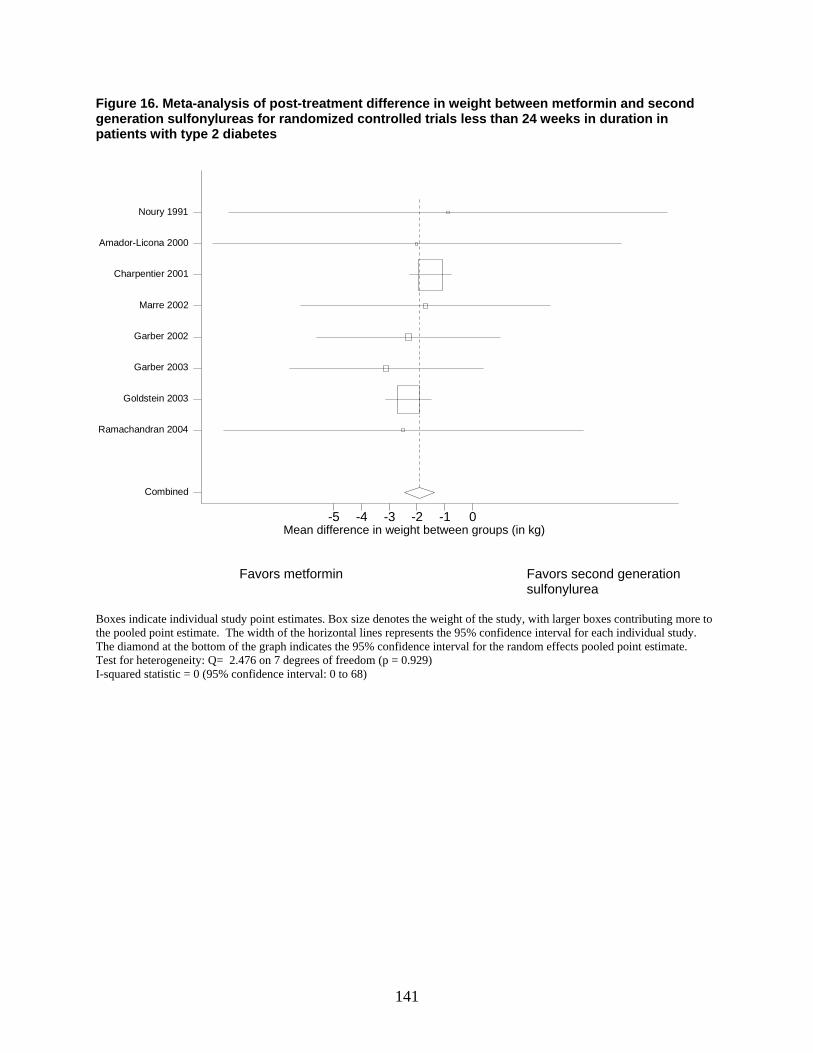
141
Figure 16. Meta-analysis of post-treatment difference in weight between metformin and second generation sulfonylureas for randomized controlled trials less than 24 weeks in duration in patients with type 2 diabetes
mean diff in weight btn groups-5 -4 -3 -2 -1 0
Combined
Ramachandran 2004
Goldstein 2003
Garber 2003
Garber 2002
Marre 2002
Charpentier 2001
Amador-Licona 2000
Noury 1991
Favors metformin Favors second generation sulfonylurea
Boxes indicate individual study point estimates. Box size denotes the weight of the study, with larger boxes contributing more to the pooled point estimate. The width of the horizontal lines represents the 95% confidence interval for each individual study. The diamond at the bottom of the graph indicates the 95% confidence interval for the random effects pooled point estimate. Test for heterogeneity: Q= 2.476 on 7 degrees of freedom (p = 0.929) I-squared statistic = 0 (95% confidence interval: 0 to 68)
Mean difference in weight between groups (in kg)
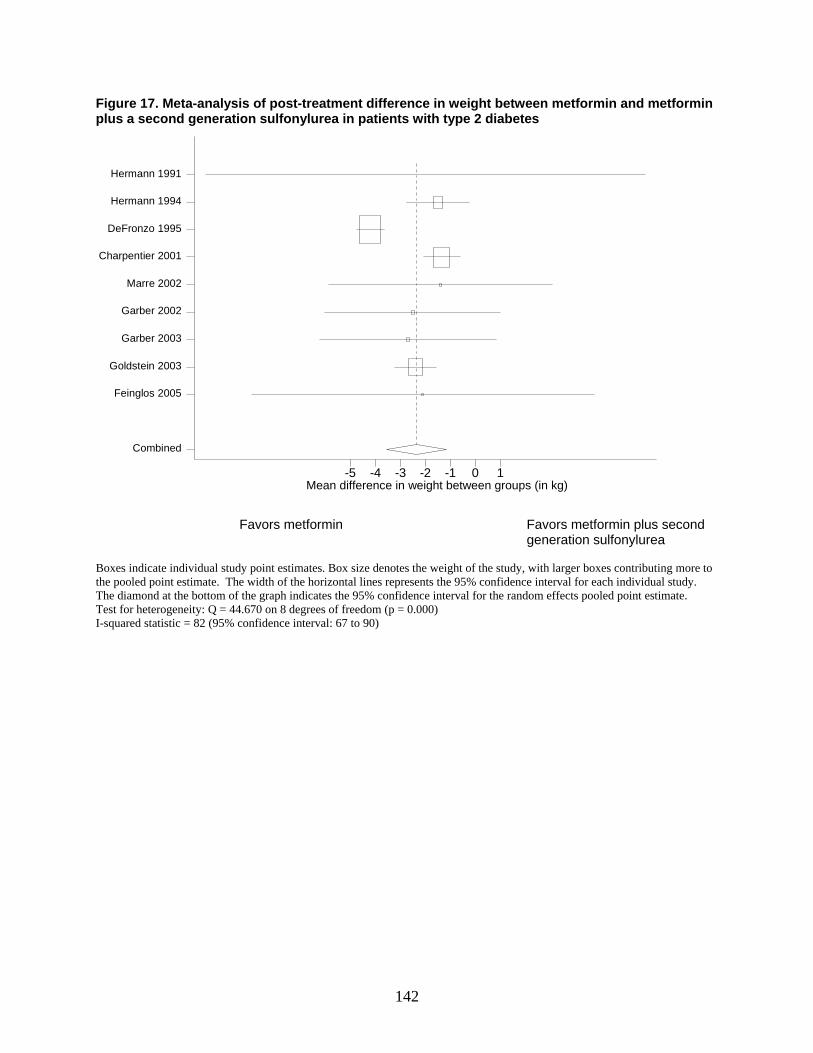
142
Figure 17. Meta-analysis of post-treatment difference in weight between metformin and metformin plus a second generation sulfonylurea in patients with type 2 diabetes
mean diff in weight btn groups-5 -4 -3 -2 -1 0 1
Combined
Feinglos 2005
Goldstein 2003
Garber 2003
Garber 2002
Marre 2002
Charpentier 2001
DeFronzo 1995
Hermann 1994
Hermann 1991
Favors metformin Favors metformin plus second
generation sulfonylurea Boxes indicate individual study point estimates. Box size denotes the weight of the study, with larger boxes contributing more to the pooled point estimate. The width of the horizontal lines represents the 95% confidence interval for each individual study. The diamond at the bottom of the graph indicates the 95% confidence interval for the random effects pooled point estimate. Test for heterogeneity: Q = 44.670 on 8 degrees of freedom (p = 0.000) I-squared statistic = 82 (95% confidence interval: 67 to 90)
Mean difference in weight between groups (in kg)
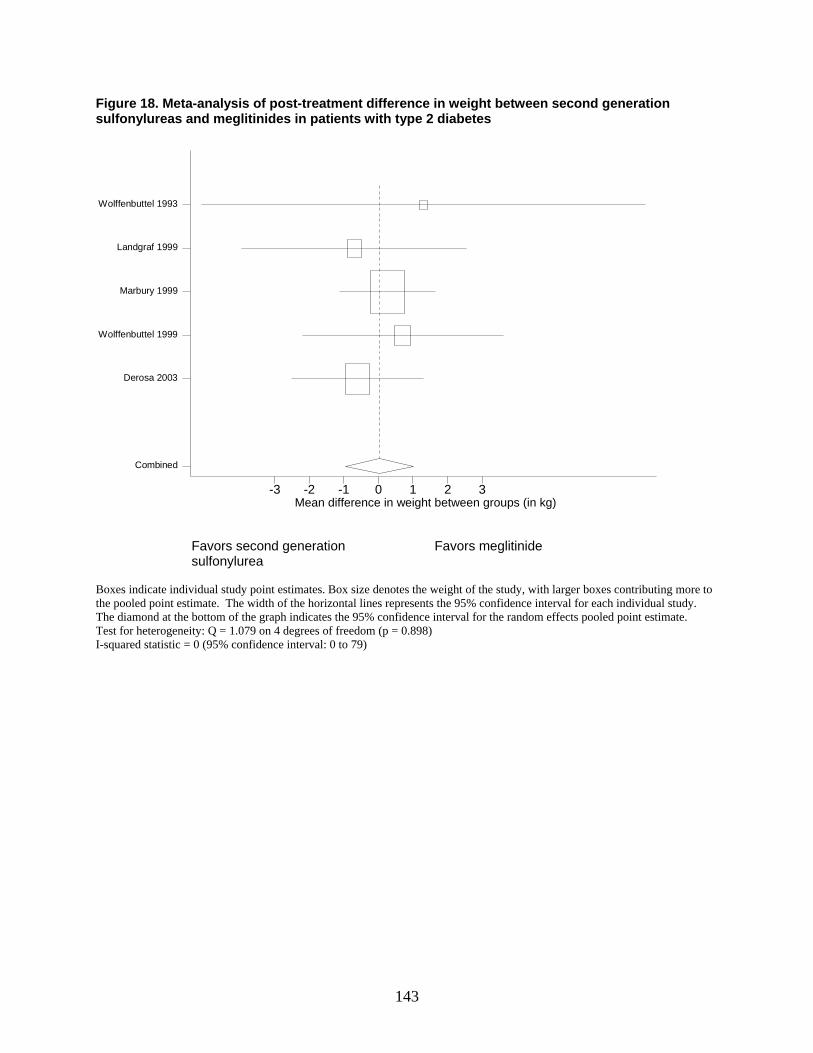
143
Figure 18. Meta-analysis of post-treatment difference in weight between second generation sulfonylureas and meglitinides in patients with type 2 diabetes
mean diff in weight btn groups-3 -2 -1 0 1 2 3
Combined
Derosa 2003
Wolffenbuttel 1999
Marbury 1999
Landgraf 1999
Wolffenbuttel 1993
Favors second generation Favors meglitinide sulfonylurea Boxes indicate individual study point estimates. Box size denotes the weight of the study, with larger boxes contributing more to the pooled point estimate. The width of the horizontal lines represents the 95% confidence interval for each individual study. The diamond at the bottom of the graph indicates the 95% confidence interval for the random effects pooled point estimate. Test for heterogeneity: Q = 1.079 on 4 degrees of freedom (p = 0.898) I-squared statistic = 0 (95% confidence interval: 0 to 79)
Mean difference in weight between groups (in kg)
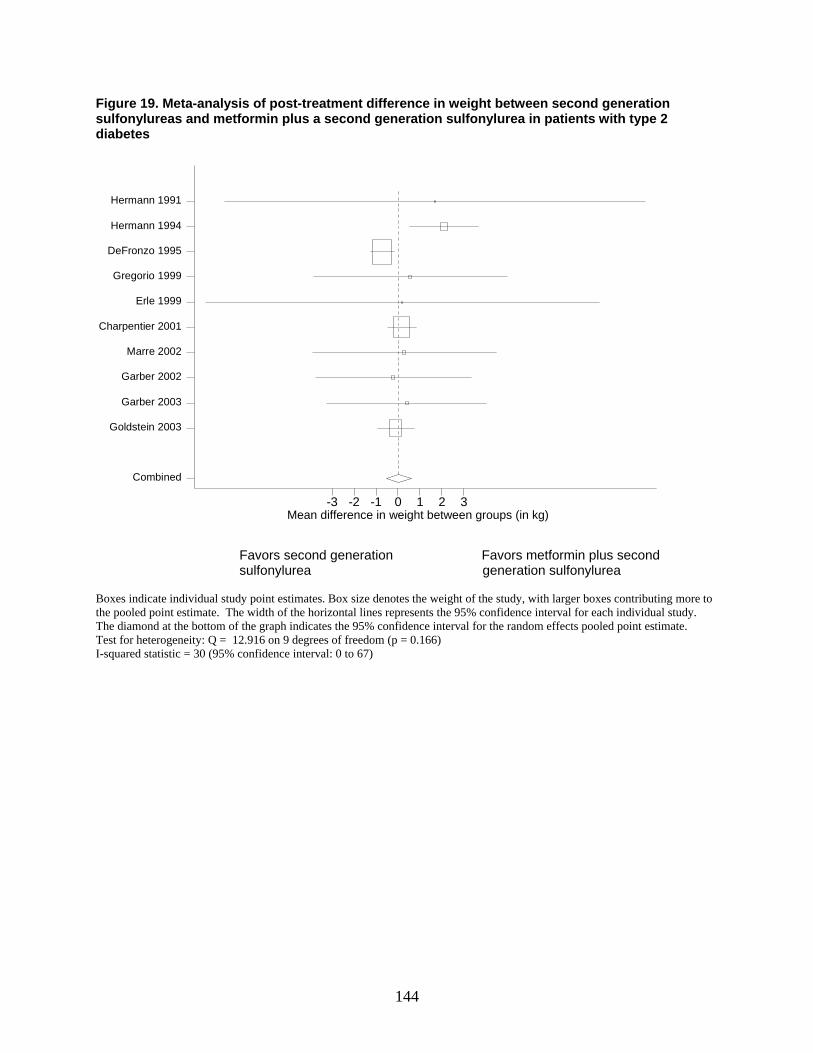
144
Figure 19. Meta-analysis of post-treatment difference in weight between second generation sulfonylureas and metformin plus a second generation sulfonylurea in patients with type 2 diabetes
mean diff in weight btn groups-3 -2 -1 0 1 2 3
Combined
Goldstein 2003
Garber 2003
Garber 2002
Marre 2002
Charpentier 2001
Erle 1999
Gregorio 1999
DeFronzo 1995
Hermann 1994
Hermann 1991
Favors second generation Favors metformin plus second sulfonylurea generation sulfonylurea
Boxes indicate individual study point estimates. Box size denotes the weight of the study, with larger boxes contributing more to the pooled point estimate. The width of the horizontal lines represents the 95% confidence interval for each individual study. The diamond at the bottom of the graph indicates the 95% confidence interval for the random effects pooled point estimate. Test for heterogeneity: Q = 12.916 on 9 degrees of freedom (p = 0.166) I-squared statistic = 30 (95% confidence interval: 0 to 67)
Mean difference in weight between groups (in kg)
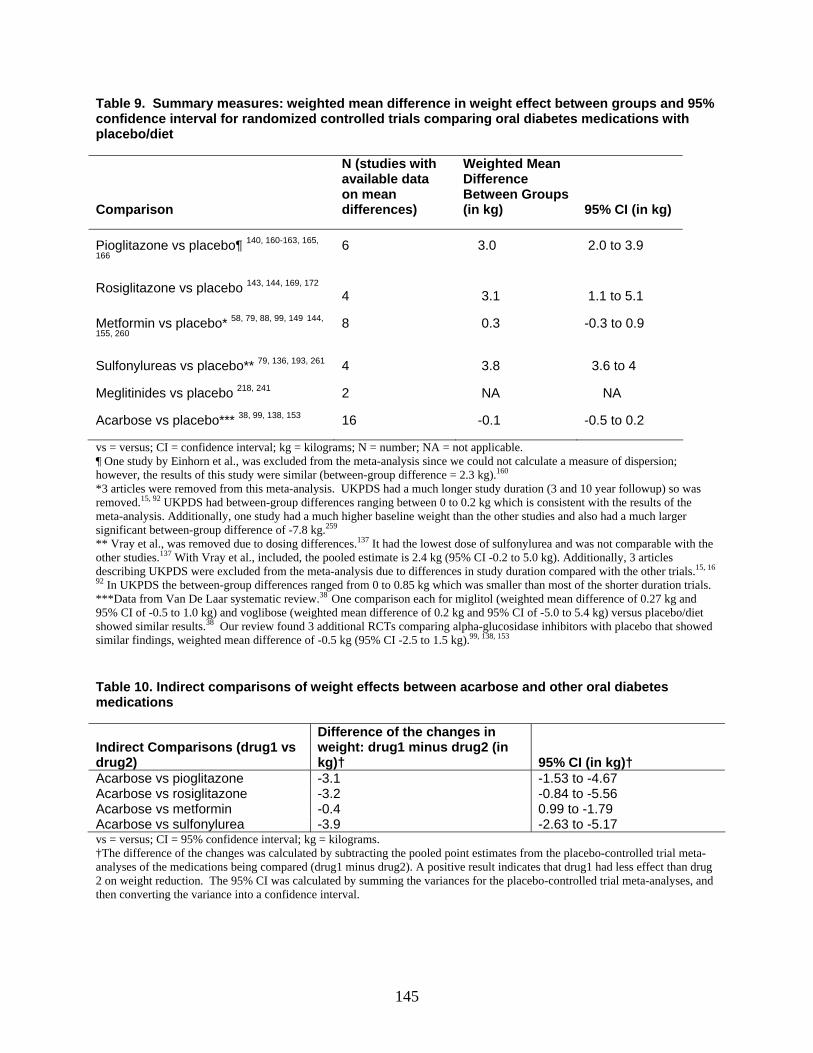
145
Table 9. Summary measures: weighted mean difference in weight effect between groups and 95% confidence interval for randomized controlled trials comparing oral diabetes medications with placebo/diet
Comparison
N (studies with available data on mean differences)
Weighted Mean Difference Between Groups (in kg) 95% CI (in kg)
Pioglitazone vs placebo¶ 140, 160-163, 165,
166 6 3.0 2.0 to 3.9
Rosiglitazone vs placebo 143, 144, 169, 172 4 3.1 1.1 to 5.1
Metformin vs placebo* 58, 79, 88, 99, 149 144,
155, 260 8 0.3 -0.3 to 0.9
Sulfonylureas vs placebo** 79, 136, 193, 261 4 3.8 3.6 to 4
Meglitinides vs placebo 218, 241 2 NA NA
Acarbose vs placebo*** 38, 99, 138, 153 16 -0.1 -0.5 to 0.2
vs = versus; CI = confidence interval; kg = kilograms; N = number; NA = not applicable. ¶ One study by Einhorn et al., was excluded from the meta-analysis since we could not calculate a measure of dispersion; however, the results of this study were similar (between-group difference = 2.3 kg).160 *3 articles were removed from this meta-analysis. UKPDS had a much longer study duration (3 and 10 year followup) so was removed.15, 92 UKPDS had between-group differences ranging between 0 to 0.2 kg which is consistent with the results of the meta-analysis. Additionally, one study had a much higher baseline weight than the other studies and also had a much larger significant between-group difference of -7.8 kg.259 ** Vray et al., was removed due to dosing differences.137 It had the lowest dose of sulfonylurea and was not comparable with the other studies.137 With Vray et al., included, the pooled estimate is 2.4 kg (95% CI -0.2 to 5.0 kg). Additionally, 3 articles describing UKPDS were excluded from the meta-analysis due to differences in study duration compared with the other trials.15, 16
92 In UKPDS the between-group differences ranged from 0 to 0.85 kg which was smaller than most of the shorter duration trials. ***Data from Van De Laar systematic review.38 One comparison each for miglitol (weighted mean difference of 0.27 kg and 95% CI of -0.5 to 1.0 kg) and voglibose (weighted mean difference of 0.2 kg and 95% CI of -5.0 to 5.4 kg) versus placebo/diet showed similar results.38 Our review found 3 additional RCTs comparing alpha-glucosidase inhibitors with placebo that showed similar findings, weighted mean difference of -0.5 kg (95% CI -2.5 to 1.5 kg).99, 138, 153 Table 10. Indirect comparisons of weight effects between acarbose and other oral diabetes medications
Indirect Comparisons (drug1 vs drug2)
Difference of the changes in weight: drug1 minus drug2 (in kg)† 95% CI (in kg)†
Acarbose vs pioglitazone -3.1 -1.53 to -4.67 Acarbose vs rosiglitazone -3.2 -0.84 to -5.56 Acarbose vs metformin -0.4 0.99 to -1.79 Acarbose vs sulfonylurea -3.9 -2.63 to -5.17 vs = versus; CI = 95% confidence interval; kg = kilograms. †The difference of the changes was calculated by subtracting the pooled point estimates from the placebo-controlled trial meta-analyses of the medications being compared (drug1 minus drug2). A positive result indicates that drug1 had less effect than drug 2 on weight reduction. The 95% CI was calculated by summing the variances for the placebo-controlled trial meta-analyses, and then converting the variance into a confidence interval.
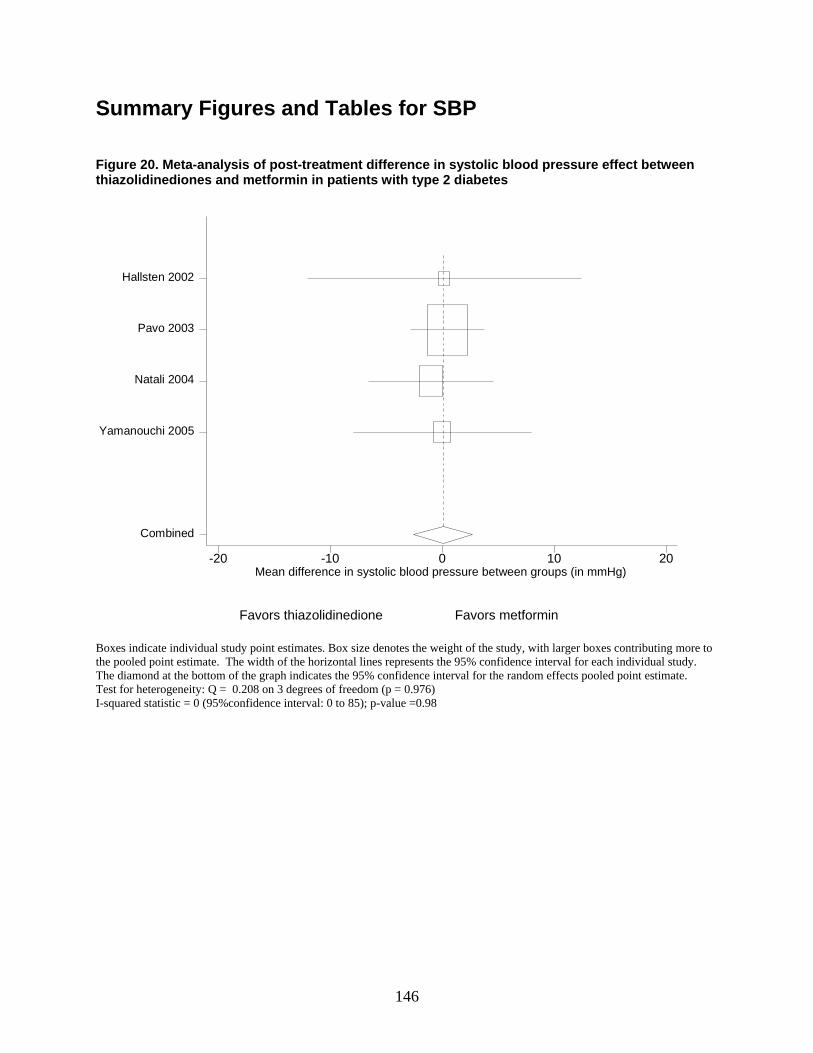
146
Summary Figures and Tables for SBP Figure 20. Meta-analysis of post-treatment difference in systolic blood pressure effect between thiazolidinediones and metformin in patients with type 2 diabetes
meandiff in SBP btn groups-20 -10 0 10 20
Combined
Yamanouchi 2005
Natali 2004
Pavo 2003
Hallsten 2002
Favors thiazolidinedione Favors metformin Boxes indicate individual study point estimates. Box size denotes the weight of the study, with larger boxes contributing more to the pooled point estimate. The width of the horizontal lines represents the 95% confidence interval for each individual study. The diamond at the bottom of the graph indicates the 95% confidence interval for the random effects pooled point estimate. Test for heterogeneity: Q = 0.208 on 3 degrees of freedom (p = 0.976) I-squared statistic = 0 (95%confidence interval: 0 to 85); p-value =0.98
Mean difference in systolic blood pressure between groups (in mmHg)
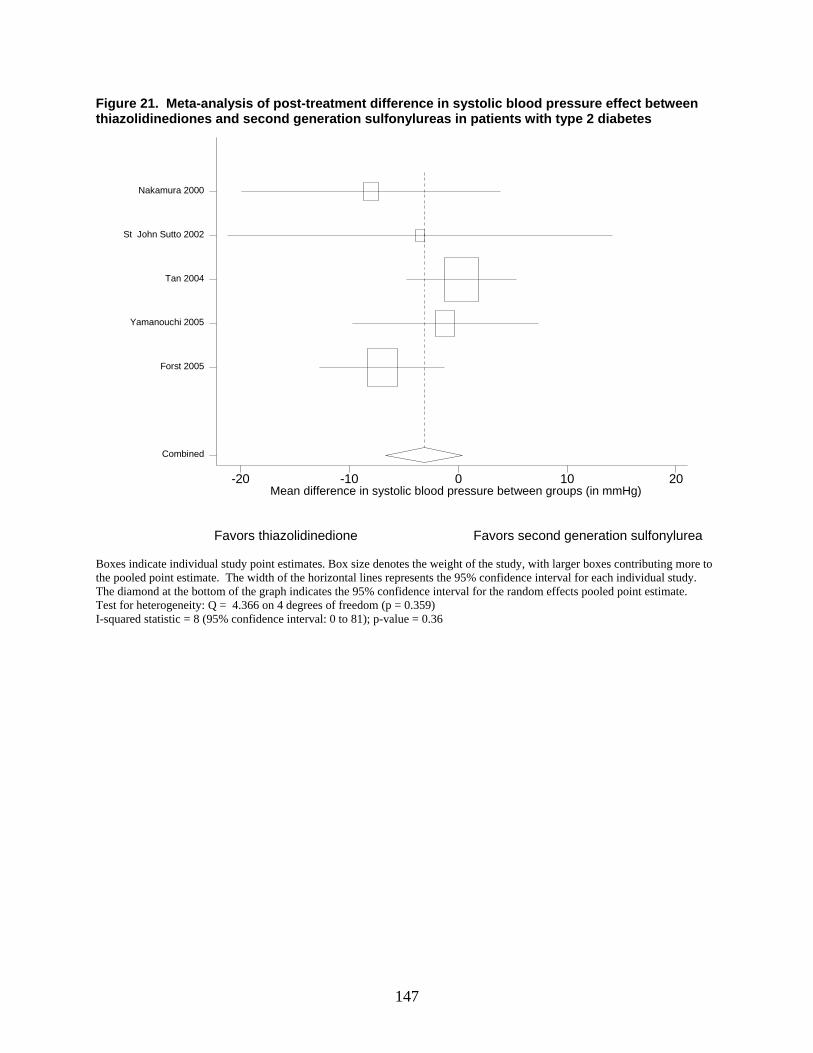
147
Figure 21. Meta-analysis of post-treatment difference in systolic blood pressure effect between thiazolidinediones and second generation sulfonylureas in patients with type 2 diabetes
mean diff in SBP btn groups-20 -10 0 10 20
Combined
Forst 2005
Yamanouchi 2005
Tan 2004
St John Sutto 2002
Nakamura 2000
Favors thiazolidinedione Favors second generation sulfonylurea Boxes indicate individual study point estimates. Box size denotes the weight of the study, with larger boxes contributing more to the pooled point estimate. The width of the horizontal lines represents the 95% confidence interval for each individual study. The diamond at the bottom of the graph indicates the 95% confidence interval for the random effects pooled point estimate. Test for heterogeneity: Q = 4.366 on 4 degrees of freedom (p = 0.359) I-squared statistic = 8 (95% confidence interval: 0 to 81); p-value = 0.36
Mean difference in systolic blood pressure between groups (in mmHg)
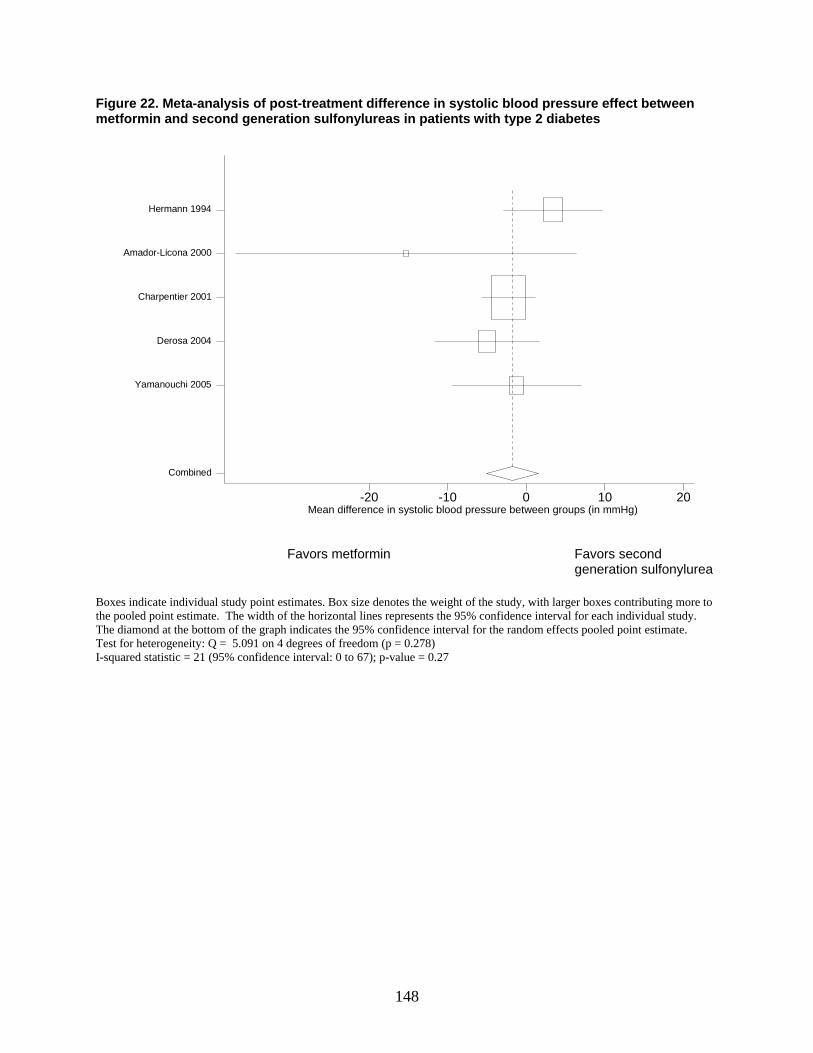
148
Figure 22. Meta-analysis of post-treatment difference in systolic blood pressure effect between metformin and second generation sulfonylureas in patients with type 2 diabetes
mean diff in SBP btn groups-20 -10 0 10 20
Combined
Yamanouchi 2005
Derosa 2004
Charpentier 2001
Amador-Licona 2000
Hermann 1994
Favors metformin Favors second generation sulfonylurea
Boxes indicate individual study point estimates. Box size denotes the weight of the study, with larger boxes contributing more to the pooled point estimate. The width of the horizontal lines represents the 95% confidence interval for each individual study. The diamond at the bottom of the graph indicates the 95% confidence interval for the random effects pooled point estimate. Test for heterogeneity: Q = 5.091 on 4 degrees of freedom (p = 0.278) I-squared statistic = 21 (95% confidence interval: 0 to 67); p-value = 0.27
Mean difference in systolic blood pressure between groups (in mmHg)
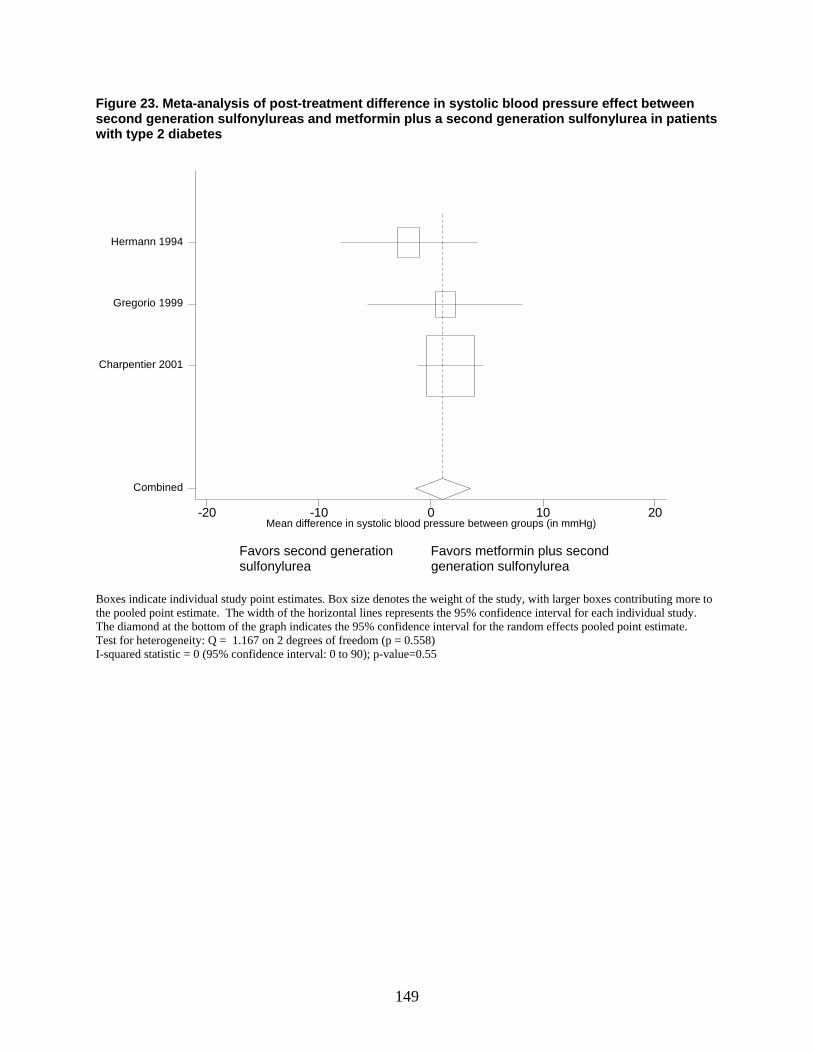
149
Figure 23. Meta-analysis of post-treatment difference in systolic blood pressure effect between second generation sulfonylureas and metformin plus a second generation sulfonylurea in patients with type 2 diabetes
mean diff in SBP btn groups-20 -10 0 10 20
Combined
Charpentier 2001
Gregorio 1999
Hermann 1994
Favors second generation Favors metformin plus second sulfonylurea generation sulfonylurea
Boxes indicate individual study point estimates. Box size denotes the weight of the study, with larger boxes contributing more to the pooled point estimate. The width of the horizontal lines represents the 95% confidence interval for each individual study. The diamond at the bottom of the graph indicates the 95% confidence interval for the random effects pooled point estimate. Test for heterogeneity: Q = 1.167 on 2 degrees of freedom (p = 0.558) I-squared statistic = 0 (95% confidence interval: 0 to 90); p-value=0.55
Mean difference in systolic blood pressure between groups (in mmHg)
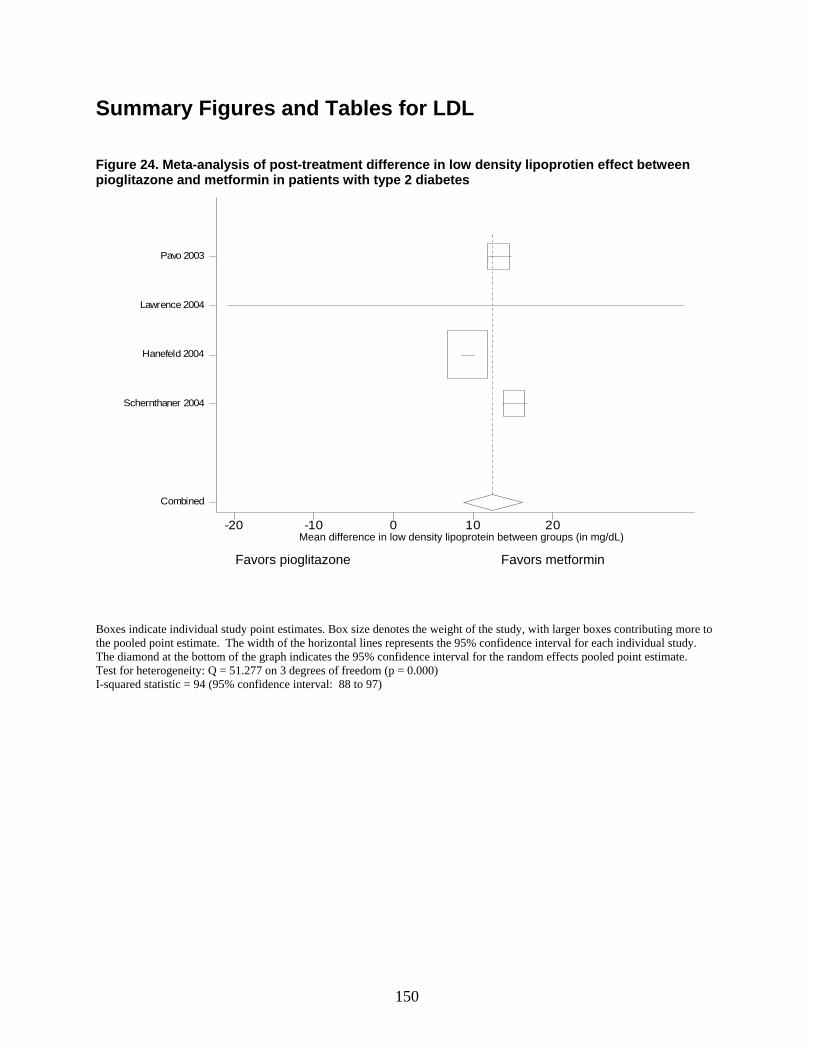
150
Summary Figures and Tables for LDL Figure 24. Meta-analysis of post-treatment difference in low density lipoprotien effect between pioglitazone and metformin in patients with type 2 diabetes
mean diff in LDL btn groups-20 -10 0 10 20
Combined
Schernthaner 2004
Hanefeld 2004
Lawrence 2004
Pavo 2003
Favors pioglitazone Favors metformin
Boxes indicate individual study point estimates. Box size denotes the weight of the study, with larger boxes contributing more to the pooled point estimate. The width of the horizontal lines represents the 95% confidence interval for each individual study. The diamond at the bottom of the graph indicates the 95% confidence interval for the random effects pooled point estimate. Test for heterogeneity: Q = 51.277 on 3 degrees of freedom (p = 0.000) I-squared statistic = 94 (95% confidence interval: 88 to 97)
Mean difference in low density lipoprotein between groups (in mg/dL)
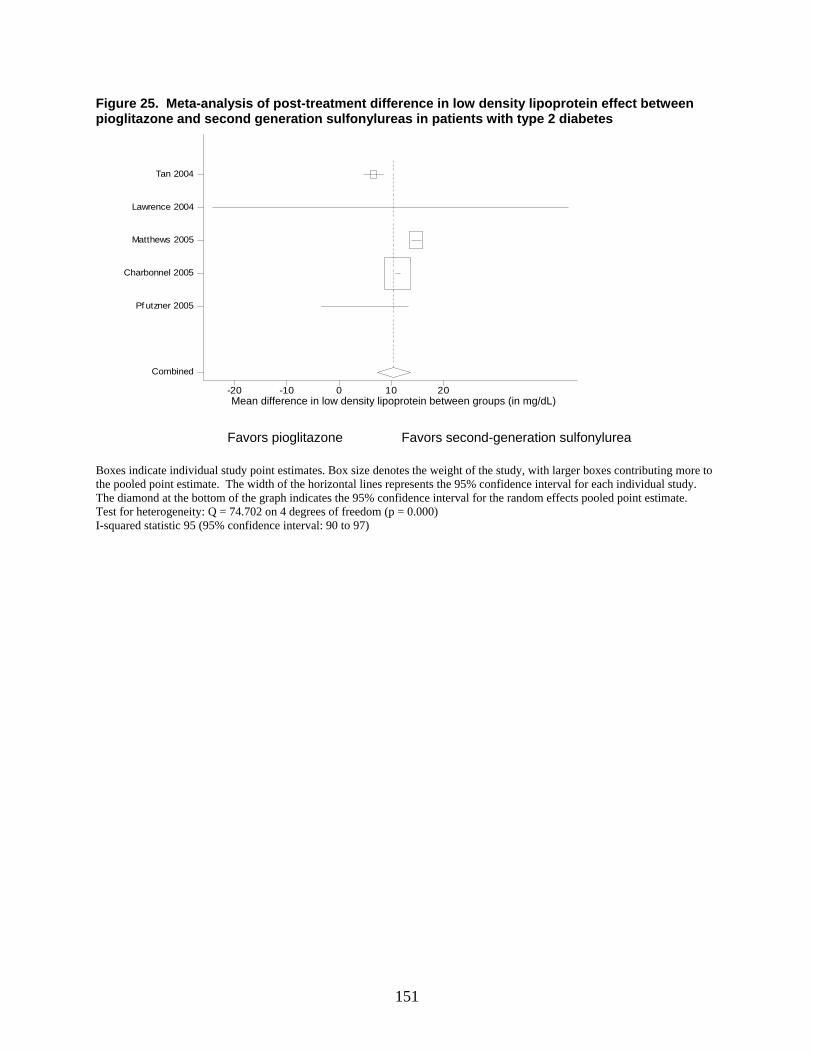
151
Figure 25. Meta-analysis of post-treatment difference in low density lipoprotein effect between pioglitazone and second generation sulfonylureas in patients with type 2 diabetes
mean diff in LDL btn groups-20 -10 0 10 20
Combined
Pf utzner 2005
Charbonnel 2005
Matthews 2005
Lawrence 2004
Tan 2004
Favors pioglitazone Favors second-generation sulfonylurea
Boxes indicate individual study point estimates. Box size denotes the weight of the study, with larger boxes contributing more to the pooled point estimate. The width of the horizontal lines represents the 95% confidence interval for each individual study. The diamond at the bottom of the graph indicates the 95% confidence interval for the random effects pooled point estimate. Test for heterogeneity: Q = 74.702 on 4 degrees of freedom (p = 0.000) I-squared statistic 95 (95% confidence interval: 90 to 97)
Mean difference in low density lipoprotein between groups (in mg/dL)

152
Figure 26. Meta-analysis of post-treatment difference in low density lipoprotein effect between metformin and second generation sulfonylureas in patients with type 2 diabetes
mean diff in ldl btn groups-20 -10 0 10 20
Combined
Lawrence 2004
Derosa 2004
Goldstein 2003
Garber 2003
Marre 2002
DeFronzo 1995
Hermann 1994
Campbell 1994
Hermann 1991
Favors metformin Favors second-generation sulfonylurea Boxes indicate individual study point estimates. Box size denotes the weight of the study, with larger boxes contributing more to the pooled point estimate. The width of the horizontal lines represents the 95% confidence interval for each individual study. The diamond at the bottom of the graph indicates the 95% confidence interval for the random effects pooled point estimate. Test for heterogeneity: Q = 46.849 on 8 degrees of freedom (p = 0.000) I-squared statistic = 83 (95% confidence interval: 69 to 81)
Mean difference in low density lipoprotein between groups (in mg/dL)
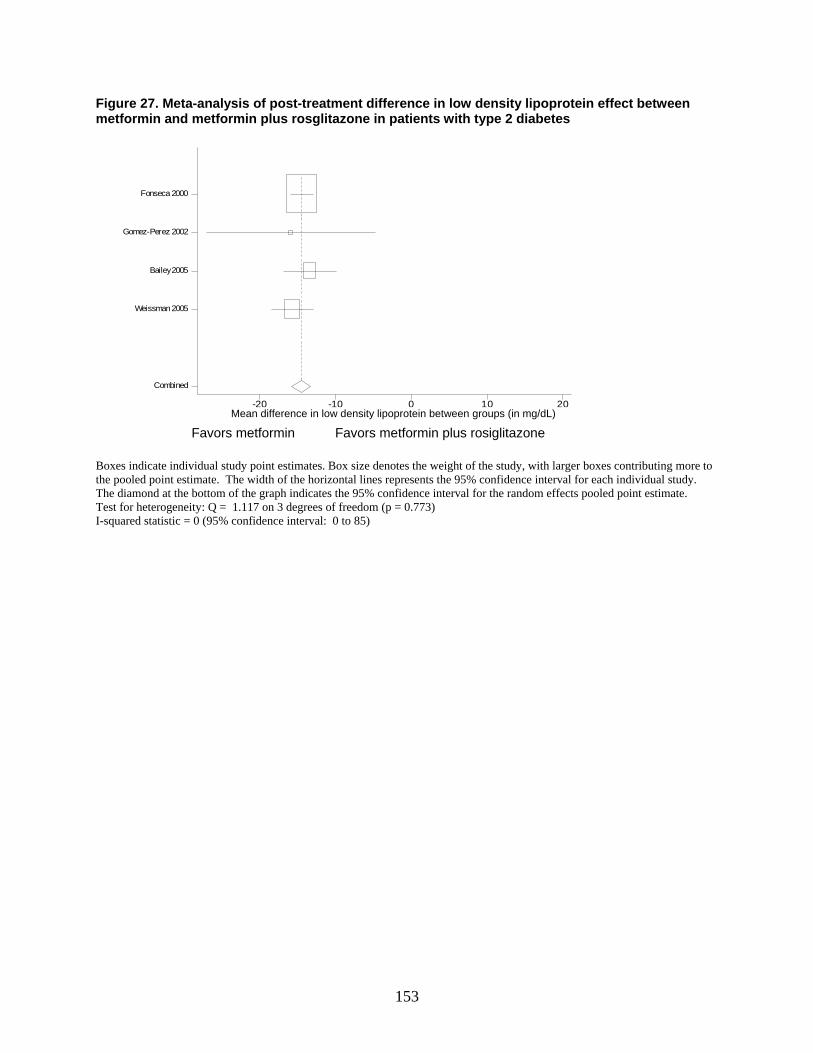
153
Figure 27. Meta-analysis of post-treatment difference in low density lipoprotein effect between metformin and metformin plus rosglitazone in patients with type 2 diabetes
mean diff in LDL btn groups (mg/-20 -10 0 10 20
Combined
Weissman 2005
Bailey 2005
Gomez-Perez 2002
Fonseca 2000
Favors metformin Favors metformin plus rosiglitazone
Boxes indicate individual study point estimates. Box size denotes the weight of the study, with larger boxes contributing more to the pooled point estimate. The width of the horizontal lines represents the 95% confidence interval for each individual study. The diamond at the bottom of the graph indicates the 95% confidence interval for the random effects pooled point estimate. Test for heterogeneity: Q = 1.117 on 3 degrees of freedom (p = 0.773) I-squared statistic = 0 (95% confidence interval: 0 to 85)
Mean difference in low density lipoprotein between groups (in mg/dL)
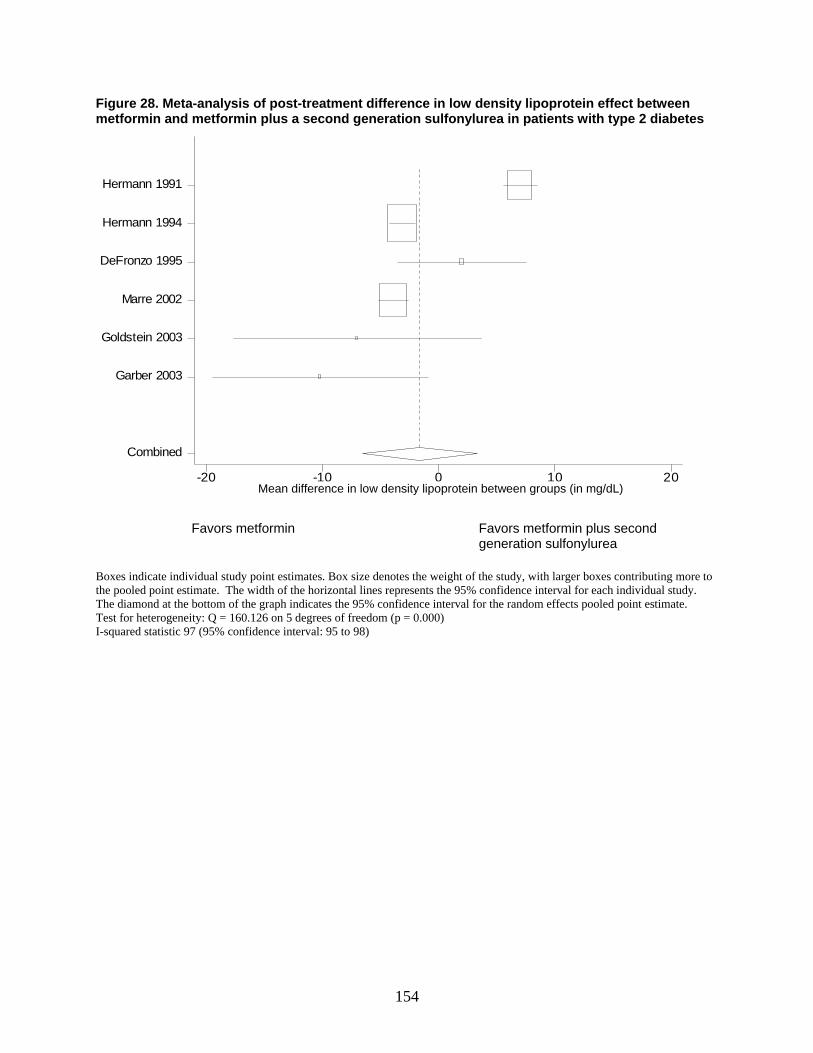
154
Figure 28. Meta-analysis of post-treatment difference in low density lipoprotein effect between metformin and metformin plus a second generation sulfonylurea in patients with type 2 diabetes
mean diff in ldl btn groups-20 -10 0 10 20
Combined
Garber 2003
Goldstein 2003
Marre 2002
DeFronzo 1995
Hermann 1994
Hermann 1991
Favors metformin Favors metformin plus second
generation sulfonylurea Boxes indicate individual study point estimates. Box size denotes the weight of the study, with larger boxes contributing more to the pooled point estimate. The width of the horizontal lines represents the 95% confidence interval for each individual study. The diamond at the bottom of the graph indicates the 95% confidence interval for the random effects pooled point estimate. Test for heterogeneity: Q = 160.126 on 5 degrees of freedom (p = 0.000) I-squared statistic 97 (95% confidence interval: 95 to 98)
Mean difference in low density lipoprotein between groups (in mg/dL)
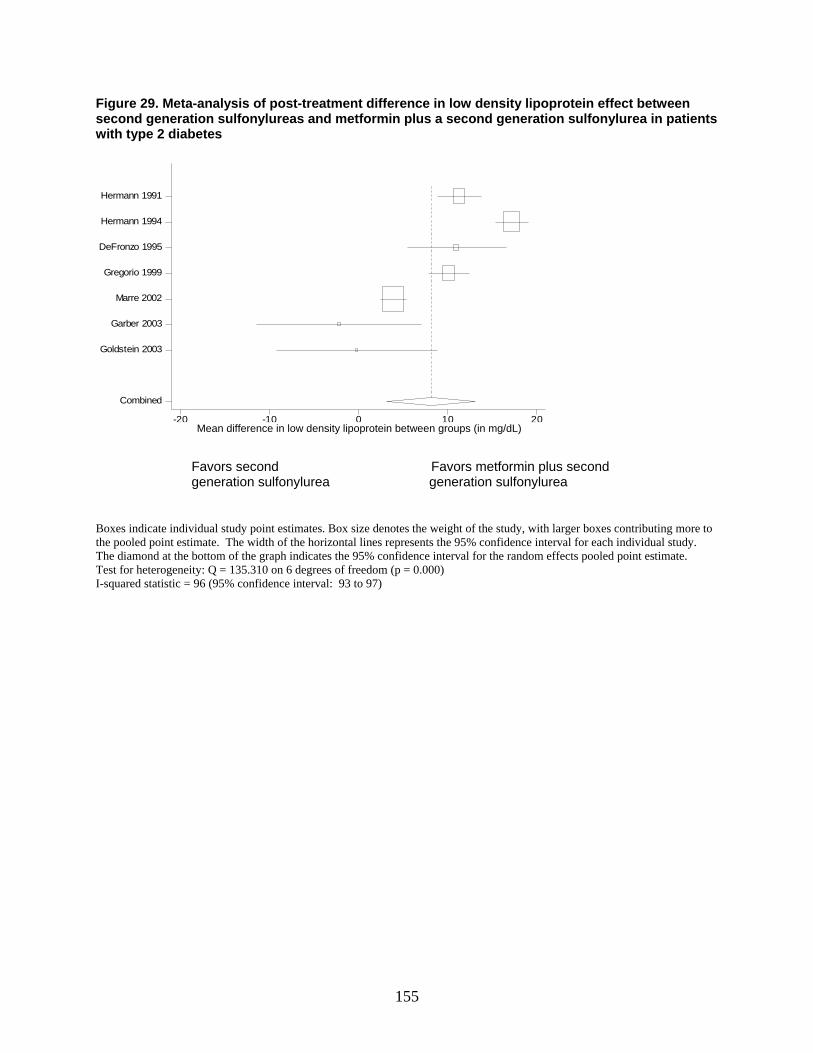
155
Figure 29. Meta-analysis of post-treatment difference in low density lipoprotein effect between second generation sulfonylureas and metformin plus a second generation sulfonylurea in patients with type 2 diabetes
mean diff in LDL btn groups-20 -10 0 10 20
Combined
Goldstein 2003
Garber 2003
Marre 2002
Gregorio 1999
DeFronzo 1995
Hermann 1994
Hermann 1991
Favors second Favors metformin plus second generation sulfonylurea generation sulfonylurea
Boxes indicate individual study point estimates. Box size denotes the weight of the study, with larger boxes contributing more to the pooled point estimate. The width of the horizontal lines represents the 95% confidence interval for each individual study. The diamond at the bottom of the graph indicates the 95% confidence interval for the random effects pooled point estimate. Test for heterogeneity: Q = 135.310 on 6 degrees of freedom (p = 0.000) I-squared statistic = 96 (95% confidence interval: 93 to 97)
Mean difference in low density lipoprotein between groups (in mg/dL)
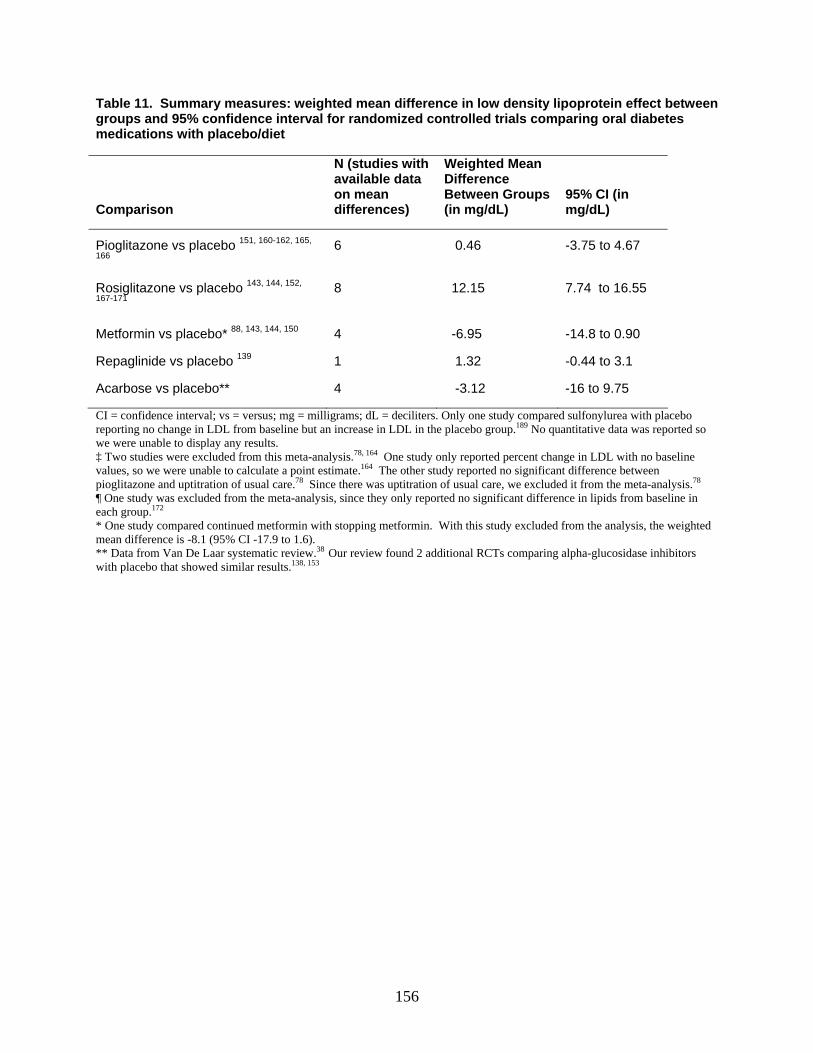
156
Table 11. Summary measures: weighted mean difference in low density lipoprotein effect between groups and 95% confidence interval for randomized controlled trials comparing oral diabetes medications with placebo/diet
Comparison
N (studies with available data on mean differences)
Weighted Mean Difference Between Groups (in mg/dL)
95% CI (in mg/dL)
Pioglitazone vs placebo 151, 160-162, 165,
166 6 0.46 -3.75 to 4.67
Rosiglitazone vs placebo 143, 144, 152,
167-171
8 12.15 7.74 to 16.55
Metformin vs placebo* 88, 143, 144, 150 4 -6.95 -14.8 to 0.90
Repaglinide vs placebo 139 1 1.32 -0.44 to 3.1
Acarbose vs placebo** 4 -3.12 -16 to 9.75
CI = confidence interval; vs = versus; mg = milligrams; dL = deciliters. Only one study compared sulfonylurea with placebo reporting no change in LDL from baseline but an increase in LDL in the placebo group.189 No quantitative data was reported so we were unable to display any results. ‡ Two studies were excluded from this meta-analysis.78, 164 One study only reported percent change in LDL with no baseline values, so we were unable to calculate a point estimate.164 The other study reported no significant difference between pioglitazone and uptitration of usual care.78 Since there was uptitration of usual care, we excluded it from the meta-analysis.78 ¶ One study was excluded from the meta-analysis, since they only reported no significant difference in lipids from baseline in each group.172 * One study compared continued metformin with stopping metformin. With this study excluded from the analysis, the weighted mean difference is -8.1 (95% CI -17.9 to 1.6). ** Data from Van De Laar systematic review.38 Our review found 2 additional RCTs comparing alpha-glucosidase inhibitors with placebo that showed similar results.138, 153

157
Table 12. Indirect comparisons of low density lipoproteins effect between acarbose and other oral diabetes medications Indirect Comparisons (drug1 vs drug2)
Difference of the changes in LDL: drug1 minus drug2 (in mg/dL)† 95% CI (in mg/dL)†
Acarbose vs pioglitazone -3.58 9.97 to -17.13 Acarbose vs rosiglitazone -15.27 -1.67 to -28.9 Acarbose vs metformin 3.83 18.9 to -11.2 vs = versus; % = percent; CI = 95% confidence interval; mg = milligrams; dL = deciliter; LDL = low density lipoprotein cholesterol. †The difference of the changes was calculated by subtracting the pooled point estimates from the placebo-controlled trial meta-analyses of the medications being compared (drug1 minus drug2). A positive result indicates that drug1 had less effect than drug 2 on LDL. The 95% CI was calculated by summing the variances for the placebo-controlled trial meta-analyses, and then converting the variance into a confidence interval. Table 13. Indirect comparisons of low density lipoprotein effect between rosiglitazone and other oral diabetes medications
Indirect Comparisons (drug1 vs drug2)
Difference of the changes in LDL: drug1 minus drug2 (in mg/dL)† 95% CI (in mg/dL)†
Rosiglitazone vs pioglitazone 11.69 17.79 to 5.60 Rosiglitazone vs metformin 19.1 28.10 to 10.10 vs = versus; % = percent; CI = 95% confidence interval; mg = milligrams; dL = deciliter; LDL = low density lipoprotein cholesterol. †The difference of the changes was calculated by subtracting the pooled point estimates from the placebo-controlled trial meta-analyses of the medications being compared (drug1 minus drug2). A positive result indicates that drug1 had less effect than drug 2 on LDL. The 95% CI was calculated by summing the variances for the placebo-controlled trial meta-analyses, and then converting the variance into a confidence interval.
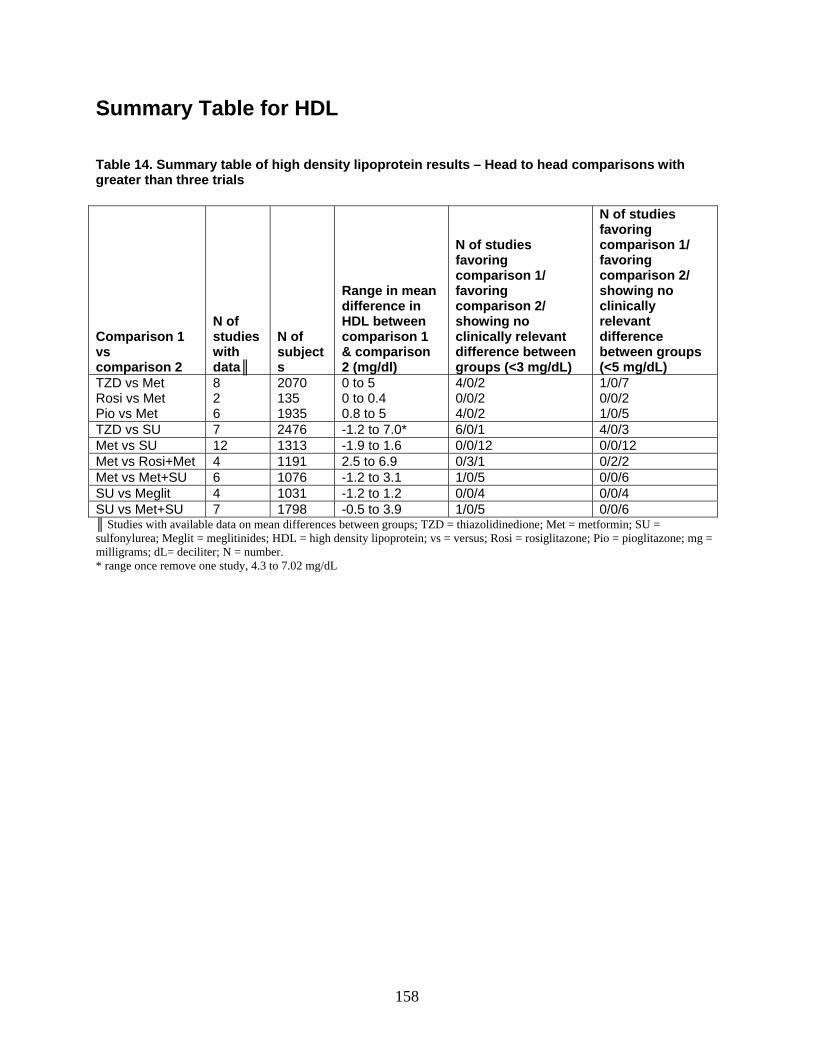
158
Summary Table for HDL Table 14. Summary table of high density lipoprotein results – Head to head comparisons with greater than three trials
Comparison 1 vs comparison 2
N of studies with data║
N of subjects
Range in mean difference in HDL between comparison 1 & comparison 2 (mg/dl)
N of studies favoring comparison 1/ favoring comparison 2/ showing no clinically relevant difference between groups (<3 mg/dL)
N of studies favoring comparison 1/ favoring comparison 2/ showing no clinically relevant difference between groups (<5 mg/dL)
TZD vs Met Rosi vs Met Pio vs Met
8 2 6
2070 135 1935
0 to 5 0 to 0.4 0.8 to 5
4/0/2 0/0/2 4/0/2
1/0/7 0/0/2 1/0/5
TZD vs SU 7 2476 -1.2 to 7.0* 6/0/1 4/0/3 Met vs SU 12 1313 -1.9 to 1.6 0/0/12 0/0/12 Met vs Rosi+Met 4 1191 2.5 to 6.9 0/3/1 0/2/2 Met vs Met+SU 6 1076 -1.2 to 3.1 1/0/5 0/0/6 SU vs Meglit 4 1031 -1.2 to 1.2 0/0/4 0/0/4 SU vs Met+SU 7 1798 -0.5 to 3.9 1/0/5 0/0/6 ║ Studies with available data on mean differences between groups; TZD = thiazolidinedione; Met = metformin; SU = sulfonylurea; Meglit = meglitinides; HDL = high density lipoprotein; vs = versus; Rosi = rosiglitazone; Pio = pioglitazone; mg = milligrams; dL= deciliter; N = number. * range once remove one study, 4.3 to 7.02 mg/dL
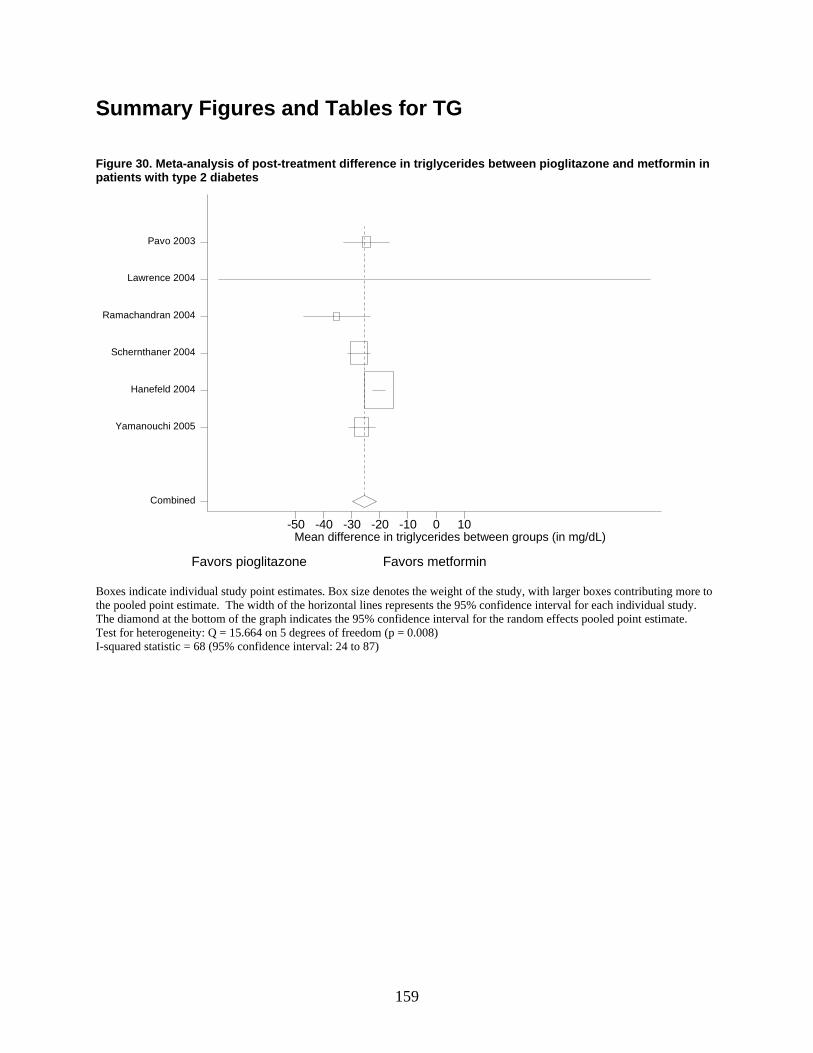
159
Summary Figures and Tables for TG Figure 30. Meta-analysis of post-treatment difference in triglycerides between pioglitazone and metformin in patients with type 2 diabetes
mean diff in TG btn groups
-50 -40 -30 -20 -10 0 10
Combined
Yamanouchi 2005
Hanefeld 2004
Schernthaner 2004
Ramachandran 2004
Lawrence 2004
Pavo 2003
Favors pioglitazone Favors metformin
Boxes indicate individual study point estimates. Box size denotes the weight of the study, with larger boxes contributing more to the pooled point estimate. The width of the horizontal lines represents the 95% confidence interval for each individual study. The diamond at the bottom of the graph indicates the 95% confidence interval for the random effects pooled point estimate. Test for heterogeneity: Q = 15.664 on 5 degrees of freedom (p = 0.008) I-squared statistic = 68 (95% confidence interval: 24 to 87)
Mean difference in triglycerides between groups (in mg/dL)
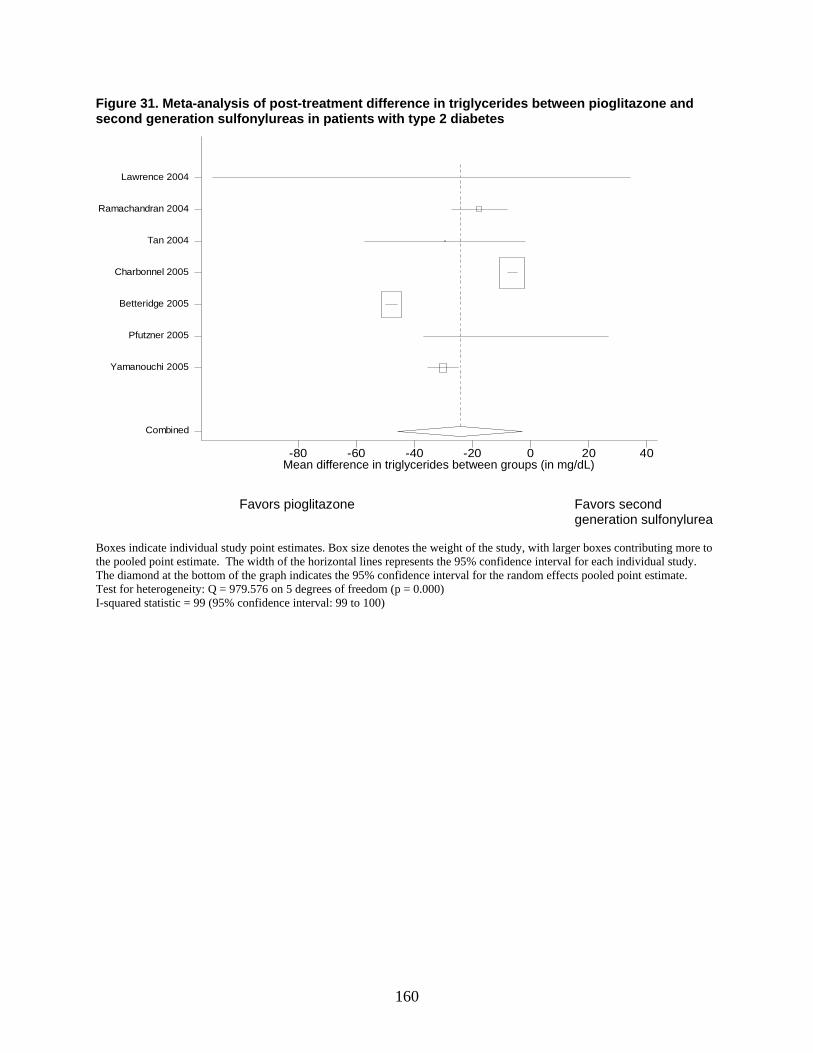
160
Figure 31. Meta-analysis of post-treatment difference in triglycerides between pioglitazone and second generation sulfonylureas in patients with type 2 diabetes
mean diff in TG btn groups-80 -60 -40 -20 0 20 40
Combined
Yamanouchi 2005
Pfutzner 2005
Betteridge 2005
Charbonnel 2005
Tan 2004
Ramachandran 2004
Lawrence 2004
Favors pioglitazone Favors second
generation sulfonylurea Boxes indicate individual study point estimates. Box size denotes the weight of the study, with larger boxes contributing more to the pooled point estimate. The width of the horizontal lines represents the 95% confidence interval for each individual study. The diamond at the bottom of the graph indicates the 95% confidence interval for the random effects pooled point estimate. Test for heterogeneity: Q = 979.576 on 5 degrees of freedom (p = 0.000) I-squared statistic = 99 (95% confidence interval: 99 to 100)
Mean difference in triglycerides between groups (in mg/dL)
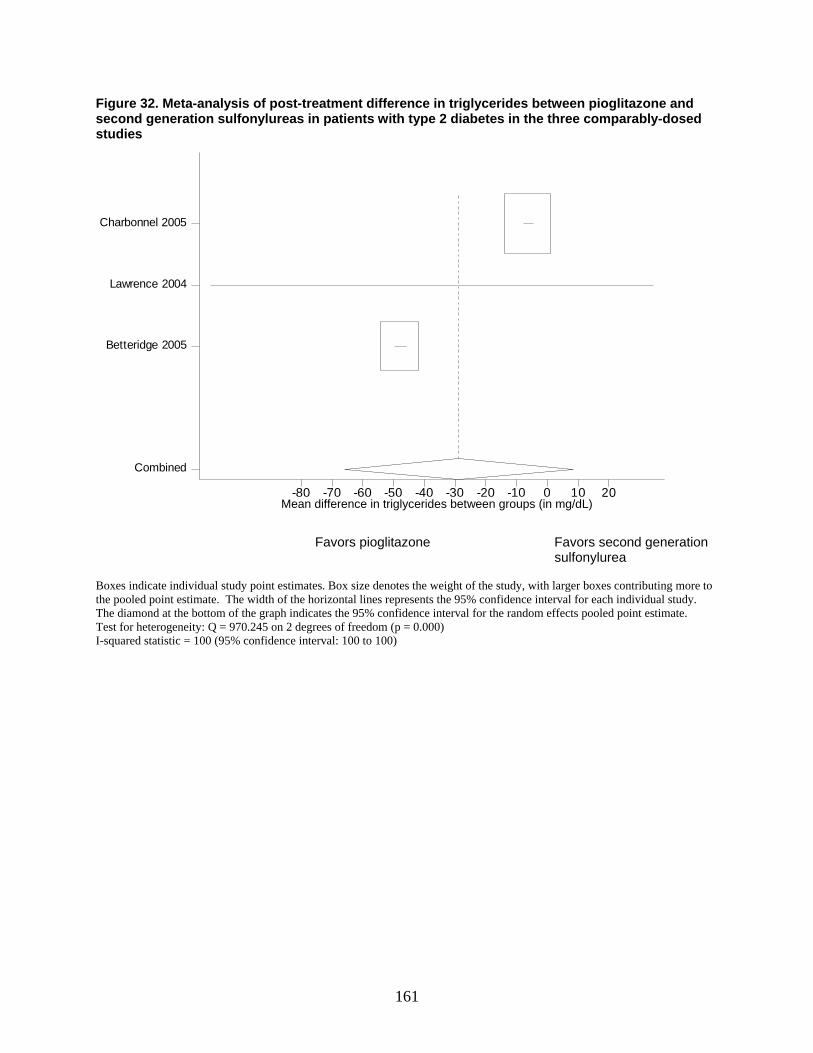
161
Figure 32. Meta-analysis of post-treatment difference in triglycerides between pioglitazone and second generation sulfonylureas in patients with type 2 diabetes in the three comparably-dosed studies
meandiff-80 -70 -60 -50 -40 -30 -20 -10 0 10 20
Combined
Betteridge 2005
Lawrence 2004
Charbonnel 2005
Favors pioglitazone Favors second generation sulfonylurea
Boxes indicate individual study point estimates. Box size denotes the weight of the study, with larger boxes contributing more to the pooled point estimate. The width of the horizontal lines represents the 95% confidence interval for each individual study. The diamond at the bottom of the graph indicates the 95% confidence interval for the random effects pooled point estimate. Test for heterogeneity: Q = 970.245 on 2 degrees of freedom (p = 0.000) I-squared statistic = 100 (95% confidence interval: 100 to 100)
Mean difference in triglycerides between groups (in mg/dL)
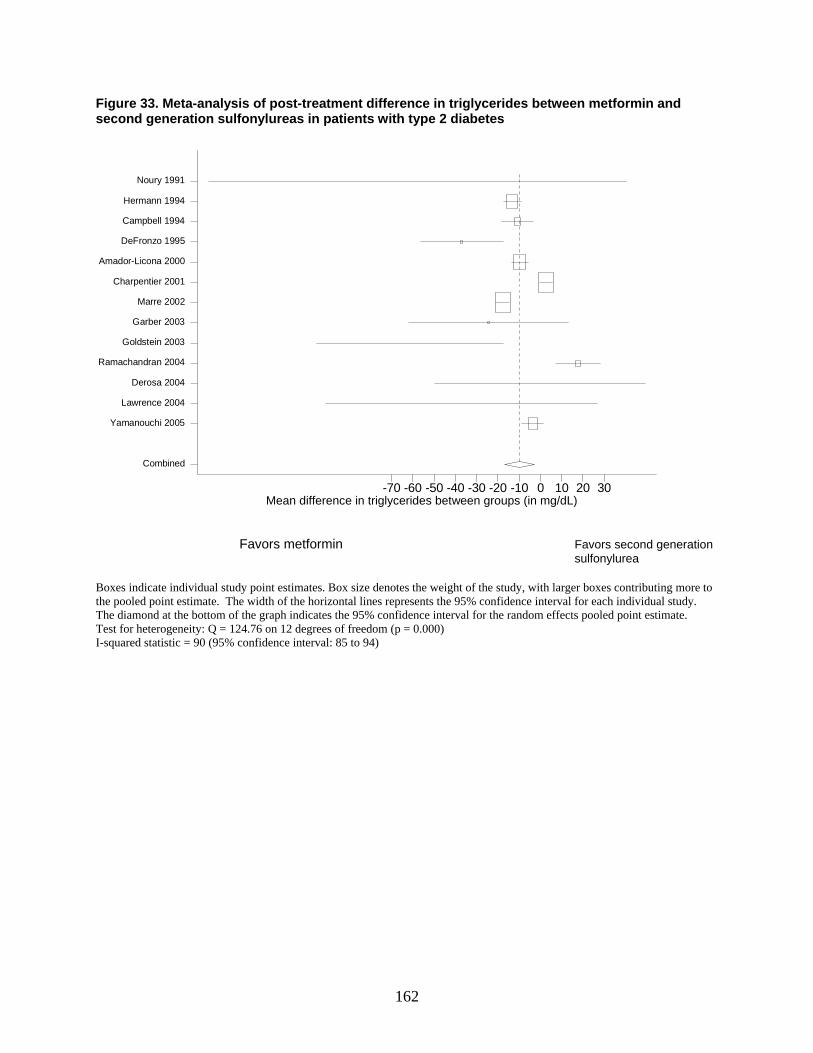
162
Figure 33. Meta-analysis of post-treatment difference in triglycerides between metformin and second generation sulfonylureas in patients with type 2 diabetes
mean diff in TG btn groups-70 -60 -50 -40 -30 -20 -10 0 10 20 30
Combined
Yamanouchi 2005
Lawrence 2004
Derosa 2004
Ramachandran 2004
Goldstein 2003
Garber 2003
Marre 2002
Charpentier 2001
Amador-Licona 2000
DeFronzo 1995
Campbell 1994
Hermann 1994
Noury 1991
Favors metformin Favors second generation sulfonylurea
Boxes indicate individual study point estimates. Box size denotes the weight of the study, with larger boxes contributing more to the pooled point estimate. The width of the horizontal lines represents the 95% confidence interval for each individual study. The diamond at the bottom of the graph indicates the 95% confidence interval for the random effects pooled point estimate. Test for heterogeneity: Q = 124.76 on 12 degrees of freedom (p = 0.000) I-squared statistic = 90 (95% confidence interval: 85 to 94)
Mean difference in triglycerides between groups (in mg/dL)
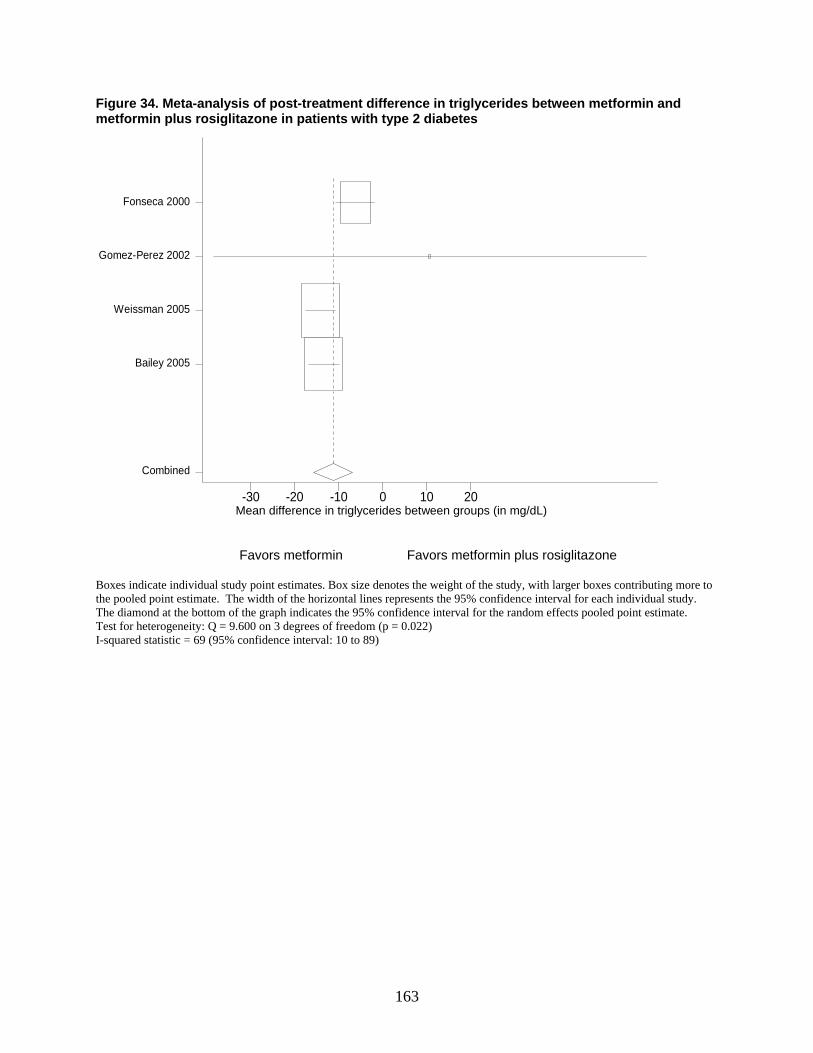
163
Figure 34. Meta-analysis of post-treatment difference in triglycerides between metformin and metformin plus rosiglitazone in patients with type 2 diabetes
mean diff in TG btn groups-30 -20 -10 0 10 20
Combined
Bailey 2005
Weissman 2005
Gomez-Perez 2002
Fonseca 2000
Favors metformin Favors metformin plus rosiglitazone Boxes indicate individual study point estimates. Box size denotes the weight of the study, with larger boxes contributing more to the pooled point estimate. The width of the horizontal lines represents the 95% confidence interval for each individual study. The diamond at the bottom of the graph indicates the 95% confidence interval for the random effects pooled point estimate. Test for heterogeneity: Q = 9.600 on 3 degrees of freedom (p = 0.022) I-squared statistic = 69 (95% confidence interval: 10 to 89)
Mean difference in triglycerides between groups (in mg/dL)
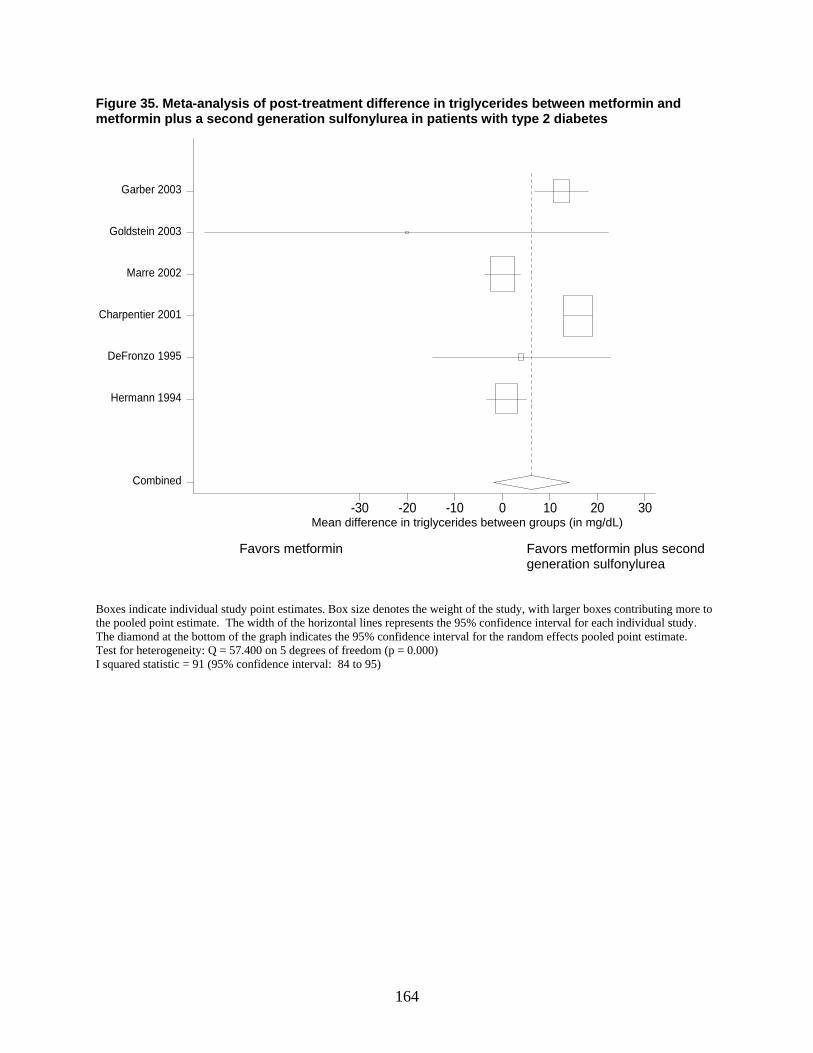
164
Figure 35. Meta-analysis of post-treatment difference in triglycerides between metformin and metformin plus a second generation sulfonylurea in patients with type 2 diabetes
mean diff in TG btn groups-30 -20 -10 0 10 20 30
Combined
Hermann 1994
DeFronzo 1995
Charpentier 2001
Marre 2002
Goldstein 2003
Garber 2003
Favors metformin Favors metformin plus second
generation sulfonylurea Boxes indicate individual study point estimates. Box size denotes the weight of the study, with larger boxes contributing more to the pooled point estimate. The width of the horizontal lines represents the 95% confidence interval for each individual study. The diamond at the bottom of the graph indicates the 95% confidence interval for the random effects pooled point estimate. Test for heterogeneity: Q = 57.400 on 5 degrees of freedom (p = 0.000) I squared statistic = 91 (95% confidence interval: 84 to 95)
Mean difference in triglycerides between groups (in mg/dL)
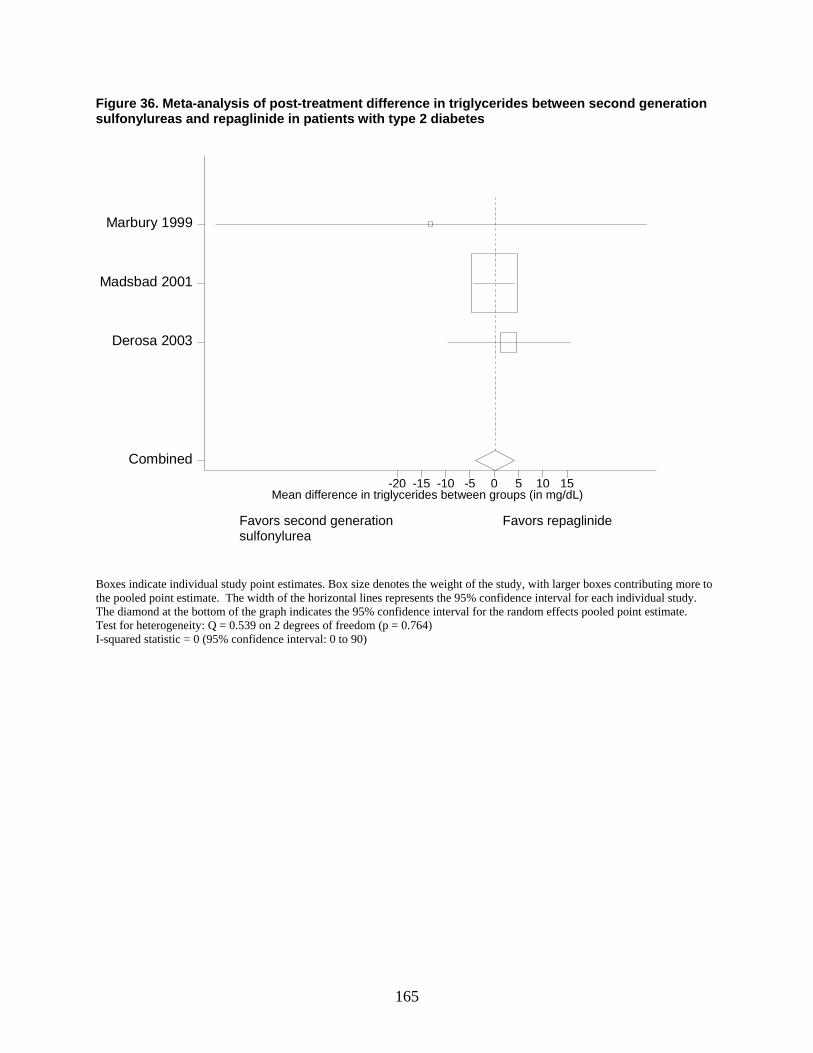
165
Figure 36. Meta-analysis of post-treatment difference in triglycerides between second generation sulfonylureas and repaglinide in patients with type 2 diabetes
mean diff in TG btn groups-20 -15 -10 -5 0 5 10 15
Combined
Derosa 2003
Madsbad 2001
Marbury 1999
Favors second generation Favors repaglinide
sulfonylurea Boxes indicate individual study point estimates. Box size denotes the weight of the study, with larger boxes contributing more to the pooled point estimate. The width of the horizontal lines represents the 95% confidence interval for each individual study. The diamond at the bottom of the graph indicates the 95% confidence interval for the random effects pooled point estimate. Test for heterogeneity: Q = 0.539 on 2 degrees of freedom (p = 0.764) I-squared statistic = 0 (95% confidence interval: 0 to 90)
Mean difference in triglycerides between groups (in mg/dL)
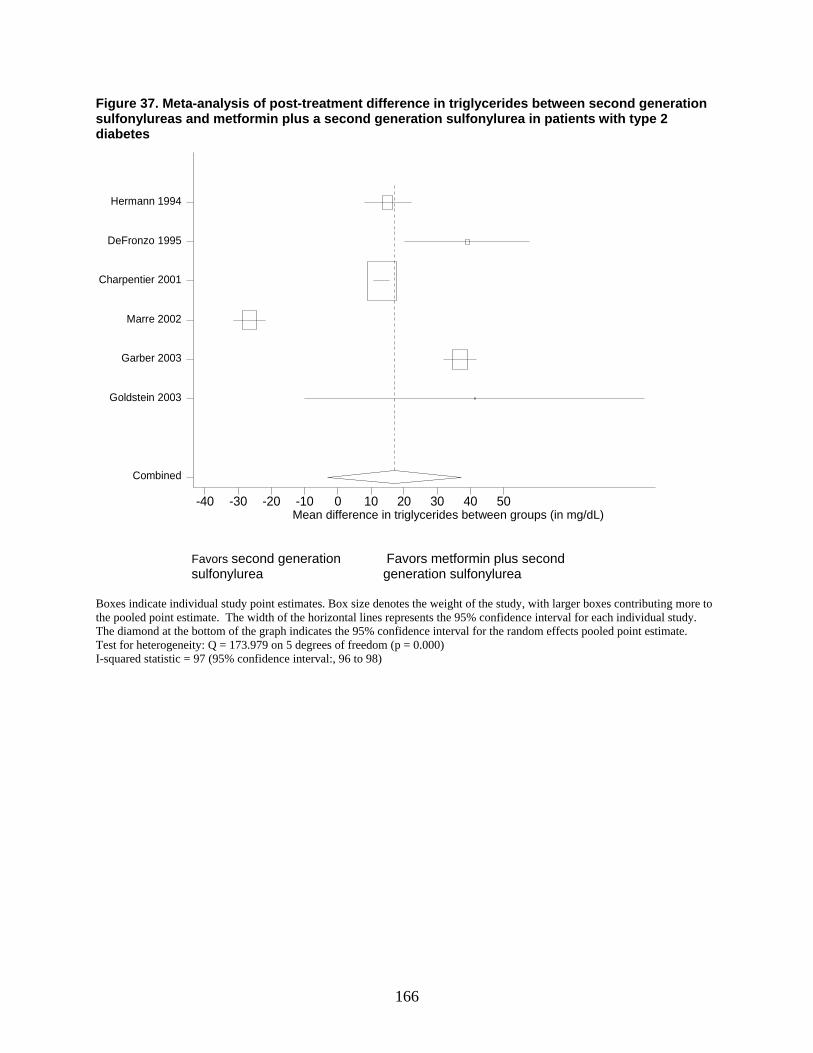
166
Figure 37. Meta-analysis of post-treatment difference in triglycerides between second generation sulfonylureas and metformin plus a second generation sulfonylurea in patients with type 2 diabetes
mean diff in TG btn groups-40 -30 -20 -10 0 10 20 30 40 50
Combined
Goldstein 2003
Garber 2003
Marre 2002
Charpentier 2001
DeFronzo 1995
Hermann 1994
Favors second generation Favors metformin plus second sulfonylurea generation sulfonylurea
Boxes indicate individual study point estimates. Box size denotes the weight of the study, with larger boxes contributing more to the pooled point estimate. The width of the horizontal lines represents the 95% confidence interval for each individual study. The diamond at the bottom of the graph indicates the 95% confidence interval for the random effects pooled point estimate. Test for heterogeneity: Q = 173.979 on 5 degrees of freedom (p = 0.000) I-squared statistic = 97 (95% confidence interval:, 96 to 98)
Mean difference in triglycerides between groups (in mg/dL)
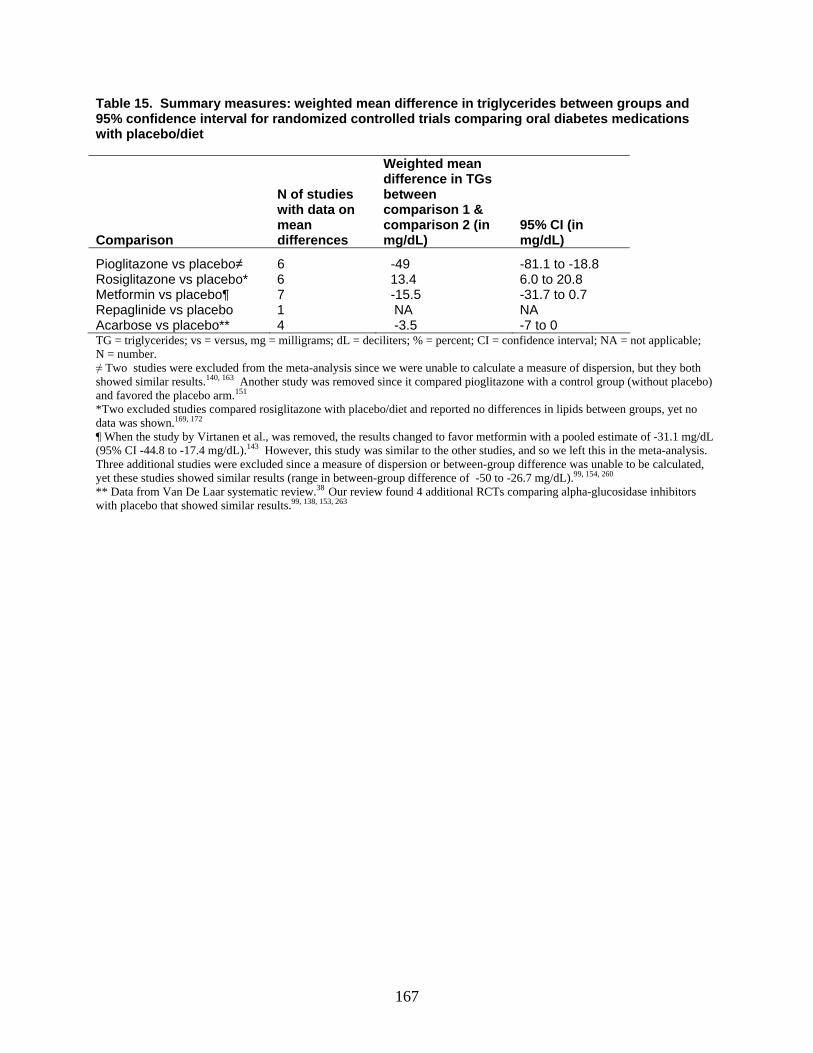
167
Table 15. Summary measures: weighted mean difference in triglycerides between groups and 95% confidence interval for randomized controlled trials comparing oral diabetes medications with placebo/diet
Comparison
N of studies with data on mean differences
Weighted mean difference in TGs between comparison 1 & comparison 2 (in mg/dL)
95% CI (in mg/dL)
Pioglitazone vs placebo≠ 6 -49 -81.1 to -18.8 Rosiglitazone vs placebo* 6 13.4 6.0 to 20.8 Metformin vs placebo¶ 7 -15.5 -31.7 to 0.7 Repaglinide vs placebo 1 NA NA Acarbose vs placebo** 4 -3.5 -7 to 0 TG = triglycerides; vs = versus, mg = milligrams; dL = deciliters; % = percent; CI = confidence interval; NA = not applicable; N = number. ≠ Two studies were excluded from the meta-analysis since we were unable to calculate a measure of dispersion, but they both showed similar results.140, 163 Another study was removed since it compared pioglitazone with a control group (without placebo) and favored the placebo arm.151 *Two excluded studies compared rosiglitazone with placebo/diet and reported no differences in lipids between groups, yet no data was shown.169, 172 ¶ When the study by Virtanen et al., was removed, the results changed to favor metformin with a pooled estimate of -31.1 mg/dL (95% CI -44.8 to -17.4 mg/dL).143 However, this study was similar to the other studies, and so we left this in the meta-analysis. Three additional studies were excluded since a measure of dispersion or between-group difference was unable to be calculated, yet these studies showed similar results (range in between-group difference of -50 to -26.7 mg/dL).99, 154, 260 ** Data from Van De Laar systematic review.38 Our review found 4 additional RCTs comparing alpha-glucosidase inhibitors with placebo that showed similar results.99, 138, 153, 263
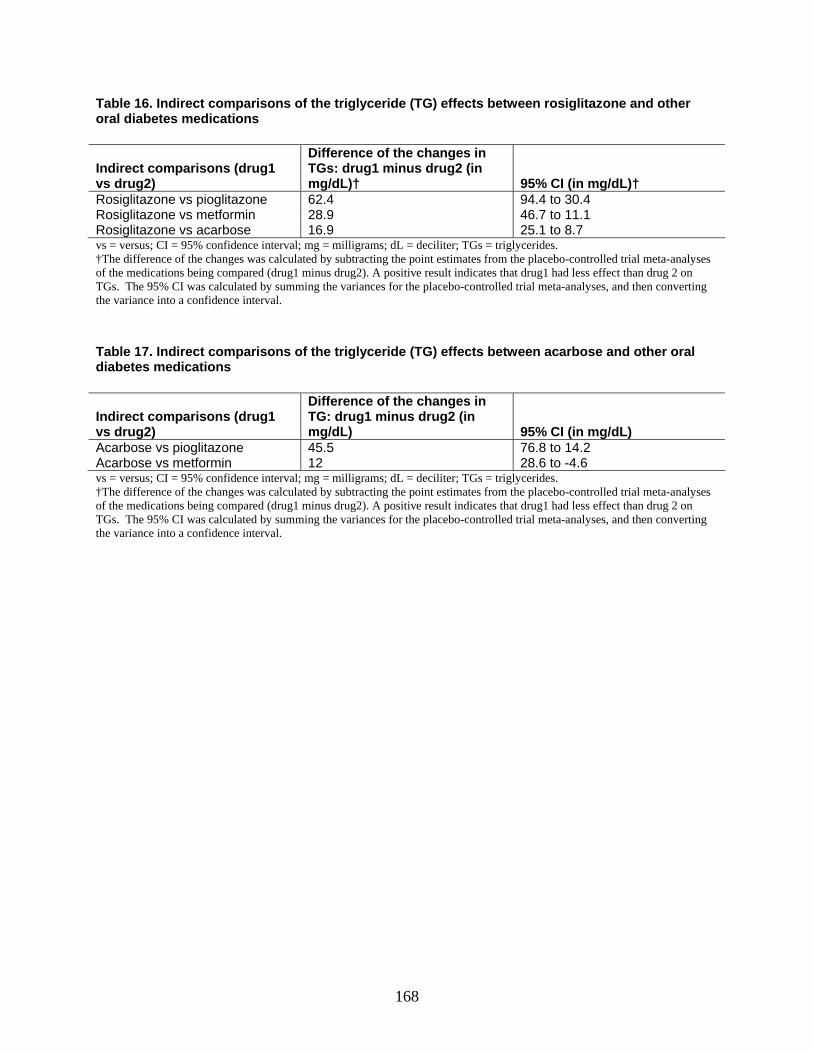
168
Table 16. Indirect comparisons of the triglyceride (TG) effects between rosiglitazone and other oral diabetes medications
Indirect comparisons (drug1 vs drug2)
Difference of the changes in TGs: drug1 minus drug2 (in mg/dL)† 95% CI (in mg/dL)†
Rosiglitazone vs pioglitazone 62.4 94.4 to 30.4 Rosiglitazone vs metformin 28.9 46.7 to 11.1 Rosiglitazone vs acarbose 16.9 25.1 to 8.7 vs = versus; CI = 95% confidence interval; mg = milligrams; dL = deciliter; TGs = triglycerides. †The difference of the changes was calculated by subtracting the point estimates from the placebo-controlled trial meta-analyses of the medications being compared (drug1 minus drug2). A positive result indicates that drug1 had less effect than drug 2 on TGs. The 95% CI was calculated by summing the variances for the placebo-controlled trial meta-analyses, and then converting the variance into a confidence interval. Table 17. Indirect comparisons of the triglyceride (TG) effects between acarbose and other oral diabetes medications
Indirect comparisons (drug1 vs drug2)
Difference of the changes in TG: drug1 minus drug2 (in mg/dL) 95% CI (in mg/dL)
Acarbose vs pioglitazone 45.5 76.8 to 14.2 Acarbose vs metformin 12 28.6 to -4.6 vs = versus; CI = 95% confidence interval; mg = milligrams; dL = deciliter; TGs = triglycerides. †The difference of the changes was calculated by subtracting the point estimates from the placebo-controlled trial meta-analyses of the medications being compared (drug1 minus drug2). A positive result indicates that drug1 had less effect than drug 2 on TGs. The 95% CI was calculated by summing the variances for the placebo-controlled trial meta-analyses, and then converting the variance into a confidence interval.
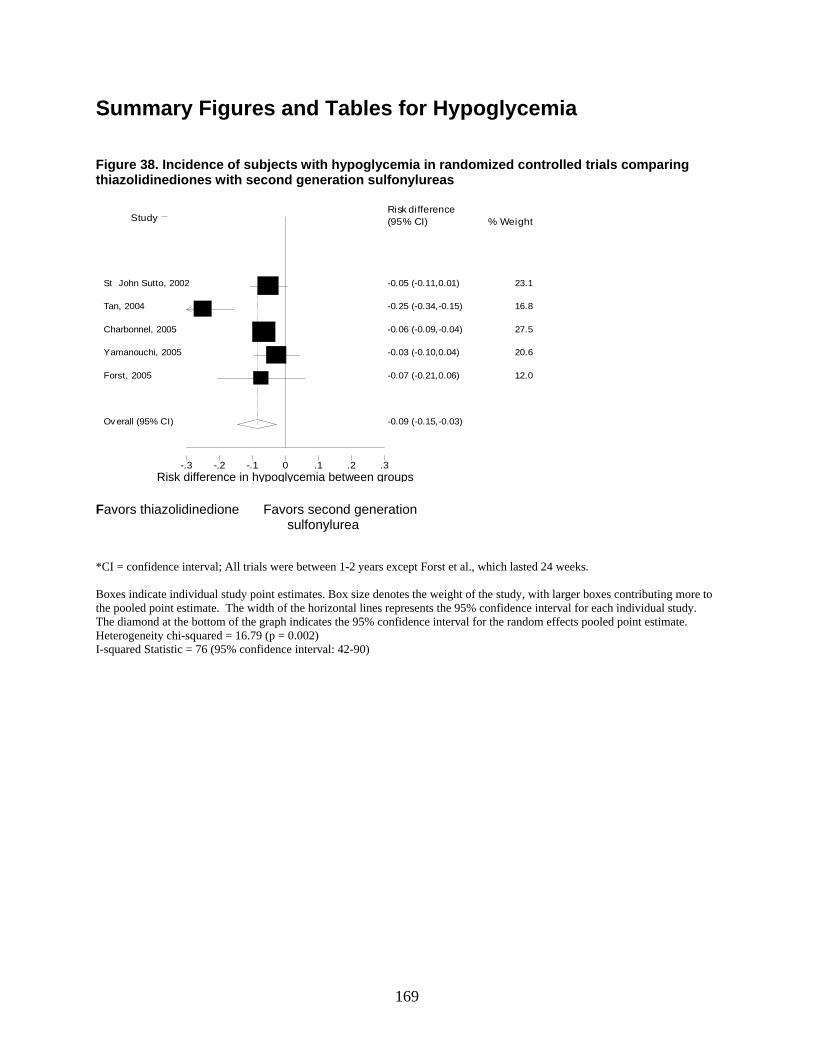
169
Summary Figures and Tables for Hypoglycemia Figure 38. Incidence of subjects with hypoglycemia in randomized controlled trials comparing thiazolidinediones with second generation sulfonylureas
Risk difference-.3 -.2 -.1 0 .1 .2 .3
Study % Weight Risk difference (95% CI)
-0.05 (-0.11,0.01) St John Sutto, 2002 23.1
-0.25 (-0.34,-0.15) Tan, 2004 16.8
-0.06 (-0.09,-0.04) Charbonnel, 2005 27.5
-0.03 (-0.10,0.04) Yamanouchi, 2005 20.6
-0.07 (-0.21,0.06) Forst, 2005 12.0
-0.09 (-0.15,-0.03) Ov erall (95% CI)
Favors thiazolidinedione Favors second generation
sulfonylurea *CI = confidence interval; All trials were between 1-2 years except Forst et al., which lasted 24 weeks. Boxes indicate individual study point estimates. Box size denotes the weight of the study, with larger boxes contributing more to the pooled point estimate. The width of the horizontal lines represents the 95% confidence interval for each individual study. The diamond at the bottom of the graph indicates the 95% confidence interval for the random effects pooled point estimate. Heterogeneity chi-squared = 16.79 (p = 0.002) I-squared Statistic = 76 (95% confidence interval: 42-90)
Risk difference in hypoglycemia between groups
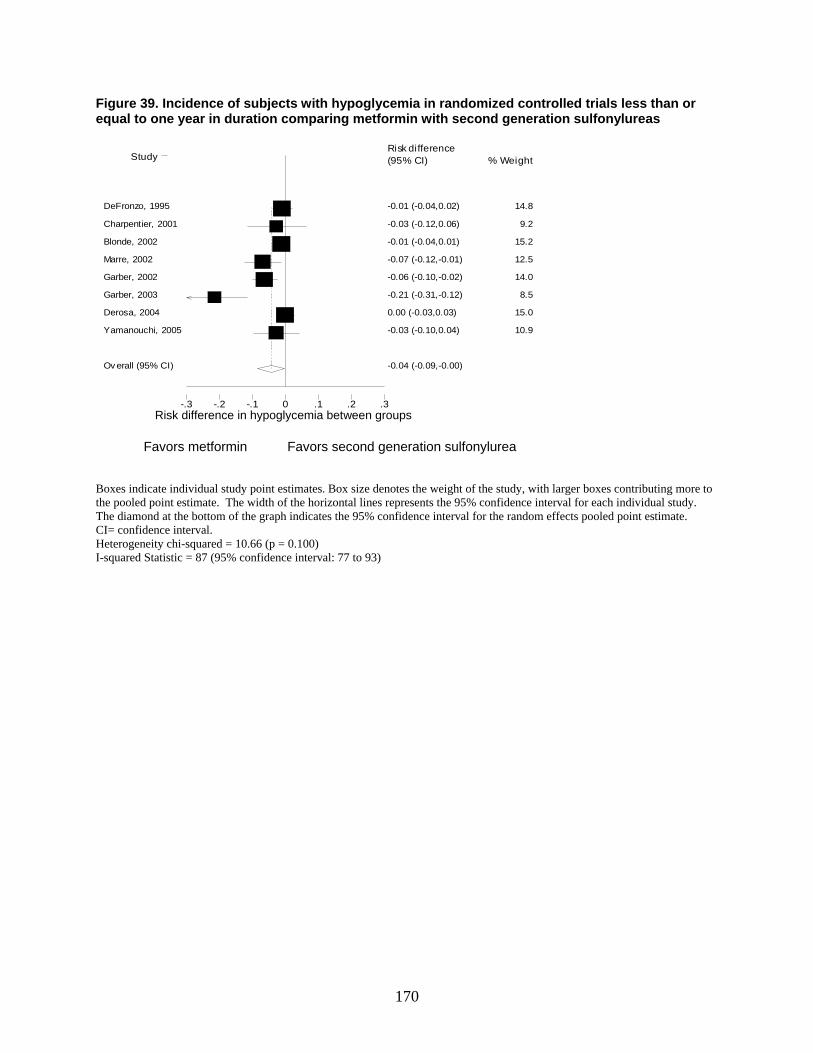
170
Figure 39. Incidence of subjects with hypoglycemia in randomized controlled trials less than or equal to one year in duration comparing metformin with second generation sulfonylureas
Risk difference-.3 -.2 -.1 0 .1 .2 .3
Study % Weight Risk difference (95% CI)
-0.01 (-0.04,0.02) DeFronzo, 1995 14.8
-0.03 (-0.12,0.06) Charpentier, 2001 9.2
-0.01 (-0.04,0.01) Blonde, 2002 15.2
-0.07 (-0.12,-0.01) Marre, 2002 12.5
-0.06 (-0.10,-0.02) Garber, 2002 14.0
-0.21 (-0.31,-0.12) Garber, 2003 8.5
0.00 (-0.03,0.03) Derosa, 2004 15.0
-0.03 (-0.10,0.04) Yamanouchi, 2005 10.9
-0.04 (-0.09,-0.00) Ov erall (95% CI)
Favors metformin Favors second generation sulfonylurea Boxes indicate individual study point estimates. Box size denotes the weight of the study, with larger boxes contributing more to the pooled point estimate. The width of the horizontal lines represents the 95% confidence interval for each individual study. The diamond at the bottom of the graph indicates the 95% confidence interval for the random effects pooled point estimate. CI= confidence interval. Heterogeneity chi-squared = 10.66 (p = 0.100) I-squared Statistic = 87 (95% confidence interval: 77 to 93)
Risk difference in hypoglycemia between groups
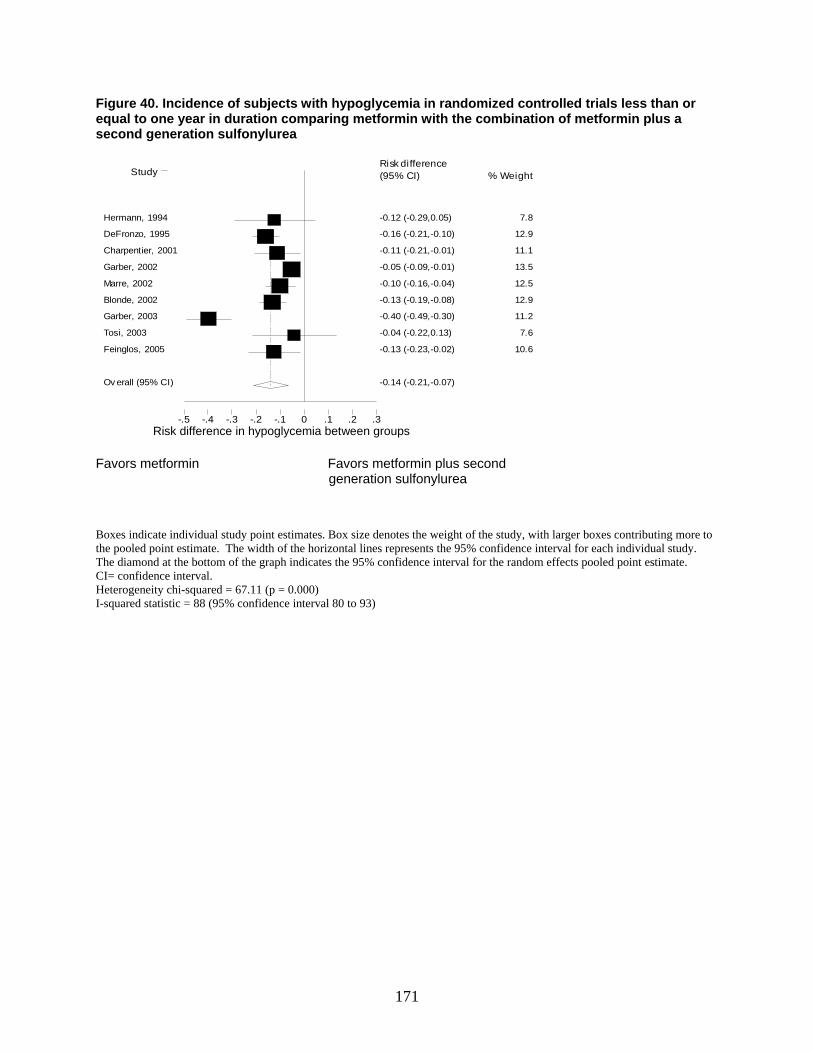
171
Figure 40. Incidence of subjects with hypoglycemia in randomized controlled trials less than or equal to one year in duration comparing metformin with the combination of metformin plus a second generation sulfonylurea
Risk difference-.5 -.4 -.3 -.2 -.1 0 .1 .2 .3
Study % Weight Risk difference (95% CI)
-0.12 (-0.29,0.05) Hermann, 1994 7.8
-0.16 (-0.21,-0.10) DeFronzo, 1995 12.9
-0.11 (-0.21,-0.01) Charpentier, 2001 11.1
-0.05 (-0.09,-0.01) Garber, 2002 13.5
-0.10 (-0.16,-0.04) Marre, 2002 12.5
-0.13 (-0.19,-0.08) Blonde, 2002 12.9
-0.40 (-0.49,-0.30) Garber, 2003 11.2
-0.04 (-0.22,0.13) Tosi, 2003 7.6
-0.13 (-0.23,-0.02) Feinglos, 2005 10.6
-0.14 (-0.21,-0.07) Ov erall (95% CI)
Favors metformin Favors metformin plus second generation sulfonylurea Boxes indicate individual study point estimates. Box size denotes the weight of the study, with larger boxes contributing more to the pooled point estimate. The width of the horizontal lines represents the 95% confidence interval for each individual study. The diamond at the bottom of the graph indicates the 95% confidence interval for the random effects pooled point estimate. CI= confidence interval. Heterogeneity chi-squared = 67.11 (p = 0.000) I-squared statistic = 88 (95% confidence interval 80 to 93)
Risk difference in hypoglycemia between groups
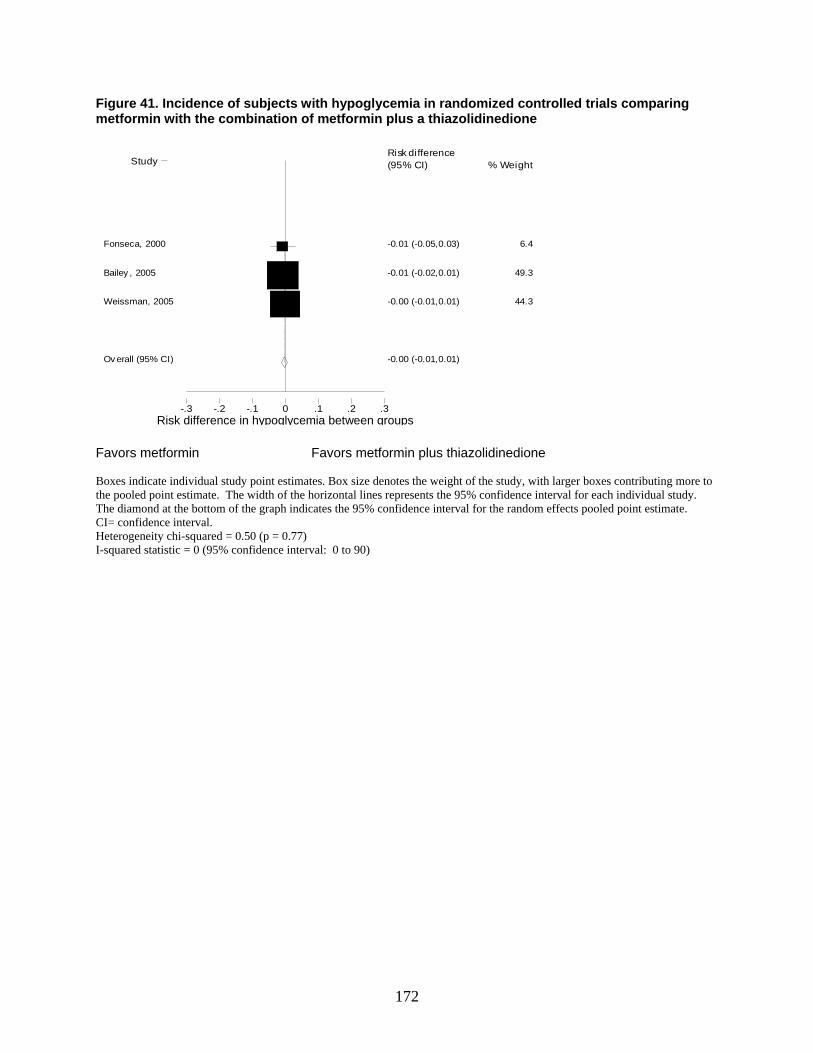
172
Figure 41. Incidence of subjects with hypoglycemia in randomized controlled trials comparing metformin with the combination of metformin plus a thiazolidinedione
Risk difference-.3 -.2 -.1 0 .1 .2 .3
Study % Weight Risk difference (95% CI)
-0.01 (-0.05,0.03) Fonseca, 2000 6.4
-0.01 (-0.02,0.01) Bailey , 2005 49.3
-0.00 (-0.01,0.01) Weissman, 2005 44.3
-0.00 (-0.01,0.01) Ov erall (95% CI)
Favors metformin Favors metformin plus thiazolidinedione Boxes indicate individual study point estimates. Box size denotes the weight of the study, with larger boxes contributing more to the pooled point estimate. The width of the horizontal lines represents the 95% confidence interval for each individual study. The diamond at the bottom of the graph indicates the 95% confidence interval for the random effects pooled point estimate. CI= confidence interval. Heterogeneity chi-squared = 0.50 (p = 0.77) I-squared statistic = 0 (95% confidence interval: 0 to 90)
Risk difference in hypoglycemia between groups
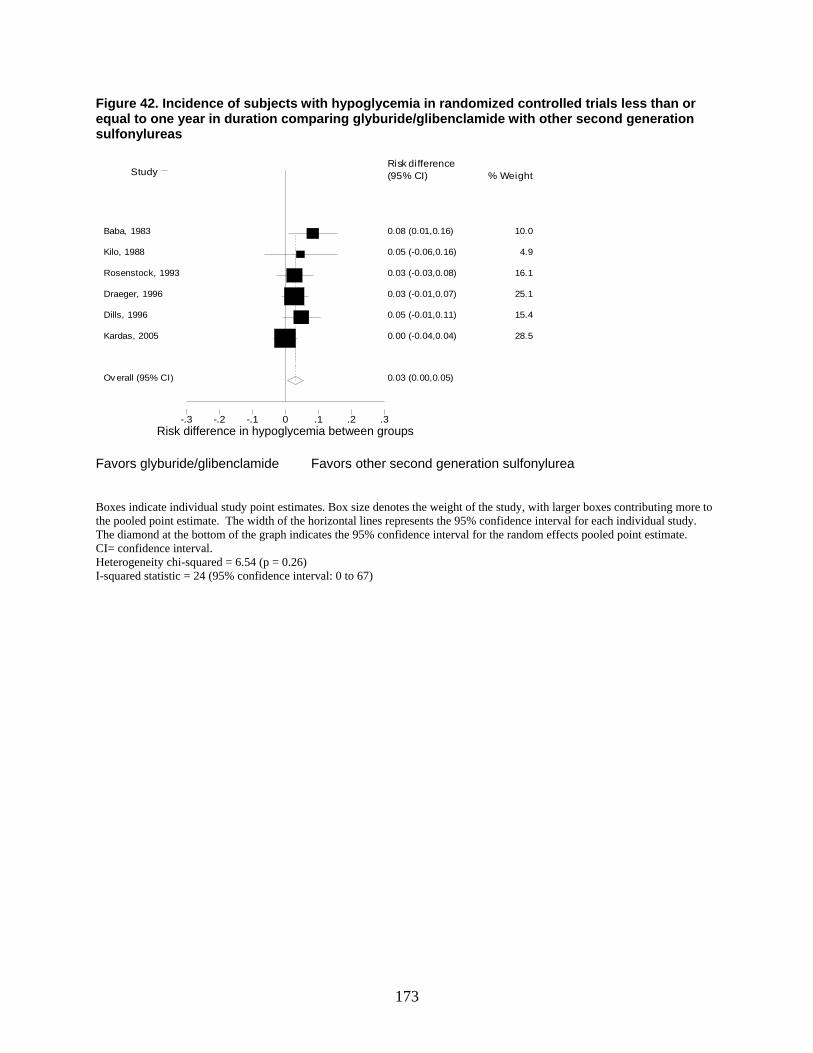
173
Figure 42. Incidence of subjects with hypoglycemia in randomized controlled trials less than or equal to one year in duration comparing glyburide/glibenclamide with other second generation sulfonylureas
Risk difference-.3 -.2 -.1 0 .1 .2 .3
Study % Weight Risk difference (95% CI)
0.08 (0.01,0.16) Baba, 1983 10.0
0.05 (-0.06,0.16) Kilo, 1988 4.9
0.03 (-0.03,0.08) Rosenstock, 1993 16.1
0.03 (-0.01,0.07) Draeger, 1996 25.1
0.05 (-0.01,0.11) Dills, 1996 15.4
0.00 (-0.04,0.04) Kardas, 2005 28.5
0.03 (0.00,0.05) Ov erall (95% CI)
Favors glyburide/glibenclamide Favors other second generation sulfonylurea Boxes indicate individual study point estimates. Box size denotes the weight of the study, with larger boxes contributing more to the pooled point estimate. The width of the horizontal lines represents the 95% confidence interval for each individual study. The diamond at the bottom of the graph indicates the 95% confidence interval for the random effects pooled point estimate. CI= confidence interval. Heterogeneity chi-squared = 6.54 (p = 0.26) I-squared statistic = 24 (95% confidence interval: 0 to 67)
Risk difference in hypoglycemia between groups
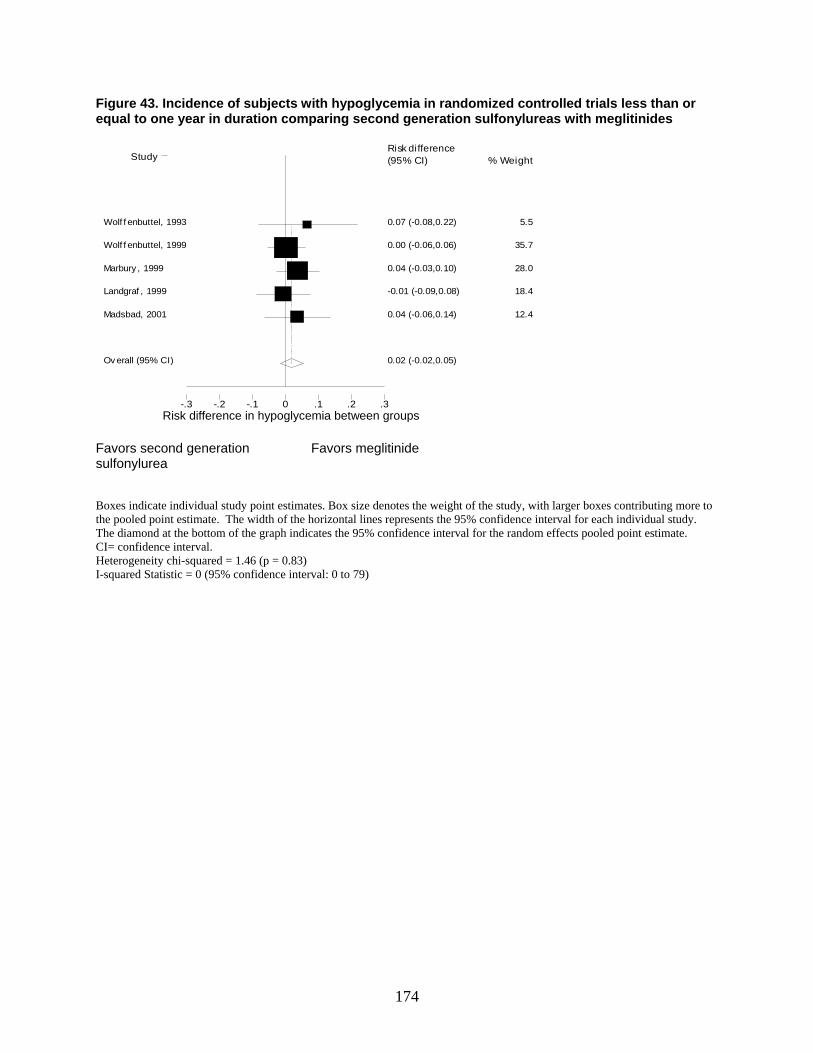
174
Figure 43. Incidence of subjects with hypoglycemia in randomized controlled trials less than or equal to one year in duration comparing second generation sulfonylureas with meglitinides
Risk difference-.3 -.2 -.1 0 .1 .2 .3
Study % Weight Risk difference (95% CI)
0.07 (-0.08,0.22) Wolf f enbuttel, 1993 5.5
0.00 (-0.06,0.06) Wolf f enbuttel, 1999 35.7
0.04 (-0.03,0.10) Marbury , 1999 28.0
-0.01 (-0.09,0.08) Landgraf , 1999 18.4
0.04 (-0.06,0.14) Madsbad, 2001 12.4
0.02 (-0.02,0.05) Ov erall (95% CI)
Favors second generation Favors meglitinide sulfonylurea Boxes indicate individual study point estimates. Box size denotes the weight of the study, with larger boxes contributing more to the pooled point estimate. The width of the horizontal lines represents the 95% confidence interval for each individual study. The diamond at the bottom of the graph indicates the 95% confidence interval for the random effects pooled point estimate. CI= confidence interval. Heterogeneity chi-squared = 1.46 (p = 0.83) I-squared Statistic = 0 (95% confidence interval: 0 to 79)
Risk difference in hypoglycemia between groups
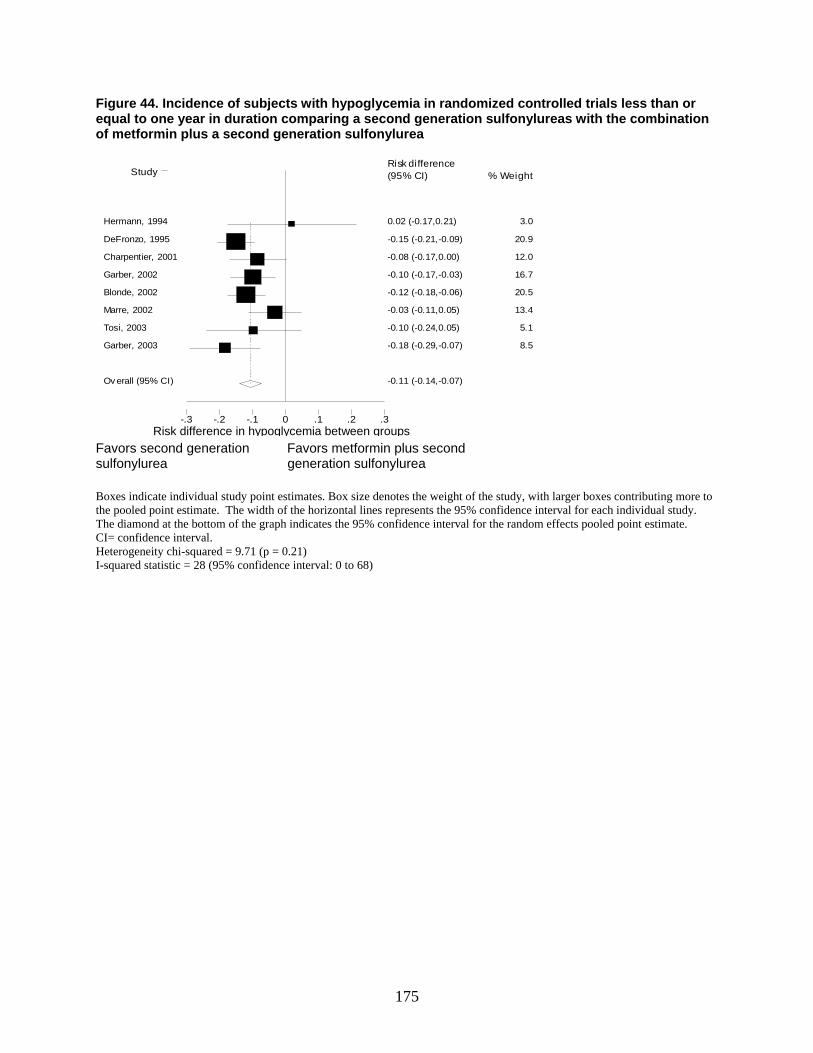
175
Figure 44. Incidence of subjects with hypoglycemia in randomized controlled trials less than or equal to one year in duration comparing a second generation sulfonylureas with the combination of metformin plus a second generation sulfonylurea
Risk difference-.3 -.2 -.1 0 .1 .2 .3
Study % Weight Risk difference (95% CI)
0.02 (-0.17,0.21) Hermann, 1994 3.0
-0.15 (-0.21,-0.09) DeFronzo, 1995 20.9
-0.08 (-0.17,0.00) Charpentier, 2001 12.0
-0.10 (-0.17,-0.03) Garber, 2002 16.7
-0.12 (-0.18,-0.06) Blonde, 2002 20.5
-0.03 (-0.11,0.05) Marre, 2002 13.4
-0.10 (-0.24,0.05) Tosi, 2003 5.1
-0.18 (-0.29,-0.07) Garber, 2003 8.5
-0.11 (-0.14,-0.07) Ov erall (95% CI)
Favors second generation Favors metformin plus second sulfonylurea generation sulfonylurea Boxes indicate individual study point estimates. Box size denotes the weight of the study, with larger boxes contributing more to the pooled point estimate. The width of the horizontal lines represents the 95% confidence interval for each individual study. The diamond at the bottom of the graph indicates the 95% confidence interval for the random effects pooled point estimate. CI= confidence interval. Heterogeneity chi-squared = 9.71 (p = 0.21) I-squared statistic = 28 (95% confidence interval: 0 to 68)
Risk difference in hypoglycemia between groups
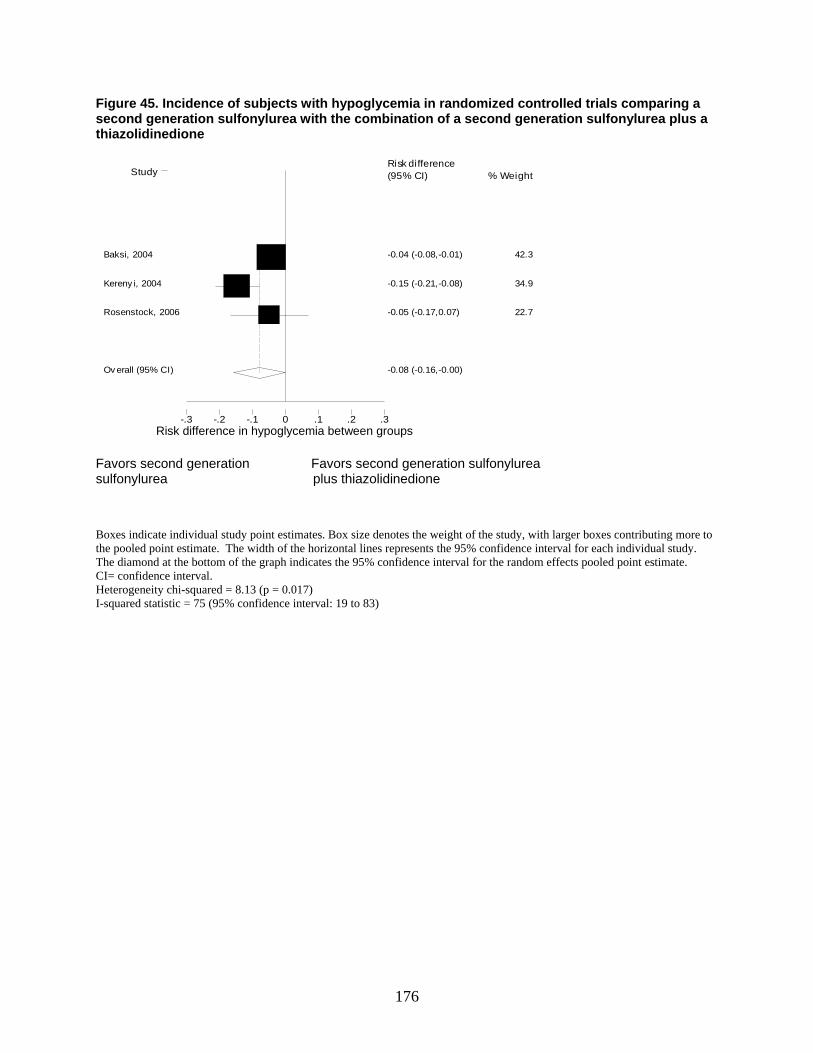
176
Figure 45. Incidence of subjects with hypoglycemia in randomized controlled trials comparing a second generation sulfonylurea with the combination of a second generation sulfonylurea plus a thiazolidinedione
Risk difference-.3 -.2 -.1 0 .1 .2 .3
Study % Weight Risk difference (95% CI)
-0.04 (-0.08,-0.01) Baksi, 2004 42.3
-0.15 (-0.21,-0.08) Kereny i, 2004 34.9
-0.05 (-0.17,0.07) Rosenstock, 2006 22.7
-0.08 (-0.16,-0.00) Ov erall (95% CI)
Favors second generation Favors second generation sulfonylurea sulfonylurea plus thiazolidinedione Boxes indicate individual study point estimates. Box size denotes the weight of the study, with larger boxes contributing more to the pooled point estimate. The width of the horizontal lines represents the 95% confidence interval for each individual study. The diamond at the bottom of the graph indicates the 95% confidence interval for the random effects pooled point estimate. CI= confidence interval. Heterogeneity chi-squared = 8.13 (p = 0.017) I-squared statistic = 75 (95% confidence interval: 19 to 83)
Risk difference in hypoglycemia between groups
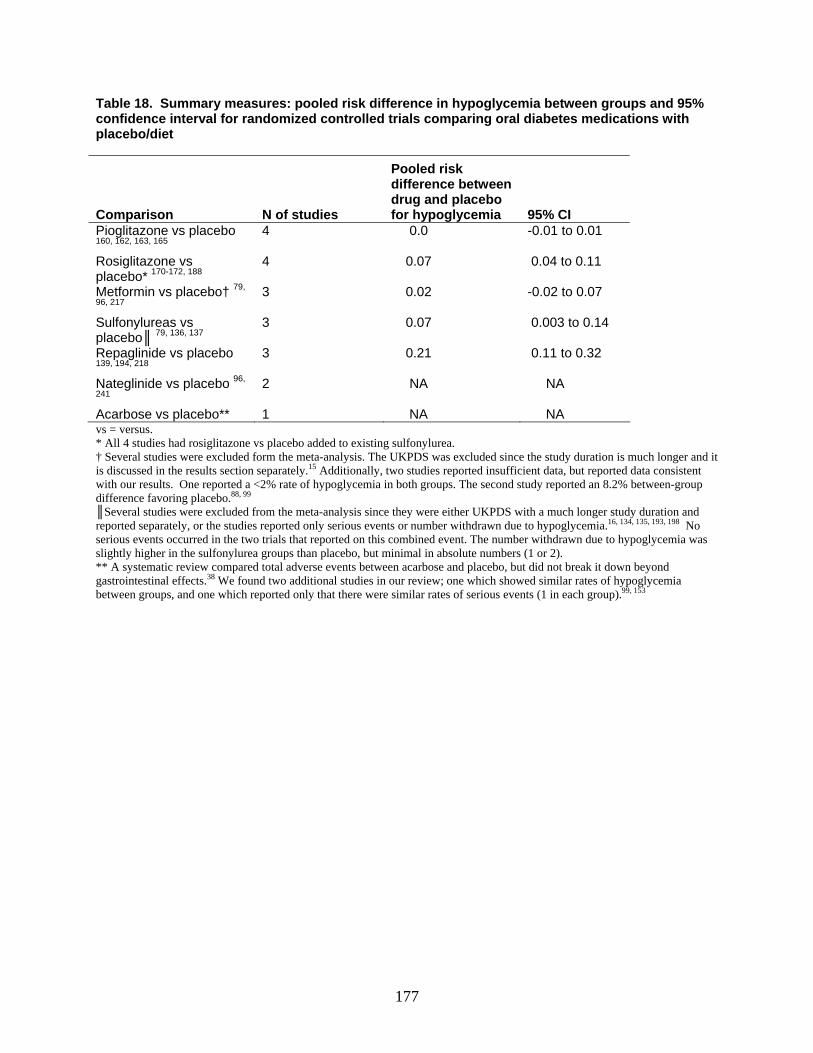
177
Table 18. Summary measures: pooled risk difference in hypoglycemia between groups and 95% confidence interval for randomized controlled trials comparing oral diabetes medications with placebo/diet
Comparison N of studies
Pooled risk difference between drug and placebo for hypoglycemia 95% CI
Pioglitazone vs placebo 160, 162, 163, 165
4 0.0 -0.01 to 0.01
Rosiglitazone vs placebo* 170-172, 188
4 0.07 0.04 to 0.11
Metformin vs placebo† 79,
96, 217 3 0.02 -0.02 to 0.07
Sulfonylureas vs placebo║ 79, 136, 137
3 0.07 0.003 to 0.14
Repaglinide vs placebo 139, 194, 218
3 0.21 0.11 to 0.32
Nateglinide vs placebo 96,
241 2 NA NA
Acarbose vs placebo** 1 NA NA vs = versus. * All 4 studies had rosiglitazone vs placebo added to existing sulfonylurea. † Several studies were excluded form the meta-analysis. The UKPDS was excluded since the study duration is much longer and it is discussed in the results section separately.15 Additionally, two studies reported insufficient data, but reported data consistent with our results. One reported a <2% rate of hypoglycemia in both groups. The second study reported an 8.2% between-group difference favoring placebo.88, 99 ║Several studies were excluded from the meta-analysis since they were either UKPDS with a much longer study duration and reported separately, or the studies reported only serious events or number withdrawn due to hypoglycemia.16, 134, 135, 193, 198 No serious events occurred in the two trials that reported on this combined event. The number withdrawn due to hypoglycemia was slightly higher in the sulfonylurea groups than placebo, but minimal in absolute numbers (1 or 2). ** A systematic review compared total adverse events between acarbose and placebo, but did not break it down beyond gastrointestinal effects.38 We found two additional studies in our review; one which showed similar rates of hypoglycemia between groups, and one which reported only that there were similar rates of serious events (1 in each group).99, 153
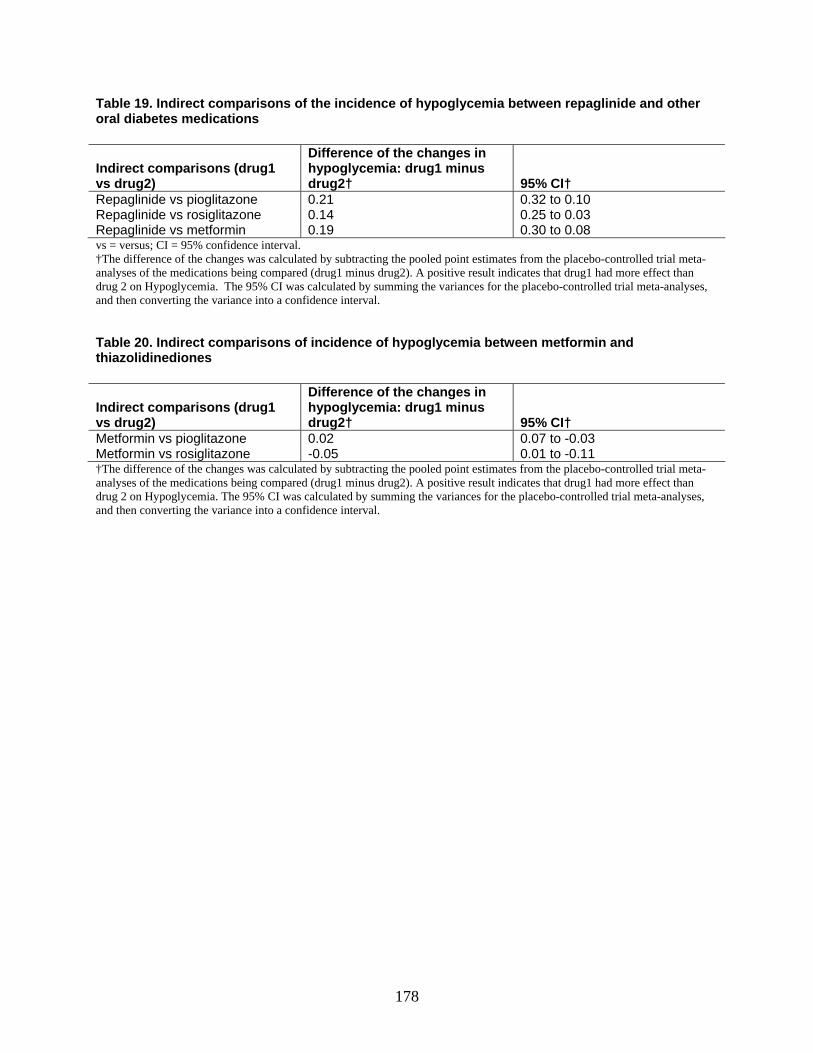
178
Table 19. Indirect comparisons of the incidence of hypoglycemia between repaglinide and other oral diabetes medications
Indirect comparisons (drug1 vs drug2)
Difference of the changes in hypoglycemia: drug1 minus drug2† 95% CI†
Repaglinide vs pioglitazone 0.21 0.32 to 0.10 Repaglinide vs rosiglitazone 0.14 0.25 to 0.03 Repaglinide vs metformin 0.19 0.30 to 0.08 vs = versus; CI = 95% confidence interval. †The difference of the changes was calculated by subtracting the pooled point estimates from the placebo-controlled trial meta-analyses of the medications being compared (drug1 minus drug2). A positive result indicates that drug1 had more effect than drug 2 on Hypoglycemia. The 95% CI was calculated by summing the variances for the placebo-controlled trial meta-analyses, and then converting the variance into a confidence interval. Table 20. Indirect comparisons of incidence of hypoglycemia between metformin and thiazolidinediones
Indirect comparisons (drug1 vs drug2)
Difference of the changes in hypoglycemia: drug1 minus drug2† 95% CI†
Metformin vs pioglitazone 0.02 0.07 to -0.03 Metformin vs rosiglitazone -0.05 0.01 to -0.11 †The difference of the changes was calculated by subtracting the pooled point estimates from the placebo-controlled trial meta-analyses of the medications being compared (drug1 minus drug2). A positive result indicates that drug1 had more effect than drug 2 on Hypoglycemia. The 95% CI was calculated by summing the variances for the placebo-controlled trial meta-analyses, and then converting the variance into a confidence interval.
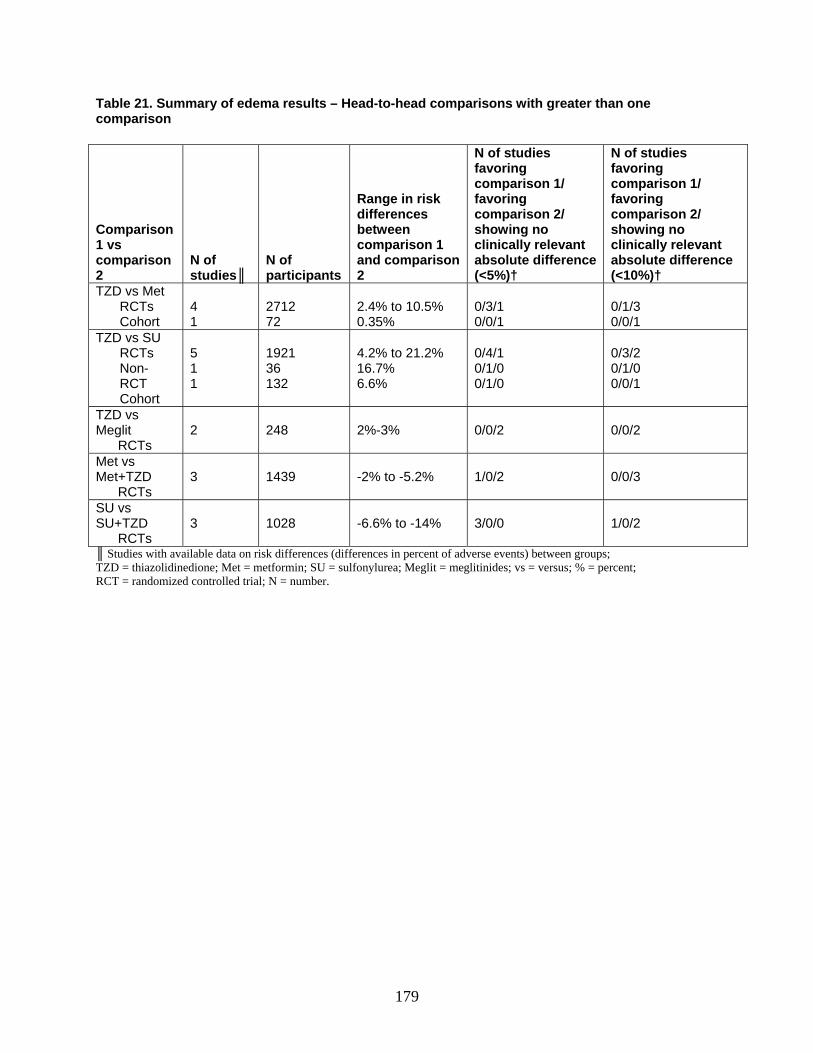
179
Table 21. Summary of edema results – Head-to-head comparisons with greater than one comparison
Comparison 1 vs comparison 2
N of studies║
N of participants
Range in risk differences between comparison 1 and comparison 2
N of studies favoring comparison 1/ favoring comparison 2/ showing no clinically relevant absolute difference (<5%)†
N of studies favoring comparison 1/ favoring comparison 2/ showing no clinically relevant absolute difference (<10%)†
TZD vs Met RCTs Cohort
4 1
2712 72
2.4% to 10.5% 0.35%
0/3/1 0/0/1
0/1/3 0/0/1
TZD vs SU RCTs Non-RCT Cohort
5 1 1
1921 36 132
4.2% to 21.2% 16.7% 6.6%
0/4/1 0/1/0 0/1/0
0/3/2 0/1/0 0/0/1
TZD vs Meglit RCTs
2
248
2%-3%
0/0/2
0/0/2
Met vs Met+TZD RCTs
3
1439
-2% to -5.2%
1/0/2
0/0/3
SU vs SU+TZD RCTs
3
1028
-6.6% to -14%
3/0/0
1/0/2
║ Studies with available data on risk differences (differences in percent of adverse events) between groups; TZD = thiazolidinedione; Met = metformin; SU = sulfonylurea; Meglit = meglitinides; vs = versus; % = percent; RCT = randomized controlled trial; N = number.
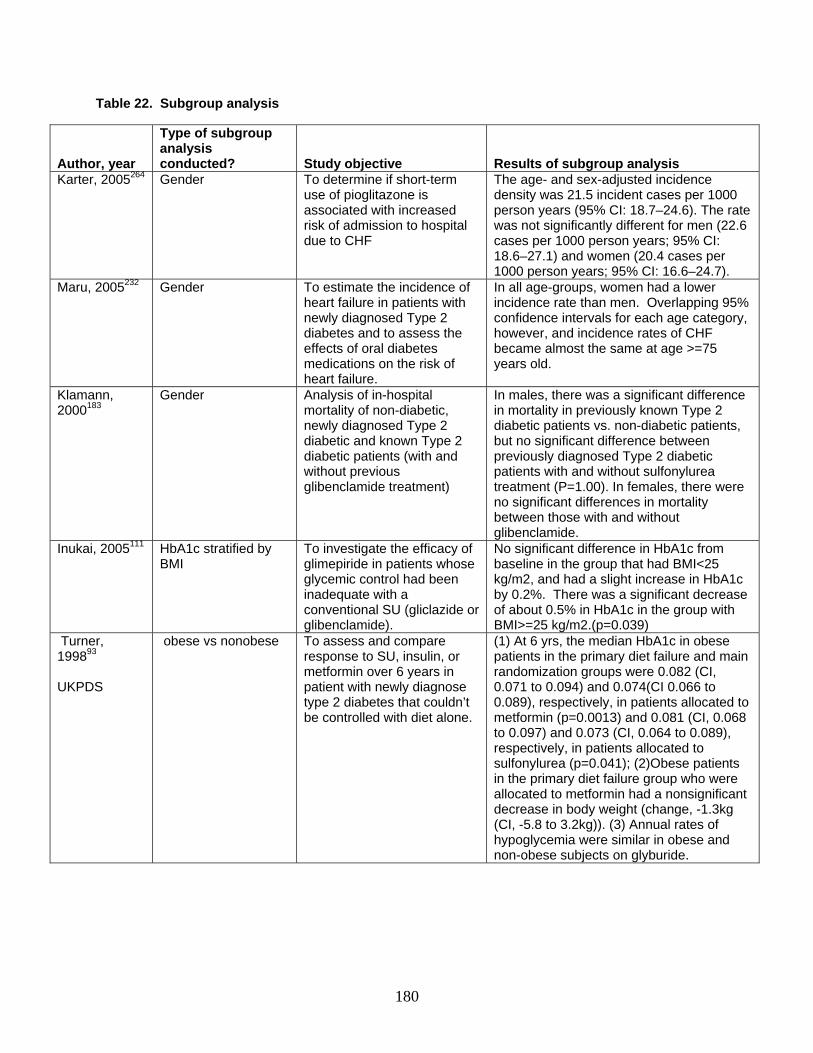
180
Table 22. Subgroup analysis
Author, year
Type of subgroup analysis conducted? Study objective Results of subgroup analysis
Karter, 2005264 Gender To determine if short-term use of pioglitazone is associated with increased risk of admission to hospital due to CHF
The age- and sex-adjusted incidence density was 21.5 incident cases per 1000 person years (95% CI: 18.7–24.6). The rate was not significantly different for men (22.6 cases per 1000 person years; 95% CI: 18.6–27.1) and women (20.4 cases per 1000 person years; 95% CI: 16.6–24.7).
Maru, 2005232 Gender To estimate the incidence of heart failure in patients with newly diagnosed Type 2 diabetes and to assess the effects of oral diabetes medications on the risk of heart failure.
In all age-groups, women had a lower incidence rate than men. Overlapping 95% confidence intervals for each age category, however, and incidence rates of CHF became almost the same at age >=75 years old.
Klamann, 2000183
Gender Analysis of in-hospital mortality of non-diabetic, newly diagnosed Type 2 diabetic and known Type 2 diabetic patients (with and without previous glibenclamide treatment)
In males, there was a significant difference in mortality in previously known Type 2 diabetic patients vs. non-diabetic patients, but no significant difference between previously diagnosed Type 2 diabetic patients with and without sulfonylurea treatment (P=1.00). In females, there were no significant differences in mortality between those with and without glibenclamide.
Inukai, 2005111 HbA1c stratified by BMI
To investigate the efficacy of glimepiride in patients whose glycemic control had been inadequate with a conventional SU (gliclazide or glibenclamide).
No significant difference in HbA1c from baseline in the group that had BMI<25 kg/m2, and had a slight increase in HbA1c by 0.2%. There was a significant decrease of about 0.5% in HbA1c in the group with BMI>=25 kg/m2.(p=0.039)
Turner, 199893 UKPDS
obese vs nonobese To assess and compare response to SU, insulin, or metformin over 6 years in patient with newly diagnose type 2 diabetes that couldn’t be controlled with diet alone.
(1) At 6 yrs, the median HbA1c in obese patients in the primary diet failure and main randomization groups were 0.082 (CI, 0.071 to 0.094) and 0.074(CI 0.066 to 0.089), respectively, in patients allocated to metformin (p=0.0013) and 0.081 (CI, 0.068 to 0.097) and 0.073 (CI, 0.064 to 0.089), respectively, in patients allocated to sulfonylurea (p=0.041); (2)Obese patients in the primary diet failure group who were allocated to metformin had a nonsignificant decrease in body weight (change, -1.3kg (CI, -5.8 to 3.2kg)). (3) Annual rates of hypoglycemia were similar in obese and non-obese subjects on glyburide.
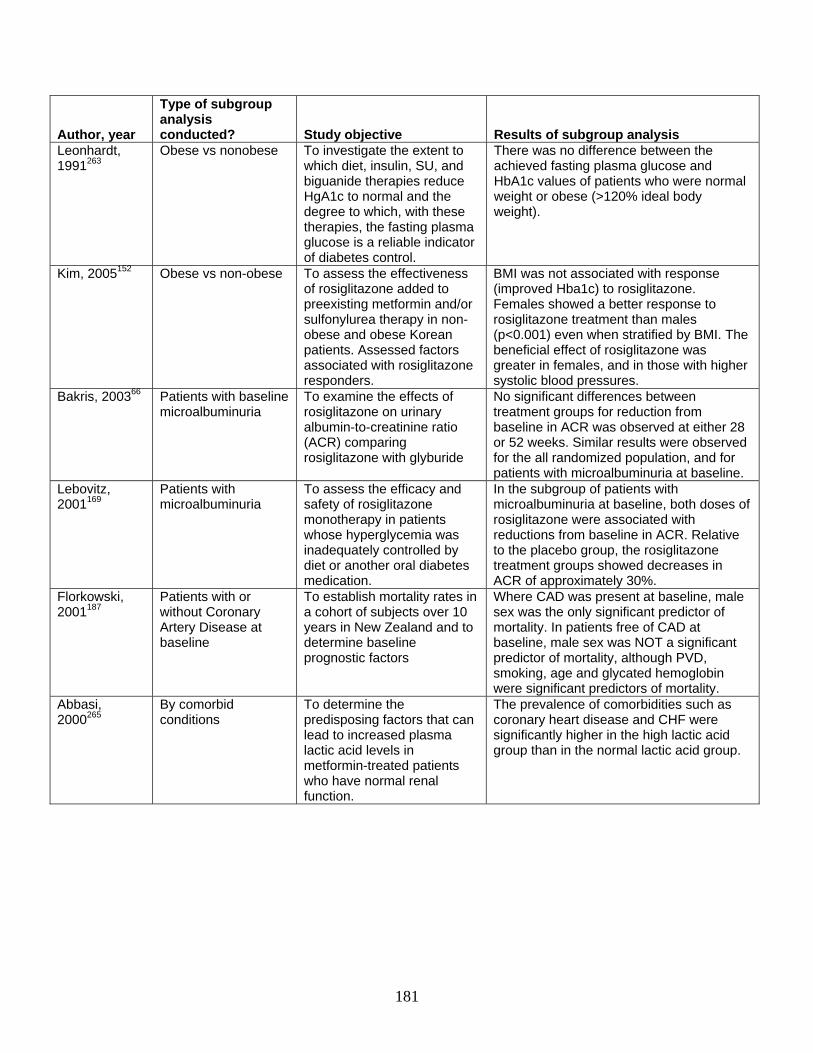
181
Author, year
Type of subgroup analysis conducted? Study objective Results of subgroup analysis
Leonhardt, 1991263
Obese vs nonobese To investigate the extent to which diet, insulin, SU, and biguanide therapies reduce HgA1c to normal and the degree to which, with these therapies, the fasting plasma glucose is a reliable indicator of diabetes control.
There was no difference between the achieved fasting plasma glucose and HbA1c values of patients who were normal weight or obese (>120% ideal body weight).
Kim, 2005152 Obese vs non-obese To assess the effectiveness of rosiglitazone added to preexisting metformin and/or sulfonylurea therapy in non-obese and obese Korean patients. Assessed factors associated with rosiglitazone responders.
BMI was not associated with response (improved Hba1c) to rosiglitazone. Females showed a better response to rosiglitazone treatment than males (p<0.001) even when stratified by BMI. The beneficial effect of rosiglitazone was greater in females, and in those with higher systolic blood pressures.
Bakris, 200366 Patients with baseline microalbuminuria
To examine the effects of rosiglitazone on urinary albumin-to-creatinine ratio (ACR) comparing rosiglitazone with glyburide
No significant differences between treatment groups for reduction from baseline in ACR was observed at either 28 or 52 weeks. Similar results were observed for the all randomized population, and for patients with microalbuminuria at baseline.
Lebovitz, 2001169
Patients with microalbuminuria
To assess the efficacy and safety of rosiglitazone monotherapy in patients whose hyperglycemia was inadequately controlled by diet or another oral diabetes medication.
In the subgroup of patients with microalbuminuria at baseline, both doses of rosiglitazone were associated with reductions from baseline in ACR. Relative to the placebo group, the rosiglitazone treatment groups showed decreases in ACR of approximately 30%.
Florkowski, 2001187
Patients with or without Coronary Artery Disease at baseline
To establish mortality rates in a cohort of subjects over 10 years in New Zealand and to determine baseline prognostic factors
Where CAD was present at baseline, male sex was the only significant predictor of mortality. In patients free of CAD at baseline, male sex was NOT a significant predictor of mortality, although PVD, smoking, age and glycated hemoglobin were significant predictors of mortality.
Abbasi, 2000265
By comorbid conditions
To determine the predisposing factors that can lead to increased plasma lactic acid levels in metformin-treated patients who have normal renal function.
The prevalence of comorbidities such as coronary heart disease and CHF were significantly higher in the high lactic acid group than in the normal lactic acid group.
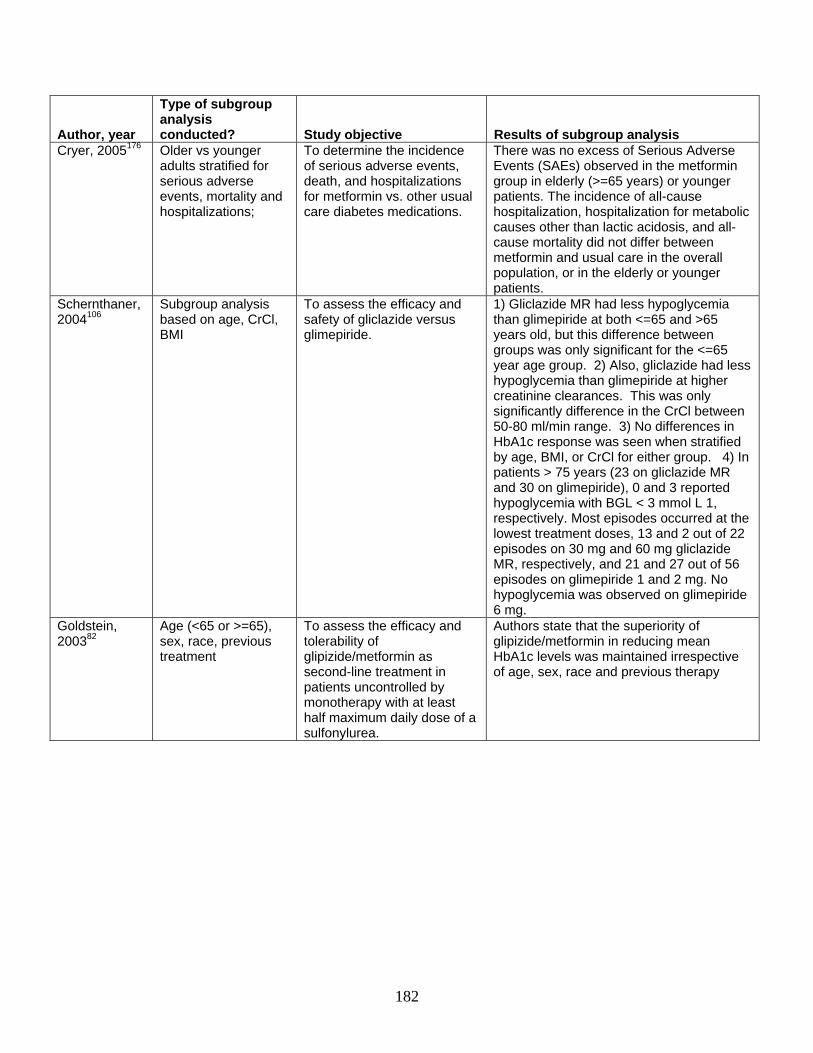
182
Author, year
Type of subgroup analysis conducted? Study objective Results of subgroup analysis
Cryer, 2005176 Older vs younger adults stratified for serious adverse events, mortality and hospitalizations;
To determine the incidence of serious adverse events, death, and hospitalizations for metformin vs. other usual care diabetes medications.
There was no excess of Serious Adverse Events (SAEs) observed in the metformin group in elderly (>=65 years) or younger patients. The incidence of all-cause hospitalization, hospitalization for metabolic causes other than lactic acidosis, and all-cause mortality did not differ between metformin and usual care in the overall population, or in the elderly or younger patients.
Schernthaner, 2004106
Subgroup analysis based on age, CrCl, BMI
To assess the efficacy and safety of gliclazide versus glimepiride.
1) Gliclazide MR had less hypoglycemia than glimepiride at both <=65 and >65 years old, but this difference between groups was only significant for the <=65 year age group. 2) Also, gliclazide had less hypoglycemia than glimepiride at higher creatinine clearances. This was only significantly difference in the CrCl between 50-80 ml/min range. 3) No differences in HbA1c response was seen when stratified by age, BMI, or CrCl for either group. 4) In patients > 75 years (23 on gliclazide MR and 30 on glimepiride), 0 and 3 reported hypoglycemia with BGL < 3 mmol L 1, respectively. Most episodes occurred at the lowest treatment doses, 13 and 2 out of 22 episodes on 30 mg and 60 mg gliclazide MR, respectively, and 21 and 27 out of 56 episodes on glimepiride 1 and 2 mg. No hypoglycemia was observed on glimepiride 6 mg.
Goldstein, 200382
Age (<65 or >=65), sex, race, previous treatment
To assess the efficacy and tolerability of glipizide/metformin as second-line treatment in patients uncontrolled by monotherapy with at least half maximum daily dose of a sulfonylurea.
Authors state that the superiority of glipizide/metformin in reducing mean HbA1c levels was maintained irrespective of age, sex, race and previous therapy
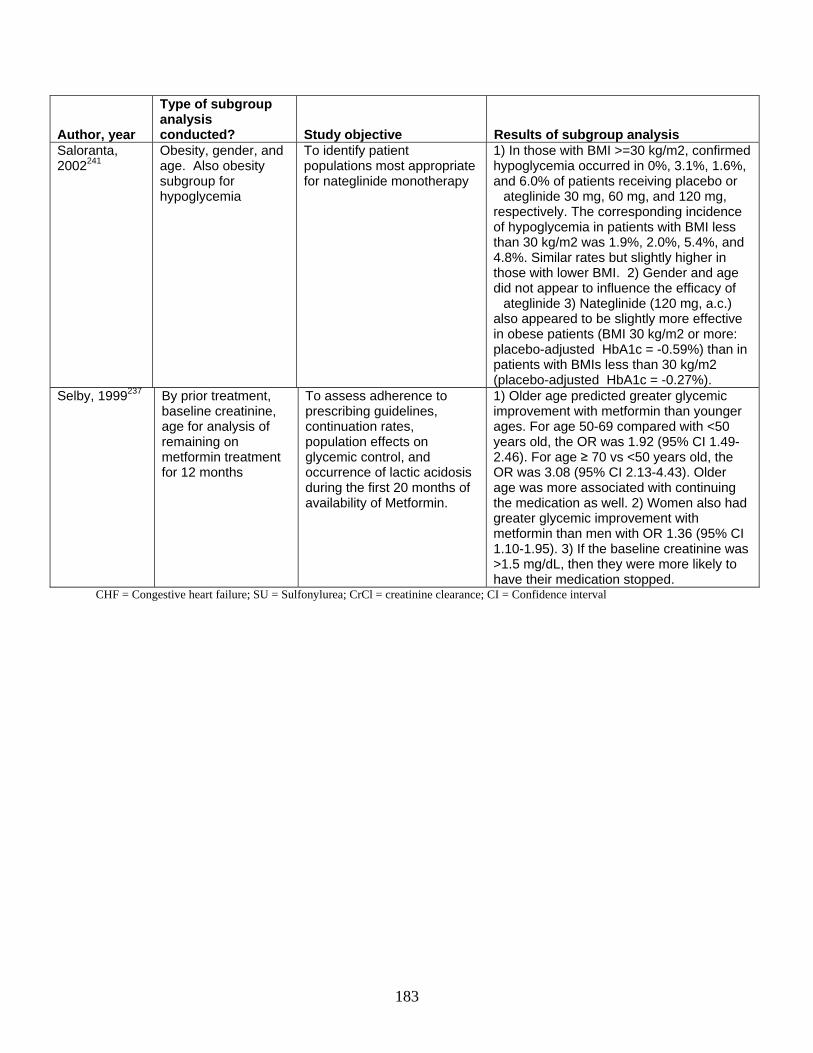
183
Author, year
Type of subgroup analysis conducted? Study objective Results of subgroup analysis
Saloranta, 2002241
Obesity, gender, and age. Also obesity subgroup for hypoglycemia
To identify patient populations most appropriate for nateglinide monotherapy
1) In those with BMI >=30 kg/m2, confirmed hypoglycemia occurred in 0%, 3.1%, 1.6%, and 6.0% of patients receiving placebo or
ateglinide 30 mg, 60 mg, and 120 mg, respectively. The corresponding incidence of hypoglycemia in patients with BMI less than 30 kg/m2 was 1.9%, 2.0%, 5.4%, and 4.8%. Similar rates but slightly higher in those with lower BMI. 2) Gender and age did not appear to influence the efficacy of
ateglinide 3) Nateglinide (120 mg, a.c.) also appeared to be slightly more effective in obese patients (BMI 30 kg/m2 or more: placebo-adjusted HbA1c = -0.59%) than in patients with BMIs less than 30 kg/m2 (placebo-adjusted HbA1c = -0.27%).
Selby, 1999237 By prior treatment, baseline creatinine, age for analysis of remaining on metformin treatment for 12 months
To assess adherence to prescribing guidelines, continuation rates, population effects on glycemic control, and occurrence of lactic acidosis during the first 20 months of availability of Metformin.
1) Older age predicted greater glycemic improvement with metformin than younger ages. For age 50-69 compared with <50 years old, the OR was 1.92 (95% CI 1.49-2.46). For age ≥ 70 vs <50 years old, the OR was 3.08 (95% CI 2.13-4.43). Older age was more associated with continuing the medication as well. 2) Women also had greater glycemic improvement with metformin than men with OR 1.36 (95% CI 1.10-1.95). 3) If the baseline creatinine was >1.5 mg/dL, then they were more likely to have their medication stopped.
CHF = Congestive heart failure; SU = Sulfonylurea; CrCl = creatinine clearance; CI = Confidence interval
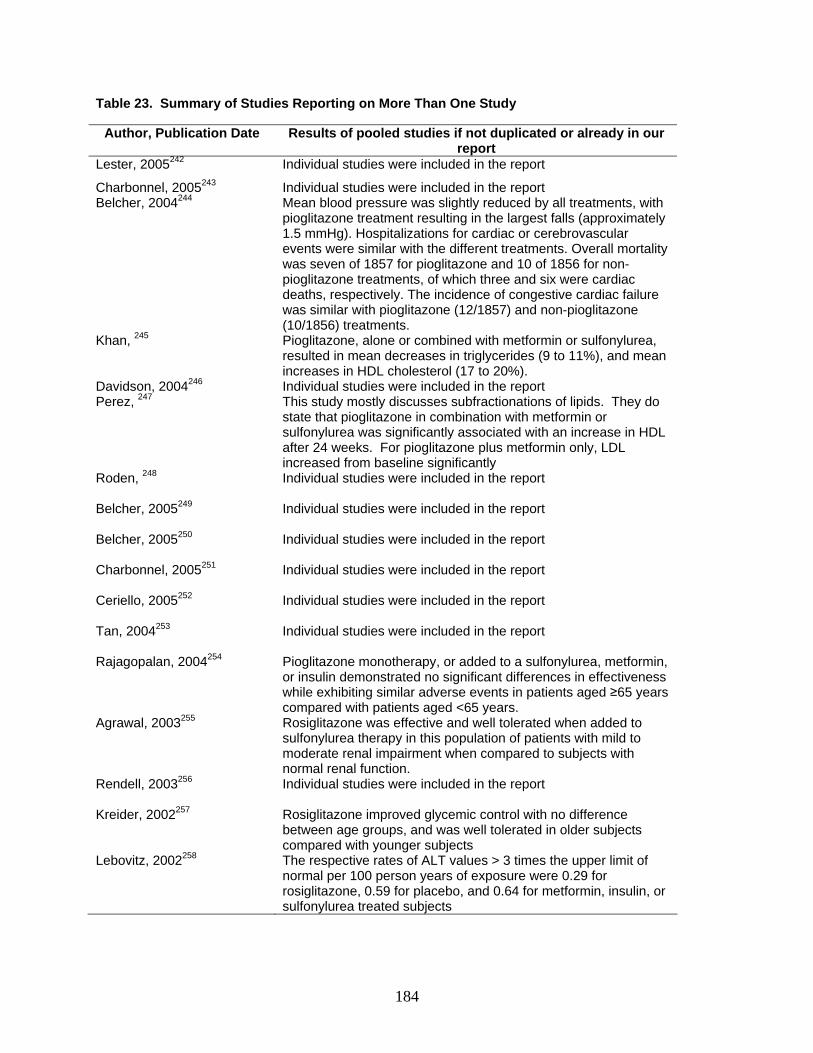
184
Table 23. Summary of Studies Reporting on More Than One Study
Author, Publication Date Results of pooled studies if not duplicated or already in our report
Lester, 2005242 Individual studies were included in the report
Charbonnel, 2005243 Individual studies were included in the report Belcher, 2004244 Mean blood pressure was slightly reduced by all treatments, with
pioglitazone treatment resulting in the largest falls (approximately 1.5 mmHg). Hospitalizations for cardiac or cerebrovascular events were similar with the different treatments. Overall mortality was seven of 1857 for pioglitazone and 10 of 1856 for non-pioglitazone treatments, of which three and six were cardiac deaths, respectively. The incidence of congestive cardiac failure was similar with pioglitazone (12/1857) and non-pioglitazone (10/1856) treatments.
Khan, 245 Pioglitazone, alone or combined with metformin or sulfonylurea, resulted in mean decreases in triglycerides (9 to 11%), and mean increases in HDL cholesterol (17 to 20%).
Davidson, 2004246 Individual studies were included in the report Perez, 247 This study mostly discusses subfractionations of lipids. They do
state that pioglitazone in combination with metformin or sulfonylurea was significantly associated with an increase in HDL after 24 weeks. For pioglitazone plus metformin only, LDL increased from baseline significantly
Roden, 248 Individual studies were included in the report
Belcher, 2005249 Individual studies were included in the report
Belcher, 2005250 Individual studies were included in the report
Charbonnel, 2005251 Individual studies were included in the report
Ceriello, 2005252 Individual studies were included in the report
Tan, 2004253 Individual studies were included in the report
Rajagopalan, 2004254 Pioglitazone monotherapy, or added to a sulfonylurea, metformin, or insulin demonstrated no significant differences in effectiveness while exhibiting similar adverse events in patients aged ≥65 years compared with patients aged <65 years.
Agrawal, 2003255 Rosiglitazone was effective and well tolerated when added to sulfonylurea therapy in this population of patients with mild to moderate renal impairment when compared to subjects with normal renal function.
Rendell, 2003256 Individual studies were included in the report
Kreider, 2002257 Rosiglitazone improved glycemic control with no difference between age groups, and was well tolerated in older subjects compared with younger subjects
Lebovitz, 2002258 The respective rates of ALT values > 3 times the upper limit of normal per 100 person years of exposure were 0.29 for rosiglitazone, 0.59 for placebo, and 0.64 for metformin, insulin, or sulfonylurea treated subjects
185
Conclusions Summary
The main conclusions for each of the Key Questions are reported in Table 24. The table includes our assessment of the strength of the body of evidence on each Key Question, broken down by the medication comparisons for which data were reported. Discussion
This report addresses the comparative effectiveness and safety of the oral diabetes medications used most frequently in the United States. As expected, short-term or proximal outcomes such as HbA1c levels were studied more frequently in RCTs than were distal outcomes such as long-term complications of diabetes. HbA1c is unequivocally linked to the risk of microvascular disease, making it a good proximal outcome measure; in addition, it may also be linked to macrovascular disease. We found that most oral diabetes medications reduced HbA1c to a similar degree, except for nateglinide and acarbose, which appeared less effective in indirect comparisons. Inzucchi and coworkers have conducted a systematic review evaluating HbA1c among the oral diabetes medications and have drawn similar conclusions.266 Our study has added to this body of work by including more recent articles, especially on the meglitinides, and by conducting meta-analyses. Also, Inzucchi et al. only included articles in which HbA1c was listed as the major endpoint, while we evaluated articles that reported HbA1c even if it was not a major endpoint of the study.266
Oral diabetes medications varied in their effects on body weight/BMI, with metformin and acarbose being the only medications associated with weight loss, as compared to other oral diabetes medications that increase weight. Our results are consistent with those of other reviews;17, 266, 267 however, no other systematic review to date has included meta-analyses of the effects on weight of as many different types of oral diabetes medications. One might argue that the weight loss seen with metformin and acarbose was only as a result of the removal of medications that increase weight in the run-in and that, in general, metformin and acarbose are associated with weight neutrality, rather than weight loss. This interpretation appears particularly reasonable because the published placebo-controlled trials have shown no weight change for acarbose and metformin. These findings suggest that any weight loss becomes significant in direct comparisons between medications only when the two medications have contrasting effects on weight.
Generally, the reported weight gain was small to moderate, even in the longer-duration RCTs such as the UKPDS (<5 kg). However, even small amounts of weight gain (5-10% of body weight) may be associated with increased morbidity because they worsen insulin resistance and lipid levels, decrease patient adherence, and can cause CHF exacerbations,268, 269-271 while weight loss improves control of diabetes.272-274 Also, different types of weight gain (central versus
186
peripheral) may have different effects on morbidity, with central adiposity being considered to be more predictive of cardiovascular outcomes.275, 276 Few studies have evaluated whether weight gain is related to increases in visceral adipose tissue, subcutaneous fat, or plasma volume; however, a few recent studies have suggested that different medications affect weight through different mechanisms. Sulfonylureas are thought to increase weight by increasing insulin release, which increases glucose uptake by cells and leads to increased storage of glucose as fat.277 In two clinical studies,277, 278 pioglitazone has been associated with an increase in total body water and subcutaneous fat and a decrease in visceral fat, most likely reflecting its effect on peroxisome proliferators-activated receptor (PPAR) gamma. A larger number of studies of more oral diabetes medications are needed to allow us to establish conclusively the existence of such differences and their potential impact on long-term outcomes.
Blood pressure control is extremely important in patients with diabetes.279-285 The UKPDS showed that for every decrease in blood pressure of 10 mmHg, there is a 15% decrease in diabetes-related deaths, with no threshold effect.283 Oral diabetes medications generally had minimal effects on blood pressure. Two systematic reviews have evaluated thiazolidinediones’ effects on blood pressure when compared with placebo and reported a slight but significant reduction in blood pressure of 2 to 4 mmHg;286 however, no one has compared the blood pressure effects of thiazolidinediones with other oral diabetes medications. Thiazolidinediones are thought to affect blood pressure through a variety of potential mechanisms, including intracellular increases in calcium, increased production of angiotensin II type I receptor in vascular smooth muscle cells, and inhibition of the production of various vascular cell types, to name only a few.287 A suggestion that blood pressure is decreased in the thiazolidinedione group when compared with second generation sulfonylureas and acarbose has been made and requires further exploration. Given the small non-significant between-group differences of 3-5 mmHg, the clinical relevance of these differences is questionable, especially since these RCTs were of short duration.
Effects on lipid levels have been found to vary across medication type, but most effects were small to moderate. For instance, pooled analyses showed between-group differences of about 5 to 10 mg/dL in LDL and 10 to 30 mg/dL in TGs, and summary data for HDL showed differences of about 3 mg/dL. Buse et al. published a systematic review on lipid levels in 2002 that reported similar results.25 Our review updates theirs; we were also able to add more detail on specific differences, since we presented meta-analyses for LDL and TGs, whereas Buse and colleagues derived their results by totaling the numbers of studies with statistically significant differences.
In our evaluation of lipids, we noted that a single medication can have favorable effects on one lipid outcome and unfavorable effects on another lipid outcome. For instance, most oral diabetes medications decreased TGs, yet only thiazolidinediones increased HDL and LDL. Elevated LDL, elevated TGs, and low HDL are associated with cardiovascular morbidity in epidemiologic studies.288 In addition, treatment of lipids (especially LDL) has also been associated with improved cardiovascular outcome.288 While lipid-lowering treatments exist, patients do not reach adequate treatment goals for lipids for a multitude of reasons.289, 290 Therefore, decisions regarding medications that may adversely affect lipids carry a higher relative importance. Few trials in our review evaluated the effects on lipid sub-fractions, an analysis that is thought by some to confer important additional information on cardiovascular risk. This topic may be an area for future research once more data have been acquired with regard to the effects of lipid sub-fractionations on cardiovascular outcomes.
187
Several caveats deserve mention regarding the proximal outcomes. First, a study’s results may have been influenced by the baseline levels obtained. For instance, lower baseline levels for particular outcomes would generally be associated with smaller between-group differences, and vice versa. We were limited in our assessment of heterogeneity based on baseline levels. Because of concerns regarding ecologic fallacy, we did not use individual level characteristics in our metaregression. However, although baseline levels might contribute to between-study variance, they would not influence the direction of the point estimates, and so would not be expected to markedly influence the results.
Second, many studies failed to report the significance of between-group differences and their measures of dispersion, thereby hindering efforts to estimate effect size across trials. We used a conservative estimate of 0.5 for the correlation between baseline and final values when calculating variance. As a result, studies with calculated variances had less weight than studies that reported variance in the publication, a difference that may have influenced our results.
Third, many trials were industry-sponsored, raising the possibility of publication bias.291 While obvious publication bias was generally not observed, these analyses had only limited power to detect publication bias because of the small numbers of studies available for many of the drug comparisons.
Fourth, the indirect comparison results must be viewed with caution, since indirect comparisons tend to overestimate effects.175 In addition, we were unable to fully assess the heterogeneity in the placebo groups. Furthermore, we indirectly compared pooled estimates of acarbose versus placebo from another systematic review with our own pooled estimates, creating further heterogeneity. However, these trial results were similar to the placebo-controlled trial results in our review. Finally, few of these RCTs, with the exception of the UKPDS, were long-term studies, making it difficult to assess potential attenuation or exacerbation of effects over time. For instance, in UKPDS, HbA1c initially was reduced in the first few years, then began to rise in both the metformin and sulfonylurea groups.15, 16
Very few published studies have compared oral diabetes medications in terms of clinically important distal outcomes, such as cardiovascular events, mortality, and microvascular outcomes. We found that metformin, sulfonylureas, and pioglitazone were the only medications associated with long-term reductions in vascular risk. Inzucchi and colleagues reported similar findings in 2003.266 However, we were able to add pioglitazone to their list, since the PROactive study had been published since their review. The UKPDS has provided the bulk of the relevant data on distal outcomes, along with several cohort studies.
Several caveats deserve mention here: First, long-term events such as renal failure or death and amputations from peripheral vascular disease were generally rare, limiting statistical power to detect differences between medications for these outcomes. Second, study end-points and populations varied greatly. For instance, some studies evaluated primary prevention of cardiovascular disease, while others evaluated secondary prevention. Cardiovascular outcomes ranged from electrocardiogram abnormalities to in-stent re-stenosis rates to nonfatal and fatal myocardial infarction or stroke. Nephropathy outcomes were reported as urinary albumin to creatinine ratios, microalbuminuria, proteinuria, change in glomerular filtration rate, and renal failure. Third, all-cause mortality was difficult to assess across studies, since many smaller shorter-duration trials failed to report mortality, even when no deaths occurred. Fourth, methods to assess and classify outcomes varied across studies: Some used vital statistics, others used claims data, and others used medical record review. Fifth, cohort studies often failed to adjust for potentially important confounders such as the duration of diabetes, HbA1c level, or blood
188
pressure level. Confounding by indication was a large concern, since many patients who have more serious disease or have a longer duration of diabetes are put on sulfonylureas or combinations of sulfonylurea and metformin. These limitations made it difficult to draw firm conclusions about differing effects of the oral diabetes medications on distal outcomes.
Finally, we evaluated the comparative safety of the oral diabetes medications. Our conclusions were consistent with other systematic reviews that have analyzed specific adverse events associated with a single oral diabetes medication.22, 292, 293 However, no previous systematic review has systematically assessed all serious adverse events of all oral diabetes medications in one report.
Minor and major hypoglycemia was more common among sulfonylureas (especially glyburide) and combinations including sulfonylureas than for other oral diabetes medications except repaglinide, which resembled the sulfonylureas. However, repaglinide may be associated with less serious hypoglycemia than the sulfonylureas, as indicated in one randomized crossover study in the elderly,199 or with less overall hypoglycemia than glyburide (0 vs 6 events) in patients who skip meals, as seen in one RCT. This last trial was not included in our review because it lasted less than 3 months.294 Few studies stratified minor or major hypoglycemia according to glycemic control, although these data would be important for subjects with serious hypoglycemia. Despite this omission, little heterogeneity was found in many of these meta-analyses.
Lactic acidosis is the adverse effect most commonly mentioned as a specific concern for patients taking metformin. Because of this concern, metformin is contraindicated in patients with impaired renal function and congestive heart failure. However, neither our review nor the systematic review by Salpeter et al.49 produced consistent evidence of an elevated risk of lactic acidosis in patients taking metformin, when compared with other oral diabetes medications. The concern with regard to lactic acidosis mainly represents a response to about 300 case reports that we did not evaluate in our review. The problem with using case report data is that it is difficult to determine cause and effect, and the effects reported may reflect underlying disease rather than medication effects. In fact, most of the reported cases have occurred in patients with severe acute conditions, such as myocardial infarction or acute renal failure, that could have caused the lactic acidosis.295, 296 We did not have enough information on subjects who were taking metformin and had chronic conditions such as chronic renal insufficiency, chronic liver disease, congestive heart failure, or severe pulmonary disease; therefore, we were unable to determine the safety of taking metformin in patients with co-morbidities that predispose subjects to lactic acidosis.
In our review of published studies, thiazolidinediones were consistently associated with an increase in the number of episodes of self-reported edema; unpublished FDA data corroborate this finding. An advisory letter was issued by GlaxoSmithKline in December 2005, reporting that macular edema had been reported post-marketing by subjects taking rosiglitazone or thiazolidinediones;297 most of these patients also had peripheral edema. We did not, however, find any reports of macular edema in our review, since most of the reported events came from case reports. This potential adverse effect will need further investigation in observational studies. Thiazolidinediones were also associated with anemia, with an average drop in hematocrit of 1-3% that is likely not clinically relevant unless the individual already has moderate to severe anemia. Thiazolidinediones are thought to cause edema and anemia by increasing the plasma volume.277 The FDA data indicated that hematocrit decreased by more than 10% in fewer than 1 in 100 subjects. However, although the anemia develops infrequently, it seems reasonable to check for anemia after starting thiazolidinediones.
189
CHF is an adverse event that is mentioned on the product label for the thiazolidinediones; the label cites two different studies: One compared pioglitazone with glyburide, and the other was a study of rosiglitazone plus insulin, showing increased CHF in the thiazolidinedione arms.298, 299 Rosiglitazone is also currently contraindicated in patients with New York Heart Association (NYHA) class III or IV CHF.299 In our review, thiazolidinediones also conferred a greater risk of congestive heart failure than did metformin or second generation sulfonylureas. We found several RCTs that reported on CHF as an adverse event, including PROactive, a one-year, large randomized, double-blind trial.185 However, many studies did not report on this adverse event, even to state that there were no events. Although a few observational studies have evaluated this outcome, they were limited by their ability to address key confounders such as HbA1c control, duration of diabetes, blood pressure level, adherence to medications, and medication dosing.
Summaries of data with regard to withdrawals due to unspecified adverse events were included in many studies, but these data have limited usefulness because the authors did not identify specific reasons for the withdrawals. Eighteen percent of trials did not report on withdrawals or losses to follow-up, and it would be important to know whether the withdrawals that were reported were due to specific adverse events. If trials reported this information consistently, comparative data would be more meaningful for this outcome.
Several caveats deserve mention with regard to adverse events. First, while almost all studies reported the incidence of hypoglycemia, they were inconsistent in terms of reporting on other adverse events. Second, the definitions of adverse events varied across studies and were often aggregated. For instance, GI events could be defined as nausea, vomiting, abdominal pain, flatulence, or a mixture of the above, making it difficult to compare across studies. Third, as expected, the incidence of adverse events was generally higher in cohort studies, which were of longer duration, than in the short-duration RCTs. The estimates from the RCTs (with the exception of the longer-duration UKPDS) are therefore likely to be lower than what one would expect in diabetic subjects over time. Also, because of potential publication bias, cohort studies may be more likely to get published if a difference between medications is shown. However, the cohort studies have generally shown between-group differences that were similar to those in the RCTs. Fourth, few RCTs evaluated certain outcomes, such as elevated liver transaminases, CHF, anemia, cancer, and allergic reactions; therefore, we relied on a small number of cohort studies for many of these outcomes. The available cohort studies, however, were limited by their ability to adjust for key confounders such as HbA1c levels, blood pressure, lab data, duration of diabetes, adherence to medications, and doses of medications. Finally, most studies occurred in patients without contraindications, such as renal or hepatic insufficiency; therefore, we cannot generalize these findings to those specific co-morbidities.
Several general limitations to this systematic review should also be kept in mind. First, we did find that the study populations were fairly similar to the general population of adults with type 2 diabetes. However, many studies excluded individuals with complications of diabetes or other co-morbidities, as well as less adherent subjects, thereby limiting the generalizability of the findings.
Second, we excluded articles comparing oral diabetes medications with insulin, since insulin was not part of this review. Therefore, we may have missed some relevant information regarding the oral diabetes medications of interest. However, these data would have been indirect comparison data and less strong than the head-to-head data we present. We also did not study the oral diabetes medications in combination with injectable diabetes medications such as insulin, amylin, or exenatide, another potential limitation to the generalizability. In the UKPDS, 22-40%

190
of subjects had insulin added to their regimen after 6 years of follow-up;93 such addition of insulin could lead to new adverse events or exacerbation of existing adverse events. Also, a systematic review already exists that evaluated insulin in combination with oral medications, as well as insulin monotherapy.300
Third, we only included articles that had more than 20 participants in each arm or a total of 40 participants or more in the study. We felt that very small studies were unlikely to influence our conclusions, given the large number of studies that were available for inclusion in this systematic review. Fourth, we only evaluated specific safety issues for which there was an a priori hypothesis of potential harm. However, we did abstract data on all serious adverse events as well as all the well-known side effects. We also evaluated FDA data, paying particular attention to safety concerns. Therefore, we do not feel we have missed any clinically relevant concerns.
In conclusion, oral diabetes medications had similar effects on glycemic control and slightly different effects on other proximal outcomes. We were unable to draw firm conclusions about the differences among oral diabetes medications in terms of their effects on distal outcomes. Safety differences did exist among the oral diabetes medications and deserve further investigation.
Future Research
This review of existing evidence identified a number of issues requiring further research. These remaining issues are grouped by key question below.
For Key Question 1 (Short-term Outcomes)
1. Future studies should examine the effects of medications on glycemic variability in more depth, using standardized methods to allow better comparison of effects across medications. Consistently reporting 2-hour PPG, as well as measuring 2-hour PPG over time pre- and post-treatment, would help with these comparisons.
2. There were few extended studies that characterized the persistence of effects on glycemic
control, weight, and lipids over time. Evaluating the durability of effects on proximal outcomes will be helpful in determining the clinical relevance of the various effects on lipids, weight, and glycemic control. Linking these effects to cardiovascular outcomes will also help clarify their clinical relevance.
3. More head-to-head monotherapy trials of rosiglitazone with metformin and sulfonylurea
monotherapy are needed to make it possible to better assess potential differences in lipid outcomes.
4. Future studies on body weight changes should attend to effects on body composition, in
order to partition effects on weight or BMI in terms of increases in fluid, subcutaneous tissue, or visceral adipose tissue, as these differing effects may have different effects on health. If possible, investigators should then link these changes with long-term outcomes,
191
such as mortality. Furthermore, since sulfonylureas and thiazolidinediones caused weight gain when used as monotherapy, future studies need to identify whether there is an additive or synergistic effect on weight if sulfonylureas are combined with thiazolidinediones.
For Key Question 2 (Long-term Outcomes)
1. More RCTs and prospective cohort studies should examine the effects of oral diabetes medications on the long-term outcomes of all-cause and cardiovascular mortality, cardiovascular disease morbidity, microvascular disease, and peripheral vascular disease.
2. We recommend continued investigation of surrogate markers of cardiovascular disease,
such as carotid intimal media thickness using ultrasound imaging, as well as further evaluation of re-stenosis rates and arrhythmias among different oral diabetes medications.
3. To determine whether oral diabetes medications differ in their effects on mortality and
cardiovascular morbidity, a long-term head-to-head RCT should be conducted to compare thiazolidinediones, metformin, sulfonylurea, and metformin plus a sulfonylurea in subjects with a history of mild macrovascular disease.
4. To improve our understanding of the effects of oral diabetes medications on peripheral
vascular disease, studies should use earlier, clinically relevant outcomes such as ankle brachial index, distance to onset of pain, stopping time during standardized walking, and symptoms of PVD as well as outcomes of amputation and death from peripheral vascular disease.
5. To improve our understanding of the effects of oral diabetes medications on nephropathy,
studies should evaluate long-term clinically relevant outcomes, such as time to dialysis as well as shorter-term outcomes such as proteinuria.
For Key Question 3 (Quality of Life)
1. More studies using standardized, validated questionnaires should be conducted to examine the effects of oral diabetes medications on health-related quality of life.
For Key Question 4&5 (Adverse Effects)
1. Studies on oral diabetes medications need to consistently report withdrawals and reasons for withdrawals in order to improve our understanding of potential differences in adverse effects.
2. Studies on oral diabetes medications need to report their definitions of adverse events
more thoroughly and consistently report on all adverse events (rather than use aggregated events).
192
3. Additional observational studies of metformin compared with other oral diabetes medications in subjects prone to lactic acidosis would help determine the safety of using this medication in co-morbid populations.
4. Further observational studies should evaluate the incidence of macular edema and of
anemia requiring transfusion or hospital admission for thiazolidinediones as compared with analogous results for other oral agents, and they should evaluate cancer and allergic reactions in all oral diabetes medications.
For Key Question 6 (Differences Across Specific Populations)
1. To determine differences based on co-morbidities or demographics, stratified analyses of outcomes would be extremely helpful. Specific areas to focus on would be the effects of medications in subjects with and without renal disease, congestive heart failure, liver disease, psychiatric diseases, and studies focusing on the elderly.
Other General Issues
1. Future observational studies could improve our understanding of the effects of oral diabetes medications on adverse events and distal outcomes if they carefully assess key confounders, such as duration of diabetes, adherence to medications, dosing of medications, HbA1c levels, and blood pressure levels.
2. Studies need to consistently report between-group changes from baseline, as well as
measures of dispersion such as standard errors. 3. For all outcomes, further head-to-head comparisons of nateglinide with other oral
diabetes medications and of repaglinide with other oral diabetes medications besides sulfonylureas are needed.
4. More studies are needed to compare one combination of medication directly with another
combination (specifically metformin, sulfonylureas, and thiazolidinediones in dual combinations as starting therapy) for all outcomes, as many clinicians have started using combinations as initial treatment in patients with diabetes.
5. Future studies comparing oral diabetes medications must consider any new oral diabetes
medications that may be placed on the market, such as the dipeptidyl peptidase IV (DPP-IV) inhibitor sitagliptin, which has just been approved by the Food and Drug Administration.
6. More easily accessible and understandable FDA data for clinicians, investigators, and the
public should be a priority, as their data were difficult to sift through, yet can be quite important.
193
7. Further research is also needed on the effects of oral diabetes medications on beta cell function over a 3-5 year period or longer, using standardized outcomes such as C-peptide and insulin levels and time to requiring insulin.
8. A systematic review on drug-drug interactions in persons with diabetes would help
clinicians with treatment decisions. 9. Studies comparing combinations of older diabetes medications, such as sulfonylureas and
metformin, with combinations of newer oral diabetes medications, such as thiazolidinediones in combination with DPP-IV inhibitors or meglitinides, would be interesting, especially given the cost associated with newer oral diabetes medications.
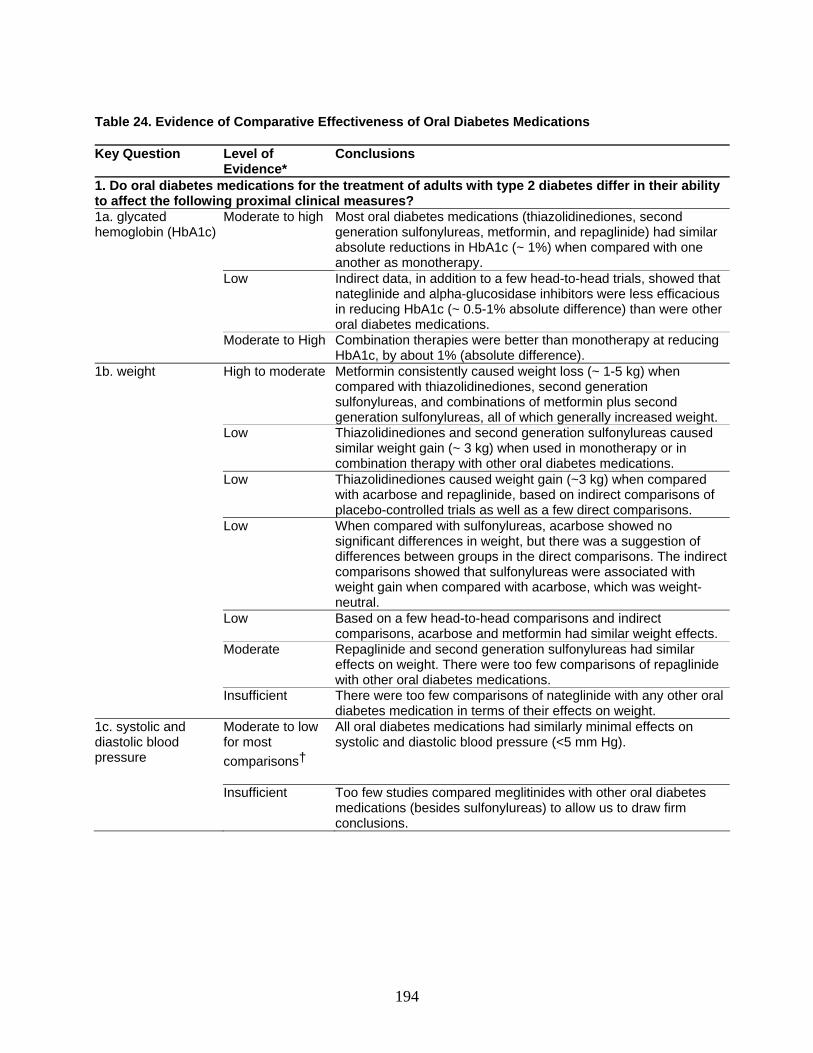
194
Table 24. Evidence of Comparative Effectiveness of Oral Diabetes Medications Key Question Level of
Evidence* Conclusions
1. Do oral diabetes medications for the treatment of adults with type 2 diabetes differ in their ability to affect the following proximal clinical measures? 1a. glycated hemoglobin (HbA1c)
Moderate to high
Most oral diabetes medications (thiazolidinediones, second generation sulfonylureas, metformin, and repaglinide) had similar absolute reductions in HbA1c (~ 1%) when compared with one another as monotherapy.
Low Indirect data, in addition to a few head-to-head trials, showed that nateglinide and alpha-glucosidase inhibitors were less efficacious in reducing HbA1c (~ 0.5-1% absolute difference) than were other oral diabetes medications.
Moderate to High Combination therapies were better than monotherapy at reducing HbA1c, by about 1% (absolute difference).
1b. weight High to moderate Metformin consistently caused weight loss (~ 1-5 kg) when compared with thiazolidinediones, second generation sulfonylureas, and combinations of metformin plus second generation sulfonylureas, all of which generally increased weight.
Low Thiazolidinediones and second generation sulfonylureas caused similar weight gain (~ 3 kg) when used in monotherapy or in combination therapy with other oral diabetes medications.
Low Thiazolidinediones caused weight gain (~3 kg) when compared with acarbose and repaglinide, based on indirect comparisons of placebo-controlled trials as well as a few direct comparisons.
Low When compared with sulfonylureas, acarbose showed no significant differences in weight, but there was a suggestion of differences between groups in the direct comparisons. The indirect comparisons showed that sulfonylureas were associated with weight gain when compared with acarbose, which was weight-neutral.
Low Based on a few head-to-head comparisons and indirect comparisons, acarbose and metformin had similar weight effects.
Moderate
Repaglinide and second generation sulfonylureas had similar effects on weight. There were too few comparisons of repaglinide with other oral diabetes medications.
Insufficient There were too few comparisons of nateglinide with any other oral diabetes medication in terms of their effects on weight.
1c. systolic and diastolic blood pressure
Moderate to low for most comparisons†
All oral diabetes medications had similarly minimal effects on systolic and diastolic blood pressure (<5 mm Hg).
Insufficient Too few studies compared meglitinides with other oral diabetes medications (besides sulfonylureas) to allow us to draw firm conclusions.
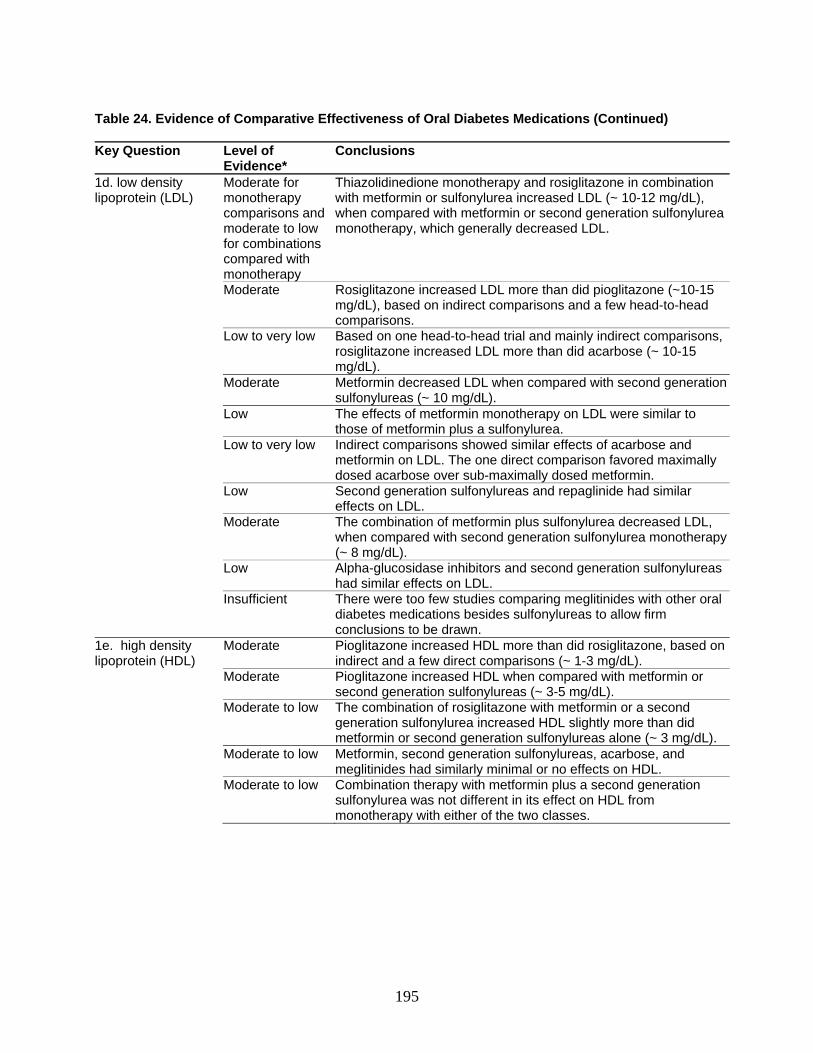
195
Table 24. Evidence of Comparative Effectiveness of Oral Diabetes Medications (Continued) Key Question Level of
Evidence* Conclusions
1d. low density lipoprotein (LDL)
Moderate for monotherapy comparisons and moderate to low for combinations compared with monotherapy
Thiazolidinedione monotherapy and rosiglitazone in combination with metformin or sulfonylurea increased LDL (~ 10-12 mg/dL), when compared with metformin or second generation sulfonylurea monotherapy, which generally decreased LDL.
Moderate Rosiglitazone increased LDL more than did pioglitazone (~10-15 mg/dL), based on indirect comparisons and a few head-to-head comparisons.
Low to very low Based on one head-to-head trial and mainly indirect comparisons, rosiglitazone increased LDL more than did acarbose (~ 10-15 mg/dL).
Moderate Metformin decreased LDL when compared with second generation sulfonylureas (~ 10 mg/dL).
Low The effects of metformin monotherapy on LDL were similar to those of metformin plus a sulfonylurea.
Low to very low Indirect comparisons showed similar effects of acarbose and metformin on LDL. The one direct comparison favored maximally dosed acarbose over sub-maximally dosed metformin.
Low Second generation sulfonylureas and repaglinide had similar effects on LDL.
Moderate The combination of metformin plus sulfonylurea decreased LDL, when compared with second generation sulfonylurea monotherapy (~ 8 mg/dL).
Low Alpha-glucosidase inhibitors and second generation sulfonylureas had similar effects on LDL.
Insufficient There were too few studies comparing meglitinides with other oral diabetes medications besides sulfonylureas to allow firm conclusions to be drawn.
1e. high density lipoprotein (HDL)
Moderate Pioglitazone increased HDL more than did rosiglitazone, based on indirect and a few direct comparisons (~ 1-3 mg/dL).
Moderate Pioglitazone increased HDL when compared with metformin or second generation sulfonylureas (~ 3-5 mg/dL).
Moderate to low The combination of rosiglitazone with metformin or a second generation sulfonylurea increased HDL slightly more than did metformin or second generation sulfonylureas alone (~ 3 mg/dL).
Moderate to low Metformin, second generation sulfonylureas, acarbose, and meglitinides had similarly minimal or no effects on HDL.
Moderate to low Combination therapy with metformin plus a second generation sulfonylurea was not different in its effect on HDL from monotherapy with either of the two classes.
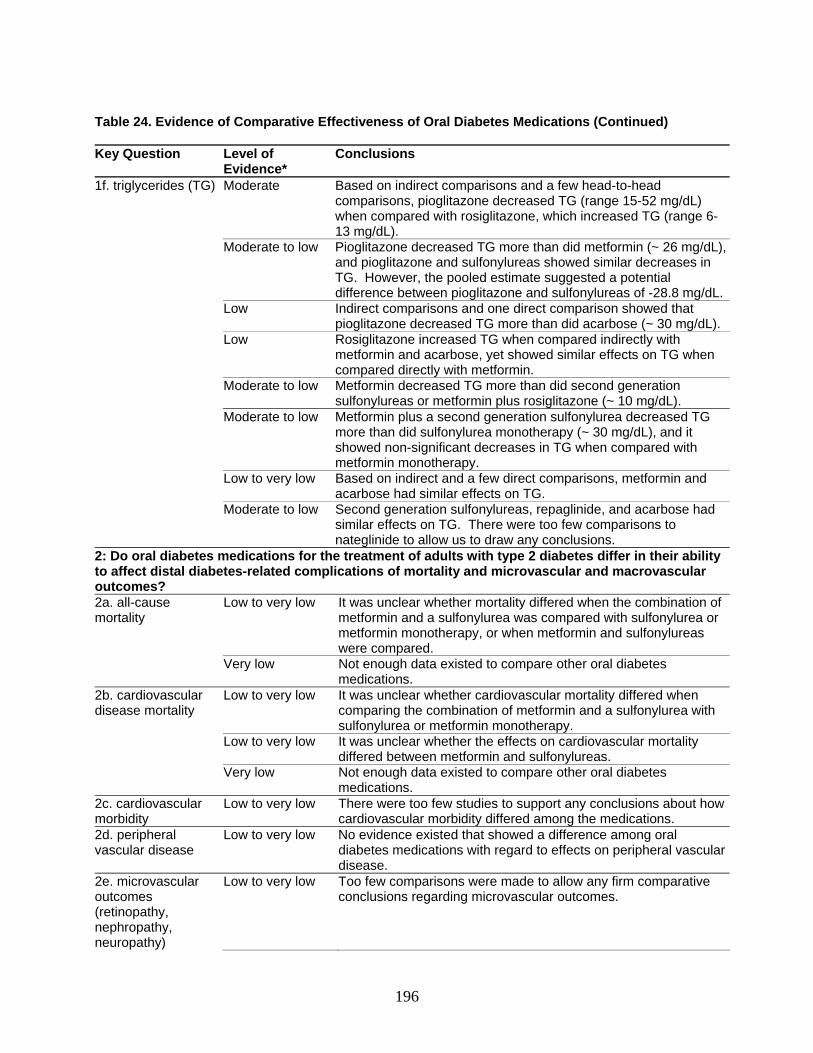
196
Table 24. Evidence of Comparative Effectiveness of Oral Diabetes Medications (Continued) Key Question Level of
Evidence* Conclusions
1f. triglycerides (TG) Moderate
Based on indirect comparisons and a few head-to-head comparisons, pioglitazone decreased TG (range 15-52 mg/dL) when compared with rosiglitazone, which increased TG (range 6-13 mg/dL).
Moderate to low Pioglitazone decreased TG more than did metformin (~ 26 mg/dL), and pioglitazone and sulfonylureas showed similar decreases in TG. However, the pooled estimate suggested a potential difference between pioglitazone and sulfonylureas of -28.8 mg/dL.
Low Indirect comparisons and one direct comparison showed that pioglitazone decreased TG more than did acarbose (~ 30 mg/dL).
Low Rosiglitazone increased TG when compared indirectly with metformin and acarbose, yet showed similar effects on TG when compared directly with metformin.
Moderate to low Metformin decreased TG more than did second generation sulfonylureas or metformin plus rosiglitazone (~ 10 mg/dL).
Moderate to low Metformin plus a second generation sulfonylurea decreased TG more than did sulfonylurea monotherapy (~ 30 mg/dL), and it showed non-significant decreases in TG when compared with metformin monotherapy.
Low to very low Based on indirect and a few direct comparisons, metformin and acarbose had similar effects on TG.
Moderate to low Second generation sulfonylureas, repaglinide, and acarbose had similar effects on TG. There were too few comparisons to nateglinide to allow us to draw any conclusions.
2: Do oral diabetes medications for the treatment of adults with type 2 diabetes differ in their ability to affect distal diabetes-related complications of mortality and microvascular and macrovascular outcomes? 2a. all-cause mortality
Low to very low It was unclear whether mortality differed when the combination of metformin and a sulfonylurea was compared with sulfonylurea or metformin monotherapy, or when metformin and sulfonylureas were compared.
Very low Not enough data existed to compare other oral diabetes medications.
2b. cardiovascular disease mortality
Low to very low It was unclear whether cardiovascular mortality differed when comparing the combination of metformin and a sulfonylurea with sulfonylurea or metformin monotherapy.
Low to very low It was unclear whether the effects on cardiovascular mortality differed between metformin and sulfonylureas.
Very low Not enough data existed to compare other oral diabetes medications.
2c. cardiovascular morbidity
Low to very low There were too few studies to support any conclusions about how cardiovascular morbidity differed among the medications.
2d. peripheral vascular disease
Low to very low No evidence existed that showed a difference among oral diabetes medications with regard to effects on peripheral vascular disease.
2e. microvascular outcomes (retinopathy, nephropathy, neuropathy)
Low to very low Too few comparisons were made to allow any firm comparative conclusions regarding microvascular outcomes.
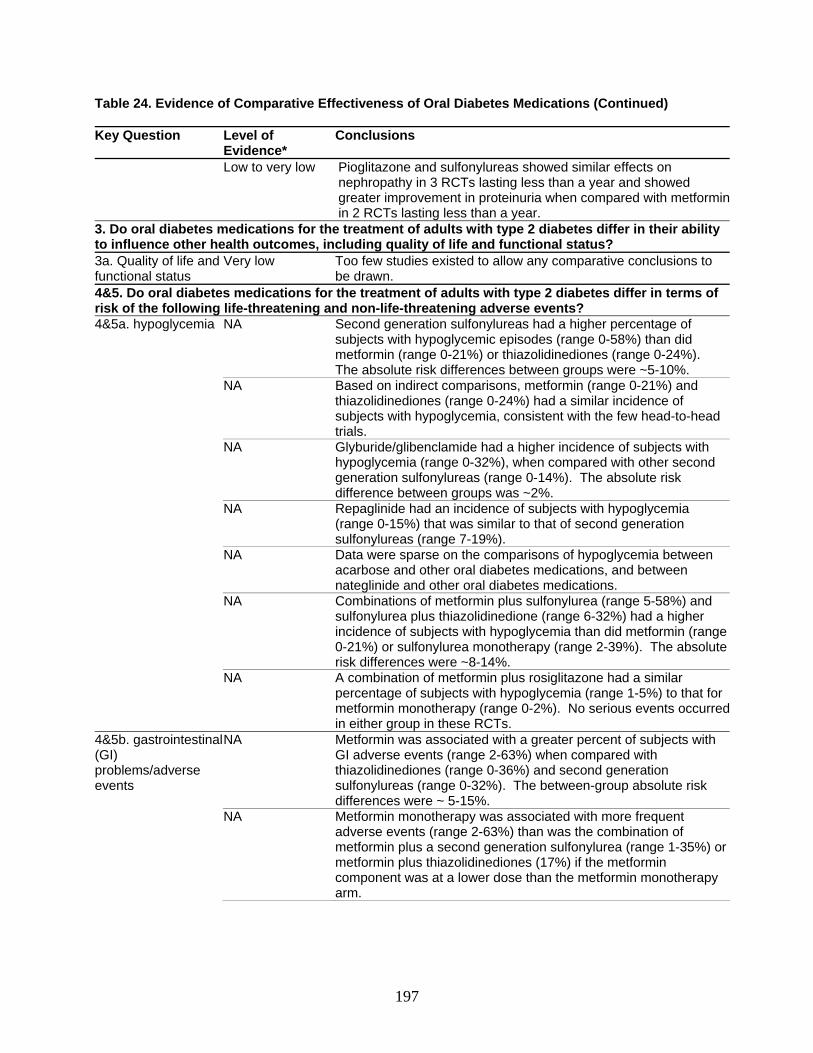
197
Table 24. Evidence of Comparative Effectiveness of Oral Diabetes Medications (Continued) Key Question Level of
Evidence* Conclusions
Low to very low Pioglitazone and sulfonylureas showed similar effects on nephropathy in 3 RCTs lasting less than a year and showed greater improvement in proteinuria when compared with metforminin 2 RCTs lasting less than a year.
3. Do oral diabetes medications for the treatment of adults with type 2 diabetes differ in their ability to influence other health outcomes, including quality of life and functional status? 3a. Quality of life and functional status
Very low Too few studies existed to allow any comparative conclusions to be drawn.
4&5. Do oral diabetes medications for the treatment of adults with type 2 diabetes differ in terms of risk of the following life-threatening and non-life-threatening adverse events? 4&5a. hypoglycemia NA Second generation sulfonylureas had a higher percentage of
subjects with hypoglycemic episodes (range 0-58%) than did metformin (range 0-21%) or thiazolidinediones (range 0-24%). The absolute risk differences between groups were ~5-10%.
NA Based on indirect comparisons, metformin (range 0-21%) and thiazolidinediones (range 0-24%) had a similar incidence of subjects with hypoglycemia, consistent with the few head-to-head trials.
NA Glyburide/glibenclamide had a higher incidence of subjects with hypoglycemia (range 0-32%), when compared with other second generation sulfonylureas (range 0-14%). The absolute risk difference between groups was ~2%.
NA Repaglinide had an incidence of subjects with hypoglycemia (range 0-15%) that was similar to that of second generation sulfonylureas (range 7-19%).
NA Data were sparse on the comparisons of hypoglycemia between acarbose and other oral diabetes medications, and between nateglinide and other oral diabetes medications.
NA Combinations of metformin plus sulfonylurea (range 5-58%) and sulfonylurea plus thiazolidinedione (range 6-32%) had a higher incidence of subjects with hypoglycemia than did metformin (range 0-21%) or sulfonylurea monotherapy (range 2-39%). The absolute risk differences were ~8-14%.
NA A combination of metformin plus rosiglitazone had a similar percentage of subjects with hypoglycemia (range 1-5%) to that for metformin monotherapy (range 0-2%). No serious events occurred in either group in these RCTs.
4&5b. gastrointestinal (GI) problems/adverse events
NA Metformin was associated with a greater percent of subjects with GI adverse events (range 2-63%) when compared with thiazolidinediones (range 0-36%) and second generation sulfonylureas (range 0-32%). The between-group absolute risk differences were ~ 5-15%.
NA Metformin monotherapy was associated with more frequent adverse events (range 2-63%) than was the combination of metformin plus a second generation sulfonylurea (range 1-35%) or metformin plus thiazolidinediones (17%) if the metformin component was at a lower dose than the metformin monotherapy arm.
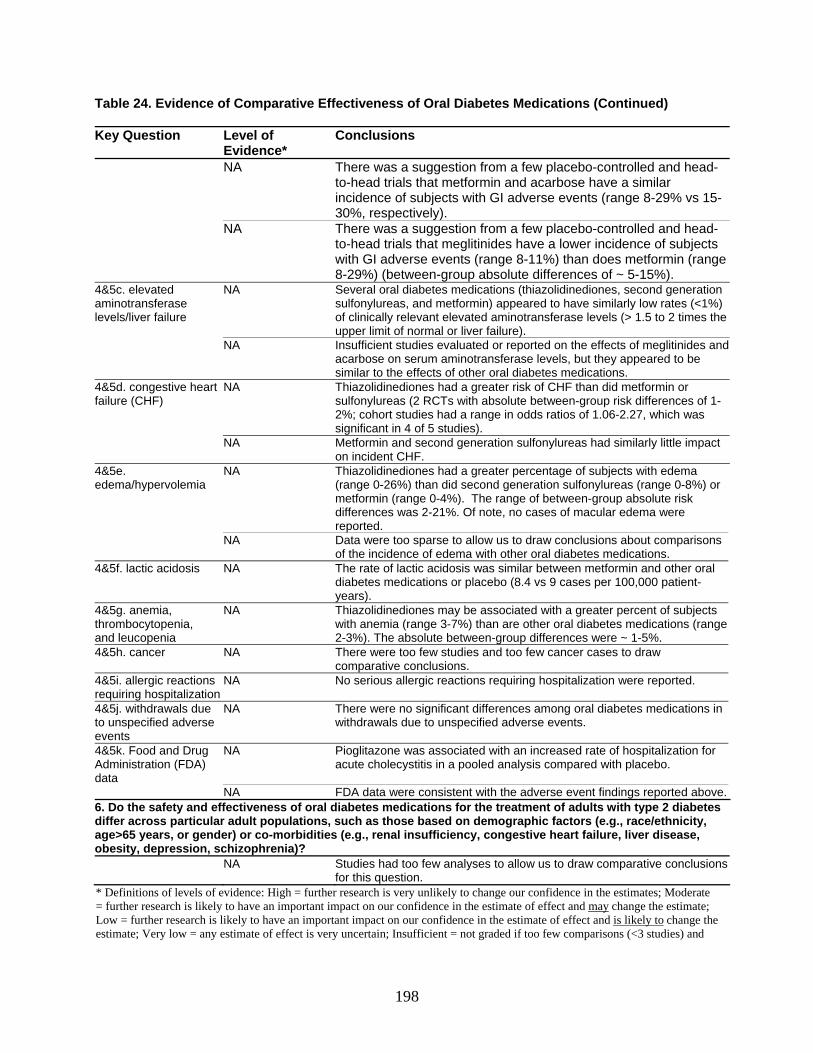
198
Table 24. Evidence of Comparative Effectiveness of Oral Diabetes Medications (Continued) Key Question Level of
Evidence* Conclusions
NA There was a suggestion from a few placebo-controlled and head-to-head trials that metformin and acarbose have a similar incidence of subjects with GI adverse events (range 8-29% vs 15-30%, respectively).
NA There was a suggestion from a few placebo-controlled and head-to-head trials that meglitinides have a lower incidence of subjects with GI adverse events (range 8-11%) than does metformin (range 8-29%) (between-group absolute differences of ~ 5-15%).
4&5c. elevated aminotransferase levels/liver failure
NA Several oral diabetes medications (thiazolidinediones, second generation sulfonylureas, and metformin) appeared to have similarly low rates (<1%) of clinically relevant elevated aminotransferase levels (> 1.5 to 2 times the upper limit of normal or liver failure).
NA Insufficient studies evaluated or reported on the effects of meglitinides and acarbose on serum aminotransferase levels, but they appeared to be similar to the effects of other oral diabetes medications.
4&5d. congestive heart failure (CHF)
NA Thiazolidinediones had a greater risk of CHF than did metformin or sulfonylureas (2 RCTs with absolute between-group risk differences of 1-2%; cohort studies had a range in odds ratios of 1.06-2.27, which was significant in 4 of 5 studies).
NA Metformin and second generation sulfonylureas had similarly little impact on incident CHF.
4&5e. edema/hypervolemia
NA Thiazolidinediones had a greater percentage of subjects with edema (range 0-26%) than did second generation sulfonylureas (range 0-8%) or metformin (range 0-4%). The range of between-group absolute risk differences was 2-21%. Of note, no cases of macular edema were reported.
NA Data were too sparse to allow us to draw conclusions about comparisons of the incidence of edema with other oral diabetes medications.
4&5f. lactic acidosis NA The rate of lactic acidosis was similar between metformin and other oral diabetes medications or placebo (8.4 vs 9 cases per 100,000 patient-years).
4&5g. anemia, thrombocytopenia, and leucopenia
NA Thiazolidinediones may be associated with a greater percent of subjects with anemia (range 3-7%) than are other oral diabetes medications (range 2-3%). The absolute between-group differences were ~ 1-5%.
4&5h. cancer NA There were too few studies and too few cancer cases to draw comparative conclusions.
4&5i. allergic reactions requiring hospitalization
NA No serious allergic reactions requiring hospitalization were reported.
4&5j. withdrawals due to unspecified adverse events
NA There were no significant differences among oral diabetes medications in withdrawals due to unspecified adverse events.
4&5k. Food and Drug Administration (FDA) data
NA Pioglitazone was associated with an increased rate of hospitalization for acute cholecystitis in a pooled analysis compared with placebo.
NA FDA data were consistent with the adverse event findings reported above.6. Do the safety and effectiveness of oral diabetes medications for the treatment of adults with type 2 diabetes differ across particular adult populations, such as those based on demographic factors (e.g., race/ethnicity, age>65 years, or gender) or co-morbidities (e.g., renal insufficiency, congestive heart failure, liver disease, obesity, depression, schizophrenia)? NA Studies had too few analyses to allow us to draw comparative conclusions
for this question. * Definitions of levels of evidence: High = further research is very unlikely to change our confidence in the estimates; Moderate = further research is likely to have an important impact on our confidence in the estimate of effect and may change the estimate; Low = further research is likely to have an important impact on our confidence in the estimate of effect and is likely to change the estimate; Very low = any estimate of effect is very uncertain; Insufficient = not graded if too few comparisons (<3 studies) and

199
not a key comparison of interest; NA=not applicable since there was no validated grading system to determine level of evidence for adverse events. † The evidence was graded very low for the following comparisons related to blood pressure effects: metformin versus metformin plus sulfonylurea, sulfonylurea versus sulfonylurea plus thiazolidinedione, meglitinides versus sulfonylureas, and alpha-glucosidase inhibitors versus all other oral diabetes medications. TG = triglycerides; FDA = Food and Drug Administration; CHF = congestive heart failure; GI = gastrointestinal; LDL = low density lipoprotein; HDL = high density lipoprotein; HbA1c = hemoglobin A1c; RCT = randomized controlled trial.

201
References
1. Harris MI, Flegal KM, Cowie CC et al. Prevalence of diabetes, impaired fasting glucose, and impaired glucose tolerance in U.S. adults. The Third National Health and Nutrition Examination Survey, 1988-1994. Diabetes Care 1998; 21(4):518-24.
2. Mokdad AH, Ford ES, Bowman BA et al. Diabetes trends in the U.S.: 1990-1998. Diabetes Care 2000; 23(9):1278-83.
3. National Center for Chronic Disease Prevention and Health Promotion . National Diabetes Fact Sheet. [Web Page]. (Accessed 6 July 1906).
4. National Center for Chronic Disease Prevention and Health Promotion. Data & Trends: National Diabetes Surveillance System. [Web Page]. 1998; (Accessed 6 July 1906).
5. Schellhase KG, Koepsell TD, Weiss NS. Glycemic control and the risk of multiple microvascular diabetic complications. Fam Med 2005; 37(2):125-30.
6. Vijan S, Hofer TP, Hayward RA. Estimated benefits of glycemic control in microvascular complications in type 2 diabetes. Ann Intern Med 1997; 127(9):788-95.
7. Intensive blood-glucose control with sulphonylureas or insulin compared with conventional treatment and risk of complications in patients with type 2 diabetes (UKPDS 33). UK Prospective Diabetes Study (UKPDS) Group. Lancet 1998; 352(9131):837-53.
8. The relationship of glycemic exposure (HbA1c) to the risk of development and progression of retinopathy in the diabetes control and complications trial. Diabetes 1995; 44(8):968-83.
9. Selvin E, Marinopoulos S, Berkenblit G et al. Meta-analysis: glycosylated hemoglobin and cardiovascular disease in diabetes mellitus. Ann Intern Med 2004; 141(6):421-31.
10. Garratt KN, Brady PA, Hassinger NL, Grill DE, Terzic A, Holmes DR Jr. Sulfonylurea drugs increase early mortality in patients with diabetes mellitus after direct angioplasty for acute myocardial infarction. J Am Coll Cardiol 1999; 33(1):119-24.
11. Lomuscio A, Fiorentini C. Influence of oral antidiabetic treatment on electrocardiac
alterations induced by myocardial infarction. Diabetes Res Clin Pract 1996; 31 Suppl:S21-6.
12. Johnson JA, Majumdar SR, Simpson SH, Toth EL. Decreased mortality associated with the use of metformin compared with sulfonylurea monotherapy in type 2 diabetes. Diabetes Care 2002; 25(12):2244-8.
13. Johnson JA, Simpson SH, Toth EL, Majumdar SR. Reduced cardiovascular morbidity and mortality associated with metformin use in subjects with Type 2 diabetes. Diabet Med 2005; 22(4):497-502.
14. Simpson SH, Majumdar SR, Tsuyuki RT, Eurich DT, Johnson JA. Dose-response relation between sulfonylurea drugs and mortality in type 2 diabetes mellitus: a population-based cohort study. CMAJ 2006; 174(2):169-74.
15. Effect of intensive blood-glucose control with metformin on complications in overweight patients with type 2 diabetes (UKPDS 34). UK Prospective Diabetes Study (UKPDS) Group. Lancet 1998; 352(9131):854-65.
16. Intensive blood-glucose control with sulphonylureas or insulin compared with conventional treatment and risk of complications in patients with type 2 diabetes (UKPDS 33). UK Prospective Diabetes Study (UKPDS) Group. Lancet 1998; 352(9131):837-53.
17. Saenz A, Fernandez-Esteban I, Mataix A, Ausejo M, Roque M, Moher D. Metformin monotherapy for type 2 diabetes mellitus. Cochrane Database Syst Rev 2005; (3):CD002966.
18. Chilcott J, Tappenden P, Jones ML, Wight JP. A systematic review of the clinical effectiveness of pioglitazone in the treatment of type 2 diabetes mellitus. Clin Ther 2001; 23(11):1792-823; discussion 1791.
19. Chandler, C, Chou, R, Helfand, M. Drug Class Review on Oral Hypoglycemics [Web Page]. May 2005; Available at http://www.ohsu.edu/drugeffectiveness/reports/documents/OH%20Final%20Report%20Update%2021.pdf. (Accessed 10 January 2006).
20. Chiquette E, Ramirez G, Defronzo R. A meta-analysis comparing the effect of thiazolidinediones on cardiovascular risk factors. Arch Intern Med 2004; 164(19):2097-104.
202
21. van de Laar FA, Lucassen PL, Akkermans RP, van de Lisdonk EH, Rutten GE, van Weel C. Alpha-glucosidase inhibitors for patients with type 2 diabetes: results from a Cochrane systematic review and meta-analysis. Diabetes Care 2005; 28(1):154-63.
22. Wulffele MG, Kooy A, de Zeeuw D, Stehouwer CD, Gansevoort RT. The effect of metformin on blood pressure, plasma cholesterol and triglycerides in type 2 diabetes mellitus: a systematic review. J Intern Med 2004; 256(1):1-14.
23. van Wijk JP, de Koning EJ, Martens EP, Rabelink TJ. Thiazolidinediones and blood lipids in type 2 diabetes. Arterioscler Thromb Vasc Biol 2003; 23(10):1744-9.
24. Inzucchi SE. Oral antihyperglycemic therapy for type 2 diabetes: scientific review. JAMA 2002; 287(3):360-72.
25. Buse JB, Tan MH, Prince MJ, Erickson PP. The effects of oral anti-hyperglycaemic medications on serum lipid profiles in patients with type 2 diabetes. Diabetes Obes Metab 2004; 6(2):133-56.
26. Bristol-Myers Squibb Company. Patient Information: Glucophage and Glucophage XR [Web Page]. 22 October 2006;
27. Tight blood pressure control and risk of macrovascular and microvascular complications in type 2 diabetes: UKPDS 38. UK Prospective Diabetes Study Group. BMJ 1998; 317(7160):703-13.
28. KANNEL WB, DAWBER TR, FRIEDMAN GD, GLENNON WE, MCNAMARA PM. RISK FACTORS IN CORONARY HEART DISEASE. AN EVALUATION OF SEVERAL SERUM LIPIDS AS PREDICTORS OF CORONARY HEART DISEASE; THE FRAMINGHAM STUDY. Ann Intern Med 1964; 61:888-99.
29. Clinical Practice Recommendations 2005. Diabetes Care 2005; 28 Suppl 1:S1-79.
30. Manley S. Haemoglobin A1c--a marker for complications of type 2 diabetes: the experience from the UK Prospective Diabetes Study (UKPDS). Clin Chem Lab Med 2003; 41(9):1182-90.
31. The American Association of Clinical Endocrinologists Medical Guidelines for the Management of Diabetes Mellitus: the AACE system of intensive diabetes self-management--2000 update. Endocr Pract 2000; 6(1):43-84.
32. Ceriello A, Davidson J, Hanefeld M et al. Postprandial hyperglycaemia and cardiovascular complications of diabetes: an update. Nutr Metab Cardiovasc Dis 2006; 16(7):453-6.
33. Kasper DL, Braunwald E, Fauci AS, et al, Eds. Harrison’s Principles of Internal Medicine, 16th Edition. New York: McGraw-Hill, Medical Pub. Division; 2005.
34. Schroeder K, Fahey T, Ebrahim S. How can we improve adherence to blood pressure-lowering medication in ambulatory care? Systematic review of randomized controlled trials. Arch Intern Med 2004; 164(7):722-32.
35. Available at: UpToDate. http://www.uptodate.com. (Accessed September 2006).
36. Available at: drugstore.com Online pharmacy. (Accessed September 2006).
37. Berlin JA. Does blinding of readers affect the results of meta-analyses? University of Pennsylvania Meta-analysis Blinding Study Group. Lancet 1997; 350(9072):185-6.
38. Van de Laar FA, Lucassen PL, Akkermans RP, Van de Lisdonk EH, Rutten GE, Van Weel C. Alpha-glucosidase inhibitors for type 2 diabetes mellitus. Cochrane Database Syst Rev 2005; (2):CD003639.
39. Kimmel B, Inzucchi SE. Oral agents for type 2 diabetes: An update. Clin. Diabetes 2005; 23(2):64-76.
40. Jadad AR, Moore RA, Carroll D et al. Assessing the quality of reports of randomized clinical trials: is blinding necessary? Control Clin Trials 1996; 17(1):1-12.
41. Moher D, Cook DJ, Eastwood S, Olkin I, Rennie D, Stroup DF. Improving the quality of reports of meta-analyses of randomised controlled trials: the QUOROM statement. Quality of Reporting of Meta-analyses. Lancet 1999; 354(9193):1896-900.
42. Deeks JJ, Dinnes J, D'Amico R et al. Evaluating non-randomised intervention studies. Health Technol Assess 2003; 7(27):iii-x, 1-173.
43. DerSimonian R, Laird N. Meta-analysis in clinical trials. Control Clin Trials 1986; 7(3):177-88.
44. Higgins JP, Thompson SG, Deeks JJ, Altman DG. Measuring inconsistency in meta-analyses.
203
BMJ 2003; 327(7414):557-60.
45. Song F, Altman DG, Glenny AM, Deeks JJ. Validity of indirect comparison for estimating efficacy of competing interventions: empirical evidence from published meta-analyses. BMJ 2003; 326(7387):472.
46. Begg CB, Mazumdar M. Operating characteristics of a rank correlation test for publication bias. Biometrics 1994; 50(4):1088-101.
47. Egger M, Davey Smith G, Schneider M, Minder C. Bias in meta-analysis detected by a simple, graphical test. BMJ 1997; 315(7109):629-34.
48. Atkins D, Best D, Briss PA et al. Grading quality of evidence and strength of recommendations. BMJ 2004; 328(7454):1490.
49. Salpeter S, Greyber E, Pasternak G, Salpeter E. Risk of fatal and nonfatal lactic acidosis with metformin use in type 2 diabetes mellitus. Cochrane Database Syst Rev 2003; (2):CD002967.
50. Saydah SH, Eberhardt MS, Loria CM, Brancati FL. Age and the burden of death attributable to diabetes in the United States. Am J Epidemiol 2002; 156(8):714-9.
51. Khan MA, St Pete JV, Xue JL. A prospective, randomized comparison of the metabolic effects of pioglitazone or rosiglitazone in patients with type 2 diabetes who were previously treated with troglitazone. Diabetes Care 2002; 25(4):708-11.
52. Goldberg RB, Kendall DM, Deeg MA et al. A comparison of lipid and glycemic effects of pioglitazone and rosiglitazone in patients with type 2 diabetes and dyslipidemia. Diabetes Care 2005; 28(7):1547-54.
53. Derosa G, Cicero AF, Gaddi A et al. A comparison of the effects of pioglitazone and rosiglitazone combined with glimepiride on prothrombotic state in type 2 diabetic patients with the metabolic syndrome. Diabetes Res Clin Pract 2005; 69(1):5-13.
54. Lawrence JM, Reid J, Taylor GJ, Stirling C, Reckless JP. Favorable effects of pioglitazone and metformin compared with gliclazide on lipoprotein subfractions in overweight patients with early type 2 diabetes. Diabetes Care 2004; 27(1):41-6.
55. Ramachandran A, Snehalatha C, Salini J, Vijay V. Use of glimepiride and insulin sensitizers in
the treatment of type 2 diabetes--a study in Indians. J Assoc Physicians India 2004; 52:459-63.
56. Schernthaner G, Matthews DR, Charbonnel B, Hanefeld M, Brunetti P. Efficacy and safety of pioglitazone versus metformin in patients with type 2 diabetes mellitus: a double-blind, randomized trial. J Clin Endocrinol Metab 2004; 89(12):6068-76.
57. Yamanouchi T, Sakai T, Igarashi K, Ichiyanagi K, Watanabe H, Kawasaki T. Comparison of metabolic effects of pioglitazone, metformin, and glimepiride over 1 year in Japanese patients with newly diagnosed Type 2 diabetes. Diabet Med 2005; 22(8):980-5.
58. Hallsten K, Virtanen KA, Lonnqvist F et al. Rosiglitazone but not metformin enhances insulin- and exercise-stimulated skeletal muscle glucose uptake in patients with newly diagnosed type 2 diabetes. Diabetes 2002; 51(12):3479-85.
59. Pavo I, Jermendy G, Varkonyi TT et al. Effect of pioglitazone compared with metformin on glycemic control and indicators of insulin sensitivity in recently diagnosed patients with type 2 diabetes. J Clin Endocrinol Metab 2003; 88(4):1637-45.
60. Hanefeld M, Brunetti P, Schernthaner GH, Matthews DR, Charbonnel BH. One-year glycemic control with a sulfonylurea plus pioglitazone versus a sulfonylurea plus metformin in patients with type 2 diabetes. Diabetes Care 2004; 27(1):141-7.
61. Tan MH, Baksi A, Krahulec B et al. Comparison of pioglitazone and gliclazide in sustaining glycemic control over 2 years in patients with type 2 diabetes. Diabetes Care 2005; 28(3):544-50.
62. Yanagawa T, Araki A, Sasamoto K, Shirabe S, Yamanouchi T. Effect of antidiabetic medications on microalbuminuria in patients with type 2 diabetes. Metabolism 2004; 53(3):353-7.
63. Charbonnel BH, Matthews DR, Schernthaner G, Hanefeld M, Brunetti P. A long-term comparison of pioglitazone and gliclazide in patients with Type 2 diabetes mellitus: a randomized, double-blind, parallel-group comparison trial. Diabet Med 2005; 22(4):399-405.
64. Nakamura T, Ushiyama C, Shimada N, Hayashi K, Ebihara I, Koide H. Comparative effects of pioglitazone, glibenclamide, and voglibose on urinary endothelin-1 and albumin excretion in
204
diabetes patients. J Diabetes Complications 2000; 14(5):250-4.
65. Tan MH, Johns D, Strand J et al. Sustained effects of pioglitazone vs. glibenclamide on insulin sensitivity, glycaemic control, and lipid profiles in patients with Type 2 diabetes. Diabet Med 2004; 21(8):859-66.
66. Bakris G, Viberti G, Weston WM, Heise M, Porter LE, Freed MI. Rosiglitazone reduces urinary albumin excretion in type II diabetes. J Hum Hypertens 2003; 17(1):7-12.
67. St John Sutto M, Rendell M, Dandona P et al. A comparison of the effects of rosiglitazone and glyburide on cardiovascular function and glycemic control in patients with type 2 diabetes. Diabetes Care 2002; 25(11):2058-64.
68. Pfutzner A, Marx N, Lubben G et al. Improvement of cardiovascular risk markers by pioglitazone is independent from glycemic control: results from the pioneer study. J Am Coll Cardiol 2005; 45(12):1925-31.
69. Tan M, Johns D, Gonzalez Galvez G et al. Effects of pioglitazone and glimepiride on glycemic control and insulin sensitivity in Mexican patients with type 2 diabetes mellitus: A multicenter, randomized, double-blind, parallel-group trial. Clin Ther 2004; 26(5):680-93.
70. Matthews DR, Charbonnel BH, Hanefeld M, Brunetti P, Schernthaner G. Long-term therapy with addition of pioglitazone to metformin compared with the addition of gliclazide to metformin in patients with type 2 diabetes: a randomized, comparative study. Diabetes Metab Res Rev 2005; 21(2):167-74.
71. Garber A, Klein E, Bruce S, Sankoh S, Mohideen P. Metformin-glibenclamide versus metformin plus rosiglitazone in patients with type 2 diabetes inadequately controlled on metformin monotherapy. Diabetes Obes Metab 2006; 8(2):156-63.
72. Derosa G, Gaddi AV, Ciccarelli L et al. Long-term effect of glimepiride and rosiglitazone on non-conventional cardiovascular risk factors in metformin-treated patients affected by metabolic syndrome: a randomized, double-blind clinical trial. J Int Med Res 2005; 33(3):284-94.
73. Jovanovic L, Hassman DR, Gooch B et al. Treatment of type 2 diabetes with a combination regimen of repaglinide plus pioglitazone. Diabetes Res Clin Pract 2004; 63(2):127-34.
74. Raskin P, McGill J, Saad MF et al. Combination
therapy for type 2 diabetes: repaglinide plus rosiglitazone. Diabet Med 2004; 21(4):329-35.
75. Goke B. Improved glycemic control and lipid profile in a randomized study of pioglitazone compared with acarbose in patients with type 2 diabetes mellitus. Treat Endocrinol 2002; 1(5):329-36.
76. McCluskey D, Touger MS, Melis R, Schleusener DS, McCluskey D. Results of a randomized, double-blind, placebo-controlled study administering glimepiride to patients with type 2 diabetes mellitus inadequately controlled with rosiglitazone monotherapy. Clin Ther 2004; 26(11):1783-90.
77. Choi D, Kim SK, Choi SH et al. Preventative effects of rosiglitazone on restenosis after coronary stent implantation in patients with type 2 diabetes. Diabetes Care 2004; 27(11):2654-60.
78. Takagi T, Yamamuro A, Tamita K et al. Pioglitazone reduces neointimal tissue proliferation after coronary stent implantation in patients with type 2 diabetes mellitus: an intravascular ultrasound scanning study. Am Heart J 2003; 146(2):E5.
79. Garber AJ, Larsen J, Schneider SH, Piper BA, Henry D. Simultaneous glyburide/metformin therapy is superior to component monotherapy as an initial pharmacological treatment for type 2 diabetes. Diabetes Obes Metab 2002; 4(3):201-8.
80. Garber AJ, Donovan DS Jr, Dandona P, Bruce S, Park JS. Efficacy of glyburide/metformin tablets compared with initial monotherapy in type 2 diabetes. J Clin Endocrinol Metab 2003; 88(8):3598-604.
81. Blonde L, Rosenstock J, Mooradian AD, Piper BA, Henry D. Glyburide/metformin combination product is safe and efficacious in patients with type 2 diabetes failing sulphonylurea therapy. Diabetes Obes Metab 2002; 4(6):368-75.
82. Goldstein BJ, Pans M, Rubin CJ. Multicenter, randomized, double-masked, parallel-group assessment of simultaneous glipizide/metformin as second-line pharmacologic treatment for patients with type 2 diabetes mellitus that is inadequately controlled by a sulfonylurea. Clin Ther 2003; 25(3):890-903.
83. Campbell IW, Menzies DG, Chalmers J, McBain AM, Brown IR. One year comparative trial of metformin and glipizide in type 2 diabetes mellitus. Diabete Metab 1994; 20(4):394-400.
84. Marre M, Howlett H, Lehert P, Allavoine T.
205
Improved glycaemic control with metformin-glibenclamide combined tablet therapy (Glucovance) in Type 2 diabetic patients inadequately controlled on metformin. Diabet Med 2002; 19(8):673-80.
85. Amador-Licona N, Guizar-Mendoza J, Vargas E, Sanchez-Camargo G, Zamora-Mata L. The short-term effect of a switch from glibenclamide to metformin on blood pressure and microalbuminuria in patients with type 2 diabetes mellitus. Arch Med Res 2000; 31(6):571-5.
86. Noury J, Nandeuil A. Comparative three-month study of the efficacies of metformin and gliclazide in the treatment of NIDD. Diabete Metab 1991; 17(1 Pt 2):209-12.
87. Hermann LS, Schersten B, Bitzen PO, Kjellstrom T, Lindgarde F, Melander A. Therapeutic comparison of metformin and sulfonylurea, alone and in various combinations. A double-blind controlled study. Diabetes Care 1994; 17(10):1100-9.
88. DeFronzo RA, Goodman AM. Efficacy of metformin in patients with non-insulin-dependent diabetes mellitus. The Multicenter Metformin Study Group. N Engl J Med 1995; 333(9):541-9.
89. Charpentier G, Fleury F, Kabir M, Vaur L, Halimi S. Improved glycaemic control by addition of glimepiride to metformin monotherapy in type 2 diabetic patients. Diabet Med 2001; 18(10):828-34.
90. Derosa G, Franzetti I, Gadaleta G, Ciccarelli L, Fogari R. Metabolic variations with oral antidiabetic drugs in patients with Type 2 diabetes: comparison between glimepiride and metformin. Diabetes Nutr Metab 2004; 17(3):143-50.
91. U.K. prospective diabetes study. II. Reduction in HbA1c with basal insulin supplement, sulfonylurea, or biguanide therapy in maturity-onset diabetes. A multicenter study. Diabetes 1985; 34(8):793-8.
92. United Kingdom Prospective Diabetes Study (UKPDS). 13: Relative efficacy of randomly allocated diet, sulphonylurea, insulin, or metformin in patients with newly diagnosed non-insulin dependent diabetes followed for three years. BMJ 1995; 310(6972):83-8.
93. Turner R, Murchison L, Wright AD et al. United Kingdom prospective diabetes study 24: A 6-year, randomized, controlled trial comparing sulfonylurea, insulin, and metformin therapy in
patients with newly diagnosed type 2 diabetes that could not be controlled with diet therapy. Ann. Intern. Med. 1998; 128(3):165-75.
94. Hermann LS, Bitzen PO, Kjellstrom T, Lindgarde F, Schersten B. Comparative efficacy of metformin and glibenclamide in patients with non-insulin-dependent diabetes mellitus. Diabete Metab 1991; 17(1 Pt 2):201-8.
95. Tosi F, Muggeo M, Brun E et al. Combination treatment with metformin and glibenclamide versus single-drug therapies in type 2 diabetes mellitus: a randomized, double-blind, comparative study. Metabolism 2003; 52(7):862-7.
96. Horton ES, Clinkingbeard C, Gatlin M, Foley J, Mallows S, Shen S. Nateglinide alone and in combination with metformin improves glycemic control by reducing mealtime glucose levels in type 2 diabetes. Diabetes Care 2000; 23(11):1660-5.
97. Derosa G, Mugellini A, Ciccarelli L, Crescenzi G, Fogari R. Comparison of glycaemic control and cardiovascular risk profile in patients with type 2 diabetes during treatment with either repaglinide or metformin. Diabetes Res Clin Pract 2003; 60(3):161-9.
98. Wolever TMS, Assiff L, Basu T et al. Miglitol, an (alpha)-glucosidase inhibitor, prevents the metformin-induced fall in serum folate and vitamin B12 in subjects with type 2 diabetes. Nutr. Res. 2000; 20(10):1447-56.
99. Willms B, Ruge D. Comparison of acarbose and metformin in patients with Type 2 diabetes mellitus insufficiently controlled with diet and sulphonylureas: a randomized, placebo-controlled study. Diabet Med 1999; 16(9):755-61.
100. Weissman P, Goldstein BJ, Rosenstock J et al. Effects of rosiglitazone added to submaximal doses of metformin compared with dose escalation of metformin in type 2 diabetes: the EMPIRE Study. Curr Med Res Opin 2005; 21(12):2029-35.
101. Bailey CJ, Bagdonas A, Rubes J et al. Rosiglitazone/metformin fixed-dose combination compared with uptitrated metformin alone in type 2 diabetes mellitus: a 24-week, multicenter, randomized, double-blind, parallel-group study. Clin Ther 2005; 27(10):1548-61.
102. Gomez-Perez FJ, Fanghanel-Salmon G, Antonio Barbosa J et al. Efficacy and safety of rosiglitazone plus metformin in Mexicans with
206
type 2 diabetes. Diabetes Metab Res Rev 2002; 18(2):127-34.
103. Fonseca V, Rosenstock J, Patwardhan R, Salzman A. Effect of metformin and rosiglitazone combination therapy in patients with type 2 diabetes mellitus: a randomized controlled trial. JAMA 2000; 283(13):1695-702.
104. Feinglos M, Dailey G, Cefalu W et al. Effect on glycemic control of the addition of 2.5 mg glipizide GITS to metformin in patients with T2DM. Diabetes Res Clin Pract 2005; 68(2):167-75.
105. Fujioka K, Pans M, Joyal S. Glycemic control in patients with type 2 diabetes mellitus switched from twice-daily immediate-release metformin to a once-daily extended-release formulation. Clin Ther 2003; 25(2):515-29.
106. Schernthaner G, Grimaldi A, Di Mario U et al. GUIDE study: double-blind comparison of once-daily gliclazide MR and glimepiride in type 2 diabetic patients. Eur J Clin Invest 2004; 34(8):535-42.
107. Dills DG, Schneider J. Clinical evaluation of glimepiride versus glyburide in NIDDM in a double-blind comparative study. Glimepiride/Glyburide Research Group. Horm Metab Res 1996; 28(9):426-9.
108. Carlson RF, Isley WL, Ogrinc FG, Klobucar TR. Efficacy and safety of reformulated, micronized glyburide tablets in patients with non-insulin-dependent diabetes mellitus: a multicenter, double-blind, randomized trial. Clin Ther 1993; 15(5):788-96.
109. Rosenstock J, Corrao PJ, Goldberg RB, Kilo C. Diabetes control in the elderly: a randomized, comparative study of glyburide versus glipizide in non-insulin-dependent diabetes mellitus. Clin Ther 1993; 15(6):1031-40.
110. Birkeland KI, Furuseth K, Melander A, Mowinckel P, Vaaler S. Long-term randomized placebo-controlled double-blind therapeutic comparison of glipizide and glyburide. Glycemic control and insulin secretion during 15 months. Diabetes Care 1994; 17(1):45-9.
111. Inukai K, Watanabe M, Nakashima Y et al. Efficacy of glimepiride in Japanese type 2 diabetic subjects. Diabetes Res Clin Pract 2005; 68(3):250-7.
112. Draeger KE, Wernicke-Panten K, Lomp HJ, Schuler E, Rosskamp R. Long-term treatment of type 2 diabetic patients with the new oral
antidiabetic agent glimepiride (Amaryl): a double-blind comparison with glibenclamide. Horm Metab Res 1996; 28(9):419-25.
113. Harrower AD. Comparison of diabetic control in type 2 (non-insulin dependent) diabetic patients treated with different sulphonylureas. Curr Med Res Opin 1985; 9(10):676-80.
114. Kardas P. The DIACOM study (effect of DosIng frequency of oral Antidiabetic agents on the COMpliance and biochemical control of type 2 diabetes). Diabetes Obes Metab 2005; 7(6):722-8.
115. Yamagishi S, Nakamura K, Inoue H. Acarbose is a promising therapeutic strategy for the treatment of patients with nonalcoholic steatohepatitis (NASH). Med Hypotheses 2005; 65(2):377-9.
116. Marbury T, Huang WC, Strange P, Lebovitz H. Repaglinide versus glyburide: a one-year comparison trial. Diabetes Res Clin Pract 1999; 43(3):155-66.
117. Wolffenbuttel BH, Landgraf R. A 1-year multicenter randomized double-blind comparison of repaglinide and glyburide for the treatment of type 2 diabetes. Dutch and German Repaglinide Study Group. Diabetes Care 1999; 22(3):463-7.
118. Derosa G, Mugellini A, Ciccarelli L, Crescenzi G, Fogari R. Comparison between repaglinide and glimepiride in patients with type 2 diabetes mellitus: a one-year, randomized, double-blind assessment of metabolic parameters and cardiovascular risk factors. Clin Ther 2003; 25(2):472-84.
119. Madsbad S, Kilhovd B, Lager I, Mustajoki P, Dejgaard A. Comparison between repaglinide and glipizide in Type 2 diabetes mellitus: a 1-year multicentre study. Diabet Med 2001; 18(5):395-401.
120. Wolffenbuttel BH, Nijst L, Sels JP, Menheere PP, Muller PG, Kruseman AC. Effects of a new oral hypoglycaemic agent, repaglinide, on metabolic control in sulphonylurea-treated patients with NIDDM. Eur J Clin Pharmacol 1993; 45(2):113-6.
121. Landgraf R, Bilo HJ, Muller PG. A comparison of repaglinide and glibenclamide in the treatment of type 2 diabetic patients previously treated with sulphonylureas. Eur J Clin Pharmacol 1999; 55(3):165-71.
122. Vakkilainen J, Mero N, Schweizer A, Foley JE, Taskinen MR. Effects of nateglinide and glibenclamide on postprandial lipid and glucose
207
metabolism in type 2 diabetes. Diabetes Metab Res Rev 2002; 18(6):484-90.
123. Pfutzner A, Schondorf T, Seidel D et al. Impact of rosiglitazone on beta-cell function, insulin resistance, and adiponectin concentrations: results from a double-blind oral combination study with glimepiride. Metabolism 2006; 55(1):20-5.
124. Rosenstock J, Goldstein BJ, Vinik AI et al. Effect of early addition of rosiglitazone to sulphonylurea therapy in older type 2 diabetes patients (>60 years): the Rosiglitazone Early vs. SULphonylurea Titration (RESULT) study. Diabetes Obes Metab 2006; 8(1):49-57.
125. Kerenyi Z, Samer H, James R, Yan Y, Stewart M. Combination therapy with rosiglitazone and glibenclamide compared with upward titration of glibenclamide alone in patients with type 2 diabetes mellitus. Diabetes Res Clin Pract 2004; 63(3):213-23.
126. Baksi A, James RE, Zhou B, Nolan JJ. Comparison of uptitration of gliclazide with the addition of rosiglitazone to gliclazide in patients with type 2 diabetes inadequately controlled on half-maximal doses of a sulphonylurea. Acta Diabetol 2004; 41(2):63-9.
127. Erle G, Lovise S, Stocchiero C et al. A comparison of preconstituted, fixed combinations of low-dose glyburide plus metformin versus high-dose glyburide alone in the treatment of type 2 diabetic patients. Acta Diabetol 1999; 36(1-2):61-5.
128. UKPDS 28: a randomized trial of efficacy of early addition of metformin in sulfonylurea-treated type 2 diabetes. U.K. Prospective Diabetes Study Group. Diabetes Care 1998; 21(1):87-92.
129. Gregorio F, Ambrosi F, Manfrini S et al. Poorly controlled elderly Type 2 diabetic patients: the effects of increasing sulphonylurea dosages or adding metformin. Diabet Med 1999; 16(12):1016-24.
130. Feinbock C, Luger A, Klingler A et al. Prospective multicentre trial comparing the efficacy of, and compliance with, glimepiride or acarbose treatment in patients with type 2 diabetes not controlled with diet alone. Diabetes Nutr Metab 2003; 16(4):214-21.
131. Rosenstock J, Hassman DR, Madder RD et al. Repaglinide versus nateglinide monotherapy: a randomized, multicenter study. Diabetes Care 2004; 27(6):1265-70.
132. Azriel R, Gazit E. Analysis of the minimal amyloid-forming fragment of the islet amyloid polypeptide. An experimental support for the key role of the phenylalanine residue in amyloid formation. J Biol Chem 2001; 276(36):34156-61.
133. Baba S, Nakagawa S, Takebe K et al. Comparison of gliclazide and glibenclamide treatment in non-insulin-dependent diabetes. Tohoku J Exp Med 1983; 141 Suppl:693-706.
134. Goldberg RB, Holvey SM, Schneider J. A dose-response study of glimepiride in patients with NIDDM who have previously received sulfonylurea agents. The Glimepiride Protocol #201 Study Group. Diabetes Care 1996; 19(8):849-56.
135. Schade DS, Jovanovic L, Schneider J. A placebo-controlled, randomized study of glimepiride in patients with type 2 diabetes mellitus for whom diet therapy is unsuccessful. J Clin Pharmacol 1998; 38(7):636-41.
136. Simonson DC, Kourides IA, Feinglos M, Shamoon H, Fischette CT. Efficacy, safety, and dose-response characteristics of glipizide gastrointestinal therapeutic system on glycemic control and insulin secretion in NIDDM. Results of two multicenter, randomized, placebo-controlled clinical trials. The Glipizide Gastrointestinal Therapeutic System Study Group. Diabetes Care 1997; 20(4):597-606.
137. Vray M, Attali JR. Randomized study of glibenclamide versus traditional Chinese treatment in type 2 diabetic patients. Chinese-French Scientific Committee for the Study of Diabetes. Diabete Metab 1995; 21(6):433-9.
138. Hasche H, Mertes G, Bruns C et al. Effects of acarbose treatment in Type 2 diabetic patients under dietary training: a multicentre, double-blind, placebo-controlled, 2-year study. Diabetes Nutr Metab 1999; 12(4):277-85.
139. Goldberg RB, Einhorn D, Lucas CP et al. A randomized placebo-controlled trial of repaglinide in the treatment of type 2 diabetes. Diabetes Care 1998; 21(11):1897-903.
140. Tseng C-H, Huang T-S. Pioglitazone with sulfonylurea: Glycemic and lipid effects in Taiwanese type 2 diabetic patients. Diabetes Res. Clin. Pract. 2005; 70(2):193-4.
141. Scherbaum WA, Goke B. Metabolic efficacy and safety of once-daily pioglitazone monotherapy in patients with type 2 diabetes: a double-blind, placebo-controlled study. Horm Metab Res 2002; 34(10):589-95.
208
142. King AB. A comparison in a clinical setting of the efficacy and side effects of three thiazolidinediones. Diabetes Care 2000; 23(4):557.
143. Virtanen KA, Hallsten K, Parkkola R et al. Differential effects of rosiglitazone and metformin on adipose tissue distribution and glucose uptake in type 2 diabetic subjects. Diabetes 2003; 52(2):283-90.
144. Natali A, Baldeweg S, Toschi E et al. Vascular effects of improving metabolic control with metformin or rosiglitazone in type 2 diabetes. Diabetes Care 2004; 27(6):1349-57.
145. Forst T, Lubben G, Hohberg C et al. Influence of glucose control and improvement of insulin resistance on microvascular blood flow and endothelial function in patients with diabetes mellitus type 2. Microcirculation 2005; 12(7):543-50.
146. Langenfeld MR, Forst T, Hohberg C et al. Pioglitazone decreases carotid intima-media thickness independently of glycemic control in patients with type 2 diabetes mellitus: results from a controlled randomized study. Circulation 2005; 111(19):2525-31.
147. Kilo C. Multicenter comparison of glyburide and glipizide in the treatment of non-insulin-dependent diabetes mellitus. Clin Ther 1988; 10(3):294-302.
148. Manzella D, Grella R, Esposito K, Giugliano D, Barbagallo M, Paolisso G. Blood pressure and cardiac autonomic nervous system in obese type 2 diabetic patients: effect of metformin administration. Am J Hypertens 2004; 17(3):223-7.
149. Del Prato S, Erkelens DW, Leutenegger M. Six-month efficacy of benfluorex vs. placebo or metformin in diet-failed type 2 diabetic patients. Acta Diabetol 2003; 40(1):20-7.
150. Rachmani R, Slavachevski I, Levi Z, Zadok B, Kedar Y, Ravid M. Metformin in patients with type 2 diabetes mellitus: reconsideration of traditional contraindications. Eur J Intern Med 2002; 13(7):428.
151. Nishio K, Sakurai M, Kusuyama T et al. A randomized comparison of pioglitazone to inhibit restenosis after coronary stenting in patients with type 2 diabetes. Diabetes Care 2006; 29(1):101-6.
152. Kim YM, Cha BS, Kim DJ et al. Predictive clinical parameters for therapeutic efficacy of
rosiglitazone in Korean type 2 diabetes mellitus. Diabetes Res Clin Pract 2005; 67(1):43-52.
153. Rosenbaum P, Peres RB, Zanella MT, Ferreira SRG. Improved glycemic control by acarbose therapy in hypertensive diabetic patients: Effects on blood pressure and hormonal parameters. Braz. J. Med. Biol. Res. 2002; 35(8):877-84.
154. Grant PJ. The effects of high- and medium-dose metformin therapy on cardiovascular risk factors in patients with type II diabetes. Diabetes Care 1996; 19(1):64-6.
155. Teupe B, Bergis K. Prospective randomized two-years clinical study comparing additional metformin treatment with reducing diet in type 2 diabetes. Diabete Metab 1991; 17(1 Pt 2):213-7.
156. Derosa G, Cicero AF, Gaddi A et al. Metabolic effects of pioglitazone and rosiglitazone in patients with diabetes and metabolic syndrome treated with glimepiride: a twelve-month, multicenter, double-blind, randomized, controlled, parallel-group trial. Clin Ther 2004; 26(5):744-54.
157. Betteridge DJ, Verges B. Long-term effects on lipids and lipoproteins of pioglitazone versus gliclazide addition to metformin and pioglitazone versus metformin addition to sulphonylurea in the treatment of type 2 diabetes. Diabetologia 2005; 48(12):2477-81.
158. Derosa G, Gaddi AV, Piccinni MN et al. Differential effect of glimepiride and rosiglitazone on metabolic control of type 2 diabetic patients treated with metformin: a randomized, double-blind, clinical trial. Diabetes Obes Metab 2006; 8(2):197-205.
159. Hermann LS, Kjellstrom T, Nilsson-Ehle P. Effects of metformin and glibenclamide alone and in combination on serum lipids and lipoproteins in patients with non-insulin-dependent diabetes mellitus. Diabete Metab 1991; 17(1 Pt 2):174-9.
160. Einhorn D, Rendell M, Rosenzweig J, Egan JW, Mathisen AL, Schneider RL. Pioglitazone hydrochloride in combination with metformin in the treatment of type 2 diabetes mellitus: a randomized, placebo-controlled study. The Pioglitazone 027 Study Group. Clin Ther 2000; 22(12):1395-409.
161. Smith SR, De Jonge L, Volaufova J, Li Y, Xie H, Bray GA. Effect of pioglitazone on body composition and energy expenditure: a randomized controlled trial. Metabolism 2005; 54(1):24-32.
209
162. Rosenblatt S, Miskin B, Glazer NB, Prince MJ, Robertson KE. The impact of pioglitazone on glycemic control and atherogenic dyslipidemia in patients with type 2 diabetes mellitus. Coron Artery Dis 2001; 12(5):413-23.
163. Herz M, Johns D, Reviriego J et al. A randomized, double-blind, placebo-controlled, clinical trial of the effects of pioglitazone on glycemic control and dyslipidemia in oral antihyperglycemic medication-naive patients with type 2 diabetes mellitus. Clin Ther 2003; 25(4):1074-95.
164. Saad MF, Greco S, Osei K et al. Ragaglitazar improves glycemic control and lipid profile in type 2 diabetic subjects: a 12-week, double-blind, placebo-controlled dose-ranging study with an open pioglitazone arm. Diabetes Care 2004; 27(6):1324-9.
165. Aronoff S, Rosenblatt S, Braithwaite S, Egan JW, Mathisen AL, Schneider RL. Pioglitazone hydrochloride monotherapy improves glycemic control in the treatment of patients with type 2 diabetes: a 6-month randomized placebo-controlled dose-response study. The Pioglitazone 001 Study Group. Diabetes Care 2000; 23(11):1605-11.
166. Kipnes MS, Krosnick A, Rendell MS, Egan JW, Mathisen AL, Schneider RL. Pioglitazone hydrochloride in combination with sulfonylurea therapy improves glycemic control in patients with type 2 diabetes mellitus: a randomized, placebo-controlled study. Am J Med 2001; 111(1):10-7.
167. Patel J, Anderson RJ, Rappaport EB. Rosiglitazone monotherapy improves glycaemic control in patients with type 2 diabetes: a twelve-week, randomized, placebo-controlled study. Diabetes Obes Metab 1999; 1(3):165-72.
168. Phillips LS, Grunberger G, Miller E, Patwardhan R, Rappaport EB, Salzman A. Once- and twice-daily dosing with rosiglitazone improves glycemic control in patients with type 2 diabetes. Diabetes Care 2001; 24(2):308-15.
169. Lebovitz HE, Dole JF, Patwardhan R, Rappaport EB, Freed MI. Rosiglitazone monotherapy is effective in patients with type 2 diabetes. J Clin Endocrinol Metab 2001; 86(1):280-8.
170. Vongthavaravat V, Wajchenberg BL, Waitman JN et al. An international study of the effects of rosiglitazone plus sulphonylurea in patients with type 2 diabetes. Curr Med Res Opin 2002; 18(8):456-61.
171. Wolffenbuttel BH, Gomis R, Squatrito S, Jones NP, Patwardhan RN. Addition of low-dose rosiglitazone to sulphonylurea therapy improves glycaemic control in Type 2 diabetic patients. Diabet Med 2000; 17(1):40-7.
172. Barnett AH, Grant PJ, Hitman GA et al. Rosiglitazone in Type 2 diabetes mellitus: an evaluation in British Indo-Asian patients. Diabet Med 2003; 20(5):387-93.
173. Schneider J. Effects of metformin on dyslipoproteinemia in non-insulin-dependent diabetes mellitus. Diabete Metab 1991; 17(1 Pt 2):185-90.
174. Lexchin J, Bero LA, Djulbegovic B, Clark O. Pharmaceutical industry sponsorship and research outcome and quality: systematic review. BMJ 2003; 326(7400):1167-70.
175. Bucher HC, Guyatt GH, Griffith LE, Walter SD. The results of direct and indirect treatment comparisons in meta-analysis of randomized controlled trials. J Clin Epidemiol 1997; 50(6):683-91.
176. Cryer DR, Nicholas SP, Henry DH, Mills DJ, Stadel BV. Comparative outcomes study of metformin intervention versus conventional approach the COSMIC Approach Study. Diabetes Care 2005; 28(3):539-43.
177. Gulliford M, Latinovic R. Mortality in type 2 diabetic subjects prescribed metformin and sulphonylurea drugs in combination: cohort study. Diabetes Metab Res Rev 2004; 20(3):239-45.
178. Olsson J, Lindberg G, Gottsater M et al. Increased mortality in Type II diabetic patients using sulphonylurea and metformin in combination: a population-based observational study. Diabetologia 2000; 43(5):558-60.
179. Eurich DT, Majumdar SR, McAlister FA, Tsuyuki RT, Johnson JA. Improved clinical outcomes associated with metformin in patients with diabetes and heart failure. Diabetes Care 2005; 28(10):2345-51.
180. Evans JM, Ogston SA, Emslie-Smith A, Morris AD. Risk of mortality and adverse cardiovascular outcomes in type 2 diabetes: a comparison of patients treated with sulfonylureas and metformin. Diabetologia 2006; 49(5):930-6.
181. Mannucci E, Monami M, Masotti G, Marchionni N. All-cause mortality in diabetic patients treated with combinations of sulfonylureas and biguanides. Diabetes Metab Res Rev 2004;
210
20(1):44-7.
182. Meier JJ, Deifuss S, Klamann A, Schmiegel W, Nauck MA. Influence of an antidiabetic treatment with sulfonylurea drugs on long-term survival after acute myocardial infarction in patients with type 2 diabetes. The LAngendreer Myocardial infarction and Blood glucose in Diabetic patients Assessment (LAMBDA). Exp Clin Endocrinol Diabetes 2003; 111(6):344-50.
183. Klamann A, Sarfert P, Launhardt V, Schulte G, Schmiegel WH, Nauck MA. Myocardial infarction in diabetic vs non-diabetic subjects. Survival and infarct size following therapy with sulfonylureas (glibenclamide). Eur Heart J 2000; 21(3):220-9.
184. Inzucchi SE, Masoudi FA, Wang Y et al. Insulin-sensitizing antihyperglycemic drugs and mortality after acute myocardial infarction: Insights from the national heart care project. Diabetes Care 2005; 28(7):1680-9.
185. Dormandy JA, Charbonnel B, Eckland DJ et al. Secondary prevention of macrovascular events in patients with type 2 diabetes in the PROactive Study (PROspective pioglitAzone Clinical Trial In macroVascular Events): a randomised controlled trial. Lancet 2005; 366(9493):1279-89.
186. Fisman EZ, Tenenbaum A, Boyko V et al. Oral antidiabetic treatment in patients with coronary disease: time-related increased mortality on combined glyburide/metformin therapy over a 7.7-year follow-up. Clin Cardiol 2001; 24(2):151-8.
187. Florkowski CM, Scott RS, Coope PA, Moir CL. Predictors of mortality from type 2 diabetes mellitus in Canterbury, New Zealand; a ten-year cohort study. Diabetes Res. Clin. Pract. 2001; 53(2):113-20.
188. Zhu XX, Pan CY, Li GW et al. Addition of rosiglitazone to existing sulfonylurea treatment in chinese patients with type 2 diabetes and exposure to hepatitis B or C. Diabetes Technol Ther 2003; 5(1):33-42.
189. Rosenstock J, Samols E, Muchmore DB, Schneider J. Glimepiride, a new once-daily sulfonylurea. A double-blind placebo-controlled study of NIDDM patients. Glimepiride Study Group. Diabetes Care 1996; 19(11):1194-9.
190. Hanefeld M, Bouter KP, Dickinson S, Guitard C. Rapid and short-acting mealtime insulin secretion with nateglinide controls both prandial and mean glycemia. Diabetes Care 2000;
23(2):202-7.
191. Sonnenberg GE, Garg DC, Weidler DJ et al. Short-term comparison of once- versus twice-daily administration of glimepiride in patients with non-insulin-dependent diabetes mellitus. Ann Pharmacother 1997; 31(6):671-6.
192. Gegick CG, Altheimer MD. Comparison of effects of thiazolidinediones on cardiovascular risk factors: observations from a clinical practice. Endocr Pract 2001; 7(3):162-9.
193. Luis Bautista J, Bugos C, Dirnberger G, Atherton T. Efficacy and safety profile of glimepiride in Mexican American Patients with type 2 diabetes mellitus: a randomized, placebo-controlled study. Clin Ther 2003; 25(1):194-209.
194. Jovanovic L, Dailey G 3rd, Huang WC, Strange P, Goldstein BJ. Repaglinide in type 2 diabetes: a 24-week, fixed-dose efficacy and safety study. J Clin Pharmacol 2000; 40(1):49-57.
195. Ikeda T. QT prolongation in type 2 diabetes mellitus treated with glibenclamide. Diabete Metab 1994; 20(6):565-7.
196. Akanuma Y, Kosaka K, Kanazawa Y, Kasuga M, Fukuda M, Aoki S. Long-term comparison of oral hypoglycemic agents in diabetic retinopathy. Gliclazide vs. other sulfonylureas. Diabetes Res Clin Pract 1988; 5(2):81-90.
197. Bech P, Moses R, Gomis R. The effect of prandial glucose regulation with repaglinide on treatment satisfaction, wellbeing and health status in patients with pharmacotherapy naive Type 2 diabetes: a placebo-controlled, multicentre study. Qual Life Res 2003; 12(4):413-25.
198. Testa MA, Simonson DC. Health economic benefits and quality of life during improved glycemic control in patients with type 2 diabetes mellitus: a randomized, controlled, double-blind trial. JAMA 1998; 280(17):1490-6.
199. Papa G, Fedele V, Rizzo MR et al. Safety of type 2 diabetes treatment with repaglinide compared with glibenclamide in elderly people: a randomized, open-label, two-period, cross-over trial. Diabetes Care 2006; 29(8):1918-20.
200. Frenchman IB. Treatment and treatment-related adverse events of type 2 diabetes mellitus in residents of long-term care facilities: A retrospective study. Curr. Ther. Res. Clin. Exp. 2003; 64(1):1-9.
211
201. Leese GP, Wang J, Broomhall J et al. Frequency of severe hypoglycemia requiring emergency treatment in type 1 and type 2 diabetes: a population-based study of health service resource use. Diabetes Care 2003; 26(4):1176-80.
202. Holstein A, Plaschke A, Egberts EH. Lower incidence of severe hypoglycaemia in patients with type 2 diabetes treated with glimepiride versus glibenclamide. Diabetes Metab Res Rev 2001; 17(6):467-73.
203. Jennings AM, Wilson RM, Ward JD. Symptomatic hypoglycemia in NIDDM patients treated with oral hypoglycemic agents. Diabetes Care 1989; 12(3):203-8.
204. van Staa T, Abenhaim L, Monette J. Rates of hypoglycemia in users of sulfonylureas. J Clin Epidemiol 1997; 50(6):735-41.
205. Shorr RI, Ray WA, Daugherty JR, Griffin MR. Individual sulfonylureas and serious hypoglycemia in older people. J Am Geriatr Soc 1996; 44(7):751-5.
206. Charpentier G, Vaur L, Halimi S et al. Predictors of response to glimepiride in patients with type 2 diabetes mellitus. Diabetes Metab 2001; 27(5 Pt 1):563-71.
207. Rosenstock J, Meisel A, Raskin P. Conversion from low-dose insulin therapy to glipizide in patients with non-insulin-dependent diabetes mellitus. Am J Med 1987; 83(3A):10-5.
208. Bell DS, Yumuk V. Frequency of severe hypoglycemia in patients with non-insulin-dependent diabetes mellitus treated with sulfonylureas or insulin. Endocr Pract 1997; 3(5):281-3.
209. Cathelineau G, de Champvallins M, Bouallouche A, Lesobre B. Management of newly diagnosed non-insulin-dependent diabetes mellitus in the primary care setting: effects of 2 years of gliclazide treatment--the Diadem Study. Metabolism 1997; 46(12 Suppl 1):31-4.
210. Swislocki AL, Khuu Q, Liao E et al. Safety and efficacy of metformin in a restricted formulary. Am J Manag Care 1999; 5(1):62-8.
211. Haupt E, Knick B, Koschinsky T, Liebermeister H, Schneider J, Hirche H. Oral antidiabetic combination therapy with sulphonylureas and metformin. Diabete Metab 1991; 17(1 Pt 2):224-31.
212. Chandrasekharan S, Rao PP, Jayaram S, Jain SD,
Ganesan R, Desai A. Efficacy and safety of nateglinide in the treatment of type II diabetes mellitus. J Indian Med Assoc 2002; 100(7):467-8.
213. Mertes G. Safety and efficacy of acarbose in the treatment of Type 2 diabetes: data from a 5-year surveillance study. Diabetes Res Clin Pract 2001; 52(3):193-204.
214. Bhansali A, Masoodi SR. Efficacy of once- or twice-daily extended release metformin compared with thrice-daily immediate release metformin in type 2 diabetes mellitus. J Assoc Physicians India 2005; 53:441-5.
215. Dandona P, Fonseca V, Mier A, Beckett AG. Diarrhea and metformin in a diabetic clinic. Diabetes Care 1983; 6(5):472-4.
216. Bytzer P, Talley NJ, Jones MP, Horowitz M. Oral hypoglycaemic drugs and gastrointestinal symptoms in diabetes mellitus. Aliment Pharmacol Ther 2001; 15(1):137-42.
217. Garber AJ, Duncan TG, Goodman AM, Mills DJ, Rohlf JL. Efficacy of metformin in type II diabetes: results of a double-blind, placebo-controlled, dose-response trial. Am J Med 1997; 103(6):491-7.
218. Moses RG, Gomis R, Frandsen KB, Schlienger JL, Dedov I. Flexible meal-related dosing with repaglinide facilitates glycemic control in therapy-naive type 2 diabetes. Diabetes Care 2001; 24(1):11-5.
219. Kane MP, Busch RS, Bakst G, Hamilton RA. Substitution of pioglitazone for troglitazone in patients with type 2 diabetes. Endocr Pract 2004; 10(1):18-23.
220. Lysy J, Israeli E, Goldin E. The prevalence of chronic diarrhea among diabetic patients. Am J Gastroenterol 1999; 94(8):2165-70.
221. Gregorio F, Ambrosi F, Filipponi P, Manfrini S, Testa I. Is metformin safe enough for ageing type 2 diabetic patients? Diabetes Metab 1996; 22(1):43-50.
222. Chalasani N, Teal E, Hall SD. Effect of rosiglitazone on serum liver biochemistries in diabetic patients with normal and elevated baseline liver enzymes. Am J Gastroenterol 2005; 100(6):1317-21.
223. Rajagopalan R, Iyer S, Khan M. Effect of pioglitazone on metabolic syndrome risk factors: results of double-blind, multicenter, randomized
212
clinical trials. Curr Med Res Opin 2005; 21(1):163-72.
224. Chan KA, Truman A, Gurwitz JH et al. A cohort study of the incidence of serious acute liver injury in diabetic patients treated with hypoglycemic agents. Arch Intern Med 2003; 163(6):728-34.
225. Kubo K. Effect of pioglitazone on blood proinsulin levels in patients with type 2 diabetes mellitus. Endocr J 2002; 49(3):323-8.
226. Schofl C, Lubben G. Postmarketing Surveillance Study of the Efficacy and Tolerability of Pioglitazone in Insulin-Resistant Patients with Type 2 Diabetes Mellitus in General Practice. Clin. Drug Invest. 2003; 23(11):725-34.
227. Ballary C, Desai A. Efficacy and safety of a combination of metformin and rosiglitaone in patients with type 2 diabetes mellitus--a postmarketing study. J Indian Med Assoc 2003; 101(2):113-4, 123.
228. Delea TE, Edelsberg JS, Hagiwara M, Oster G, Phillips LS. Use of thiazolidinediones and risk of heart failure in people with type 2 diabetes: a retrospective cohort study. Diabetes Care 2003; 26(11):2983-9.
229. Masoudi FA, Inzucchi SE, Wang Y, Havranek EP, Foody JM, Krumholz HM. Thiazolidinediones, metformin, and outcomes in older patients with diabetes and heart failure: an observational study. Circulation 2005; 111(5):583-90.
230. Nichols GA, Koro CE, Gullion CM, Ephross SA, Brown JB. The incidence of congestive heart failure associated with antidiabetic therapies. Diabetes Metab Res Rev 2005; 21(1):51-7.
231. Hartung DM, Touchette DR, Bultemeier NC, Haxby DG. Risk of hospitalization for heart failure associated with thiazolidinedione therapy: a medicaid claims-based case-control study. Pharmacotherapy 2005; 25(10):1329-36.
232. Maru S, Koch GG, Stender M et al. Antidiabetic drugs and heart failure risk in patients with type 2 diabetes in the U.K. primary care setting. Diabetes Care 2005; 28(1):20-6.
233. Jun JK, Gong WC, Mathur R. Effects of pioglitazone on diabetes-related outcomes in Hispanic patients. Am J Health Syst Pharm 2003; 60(5):469-73.
234. Kahara T, Takamura T, Misaki T et al.
Relationship between plasma hANP level and pretibial edema by pioglitazone treatment. Endocr J 2005; 52(3):373-6.
235. Stang M, Wysowski DK, Butler-Jones D. Incidence of lactic acidosis in metformin users. Diabetes Care 1999; 22(6):925-7.
236. Aguilar C, Reza A, Garcia JE, Rull JA. Biguanide related lactic acidosis: incidence and risk factors. Arch Med Res 1992; 23(1):19-24.
237. Selby JV, Ettinger B, Swain BE, Brown JB. First 20 months' experience with use of metformin for type 2 diabetes in a large health maintenance organization. Diabetes Care 1999; 22(1):38-44.
238. Wiholm BE, Myrhed M. Metformin-associated lactic acidosis in Sweden 1977-1991. Eur J Clin Pharmacol 1993; 44(6):589-91.
239. Manley HJ, Allcock NM. Thiazolidinedione safety and efficacy in ambulatory patients receiving hemodialysis. Pharmacotherapy 2003; 23(7):861-5.
240. Bowker SL, Majumdar SR, Veugelers P, Johnson JA. Increased cancer-related mortality for patients with type 2 diabetes who use sulfonylureas or insulin. Diabetes Care 2006; 29(2):254-8.
241. Saloranta C, Hershon K, Ball M, Dickinson S, Holmes D. Efficacy and safety of nateglinide in type 2 diabetic patients with modest fasting hyperglycemia. J Clin Endocrinol Metab 2002; 87(9):4171-6.
242. Lester JW, Fernandes AW. Pioglitazone in a subgroup of patients with type 2 diabetes meeting the criteria for metabolic syndrome. Int J Clin Pract 2005; 59(2):134-42.
243. Charbonnel B, Roden M, Urquhart R et al. Pioglitazone elicits long-term improvements in insulin sensitivity in patients with type 2 diabetes: comparisons with gliclazide-based regimens. Diabetologia 2005; 48(3):553-60.
244. Belcher G, Lambert C, Goh KL, Edwards G, Valbuena M. Cardiovascular effects of treatment of type 2 diabetes with pioglitazone, metformin and gliclazide. Int J Clin Pract 2004; 58(9):833-7.
245. Khan M, Xu Y, Edwards G, Urquhart R, Mariz S. Effects of pioglitazone on the components of diabetic dyslipidaemia: Results of double-blind, multicenter, randomised studies. Int. J. Clin. Pract. 2004; 58(10):907-12.
213
246. Davidson J, Howlett H. New prolonged-release metformin improves gastrointestinal tolerability. Br. J. Diabetes Vasc. Dis. 2004; 4(4):273-7.
247. Perez A, Khan M, Johnson T, Karunaratne M. Pioglitazone plus a sulphonylurea or metformin is associated with increased lipoprotein particle size in patients with type 2 diabetes. Diab Vasc Dis Res 2004; 1(1):44-50.
248. Roden M, Laakso M, Johns D et al. Long-term effects of pioglitazone and metformin on insulin sensitivity in patients with Type 2 diabetes mellitus. Diabet Med 2005; 22(8):1101-6.
249. Belcher G, Schernthaner G. Changes in liver tests during 1-year treatment of patients with Type 2 diabetes with pioglitazone, metformin or gliclazide. Diabet Med 2005; 22(8):973-9.
250. Belcher G, Lambert C, Edwards G, Urquhart R, Matthews DR. Safety and tolerability of pioglitazone, metformin, and gliclazide in the treatment of type 2 diabetes. Diabetes Res Clin Pract 2005; 70(1):53-62.
251. Charbonnel B, Schernthaner G, Brunetti P et al. Long-term efficacy and tolerability of add-on pioglitazone therapy to failing monotherapy compared with addition of gliclazide or metformin in patients with type 2 diabetes. Diabetologia 2005; 48(6):1093-104.
252. Ceriello A, Johns D, Widel M, Eckland DJ, Gilmore KJ, Tan MH. Comparison of effect of pioglitazone with metformin or sulfonylurea (monotherapy and combination therapy) on postload glycemia and composite insulin sensitivity index during an oral glucose tolerance test in patients with type 2 diabetes. Diabetes Care 2005; 28(2):266-72.
253. Tan MH, Johns D, Glazer NB. Pioglitazone reduces atherogenic index of plasma in patients with type 2 diabetes. Clin Chem 2004; 50(7):1184-8.
254. Rajagopalan R, Perez A, Ye Z, Khan M, Murray FT. Pioglitazone is effective therapy for elderly patients with type 2 diabetes mellitus. Drugs Aging 2004; 21(4):259-71.
255. Agrawal A, Sautter MC, Jones NP. Effects of rosiglitazone maleate when added to a sulfonylurea regimen in patients with type 2 diabetes mellitus and mild to moderate renal impairment: a post hoc analysis. Clin Ther 2003; 25(11):2754-64.
256. Rendell MS, Glazer NB, Ye Z. Combination therapy with pioglitazone plus metformin or
sulfonylurea in patients with Type 2 diabetes: influence of prior antidiabetic drug regimen. J Diabetes Complications 2003; 17(4):211-7.
257. Kreider M, Heise M. Rosiglitazone in the management of older patients with type 2 diabetes mellitus. Int J Clin Pract 2002; 56(7):538-41.
258. Lebovitz HE, Kreider M, Freed MI. Evaluation of liver function in type 2 diabetic patients during clinical trials: evidence that rosiglitazone does not cause hepatic dysfunction. Diabetes Care 2002; 25(5):815-21.
259. Lee A, Morley JE. Metformin decreases food consumption and induces weight loss in subjects with obesity with type II non-insulin-dependent diabetes. Obes Res 1998; 6(1):47-53.
260. Dornan TL, Heller SR, Peck GM, Tattersall RB. Double-blind evaluation of efficacy and tolerability of metformin in NIDDM. Diabetes Care 1991; 14(4):342-4.
261. Cefalu WT, Bell-Farrow A, Wang ZQ, McBride D, Dalgleish D, Terry JG. Effect of glipizide GITS on insulin sensitivity, glycemic indices, and abdominal fat composition in NIDDM. Drug Dev. Res. 1998; 44(1):1-7.
262. Mari A, Gastaldelli A, Foley JE, Pratley RE, Ferrannini E. Beta-cell function in mild type 2 diabetic patients: effects of 6-month glucose lowering with nateglinide. Diabetes Care 2005; 28(5):1132-8.
263. Leonhardt W, Hanefeld M, Fischer S, Schulze J, Spengler M. Beneficial effects on serum lipids in noninsulin dependent diabetics by acarbose treatment. Arzneimittelforschung 1991; 41(7):735-8.
264. Karter AJ, Ahmed AT, Liu J, Moffet HH, Parker MM. Pioglitazone initiation and subsequent hospitalization for congestive heart failure. Diabet Med 2005; 22(8):986-93.
265. Abbasi AA, Kasmikha R, Sotingeanu DG. Metformin-induced lacticacidemia in patients with type 2 diabetes mellitus. Endocr Pract 2000; 6(6):442-6.
266. Inzucchi SE. Oral antihyperglycemic therapy for type 2 diabetes: scientific review. JAMA 2002; 287(3):360-72.
267. Chilcott J, Tappenden P, Jones ML, Wight JP. A systematic review of the clinical effectiveness of pioglitazone in the treatment of type 2 diabetes
214
mellitus. Clin Ther 2001; 23(11):1792-823; discussion 1791.
268. Kahn BB, Flier JS. Obesity and insulin resistance. J. Clin. Invest. 2000; 106(4):473-81.
269. Lucas C, Johnson W, Hamilton MA et al. Freedom from congestion predicts good survival despite previous class IV symptoms of heart failure. Am Heart J 2000; 140(6):840-7.
270. Ness-Abramof R, Apovian CM. Drug-induced weight gain. Drugs Today (Barc) 2005; 41(8):547-55.
271. Pijl H, Meinders AE. Bodyweight change as an adverse effect of drug treatment. Mechanisms and management. Drug Saf 1996; 14(5):329-42.
272. Henry RR, Wallace P, Olefsky JM. Effects of weight loss on mechanisms of hyperglycemia in obese non-insulin-dependent diabetes mellitus. Diabetes 1986; 35(9):990-8.
273. Gumbiner B, Polonsky KS, Beltz WF et al. Effects of weight loss and reduced hyperglycemia on the kinetics of insulin secretion in obese non-insulin dependent diabetes mellitus. J Clin Endocrinol Metab 1990; 70(6):1594-602.
274. Kelley DE, Wing R, Buonocore C, Sturis J, Polonsky K, Fitzsimmons M. Relative effects of calorie restriction and weight loss in noninsulin-dependent diabetes mellitus. J Clin Endocrinol Metab 1993; 77(5):1287-93.
275. Bray GA, Bellanger T. Epidemiology, trends, and morbidities of obesity and the metabolic syndrome. Endocrine 2006; 29(1):109-17.
276. de Jongh RT, Ijzerman RG, Serne EH et al. Visceral and truncal subcutaneous adipose tissue are associated with impaired capillary recruitment in healthy individuals. J Clin Endocrinol Metab 2006.
277. Basu A, Jensen MD, McCann F, Mukhopadhyay D, Joyner MJ, Rizza RA. Effects of pioglitazone versus glipizide on body fat distribution, body water content, and hemodynamics in type 2 diabetes. Diabetes Care 2006; 29(3):510-4.
278. Smith SR, De Jonge L, Volaufova J, Li Y, Xie H, Bray GA. Effect of pioglitazone on body composition and energy expenditure: a randomized controlled trial. Metabolism 2005; 54(1):24-32.
279. Hypertension in Diabetes Study (HDS): I.
Prevalence of hypertension in newly presenting type 2 diabetic patients and the association with risk factors for cardiovascular and diabetic complications. J Hypertens 1993; 11(3):309-17.
280. Birkenhager WH, Staessen JA, Gasowski J, de Leeuw PW. Effects of antihypertensive treatment on endpoints in the diabetic patients randomized in the Systolic Hypertension in Europe (Syst-Eur) trial. J Nephrol 2000; 13(3):232-7.
281. Tight blood pressure control and risk of macrovascular and microvascular complications in type 2 diabetes: UKPDS 38. UK Prospective Diabetes Study Group. BMJ 1998; 317(7160):703-13.
282. Prevention of stroke by antihypertensive drug treatment in older persons with isolated systolic hypertension. Final results of the Systolic Hypertension in the Elderly Program (SHEP). SHEP Cooperative Research Group. JAMA 1991; 265(24):3255-64.
283. Adler AI, Stratton IM, Neil HA et al. Association of systolic blood pressure with macrovascular and microvascular complications of type 2 diabetes (UKPDS 36): prospective observational study. BMJ 2000; 321(7258):412-9.
284. Wang JG, Staessen JA, Gong L, Liu L. Chinese trial on isolated systolic hypertension in the elderly. Systolic Hypertension in China (Syst-China) Collaborative Group. Arch Intern Med 2000; 160(2):211-20.
285. Hansson L, Zanchetti A, Carruthers SG et al. Effects of intensive blood-pressure lowering and low-dose aspirin in patients with hypertension: principal results of the Hypertension Optimal Treatment (HOT) randomised trial. HOT Study Group. Lancet 1998; 351(9118):1755-62.
286. Qayyum R, Adomaityte J. A meta-analysis of the effect of thiazolidinediones on blood pressure. J Clin Hypertens (Greenwich) 2006; 8(1):19-28.
287. Sarafidis PA, Lasaridis AN. Actions of peroxisome proliferator-activated receptors-gamma agonists explaining a possible blood pressure-lowering effect. Am J Hypertens 2006; 19(6):646-53.
288. Executive Summary of The Third Report of The National Cholesterol Education Program (NCEP) Expert Panel on Detection, Evaluation, And Treatment of High Blood Cholesterol In Adults (Adult Treatment Panel III). JAMA 2001; 285(19):2486-97.
289. Schrott HG, Bittner V, Vittinghoff E, Herrington
215
DM, Hulley S. Adherence to National Cholesterol Education Program Treatment goals in postmenopausal women with heart disease. The Heart and Estrogen/Progestin Replacement Study (HERS). The HERS Research Group. JAMA 1997; 277(16):1281-6.
290. Allison TG, Squires RW, Johnson BD, Gau GT. Achieving National Cholesterol Education Program goals for low-density lipoprotein cholesterol in cardiac patients: importance of diet, exercise, weight control, and drug therapy. Mayo Clin Proc 1999; 74(5):466-73.
291. Lexchin J, Bero LA, Djulbegovic B, Clark O. Pharmaceutical industry sponsorship and research outcome and quality: systematic review. BMJ 2003; 326(7400):1167-70.
292. Salpeter S, Greyber E, Pasternak G, Salpeter E. Risk of fatal and nonfatal lactic acidosis with metformin use in type 2 diabetes mellitus. Cochrane Database Syst Rev 2006; (1):CD002967.
293. Norris, S, Carson, S, Roberts, C. Drug Class Review on Thiazolidinediones [Web Page]. May 2006; Available at http://www.ohsu.edu/drugeffectiveness/reports/documents/_TZDs%20Final%20Report.pdf. (Accessed September 2006).
294. Damsbo P, Clauson P, Marbury TC, Windfeld K. A double-blind randomized comparison of meal-related glycemic control by repaglinide and glyburide in well-controlled type 2 diabetic patients. Diabetes Care 1999; 22(5):789-94.
295. Brown JB, Pedula K, Barzilay J, Herson MK, Latare P. Lactic acidosis rates in type 2 diabetes. Diabetes Care 1998; 21(10):1659-63.
296. Misbin RI, Green L, Stadel BV, Gueriguian JL, Gubbi A, Fleming GA. Lactic acidosis in patients with diabetes treated with metformin. N Engl J Med 1998; 338(4):265-6.
297. GlaxoSmithKline. Dear Healthcare Provider [Web Page]. January 2005; Available at http://www.fda.gov/medwatch/safety/2006/Avandia_DHCPletter.pdf. (Accessed 18 October 2006).
298. Actos. Actos (pioglitazone) prescribing information.
299. GlaxoSmithKline Pharmaceuticals. Avandia (rosiglitazone maleate) prescribing information [Web Page]. June 2006; (Accessed 22 October 2006).
300. Goudswaard AN, Furlong NJ, Rutten GE, Stolk RP, Valk GD. Insulin monotherapy versus combinations of insulin with oral hypoglycaemic agents in patients with type 2 diabetes mellitus. Cochrane Database Syst Rev 2004; (4):CD003418.
301. Chiquette E, Ramirez G, Defronzo R. A meta-analysis comparing the effect of thiazolidinediones on cardiovascular risk factors. Arch Intern Med 2004; 164(19):2097-104.
302. Wulffele MG, Kooy A, de Zeeuw D, Stehouwer CD, Gansevoort RT. The effect of metformin on blood pressure, plasma cholesterol and triglycerides in type 2 diabetes mellitus: a systematic review. J Intern Med 2004; 256(1):1-14.
303. Meriden T. Progress with thiazolidinediones in the management of type 2 diabetes mellitus. Clin Ther 2004; 26(2):177-90.
304. Czoski-Murray C, Warren E, Chilcott J, Beverley C, Psyllaki MA, Cowan J. Clinical effectiveness and cost-effectiveness of pioglitazone and rosiglitazone in the treatment of type 2 diabetes: a systematic review and economic evaluation. Health Technol Assess 2004; 8(13):iii, ix-x, 1-91.
305. Stades AM, Heikens JT, Erkelens DW, Holleman F, Hoekstra JB. Metformin and lactic acidosis: cause or coincidence? A review of case reports. J Intern Med 2004; 255(2):179-87.
306. Salpeter SR, Greyber E, Pasternak GA, Salpeter EE. Risk of fatal and nonfatal lactic acidosis with metformin use in type 2 diabetes mellitus: systematic review and meta-analysis. Arch Intern Med 2003; 163(21):2594-602.
307. van Wijk JP, de Koning EJ, Martens EP, Rabelink TJ. Thiazolidinediones and blood lipids in type 2 diabetes. Arterioscler Thromb Vasc Biol 2003; 23(10):1744-9.
308. Salas M, Caro JJ. Are hypoglycaemia and other adverse effects similar among sulphonylureas? Adverse Drug React Toxicol Rev 2002; 21(4):205-17.
309. Levien TL, Baker DE, Campbell RK, White JR Jr. Nateglinide therapy for type 2 diabetes mellitus. Ann Pharmacother 2001; 35(11):1426-34.
310. Chilcott J, Wight J, Lloyd Jones M, Tappenden P. The clinical effectiveness and cost-effectiveness of pioglitazone for type 2 diabetes mellitus: a rapid and systematic review. Health Technol
216
Assess 2001; 5(19):1-61.
311. Culy CR, Jarvis B. Repaglinide: a review of its therapeutic use in type 2 diabetes mellitus. Drugs 2001; 61(11):1625-60.
312. Campbell LK, Baker DE, Campbell RK. Miglitol: assessment of its role in the treatment of patients with diabetes mellitus. Ann Pharmacother 2000; 34(11):1291-301.
313. Johansen K. Efficacy of metformin in the treatment of NIDDM. Meta-analysis. Diabetes Care 1999; 22(1):33-7.
314. Chan NN, Brain HP, Feher MD. Metformin-associated lactic acidosis: a rare or very rare clinical entity? Diabet Med 1999; 16(4):273-81.
315. McCartney MM, Gilbert FJ, Murchison LE, Pearson D, McHardy K, Murray AD. Metformin and contrast media--a dangerous combination? Clin Radiol 1999; 54(1):29-33.
316. Campbell RK. Glimepiride: role of a new sulfonylurea in the treatment of type 2 diabetes mellitus. Ann Pharmacother 1998; 32(10):1044-52.
317. Campbell LK, White JR, Campbell RK. Acarbose: its role in the treatment of diabetes mellitus. Ann Pharmacother 1996; 30(11):1255-62.
318. Melchior WR, Jaber LA. Metformin: an antihyperglycemic agent for treatment of type II diabetes. Ann Pharmacother 1996; 30(2):158-64.
319. Campbell IW, Howlett HC. Worldwide experience of metformin as an effective glucose-lowering agent: a meta-analysis. Diabetes Metab Rev 1995; 11 Suppl 1:S57-62.
320. Campbell IW . Metformin and the sulphonylureas: the comparative risk. Horm Metab Res Suppl 1985; 15:105-11.
321. Vreven R, De Kock M. Metformin lactic acidosis and anaesthesia: Myth or reality? Acta Anaesthesiol. Belg. 2005; 56(3):297-302.
322. Brunetti P, Pagano G, Turco C, Gori M, Perriello G. Effects of two different glibenclamide dose-strengths in the fixed combination with metformin in patients with poorly controlled T2DM: a double blind, prospective, randomised, cross-over clinical trial. Diabetes Nutr Metab 2004; 17(6):350-7.
323. Cefalu WT, Schneider DJ, Carlson HE et al.
Effect of combination glipizide GITS/metformin on fibrinolytic and metabolic parameters in poorly controlled type 2 diabetic subjects. Diabetes Care 2002; 25(12):2123-8.
324. Girnun GD, Smith WM, Drori S et al. APC-dependent suppression of colon carcinogenesis by PPARgamma. Proc Natl Acad Sci U S A 2002; 99(21):13771-6.
325. Evans JM, Donnelly LA, Emslie-Smith AM, Alessi DR, Morris AD. Metformin and reduced risk of cancer in diabetic patients. BMJ 2005; 330(7503):1304-5.
326. Rajagopalan R, Iyer S, Perez A. Comparison of pioglitazone with other antidiabetic drugs for associated incidence of liver failure: no evidence of increased risk of liver failure with pioglitazone. Diabetes Obes Metab 2005; 7(2):161-9.
327. Rajagopalan R, Rosenson RS, Fernandes AW, Khan M, Murray FT. Association between congestive heart failure and hospitalization in patients with type 2 diabetes mellitus receiving treatment with insulin or pioglitazone: a retrospective data analysis. Clin Ther 2004; 26(9):1400-10.
328. Ko SH, Song KH, Ahn YB et al. The effect of rosiglitazone on serum lipoprotein(a) levels in Korean patients with type 2 diabetes mellitus. Metabolism 2003; 52(6):731-4.
329. Garber AJ, Bruce S, Fiedorek FT. Durability of efficacy and long-term safety profile of glyburide/metformin tablets in patients with type 2 diabetes mellitus: an open-label extension study. Clin Ther 2002; 24(9):1401-13.
330. Rosenstock J, Shen SG, Gatlin MR, Foley JE. Combination therapy with nateglinide and a thiazolidinedione improves glycemic control in type 2 diabetes. Diabetes Care 2002; 25(9):1529-33.
331. Deerochanawong C, Chandraprasert S, Suthijumroon A et al. Glimepiride in type 2 diabetes mellitus Thai patients. J Med Assoc Thai 2001; 84(9):1221-8.
332. Emslie-Smith AM, Boyle DI, Evans JM, Sullivan F, Morris AD. Contraindications to metformin therapy in patients with Type 2 diabetes--a population-based study of adherence to prescribing guidelines. Diabet Med 2001; 18(6):483-8.
333. Tsumura K. Clinical evaluation of glimepiride (HOE490) in NIDDM, including a double blind
217
comparative study versus gliclazide. Diabetes Res Clin Pract 1995; 28 Suppl:S147-9.
334. Menzies DG, Campbell IW, McBain A, Brown IR. Metformin efficacy and tolerance in obese non-insulin dependent diabetics: a comparison of two dosage schedules. Curr Med Res Opin 1989; 11(5):273-8.
335. Hermann LS, Nilsson B, Wettre S. Vitamin B12 status of patients treated with metformin: A cross-sectional cohort study. Br. J. Diabetes
Vasc. Dis. 2004; 4(6):401-6.
336. Chalmers J, McBain AM, Brown IRF, Campbell IW. Metformin: Is its use contraindicated in the elderly? PRACT. DIABETES 1992; 9(2):51-3.
337. Profozic V, Resman Z, Cabrijan T et al. Multicentric clinical research of gliclazide (Predian) carried out during a 12-month period in 10 centres of Croatia. DIABETOL. CROAT. 1987; 16(3-4):171-5.


219
List of Acronyms/Abbreviations AHRQ Agency for Healthcare Research and Quality BMI body mass index CABG coronary artery bypass graft CHF congestive heart failure CI confidence interval DBP diastolic blood pressure dL deciliter DPP-IV dipeptidyl peptidase-IV EPC Evidence-based Practice Center FDA Food and Drug Administration g grams GFR glomerular filtration rate GI gastrointestinal GITS gastrointestinal therapeutic system GRADE Grading of Recommendations Assessment, Development and Evaluation HbA1 hemoglobin A1 HbA1c hemoglobin A1c HDL high density lipoprotein HR hazard ratio HR hazard ration IU International unit kg kilogram LDL low density lipoprotein m meter mg milligrams mmHg millimeter mercury mmol millimole NHANES III Third National Health and Nutrition Survey NYHA New York Heart Association PPAR peroxisome proliferators-activated receptor PPG postprandial glucose PROactive PROspecitive pioglitAzone clinical Trial in macroVascular Events PVD peripheral vascular disease RCT randomized controlled trial RR relative risk RR relative risk sd standard deviation se standard error SPB systolic blood pressure SU sulfonylurea TG triglycerides TZD thiazolidinedione UKPDS United Kingdom Prospective Diabetes Study VAS visual analog scales XL extended release XR extended release