Embed Size (px)
Citation preview
Comparative genomics of cytochrome P450
monooxygenases in newly explored pathogenic Oomycetes
By
Mopeli Marshal Sello
Dissertation submitted in fulfilment of the requirements of the degree
Magister Technologiae (M. Tech) in Biomedical Technology
Department of Health Sciences
Central University of Technology, Free State
07 January 2016
Promoter: Dr. Khajamohiddin Syed
Co-Promoter: Prof. Samson Sitheni Mashele
© Central University of Technology, Free State
DECLARATION
II | P a g e
MOPELI M. SELLO DATE
DECLARATION
I, MOPELI MARSHAL SELLO, hereby certify that the dissertation submitted by me for
the degree MAGISTER TECHNOLOGIAE (M. Tech): BIOMEDICAL TECHNOLOGY, is
my own independent work; and complies with the Code of Academic Integrity, as well as
other relevant policies, procedures, rules and regulations of the Central University of
Technology (Free State). I hereby declare, that this research project has not been previously
submitted before to any university or faculty for the attainment of any qualification. I further
waive copyright of the dissertation in favour of the Central University of Technology (Free
State).
© Central University of Technology, Free State

ACKNOWLEDGEMENTS
III
ACKNOWLEDGEMENTS
I pass my sincere gratitude for the success of my study to:
My supervisor, Dr. Khajamohiddin Syed, for guidance and full support in every aspect. I
could not have made it without him.
Prof. Samson Setheni Mashele for his un-measurable support.
Profs. David R Nelson, Jae-Hyuk Yu and Dr Wanping Chen for their huge input in this
study.
Research and Innovation Fund, Central University of Technology, Free State for funding
my studies.
Mrs ‘Mamotsoeneng, my wife and my boy Motsoeneng for the endless support and love
they provide me with.
My mother and late father, my sisters and brothers for being present in my time of life,
their support and trust in me.
My colleagues at the Faculty of Health and Environmental Sciences, Department of
Biomedical Technology at the Central University of Technology especially my research
team for their overwhelming friendship and motivation.
All my friends I am so grateful for your love and support.
To my Creator for my existence, protection, guidance and blessings I am provided with.
© Central University of Technology, Free State
CONTENTS
IV | P a g e
CONTENTS
Page
LIST OF ABBREVIATIONS AND ACRONYMS VII
LIST OF FIGURES X
LIST OF TABLES XII
ABSTRACT XIII
CHAPTER 1: LITERATURE REVIEW
1.1 Introduction on oomycetes
1.1.1. History 1
1.1.2. Characteristics 1
1.1.3. Classification 3
1.1.4. Life style and diversity 3
1.1.5. Species of interest 4
1.2. Cytochrome P450 monooxygenases
1.2.1 Origin of name “P450” 14
1.2.2 Catalytic activity 15
1.2.3. Distribution of P450s and expression in animals 16
1.2.4. Where do P450s fall among oxidoreductases family 17
1.2.5 Classification of P450s 18
1.2.6. Application of cytochrome P450 monooxygenases 20
1.2.7. Catalytic mechanism 22
1.3 Study aim 25
1.4 References 26
© Central University of Technology, Free State
CONTENTS
V | P a g e
CHAPTER 2: GENOME DATA-MINING, ANNOTATION AND PHYLOGENETIC
ANALYSIS OF CYTOCHROME P450 MONOOXYGENASES IN OOMYCETES
2.1. Introduction
2.1.1 Genome sequencing 36
2.1.2 Genome data mining 37
2.2 Methods
2.2.1 Oomycete species for P450 analysis 38
2.2.2 Genome data-mining and identification of P450s 38
2.2.3 Assigning a family and subfamily to orphan P450s 40
2.2.4 Phylogenetic analysis of oomycete P450s 40
2.3 Results and Discussion
2.3.1 Oomycetes P450omes 41
2.3.2 P450 families and subfamilies in oomycetes 45
2.3.4 P450 family and subfamily dynamics in oomycetes 53
2.3.5 Evolutionary analysis of oomycete P450s 57
2.4 Conclusion 60
2.5 References 61
CHAPTER 3: INSIGHTS ON OOMYCETES P450S: HOMOLOGY,
DUPLICATIONS, DIVERSITY AND SIGNATURE SEQUENCES
3.1 Introduction 65
3.1.1 Homology 65
3.1.2 P450 diversity and duplication 66
© Central University of Technology, Free State
CONTENTS
VI | P a g e
3.1.4 P450 signature sequences 69
3.2 Methods
3.2.1 Analysis of homology 70
3.2.2 P450 diversity percentage 70
3.2.3 Analysis of tandem arrangement of P450s 70
3.2.4 Analysis of EXXR and CXG motifs 70
3.2.5 Generation of sequence logos 71
3.3 Results and Discussion
3.3.1 P450 blooming in oomycetes 71
3.3.2 Tandem localization of oomycete P450s 77
3.3.3 Oomycete P450 family characteristic amino acid
patterns at EXXR and CXG motifs 82
3.4 Conclusion 89
3.5 References 90
CHAPTER 4: Genome data mining, annotation and phylogenetic analysis of P450 fused
proteins
4.1 Introduction 93
4.2 Methods 96
4.3 Results and discussion
4.3.1 Novel P450 fused proteins in oomycetes 98
4.4 Conclusion 105
4.5 References 106
© Central University of Technology, Free State
CONTENTS
VII | P a g e
CHAPTER 5: CONCLUSION 109
© Central University of Technology, Free State
LIST OF ABBREVIATIONS
VII | P a g e
LIST OF ABBREVIATIONS AND ACRONYMS
$ Dollar currency sign
% Percentage
2Fe Two-iron
2S Two-sulfur
Adx Adrenodoxin
ADR Adrenodoxin reductase
C Carbon
C-C Carbon-carbon bond
ClustalW2 Multiple sequence alignment program
CoA Co-enzyme A
CPR Cytochrome P450 reductase
C-terminal Carbon terminal end
CYP Cytochrome P450
CXG Cytochrome P450 signature motif
DNA Deoxyribonucleic acid
ER Endoplastic reticulum
EXXR Cytochrome P450 signature motif
et al. Et alia (and others)
FAD Flavin adenine dinucleotide
FDR Ferredoxin reductase
© Central University of Technology, Free State
LIST OF ABBREVIATIONS
VIII | P a g e
Fdx Ferredoxin
FeII Ferrous iron
FeIII
Ferric iron
Fe-S Iron-sulphur
Fig Figure
FAD flavodoxin-flavin mononucleotide
FMN Flavin mononucleotide
G Glycine
H+ Hydrogen ion
Hara Hyaloperonospora arabidopsidis
HEM Heme group
HMMER Hidden Markov model sequence alignment and database search
tool
iTOL Interactive tree of life
ID Identity
MEGA Molecular Evolutionary Genetics Analysis
NADP Nicotinamide adenine dinucleotide phosphate
NAD (P) H Reduced nicotinamide adenine dinucleotide phosphate
NCBI CDD National Center for Biotechnology Information Conserved
Domain Database
NPTL Number of P450s tandemly localized
NPTL-SF Number of P450s tandemly localized on the same scaffold
© Central University of Technology, Free State
LIST OF ABBREVIATIONS
IX | P a g e
N-terminal Amino terminal end
nm Nanometre
O-O Oxygen - oxygen bond
P450 Cytochrome P450
Paph Pythium aphanidermatum
Pcap Phytophthora capsici
Pfam Protein families database
Pinf Phytophthora infestans
Pirr Pythium irregular
Piwa Pythium awayamai,
Ppar Phytophthora parasitica
Pram Phytophthora ramorum
Psoj Phytophthora sojae
Pult Pythium ultimum
PQQ pyrroloquinoline quinone
Pvex Pythium vexan
RH Substrate
Sdec Saprolegnia declina
Sp Species
Spar Saprolegnia parasitica.
USA United States of America
USDA-APHIS United States Department of Agriculture Animal and Plant
Health Inspection Service
© Central University of Technology, Free State
LIST OF FIGURES
X
LIST OF FIGURES
Page
Figure 1.1 Pictures of oomycetes infected fish and plants 6
Figure 1.2 A simple tree diagram that shows the breaking
down of oxidoredactases and classification of
cytochrome P450 monooxygenases 19
Figure 1.3 Cytochrome P450 monooxigenases in drug targets
and new drug discovery processes 21
Figure 1.4 General catalytic nature of P450s 22
Figure 1.5 General catalytic circle stages of P450s 24
Figure 2.1 Comparative analysis of P450s in
13 oomycete animal and plant pathogens 46
Figure 2.2 P450 family-level comparative analysis
between three oomycete orders:
Peronosporales, Pythiales and Saprolegniales 54
Figure 2.3 Comparative analysis of CYP5014, CYP5015
and CYP5017 families between
Peronosporales and Pythiales 56
Figure 2.4 Phylogenetic tree of P450s in 13 oomycete species 59
Figure 3.1 A phylogenetic tree of 46 P450 genes of
Apis mellifera (Western honey bee) 68
© Central University of Technology, Free State
LIST OF FIGURES
XI
Figure 3.2 Comparative P450 diversity analysis between
Oomycota and other lower eukaryote phyla 73
Figure 3.3 Analysis of amino acid combinations
at EXXR and CXG motifs in CYP5014,
CYP5015 and CYP5017 families 85
Figure 4.1 Diversity of P450 redox systems and P450 fusion proteins 95
Figure 4.2 Phylogenetic and structural analysis of P450 fused
proteins (heme peroxidase/dioxygenase fused to P450)
between Oomycota and different fungal phyla 100
© Central University of Technology, Free State
LIST OF TABLES
XII | P a g e
LIST OF TABLES
Page
Table 1.1 The distinctive characteristics between
the Oomycetes and the true Fungi 2
Table 1.2 Taxonomic group, life style, host and
general information on 13 oomycete species in the study 8
Table 1.3 Cytochrome P450 monooxygenases reactions 15
Table 2.1 Genome databases where whole
oomycete species proteome was retrieved 39
Table 2.2 Comparative analysis of P450 in 13 oomycete species 42
Table 2.3 P450 diversity percentage analysis between
Oomycota and different fungal phyla 43
Table 2.4 Comparative P450 analysis at family and
subfamily level in the 13 oomycete species 47
Table 2.5 Distribution of P450 families in the six oomycete P450 Clades 58
Table 3.1 Named Cytochrome P450s in March 2010 66
Table 3.2 Analysis of sequence identity between oomycete P450s 75
Table 3.3 Tandem localization of P450s in oomycetes 78
Table 3.4 List of P450s used to deduce amino acid combinations
at EXXR and CXG motifs in P450 families 86
Table 4.1 Basidiomycota species and respective genome database pages
where their fused P450 proteins were mined 97
Table 4.2 Comparative analysis and structural analysis of P450 fused
proteins in Oomycota and different fungal phyla 102
© Central University of Technology, Free State
ABSTRACT
XIII | P a g e
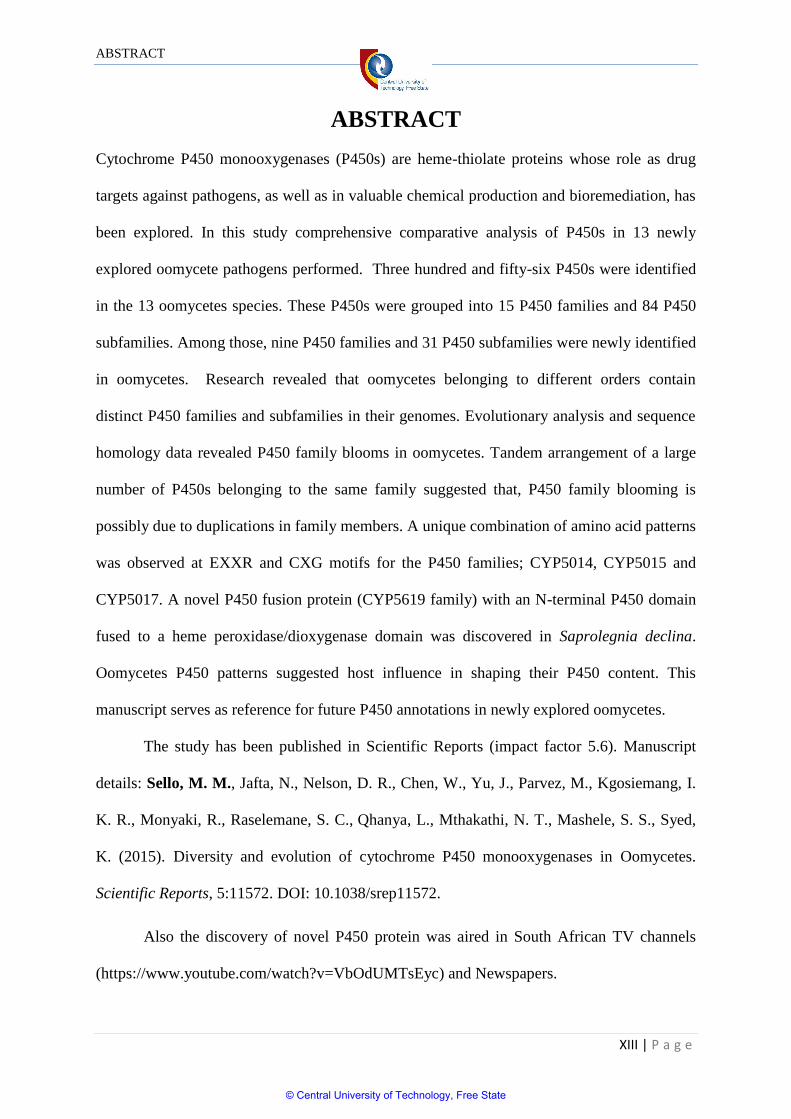
ABSTRACT
Cytochrome P450 monooxygenases (P450s) are heme-thiolate proteins whose role as drug
targets against pathogens, as well as in valuable chemical production and bioremediation, has
been explored. In this study comprehensive comparative analysis of P450s in 13 newly
explored oomycete pathogens performed. Three hundred and fifty-six P450s were identified
in the 13 oomycetes species. These P450s were grouped into 15 P450 families and 84 P450
subfamilies. Among those, nine P450 families and 31 P450 subfamilies were newly identified
in oomycetes. Research revealed that oomycetes belonging to different orders contain
distinct P450 families and subfamilies in their genomes. Evolutionary analysis and sequence
homology data revealed P450 family blooms in oomycetes. Tandem arrangement of a large
number of P450s belonging to the same family suggested that, P450 family blooming is
possibly due to duplications in family members. A unique combination of amino acid patterns
was observed at EXXR and CXG motifs for the P450 families; CYP5014, CYP5015 and
CYP5017. A novel P450 fusion protein (CYP5619 family) with an N-terminal P450 domain
fused to a heme peroxidase/dioxygenase domain was discovered in Saprolegnia declina.
Oomycetes P450 patterns suggested host influence in shaping their P450 content. This
manuscript serves as reference for future P450 annotations in newly explored oomycetes.
The study has been published in Scientific Reports (impact factor 5.6). Manuscript
details: Sello, M. M., Jafta, N., Nelson, D. R., Chen, W., Yu, J., Parvez, M., Kgosiemang, I.
K. R., Monyaki, R., Raselemane, S. C., Qhanya, L., Mthakathi, N. T., Mashele, S. S., Syed,
K. (2015). Diversity and evolution of cytochrome P450 monooxygenases in Oomycetes.
Scientific Reports, 5:11572. DOI: 10.1038/srep11572.
Also the discovery of novel P450 protein was aired in South African TV channels
(https://www.youtube.com/watch?v=VbOdUMTsEyc) and Newspapers.
© Central University of Technology, Free State
CHAPTER 1: LITERATURE REVIEW
1 | P a g e
CHAPTER 1
LITERATURE REVIEW
1.1 Introduction on oomycetes
1.1.1 History
Back in 1845 in one week, one summer, oomycete species Phytophthora infestans nearly
wiped out all the potato crops in Ireland leaving people with almost nothing. In those days
potato was the principal food for marginalized people. Close to a million people died due to
famine and approximately one and half million fled to America and many different countries.
Some of people of Irish blood now living in those countries are descendants of people, who
escaped the great Irish potato famine. The potato blight affected not only Ireland but covered
the entire Europe (University of California Museum of Paleontology (UCMP), n.d.).
The second oomycete in history books is Plasmopara viticola which is involved in
downy mildew of grapes. It has severed wine industry economy in the Mediterranean since
1865 and almost wiped out the French vine yards when accidentally introduced to France
from America by grape seedlings in 1870s (Department of Botany University of Hawai‟I at
Manoa (DBUHM). n.d & UCMP, n.d.). The vine plantation was saved unexpectedly by a
discovery of a simple mixture called “Bordeaux mixture”, a concoction of lime and copper
sulfate. This was the first chemical used to control fungi (UCMP, n. d.). The above story is to
highlight the relationship between oomycetes and humans.
1.1.2 Characteristics
Oomycetes are a heterogeneous group of fungus like stramanopiles. The other name for
oomycetes is water moulds (Kamoun lab@ TSL, n.d.). These microorganisms were first
© Central University of Technology, Free State
CHAPTER 1: LITERATURE REVIEW
2 | P a g e
classified under fungi kingdom due to similarity in the nature of forming mycelium and
feeding on decaying matter (UCMP; Kamoun lab@ TSL, n.d.). Later, the incompatibility of
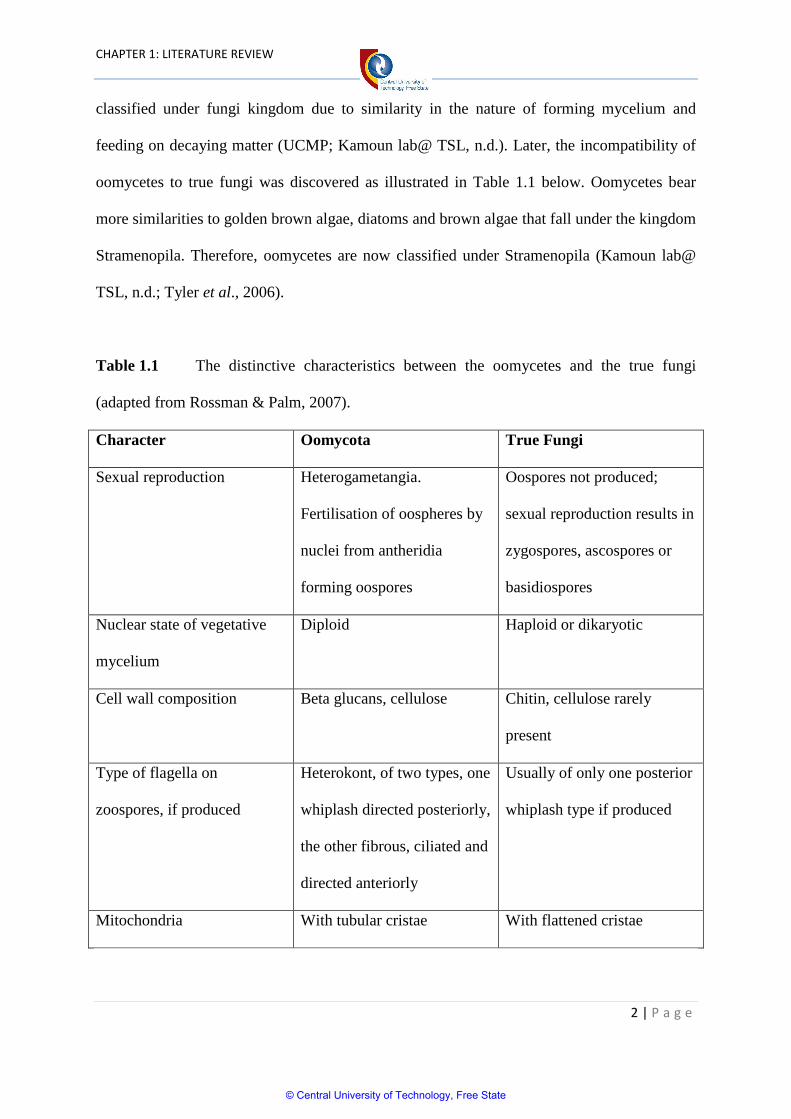
oomycetes to true fungi was discovered as illustrated in Table 1.1 below. Oomycetes bear
more similarities to golden brown algae, diatoms and brown algae that fall under the kingdom
Stramenopila. Therefore, oomycetes are now classified under Stramenopila (Kamoun lab@
TSL, n.d.; Tyler et al., 2006).
Table 1.1 The distinctive characteristics between the oomycetes and the true fungi
(adapted from Rossman & Palm, 2007).
Character Oomycota True Fungi
Sexual reproduction Heterogametangia.
Fertilisation of oospheres by
nuclei from antheridia
forming oospores
Oospores not produced;
sexual reproduction results in
zygospores, ascospores or
basidiospores
Nuclear state of vegetative
mycelium
Diploid Haploid or dikaryotic
Cell wall composition Beta glucans, cellulose Chitin, cellulose rarely
present
Type of flagella on
zoospores, if produced
Heterokont, of two types, one
whiplash directed posteriorly,
the other fibrous, ciliated and
directed anteriorly
Usually of only one posterior
whiplash type if produced
Mitochondria With tubular cristae With flattened cristae
© Central University of Technology, Free State
CHAPTER 1: LITERATURE REVIEW
3 | P a g e
1.1.3 Classification
Oomycetes‟ taxonomic classification is still controversial among authors. Here is the close
example: Van West (2006) describes three oomycete sub classes; Saprolegniomycetidae,
Rhipidiomycetidae and Peronosporomycetidae while Kamoun (2015) adds the forth;
Lagenidales. Under the sub class Peronosporomycetidae falls two orders; Peronosporales
and Pythiales. Pythiales comprise of genera Pythium and Phytophthora. These genera consist
of most destructive plant pathogenic species. The order Peronosporales consists of
Peronospora and Bremia genera under which fall the downy mildews pathogens, obligate
plant pathogens. The sub class Saprolegniomycetidae consists mostly of fish and animal
pathogens. It is divided in to two orders; Saprolegniales and Leptomitales. Under
Saprolegniales three genera are observed; Saprolegnia, Achlya and Aphanomyces.
Saprolegnia and Aphanomyces are fish, shell fish or amphibian pathogens (Van West, 2006).
However, the evolutionary studies currently being carried out on ribosomal and
mitochondrial sequences may provide authentic classification of oomycetes (Kamoun, 2015).
Oomycetes species in this study are from genera Saprolegnia, Peronosporales and Pythiales.
1.1.4 Life style and diversity
Majority of oomycetes are land pathogens and only a small percentage is waterborne
(Nigrelli & Thines, 2013). Oomycetes pathogens have a very wide host range from plants,
insects, crustaceans, fish, and vertebrates to other microorganisms. However, the survival of
oomycetes does not only depend on pathogenic life style but also as saprophytes in different
habitats (marine, fresh water, and land) (Beakes & Sekimoto, 2009). Saprophytic oomycetes
play a vital role in playing natural recyclers by breaking down decaying matter. Most of these
saprobes are found in aquatic and moist soils (Kamoun lab@ TSL, n.d.).
© Central University of Technology, Free State
CHAPTER 1: LITERATURE REVIEW
4 | P a g e
Oomycetes are famous for their destructive behaviour on plants and animals. They have a
remarkable negative impact on economy and cause environmental destruction in both natural
habitats and farming (Van West, 2006). Together with fungi, oomycetes are dominant
members of eukaryotic plant pathogens league (Latijnhouwers et al., 2003). Identified
oomycetes species count was estimated at 2000 species by Nigrelli & Thines (2013) which
has probably increased based on UK Assays (n.d.). More than 60 species of genus
Phytophthora, numerous genera of biotrophic dawny mildews and over 100 species of
Pythium have been noticed (Beakes et al., 2011; Kamoun lab@ TSL, n.d.). A great number of
oomycetes is involved in detrimental diseases to crops and ornamental plants while others are
involved in animal diseases (Kamoun lab@ TSL, n.d.). They are second to bacteria in
compromising the aquaculture economy. Moreover, oomycete diseases are not easy to
control. They have a remarkable ability to adapt to chemicals and build genetic resistance
(particularly Phytophothora species) (Koc & Ustun, 2012; Kamoun, 2015).
Humans are not excluded in oomycete hosts. Pythium insidiosum is a deadly pathogen
to mammals that occasionally lands on humans. Although pathogenic oomycetes are such a
nuisance they can be of some importance. Lagenidium giganteum (insect pathogen) is of
benefit in controlling mosquitoes, where it is of current use in California (Kamoun, 2015).
1.1.5 Species of interest
Phytophothora are world‟s biggest plant pathogens with a vast host range. They play the
most notorious character in plant diseases posing disastrous effects to crops (Figure 1.1) and
marked impact on economy (Cooke et al., 2000; Kamoun lab@ TSL, n.d.). P. infestans, P.
sojae and P. ramorum are most noted species (Garnica et al., 2006).
© Central University of Technology, Free State
CHAPTER 1: LITERATURE REVIEW
5 | P a g e
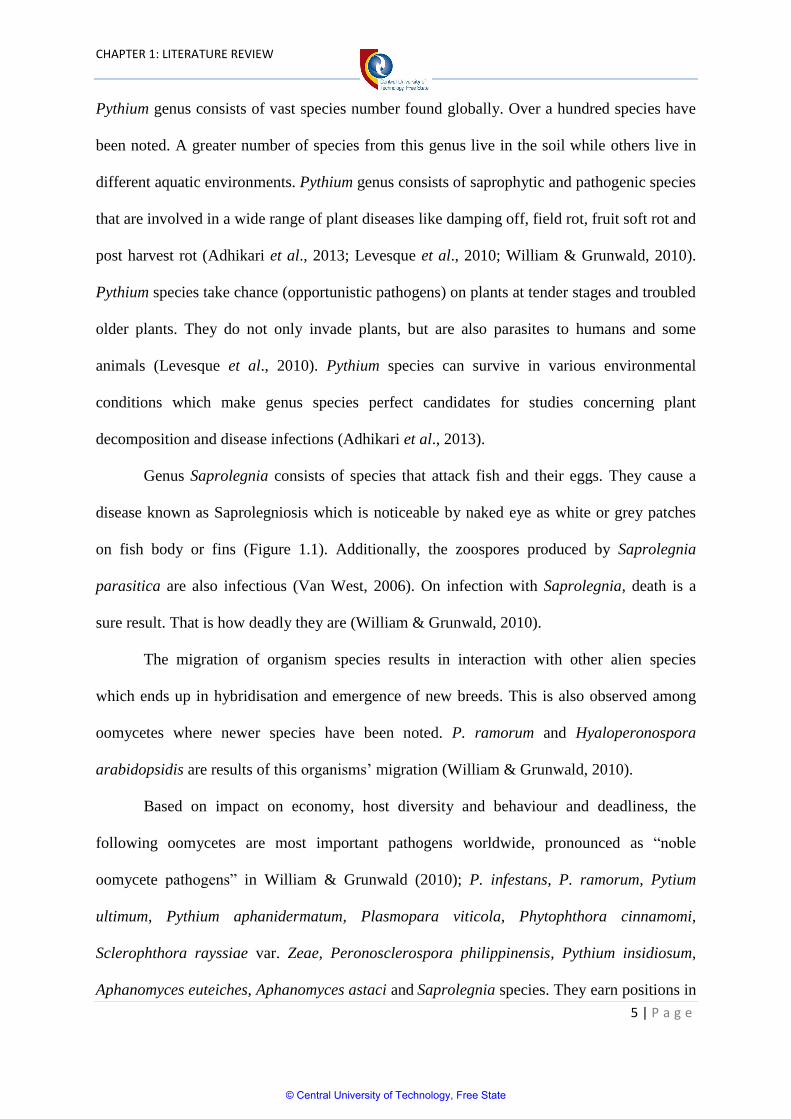
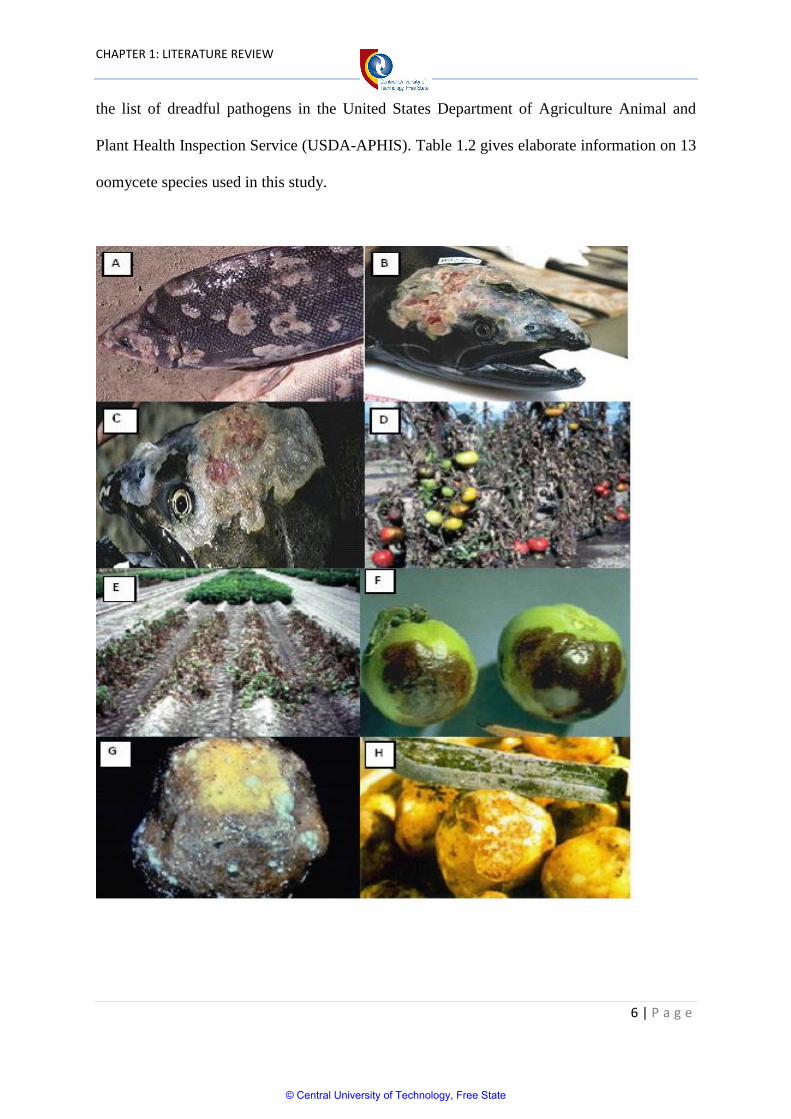
Pythium genus consists of vast species number found globally. Over a hundred species have
been noted. A greater number of species from this genus live in the soil while others live in
different aquatic environments. Pythium genus consists of saprophytic and pathogenic species
that are involved in a wide range of plant diseases like damping off, field rot, fruit soft rot and
post harvest rot (Adhikari et al., 2013; Levesque et al., 2010; William & Grunwald, 2010).
Pythium species take chance (opportunistic pathogens) on plants at tender stages and troubled
older plants. They do not only invade plants, but are also parasites to humans and some
animals (Levesque et al., 2010). Pythium species can survive in various environmental
conditions which make genus species perfect candidates for studies concerning plant
decomposition and disease infections (Adhikari et al., 2013).
Genus Saprolegnia consists of species that attack fish and their eggs. They cause a
disease known as Saprolegniosis which is noticeable by naked eye as white or grey patches
on fish body or fins (Figure 1.1). Additionally, the zoospores produced by Saprolegnia
parasitica are also infectious (Van West, 2006). On infection with Saprolegnia, death is a
sure result. That is how deadly they are (William & Grunwald, 2010).
The migration of organism species results in interaction with other alien species
which ends up in hybridisation and emergence of new breeds. This is also observed among
oomycetes where newer species have been noted. P. ramorum and Hyaloperonospora
arabidopsidis are results of this organisms‟ migration (William & Grunwald, 2010).
Based on impact on economy, host diversity and behaviour and deadliness, the
following oomycetes are most important pathogens worldwide, pronounced as “noble
oomycete pathogens” in William & Grunwald (2010); P. infestans, P. ramorum, Pytium
ultimum, Pythium aphanidermatum, Plasmopara viticola, Phytophthora cinnamomi,
Sclerophthora rayssiae var. Zeae, Peronosclerospora philippinensis, Pythium insidiosum,
Aphanomyces euteiches, Aphanomyces astaci and Saprolegnia species. They earn positions in
© Central University of Technology, Free State
CHAPTER 1: LITERATURE REVIEW
6 | P a g e
the list of dreadful pathogens in the United States Department of Agriculture Animal and
Plant Health Inspection Service (USDA-APHIS). Table 1.2 gives elaborate information on 13
oomycete species used in this study.
© Central University of Technology, Free State
CHAPTER 1: LITERATURE REVIEW
7 | P a g e
Figure 1.1 Pictures of oomycetes destructions (taken from Schumann & D'Arcy, 2005; Van
West, 2006). Pictures A, B and C show Saprolegniosis patches and lethal lesions on the body
and head of fish caused by the oomycete species Sapronelgia declina. Pictures D and E are
tomato and potato plants, F are tomato fruits while G and H are potato tubers. All affected by
Phytophthora infestans (tomato and potato blight).
© Central University of Technology, Free State
CHAPTER 1: LITERATURE REVIEW
8 | P a g e
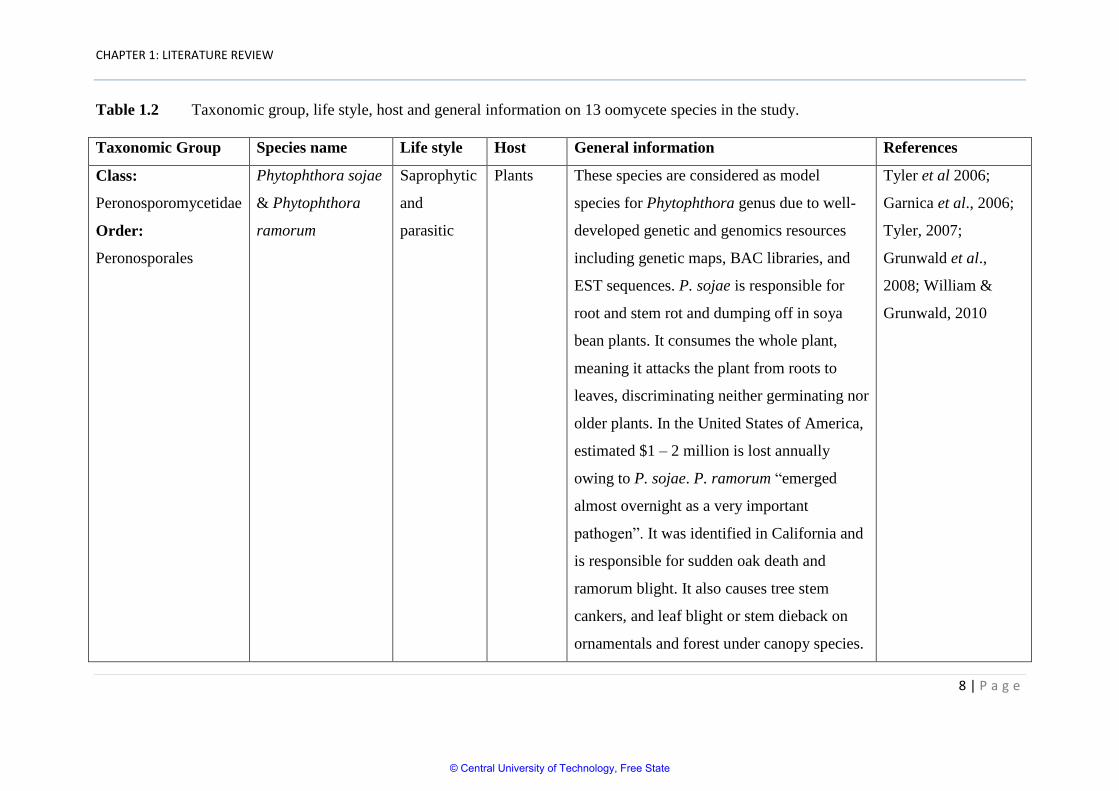
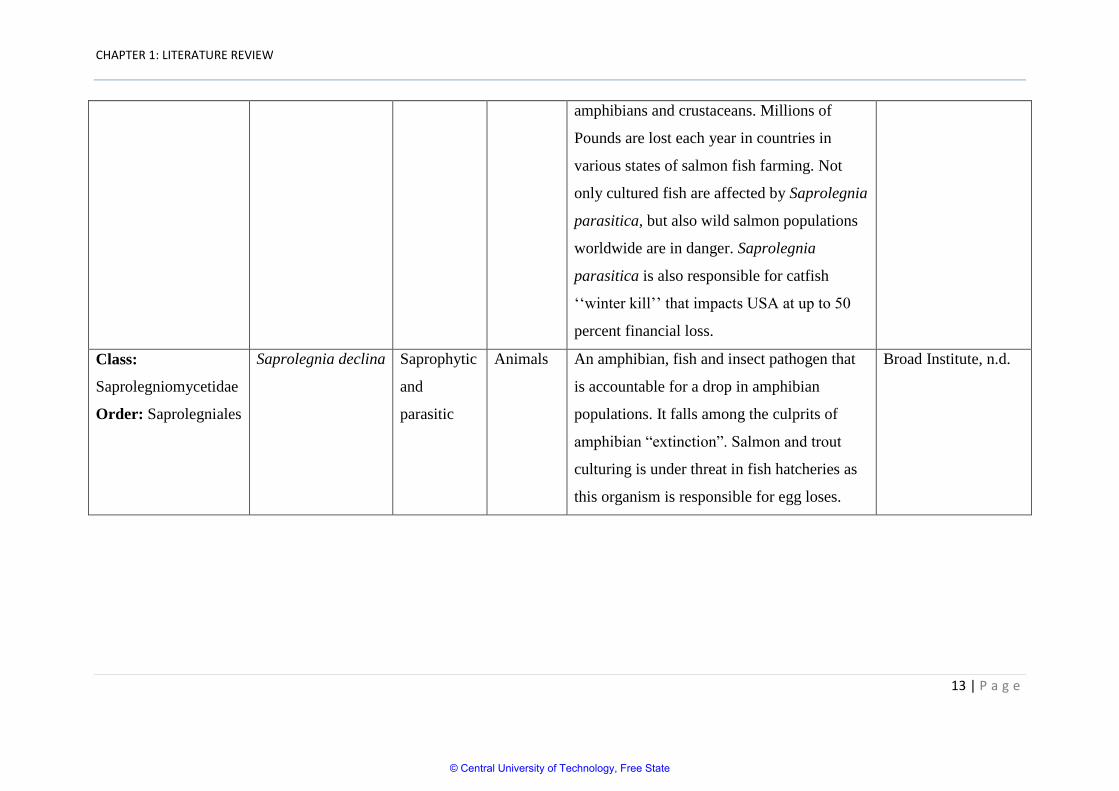
Table 1.2 Taxonomic group, life style, host and general information on 13 oomycete species in the study.
Taxonomic Group Species name Life style Host General information References
Class:
Peronosporomycetidae
Order:
Peronosporales
Phytophthora sojae
& Phytophthora
ramorum
Saprophytic
and
parasitic
Plants These species are considered as model
species for Phytophthora genus due to well-
developed genetic and genomics resources
including genetic maps, BAC libraries, and
EST sequences. P. sojae is responsible for
root and stem rot and dumping off in soya
bean plants. It consumes the whole plant,
meaning it attacks the plant from roots to
leaves, discriminating neither germinating nor
older plants. In the United States of America,
estimated $1 – 2 million is lost annually
owing to P. sojae. P. ramorum “emerged
almost overnight as a very important
pathogen”. It was identified in California and
is responsible for sudden oak death and
ramorum blight. It also causes tree stem
cankers, and leaf blight or stem dieback on
ornamentals and forest under canopy species.
Tyler et al 2006;
Garnica et al., 2006;
Tyler, 2007;
Grunwald et al.,
2008; William &
Grunwald, 2010
© Central University of Technology, Free State
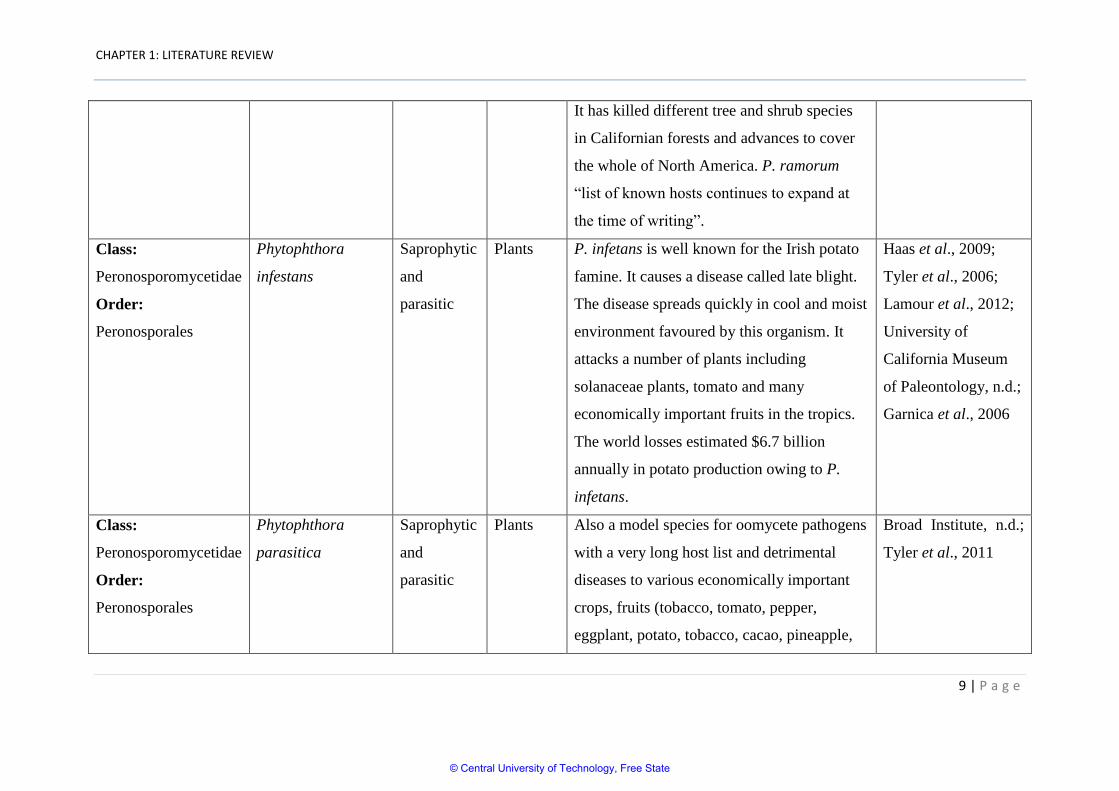
CHAPTER 1: LITERATURE REVIEW
9 | P a g e
It has killed different tree and shrub species
in Californian forests and advances to cover
the whole of North America. P. ramorum
“list of known hosts continues to expand at
the time of writing”.
Class:
Peronosporomycetidae
Order:
Peronosporales
Phytophthora
infestans
Saprophytic
and
parasitic
Plants P. infetans is well known for the Irish potato
famine. It causes a disease called late blight.
The disease spreads quickly in cool and moist
environment favoured by this organism. It
attacks a number of plants including
solanaceae plants, tomato and many
economically important fruits in the tropics.
The world losses estimated $6.7 billion
annually in potato production owing to P.
infetans.
Haas et al., 2009;
Tyler et al., 2006;
Lamour et al., 2012;
University of
California Museum
of Paleontology, n.d.;
Garnica et al., 2006
Class:
Peronosporomycetidae
Order:
Peronosporales
Phytophthora
parasitica
Saprophytic
and
parasitic
Plants Also a model species for oomycete pathogens
with a very long host list and detrimental
diseases to various economically important
crops, fruits (tobacco, tomato, pepper,
eggplant, potato, tobacco, cacao, pineapple,
Broad Institute, n.d.;
Tyler et al., 2011
© Central University of Technology, Free State
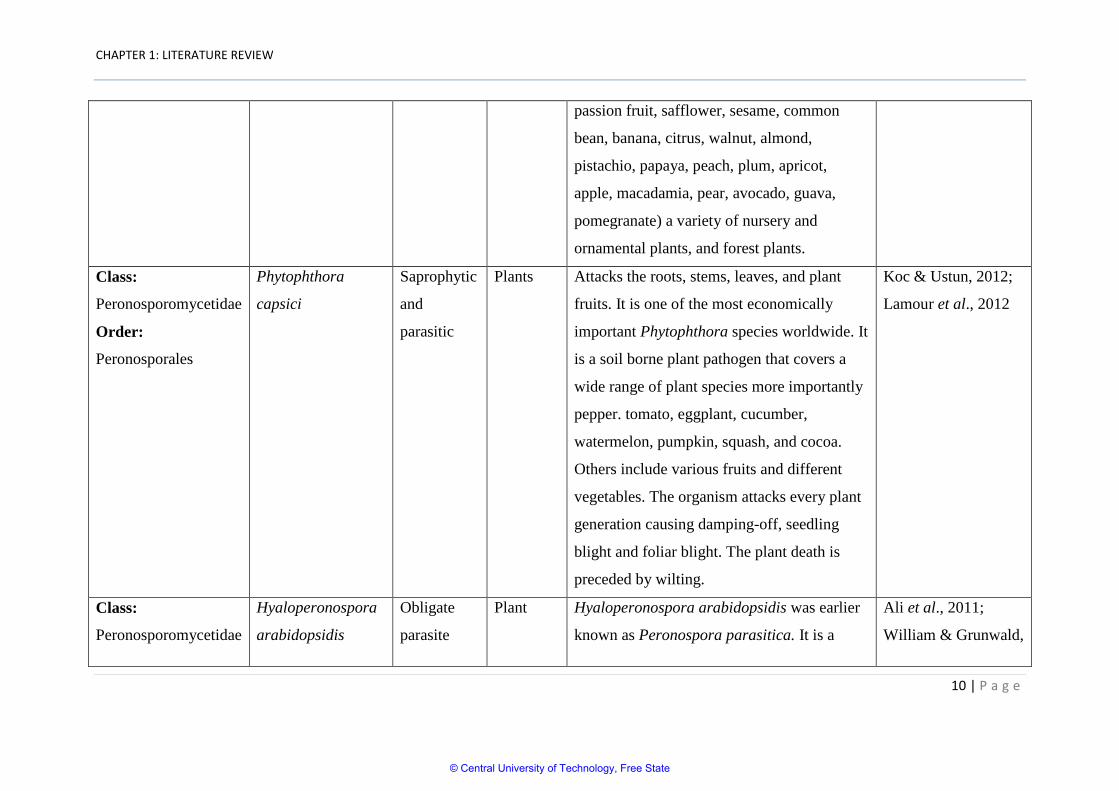
CHAPTER 1: LITERATURE REVIEW
10 | P a g e
passion fruit, safflower, sesame, common
bean, banana, citrus, walnut, almond,
pistachio, papaya, peach, plum, apricot,
apple, macadamia, pear, avocado, guava,
pomegranate) a variety of nursery and
ornamental plants, and forest plants.
Class:
Peronosporomycetidae
Order:
Peronosporales
Phytophthora
capsici
Saprophytic
and
parasitic
Plants Attacks the roots, stems, leaves, and plant
fruits. It is one of the most economically
important Phytophthora species worldwide. It
is a soil borne plant pathogen that covers a
wide range of plant species more importantly
pepper. tomato, eggplant, cucumber,
watermelon, pumpkin, squash, and cocoa.
Others include various fruits and different
vegetables. The organism attacks every plant
generation causing damping-off, seedling
blight and foliar blight. The plant death is
preceded by wilting.
Koc & Ustun, 2012;
Lamour et al., 2012
Class:
Peronosporomycetidae
Hyaloperonospora
arabidopsidis
Obligate
parasite
Plant Hyaloperonospora arabidopsidis was earlier
known as Peronospora parasitica. It is a
Ali et al., 2011;
William & Grunwald,
© Central University of Technology, Free State
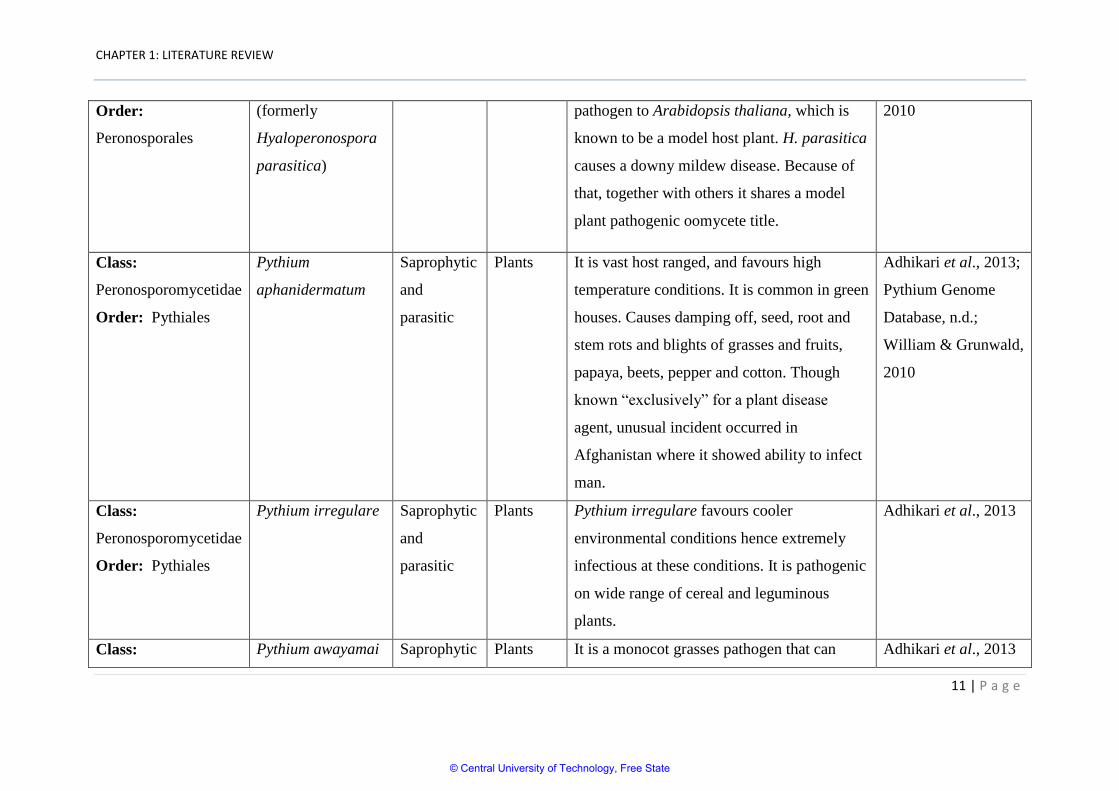
CHAPTER 1: LITERATURE REVIEW
11 | P a g e
Order:
Peronosporales
(formerly
Hyaloperonospora
parasitica)
pathogen to Arabidopsis thaliana, which is
known to be a model host plant. H. parasitica
causes a downy mildew disease. Because of
that, together with others it shares a model
plant pathogenic oomycete title.
2010
Class:
Peronosporomycetidae
Order: Pythiales
Pythium
aphanidermatum
Saprophytic
and
parasitic
Plants It is vast host ranged, and favours high
temperature conditions. It is common in green
houses. Causes damping off, seed, root and
stem rots and blights of grasses and fruits,
papaya, beets, pepper and cotton. Though
known “exclusively” for a plant disease
agent, unusual incident occurred in
Afghanistan where it showed ability to infect
man.
Adhikari et al., 2013;
Pythium Genome
Database, n.d.;
William & Grunwald,
2010
Class:
Peronosporomycetidae
Order: Pythiales
Pythium irregulare Saprophytic
and
parasitic
Plants Pythium irregulare favours cooler
environmental conditions hence extremely
infectious at these conditions. It is pathogenic
on wide range of cereal and leguminous
plants.
Adhikari et al., 2013
Class: Pythium awayamai Saprophytic Plants It is a monocot grasses pathogen that can Adhikari et al., 2013
© Central University of Technology, Free State
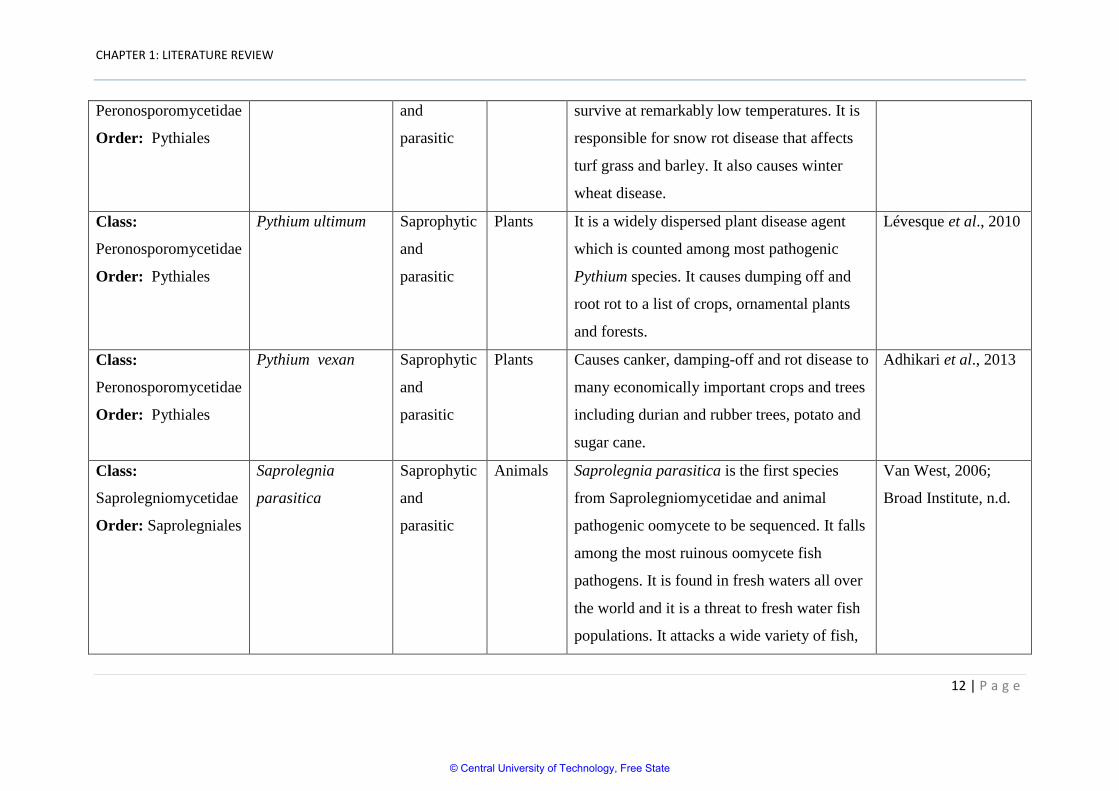
CHAPTER 1: LITERATURE REVIEW
12 | P a g e
Peronosporomycetidae
Order: Pythiales
and
parasitic
survive at remarkably low temperatures. It is
responsible for snow rot disease that affects
turf grass and barley. It also causes winter
wheat disease.
Class:
Peronosporomycetidae
Order: Pythiales
Pythium ultimum Saprophytic
and
parasitic
Plants It is a widely dispersed plant disease agent
which is counted among most pathogenic
Pythium species. It causes dumping off and
root rot to a list of crops, ornamental plants
and forests.
Lévesque et al., 2010
Class:
Peronosporomycetidae
Order: Pythiales
Pythium vexan Saprophytic
and
parasitic
Plants Causes canker, damping-off and rot disease to
many economically important crops and trees
including durian and rubber trees, potato and
sugar cane.
Adhikari et al., 2013
Class:
Saprolegniomycetidae
Order: Saprolegniales
Saprolegnia
parasitica
Saprophytic
and
parasitic
Animals Saprolegnia parasitica is the first species
from Saprolegniomycetidae and animal
pathogenic oomycete to be sequenced. It falls
among the most ruinous oomycete fish
pathogens. It is found in fresh waters all over
the world and it is a threat to fresh water fish
populations. It attacks a wide variety of fish,
Van West, 2006;
Broad Institute, n.d.
© Central University of Technology, Free State
CHAPTER 1: LITERATURE REVIEW
13 | P a g e
amphibians and crustaceans. Millions of
Pounds are lost each year in countries in
various states of salmon fish farming. Not
only cultured fish are affected by Saprolegnia
parasitica, but also wild salmon populations
worldwide are in danger. Saprolegnia
parasitica is also responsible for catfish
„„winter kill‟‟ that impacts USA at up to 50
percent financial loss.
Class:
Saprolegniomycetidae
Order: Saprolegniales
Saprolegnia declina Saprophytic
and
parasitic
Animals An amphibian, fish and insect pathogen that
is accountable for a drop in amphibian
populations. It falls among the culprits of
amphibian “extinction”. Salmon and trout
culturing is under threat in fish hatcheries as
this organism is responsible for egg loses.
Broad Institute, n.d.
© Central University of Technology, Free State
CHAPTER 1: LITERATURE REVIEW
14 | P a g e
1.2 Cytochrome P450 monooxygenases
1.2.1 Origin of name “P450”
The trails of cytochrome P450 monooxygenases were spotted as early as 1950s. It was
evident that there was indeed a catalyst responsible for oxidation of non-polar xenobiotics in
mammals however the enzyme was unknown. The spectrometry of microsomal haem
proteins that showed to form carbon monoxide complexes when pre-treated with some
reductases provided a green light. In 1958, a breakthrough was made when a membrane
bound reduced pigment of absorbance 450nm (nanometre) was observed in experimental
animals‟ microsomal protein fractions that have formed complexes with carbon monoxide.
This pigment was later identified as a P450 hemoprotein. That is how these proteins acquired
their name; from the peak absorbance when in complex with carbon monoxide. The
hypothesis is that the resultant absorbance is a result of the shift between cysteine and carbon
monoxide ligands of the haem in the enzyme. However, cytochrome P450 monooxygenases
are not the only haem proteins with the peak absorbance of 450nm. Other haem proteins are
nitric oxide, chloroperoxidases and protein H450 (Danielson, 2002).
Due to diversity, P450s were to be given names. The standard P450 naming that was
established by the P450 Nomenclature Committee is used to give identification to unnamed
P450s. The procedure is well explained by Danielson (2002). Since the discovery of P450s
their numbers have been escalating. At least over 6500 P450s have been estimated
(Danielson, 2002; Lamb et al., 2007; Urlacher & Eiben, 2006). On the growing P450
research, the numbers should have dramatically increased.
© Central University of Technology, Free State
CHAPTER 1: LITERATURE REVIEW
15 | P a g e
1.2.2 Catalytic activity
Cytochrome P450 monooxygenases (P450s) is a super family haem-proteins distributed
throughout all classified biological kingdoms. P450s are also observed as metalloenzymes in
Ellis and Raner (1995) due to their iron constituent in the haem group (metal ion cofactor).
They are involved in catalysis of oxidative biotransformation of a wide range of exogenous
substrates including drugs, carcinogens and environmental pollutants and endogenous
substrates including vitamins and steroids (Graves et al., 2013; Hlavica, 2012; Sohl &
Guengerich). Table 1.3 shows a list of examples of P450 catalysed reactions. Eukaryotes bear
most numbers of P450s as compared to prokaryotes (Pazmino et al., 2010).
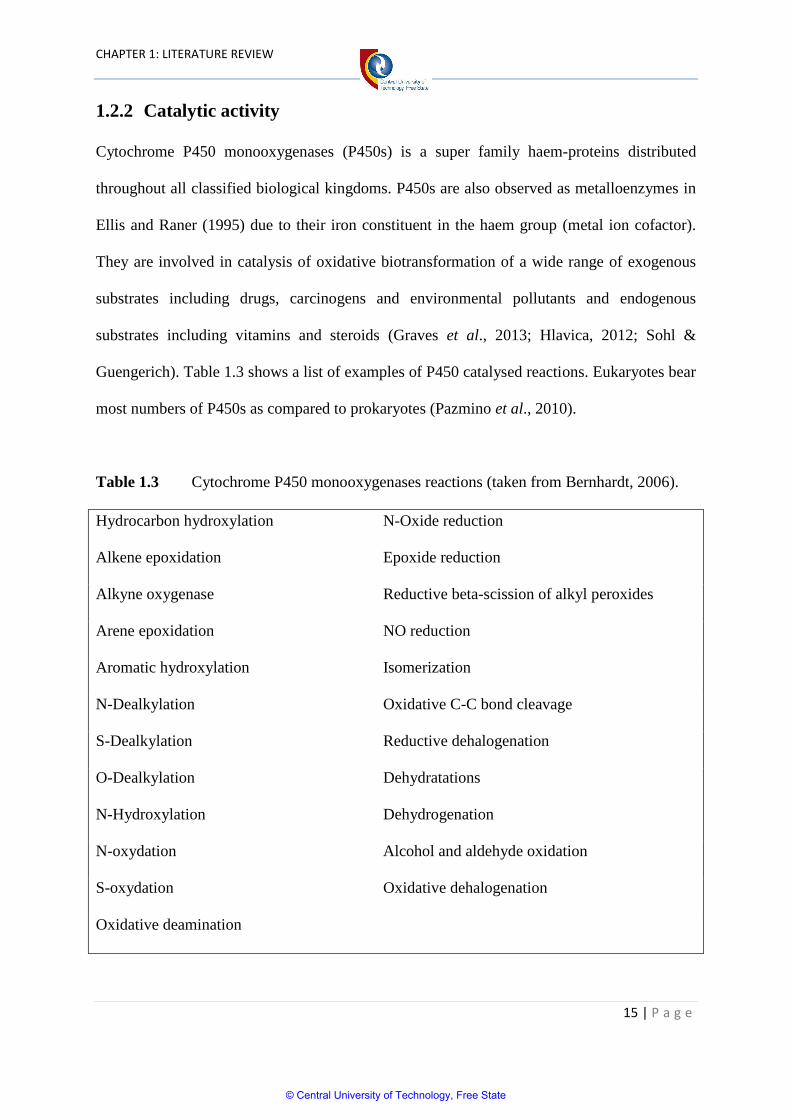
Table 1.3 Cytochrome P450 monooxygenases reactions (taken from Bernhardt, 2006).
Hydrocarbon hydroxylation N-Oxide reduction
Alkene epoxidation Epoxide reduction
Alkyne oxygenase Reductive beta-scission of alkyl peroxides
Arene epoxidation NO reduction
Aromatic hydroxylation Isomerization
N-Dealkylation Oxidative C-C bond cleavage
S-Dealkylation Reductive dehalogenation
O-Dealkylation Dehydratations
N-Hydroxylation Dehydrogenation
N-oxydation Alcohol and aldehyde oxidation
S-oxydation Oxidative dehalogenation
Oxidative deamination
© Central University of Technology, Free State
CHAPTER 1: LITERATURE REVIEW
16 | P a g e
The following are examples of some of the important roles of P450s in plants and animals.
Mammalian P450s are involved in processes including generation of steroids, fatty acids
hydroxylation and drug metabolism. However, they can be of some undesirable consequences
where they can activate dormant malignant substances (procarcnogens and promutagens).
Fungal P450s are crucial for sterol synthesis (Kelly & Kelly, 2013) and aid the organism to
acclimatise to host environment during their invasion. In plants they are required for various
purposes like synthesis of hormones, colour in their blossoms and defensive mechanisms
against pathogens (Danielson, 2002). In arthropods they also play a terminal role in defence
against chemicals and aid in development and reproduction (Danielson, 2002).
P450s were thought to be proto-haem IX also known as haem B or Iron
protoporphyrin IX containing type of proteins like haemoglobin and myoglobin (Waterman,
1995). Comparison was made and following differences were observed. Haemoglobin
produced absorbance 420 nm when reduced with carbon monoxide to 450 nm of the P450s.
P450s consist of a thiolate group inherited from cysteine while haemoglobin consists of an
imidazole group from histidine at the same position in their haem. Based on function,
haemoglobin binds and releases oxygen and shows no reductive properties but P450s on the
other hand reduce oxygen. This distinctive property of P450s from haemoglobin is enabled
by the thiolate group. The thiolate group attaches iron to cysteine. This configuration is
believed to hinder the redox potential of haem iron (Waterman, 1995).
1.2.3 Distribution of P450s and expression in animals
In studied animal species (higher eukaryotes) including humans, most P450s are found in the
liver. But there is still other tissue distribution (Graves et al., 2013; Capdevila & Falck,
2002). In these higher animals P450s are membrane bound and most reside in the
© Central University of Technology, Free State
CHAPTER 1: LITERATURE REVIEW
17 | P a g e
endoplasmic reticulum while others are found in the mitochondria. Bacterial P450s are found
in solution in the cytoplasm (Waterman, 1995). Higher animal P450 expression differs in
terms of quantity, and family type in different organs (Graves et al., 2013; Capdevila &
Falck, 2002). For instance in Human, CYP2J2 is highly expressed in the heart, liver, kidney,
and other tissues. In murine, CYP2J5 is mostly detected in the kidney and liver, CYP2J6 is
more in small intestine while CYP2J9 is mostly expressed in the brain (Graves et al., 2013).
P450 expression is age and gender dependant. Different P450 enzymes expression is also
determined by drugs, environmental chemicals, hormones, cytokines, diet, starvation, and
ailments like diabetes mellitus and hypertension (Capdevila & Falck, 2002).
1.2.4 Where do P450s fall among oxidoreductases family
P450s are oxidoreductase enzymes, also known as redox enzymes. These enzymes are
involved in transfer of electrons between molecules (redox reactions). For this to happen, a
cofactor (that could be flavins, metal-ions, hemes and pyrroloquinoline quinone (PQQ)) is
required to aid the transfer. However, other redox reactions can proceed without a cofactor
but most of these reactions need one (Pazmino et al., 2010).
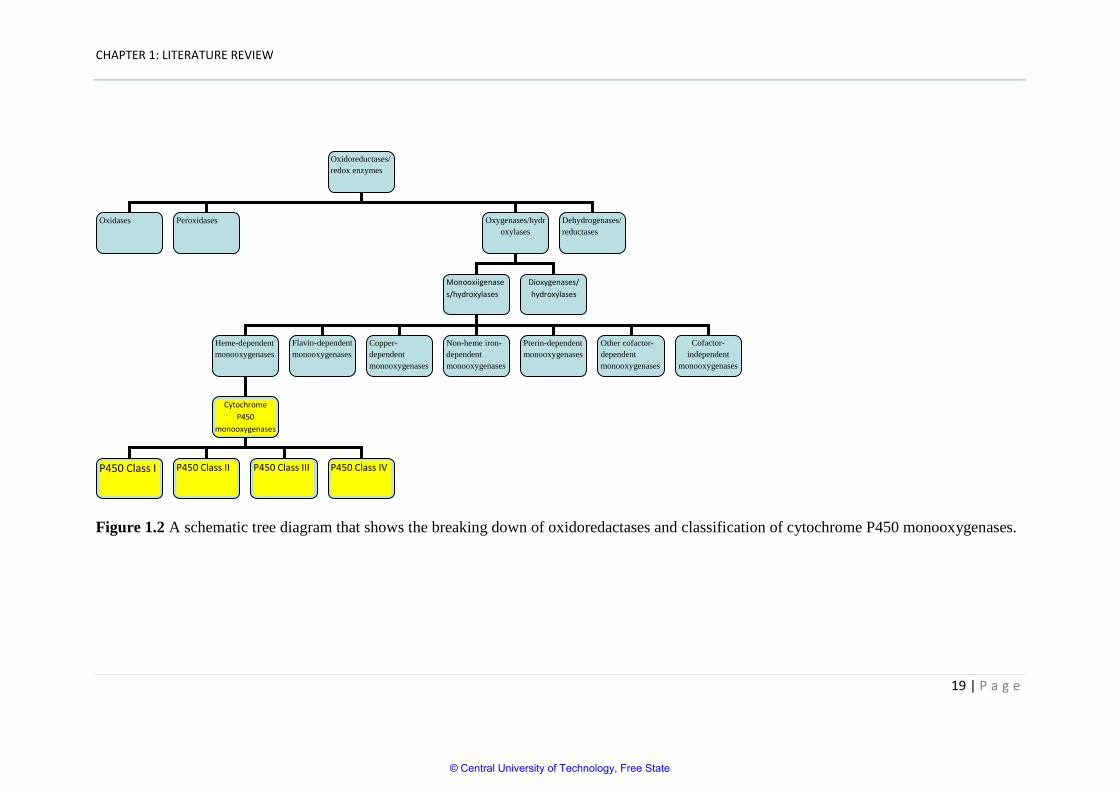
Oxidoreductases are divided in to four sub-groups: oxidases, peroxidases,
oxygenases/hydroxylases and dehydrogenases/reductases (Figure 1.2) (Pazmino et al., 2010).
Oxygenases and hydroxylases are involved in insertion of one oxygen or two oxygen atoms
into an organic substrate where molecular oxygen is an oxygen donor. The insertion of one
oxygen atom to the substrate is done by monooxygenases/hydroxylases, and the insertion of
two oxygen atoms, is done by dioxygenases/hydroxylases. These are two types of enzymes
observed in sub-group oxygenases and hydroxylases (Figure 1.2). Monooxygenases
comprises of seven members (Heme-dependent monooxygenases, Flavin-dependent
© Central University of Technology, Free State
CHAPTER 1: LITERATURE REVIEW
18 | P a g e
monooxygenases, Copper-dependent monooxygenases, Non-heme iron-dependent
monooxygenases, Pterin-dependent monooxygenases, other cofactor-dependent
monooxygenases and cofactor-independent monooxygenases) (Figure 1.2). Among seven
members of monooxygenases, P450s are referred to as “haem-dependant monooxygenases”
based on the type of cofactor needed for the enzymes to carry out their catalytic function
(Pazmino et al., 2010).
1.2.5 Classification of P450s
There are four classes of P450s observed (Figure 1.2); classes I, II, III and IV (Pazmino et al.,
2010). The classification is based on their electron sources (NAD (P) H, ferredoxin and
ferredoxin reductase). Class I P450s are made up of three non-linked residues being the haem
group, ferredoxin and ferredoxine reductase. These are common in bacteria (in cytoplasm
solution) and in mitochondria (bound to membrane). Class IIs consist of components; the
haem group, and a reductase group with a cofactor flavin adenine dinucleotide/flavin
mononucleotide (FAD/FMN). Unlike class I that consists of soluble and bound P450
enzymes, class II are all anchored to membranes at their sites. Class III are the same as class
II however, in the case of class III the constituents are tethered in a chain. This feature
enhances the reactivity of the class IIIs. The reaction rate is far better than that in separate
residues. As class I, this class consists of free and bound members of P450s hence found in
prokaryotes and eukaryotes. P450 class IV also consists of three components as class I (the
haem group, ferredoxin and ferredoxine reductase just to remind). Nonetheless, in class IV
these members are linked in a chain, the similar fashion to that of class III (Pazmino et al.,
2010).
© Central University of Technology, Free State
CHAPTER 1: LITERATURE REVIEW
19 | P a g e
Figure 1.2 A schematic tree diagram that shows the breaking down of oxidoredactases and classification of cytochrome P450 monooxygenases.
Oxidoreductases/
redox enzymes
Oxidases Peroxidases Oxygenases/hydr
oxylases
Dehydrogenases/
reductases
Monooxiigenase
s/hydroxylases
Dioxygenases/
hydroxylases
Heme-dependent
monooxygenases
Other cofactor-
dependent
monooxygenases
Pterin-dependent
monooxygenases
Non-heme iron-
dependent
monooxygenases
Copper-
dependent
monooxygenases
Flavin-dependent
monooxygenases
Cofactor-
independent monooxygenases
Cytochrome
P450
monooxygenases
P450 Class I P450 Class IV P450 Class III P450 Class II
© Central University of Technology, Free State
CHAPTER 1: LITERATURE REVIEW
20 | P a g e
1.2.6 Application of cytochrome P450 monooxygenases
Though P450s have been known to exist for quite a long time, it was not long when
researchers‟ interests arose. Researchers were tantalised by P450s‟ ability to activate dormant
carbon atoms and their regio and stereo selective oxygenation of organic substrates. Among
opportunities perceived were short cuts to chemical synthesis, pollution reduction and to cut
costs. P450s have been successfully applied in processes like synthesis of drugs (antibiotics
and anti-cancer), colorants, flavourings, fragrances, chemicals and fighting of pollution
(bioremediation) (Caswell et al., 2013; Munro et al., 2006; Urlacher & Eiben, 2006). The
mechanisms for the above processes have been described elsewhere.
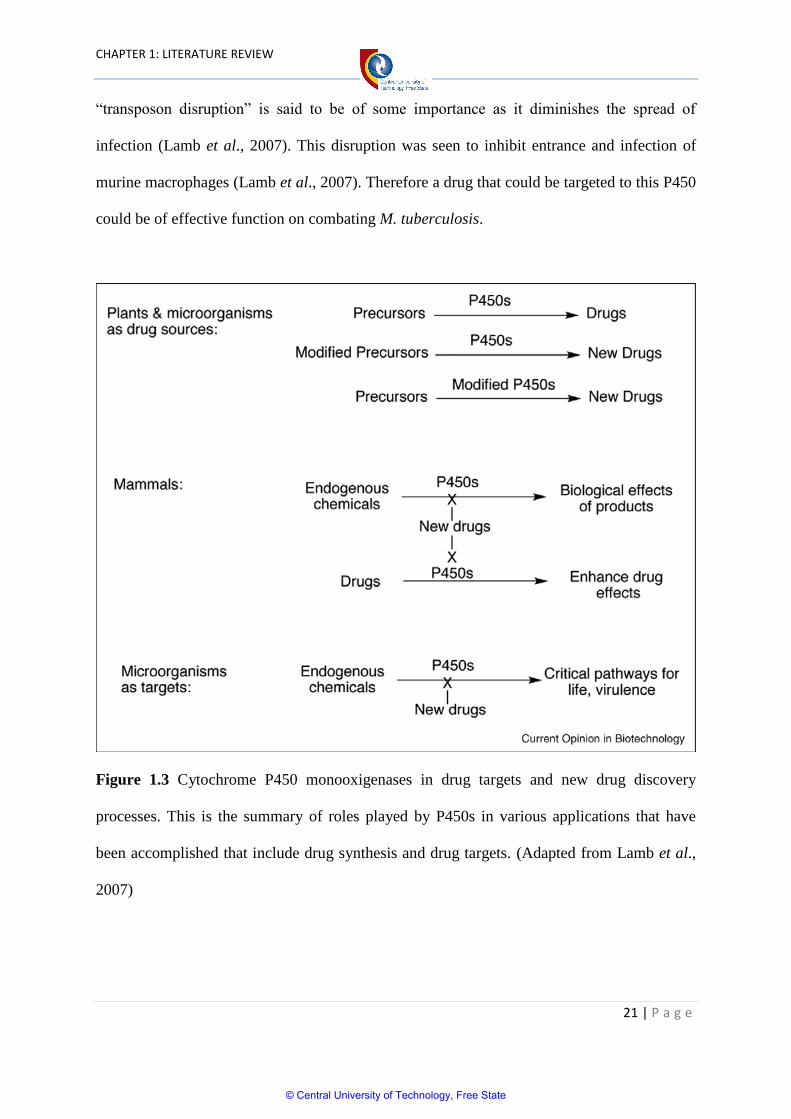
Application of P450s as drug targets has also been practised as an alternative to
combat microbial infections (Figure 1.3). This has been especially triggered by immergence
of new pathogenic microbial species and resistance of known pathogens to commonly used
drugs. Therefore, sequenced pathogens genomes are being explored to identify the possibility
of using their P450s as drug targets.
For common life threatening pathogens, studies are in progress to explore the
possibility of utilizing their P450s as drug targets. One successfully applied P450 is CYP51
in fungi as a target for the azoles (Kelly & Kelly, 2013). The importance of this CYP51 in
fungi metabolism provides a good chance to hinder their survival. Recent genome sequencing
of Trypanosoma cruzi and Leishmania major, agents of African sleeping sickness, Chagas
disease and leishmaniasis respectively, has also shown the presence of CYP51 in their
genome (Lamb et al., 2007). This rings a bell that use of azoles on these pathogens could be
tried as there is currently no vaccine for prevention. Moreover, currently used drugs are of
little impact on these pathogens and they rather result in toxic built up. CYP128A1 has been
identified in Mycobacterium tuberculosis being vital for growth of this pathogen and its
© Central University of Technology, Free State
CHAPTER 1: LITERATURE REVIEW
21 | P a g e
“transposon disruption” is said to be of some importance as it diminishes the spread of
infection (Lamb et al., 2007). This disruption was seen to inhibit entrance and infection of
murine macrophages (Lamb et al., 2007). Therefore a drug that could be targeted to this P450
could be of effective function on combating M. tuberculosis.
Figure 1.3 Cytochrome P450 monooxigenases in drug targets and new drug discovery
processes. This is the summary of roles played by P450s in various applications that have
been accomplished that include drug synthesis and drug targets. (Adapted from Lamb et al.,
2007)
© Central University of Technology, Free State
CHAPTER 1: LITERATURE REVIEW
22 | P a g e
1.2.7 Catalytic mechanism
The catalytic property of P450s is aided by an electron supply from a coenzyme. The typical
electron supplier for eukaryotic metabolism is NAD (P) H reductase (reduced Nicotinamide
adenine dinucleotide phosphate) while prokaryotes need ferredoxin and ferredoxin reductase
(Lamb et al., 2007). The general catalytic nature of P450s is shown in figure 1.4.
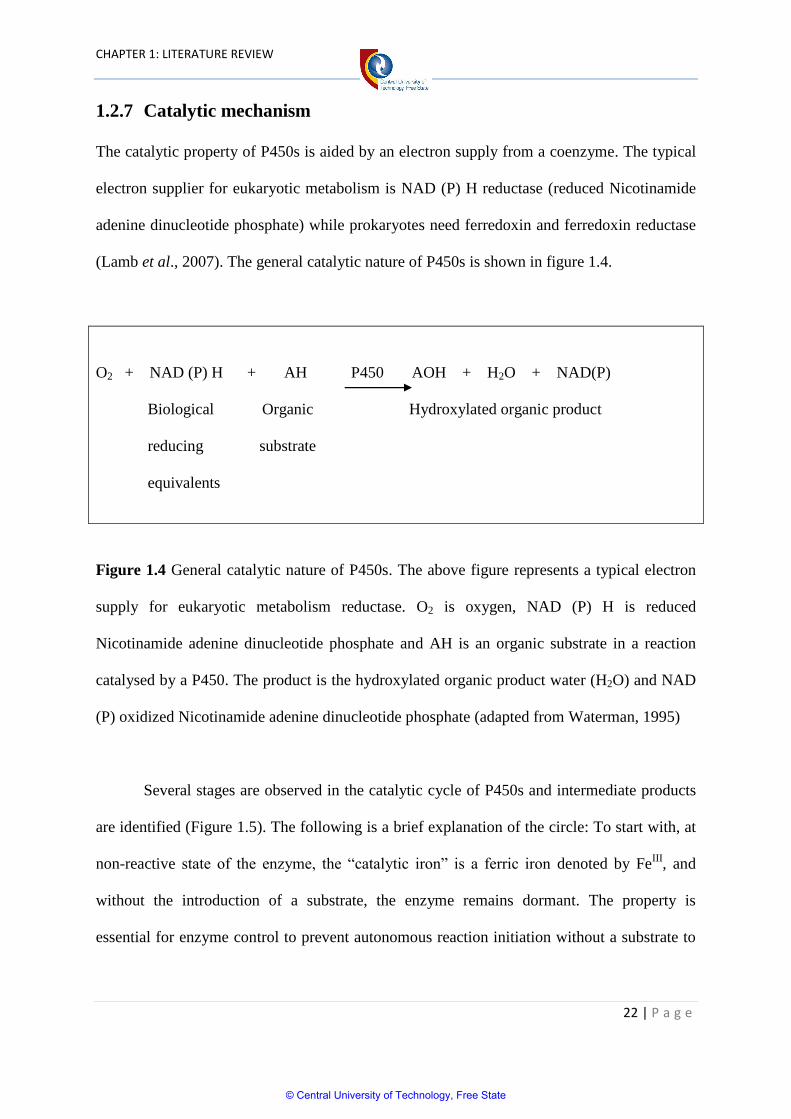
O2 + NAD (P) H + AH P450 AOH + H2O + NAD(P)
Biological Organic Hydroxylated organic product
reducing substrate
equivalents
Figure 1.4 General catalytic nature of P450s. The above figure represents a typical electron
supply for eukaryotic metabolism reductase. O2 is oxygen, NAD (P) H is reduced
Nicotinamide adenine dinucleotide phosphate and AH is an organic substrate in a reaction
catalysed by a P450. The product is the hydroxylated organic product water (H2O) and NAD
(P) oxidized Nicotinamide adenine dinucleotide phosphate (adapted from Waterman, 1995)
Several stages are observed in the catalytic cycle of P450s and intermediate products
are identified (Figure 1.5). The following is a brief explanation of the circle: To start with, at
non-reactive state of the enzyme, the “catalytic iron” is a ferric iron denoted by FeIII
, and
without the introduction of a substrate, the enzyme remains dormant. The property is
essential for enzyme control to prevent autonomous reaction initiation without a substrate to
© Central University of Technology, Free State
CHAPTER 1: LITERATURE REVIEW
23 | P a g e
work on. This P450 enzyme behaviour is solely on the thiolate group that links cysteine to the
haem (Mclntosh et al., 2014; Pazmino et al., 2010).
On substrate (organic substrate) encounter, the reaction commences. The involved
mechanisms enable an electro transfer by the related coenzyme (a reductase) there by
reducing ferric iron to ferrous (FeII). The step that follows is the binding of molecular oxygen
to ferrous iron resulting to an oxy-P450 complex intermediate known as “ferric superoxide
complex”. The second electron transfer by the reductase produces “iron peroxo
intermediate”.
There is a proton supply to the intermediates produced. The first proton supply is on
iron peroxo intermediate (iron peroxo intermediate protonation) which yields what is called
iron hydroperoxy intermediate. The second protonation is on the resultant intermediate, iron
hydroperoxy intermediate. This protonation results in breaking down of the O-O bond
making a potent enzyme compound (compound I). Compound I adds an oxygen atom to the
substrate forming compound II and an enzyme product complex. Finally the product is
released and the enzyme gets back to original resting state (Mclntosh et al., 2014; Pazmino et
al., 2010).
The main players in P450 catalytic cycle are the associated reductases and the haem
group. However, the reaction would not be smooth in the absence of other residues.
Threonine facilitates proton addition to iron-peroxo and iron hydroperoxy compounds and
enables O-O cleavage. Cysteine, universally conserved P450 residue with some exceptions
(Syed & Mashele, 2014), holds haem in place as they are fastened together by a thiolate. It
also boosts O-O iron hyroperoxy bond intermediate. Thiolate, as said before, hinders the
redox potential of haem group hence regulating the enzyme to wait for substrate (Mclntosh et
al., 2014).
© Central University of Technology, Free State
CHAPTER 1: LITERATURE REVIEW
24 | P a g e
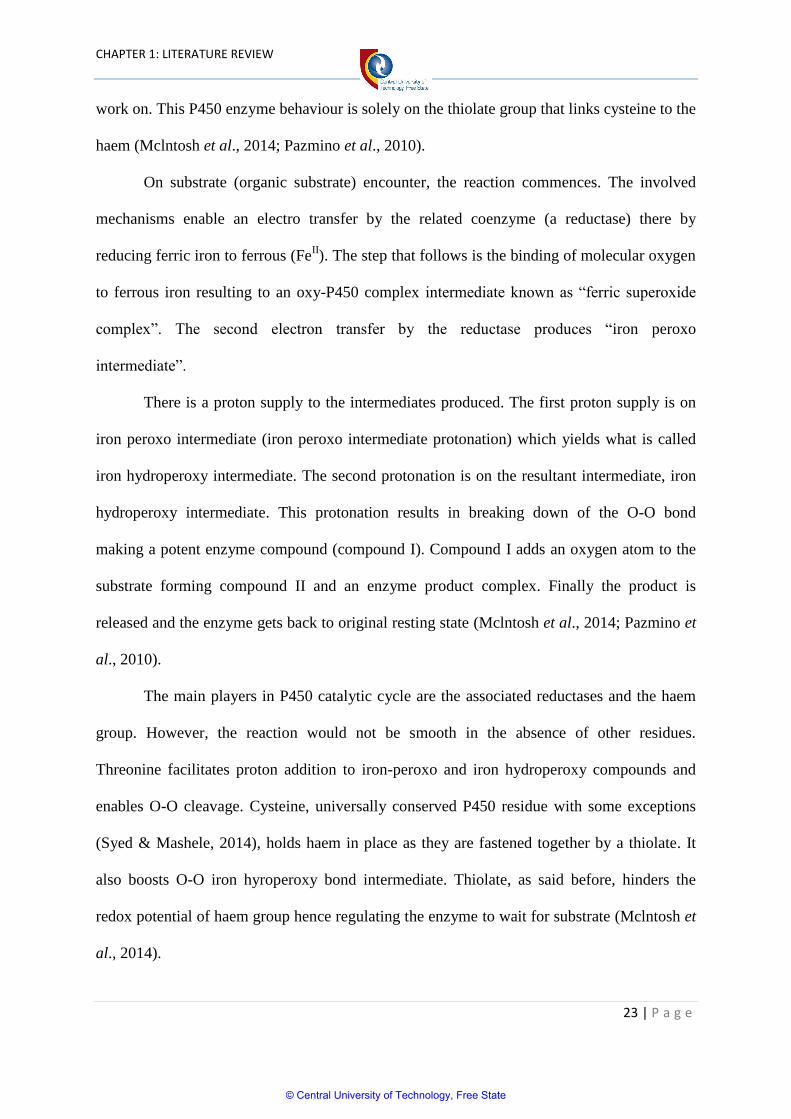
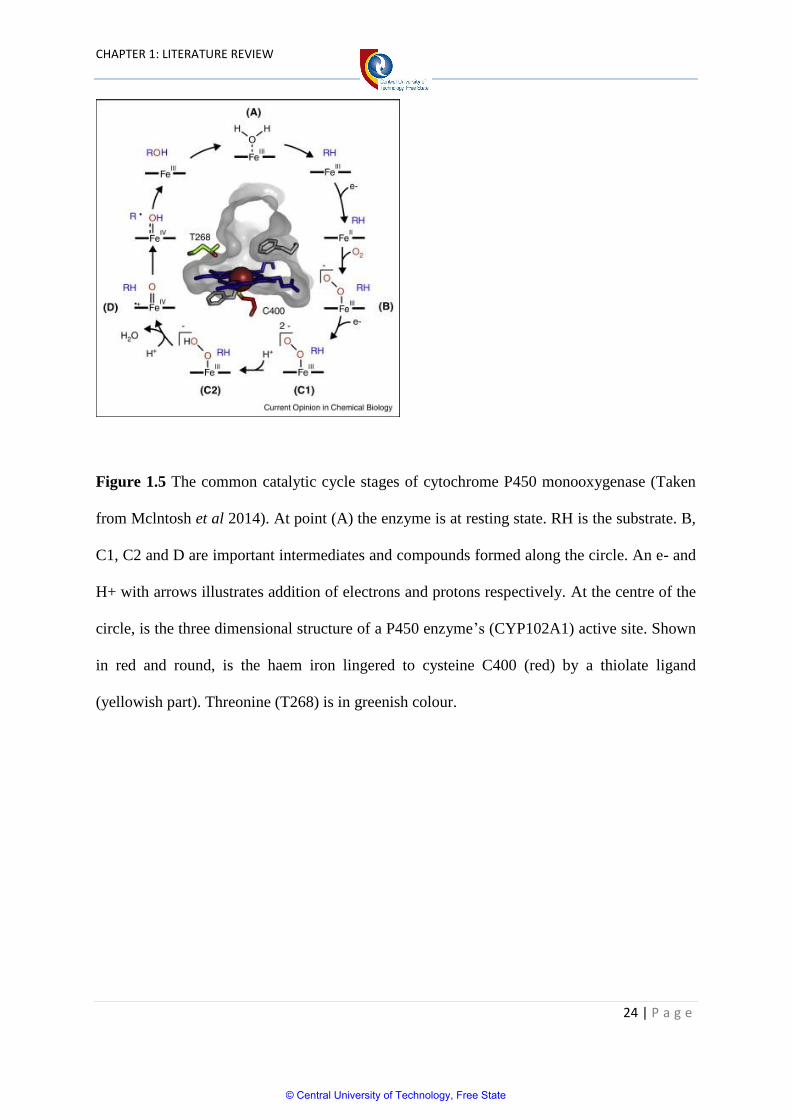
Figure 1.5 The common catalytic cycle stages of cytochrome P450 monooxygenase (Taken
from Mclntosh et al 2014). At point (A) the enzyme is at resting state. RH is the substrate. B,
C1, C2 and D are important intermediates and compounds formed along the circle. An e- and
H+ with arrows illustrates addition of electrons and protons respectively. At the centre of the
circle, is the three dimensional structure of a P450 enzyme‟s (CYP102A1) active site. Shown
in red and round, is the haem iron lingered to cysteine C400 (red) by a thiolate ligand
(yellowish part). Threonine (T268) is in greenish colour.
© Central University of Technology, Free State
CHAPTER 1: LITERATURE REVIEW
25 | P a g e
1.3 Study aim
Knowledge about oomycetes is still scares regardless of evident existence and prominent
hazards seen in agriculture. Oomycetes are big threat to world‟s economy. However, genome
sequencing of oomycetes pathogens has provided a better understanding on these pathogens.
So far some knowledge has been dug out in various aspects including pathogenesis,
evolutionary relation and different genes of pathogenic importance (Broad Institute; Soanes
et al., 2007). This could also enable further studies on how to control these organisms
effective as they have been a hard nut to crack.
The aim of this study was to perform a systemic analysis P450s in 13 oomycete
species which 11 and 2 are plants and animal pathogens respectively from oomycete sub
classes Peronosporomycetidae and Saprolegniomycetidae. Namely; P. sojae, P. ramorum, P.
infestans, P. parasitica, P. capsici, P. awayamai, P. irregular, P. aphanidermatum, P.
ultimum, P. vexan, H. parasitica, S. declina and S. parasitica.
© Central University of Technology, Free State
CHAPTER 1: LITERATURE REVIEW
26 | P a g e
1.4 References
Adhikari, B.N., Hamilton, J. P., Zerillo, M. M., Tisserat, N., Levesque, C. A., Buell, R.
(2013). Comparative Genomics Reveals Insight into Virulence Strategies of Plant Pathogenic
Oomycetes. PLOS ONE, 8(10): 1-15.
Ali, S. (2011). Identification of effectors with avirulence functions in the pathogenic barley
smut fungus, using marker based approaches and comparison among genomes of related
species. The University of British Columbia. Available from:
Circle.ubc.ca/bitstream/handle/2429. [Accessed: 20/04/2015]
Beakes, W. G., Sekimoto, S. (2009). The evolutionary phylogeny of oomycetes - insights
gained from studies of holocarpic parasites of algae and invertebrates. Oomycete Genetics
and Genomics: Diversity, Interactions, and Research Tools. Eds. Lamour, K., Kamoun, S.
John Wiley & Sons, Inc. Available from: http://www.academia.edu. [Accessed: 29/11/2014]
Beakes, W. G., Glockling, S. L., Sekimoto, S. (2011). The evolutionary phylogeny of the
oomycete “fungi”. Protoplasma, 249: 3–19.
Bernhardt, R. (2006). Cytochromes P450 as versatile biocatalysts. Journal of Biotechnology,
124: 128–145.
Broad Institute. (n. d). Saprolegnia parasitica CBS 223.65. Available from:
http://www.broadinstitute.org/annotation/genome/Saprolegnia_parasitica/GenomeDescription
s.html#<i>Saprolegnia_declina</i>_VS20 [Accessed: 29/11/2014]
© Central University of Technology, Free State
CHAPTER 1: LITERATURE REVIEW
27 | P a g e
Capdevila, J. H., Falck, J. R. (2002). Biochemical and molecular properties of the
cytochrome P450 arachidonic acid monooxygenases. Prostaglandins & other Lipid
Mediators, 68–69: 325–344.
Caswell, J. M., O‟Neill, M., Taylor, S. J. C., Moody, T. S. (2013). Engineering and
application of P450 monooxygenases in pharmaceutical and metabolite synthesis. Chemical
Biology, 17: 271–275.
Cooke, D. E. L., Drenth, A., Duncan, J. M., Wagels, G., Brasier, C. M. (2000). A Molecular
Phylogeny of Phytophthora and Related Oomycetes. Fungal Genetics and Biology 30: 17–
32.
Danielson, P. B. (2002). The Cytochrome P450 Superfamily: Biochemistry, Evolution and
Drug Metabolism in Humans. Current Drug Metabolism, 3(6): 561 – 596.
Department of Botany University of Hawai‟I at Manoa (DBUHM). (n. d). The Origin of
Plant Pathology and The Potato Famine, and Other Stories of Plant Diseases. Available from:
http://www.botany.hawaii.edu/faculty/wong/BOT135/LECT06.HTM [Accessed: 13/05/2014]
Ellis, W. R. Jr., Raner, G. M. (1995). Metaloenzymes. Molecular biology and biotechnology
Meyers, R. A. (Ed) VCH Publishers, Inc. 220 East New York, NY 10010 USA. p. 546 – 549.
Garnica, D. P., Pinzon, A. M., Quesada-Ocampo, L. M., Bernal, A. J., Emiliano Barreto, E.,
Grünwald N. J., Restrepo, S. (2006). Survey and analysis of microsatellites from transcript
sequences in Phytophthora species: frequency, distribution, and potential as markers for the
genus. BMC Genomics, 7(245): 1-11.
© Central University of Technology, Free State
CHAPTER 1: LITERATURE REVIEW
28 | P a g e
Graves, J. P, Edin, M. L., Bradbury, J. A., Gruzdev, A., Cheng, J., Lih, F. B., Masinde, T.
A., Qu, W., Clayton, N. P., Morrison, J. P., Tomer, K. B., Zeldin, D. C. (2013).
Characterization of Four New Mouse Cytochrome P450 Enzymes of the CYP2J Subfamily.
Drug Metab Dispos, 41: 763–773.
Grunwald, N. J., Goss, E. M., Press, C. M. (2008). Phytophthora ramorum: a pathogen with a
remarkably wide host range causing sudden oak death on oaks and ramorum blight on woody
ornamentals. Mol Plant Pathol, 6: 729-40.
Haas, B. J., Kamoun, S., Zody, M. C., Jiang, R. H. Y., Handsaker, R. E., Cano, L. M.,
Grabherr, M., Kodira, C. D., Raffaele, S., Torto-Alalibo, T., Bozkurt, T. O., Ah-Fong, A. M.
V., Alvarado, L., Anderson, V. L., Armstrong, M. R., Avrova, N., Baxter, L., Beynon, J.,
Boevink, P. C., Bollmann, S. R., Bos, J. I. B., Bulone, V., Cai, G., Cakir, C., Carrington, J.
C., Chawner, M., Conti, L., Costanzo, S., Ewan, R., Fahlgren, N., Fischbach, M. A.,
Fugelstad, J., Gilroy, E. M., Gnerre, S., Green, P. J., Grenville-Briggs, L. J., Griffith, J.,
Grünwald, N. J., Horn, K., Horner, N. R., Hu, C., Huitema, E., Jeong, D., Jones, A. M. E.,
Jones, J. D. G., Jones, R. W., Karlsson, E. K., Kunjeti, S. G., Lamour, K., Liu, K., Ma, L.,
MacLean, D., Chibucos, M. C., McDonald, H., McWalters, J., Meijer, H. J. G., Morgan, W.,
Morris, P. F., Munro, C. A., O'Neill, K., Ospina-Giraldo, M., Pinzón, A., Pritchard, L.,
Ramsahoye, B., Ren, Q., Restrepo, S., Roy, S., Sadanandom, A., Savidor, A., Schornack, S.,
Schwartz, D. C., Schumann, U. D., Schwessinger, B., Seyer, L., Sharpe T.,, Silvar, C., Song,
J., Studholme, D. J., Sykes, S., Thines, M., van de Vondervoort, P. J. I., Phuntumart, V.,
Wawra, S., Weide, R., Win, J., Young, C., Zhou, S., Fry, W., Meyers, B. C., van West, P.,
Ristaino, J., Govers, F., Birch, P. R. J., Whisson, S. C., Judelson S. H., Nusbaum, C. (2009).
© Central University of Technology, Free State
CHAPTER 1: LITERATURE REVIEW
29 | P a g e
Genome sequence and analysis of the Irish potato famine pathogen phytophthora infestans.
Nature, 461(17): 393-398.
Hlavica, P. (2012). Evaluation of structural features in fungal cytochromes P450 predicted to
rule catalytic diversification. Biochimica et Biophysica Acta, 1834: 205–220.
Kamoun, S. (2015). Oomycetes. Salem Press Encyclopedia Of Science. Available from:
http://eds.b.ebscohost.com/eds/detail/detail?sid=d22bebbc-f891-4364-a042-
ec91d3ce1201%40sessionmgr115&vid=5&hid=120&bdata=JnNpdGU9ZWRzLWxpdmU%3
d#db=ers&AN=89551780. [Accessed 26/05/2015]
Kamoun lab@ TSL. n.d. The oomycetes: A unique group of eukaryotic pathogens. Available
from: http://kamounlab.dreamhosters.com/oomycetes.htm [Accessed 25/11/2014]
Kelly S. L., Kelly D. E. (2013) Microbial cytochromes P450: biodiversity and biotechnology.
Where do cytochromes P450come from, what do they do and what can they do for us? Phil.
Trans. R. Soc. B.Biol. Sci. 368:20120476.
Koc, E., Ustun, A. S. (2012). Influence of Phytophthora capsici L. inoculation on disease
severity, necrosis length, peroxidase and catalase activity, and phenolic content of resistant
and susceptible pepper (Capsicum annuum L.) plants. Turk J Biol, 36: 357-371.
Lah, L., Krasevec, N., Trontelj, P., Komel, R. (2008). High diversity and complex evolution
of fungal cytochrome P450 reductase: Cytochrome P450 systems. Fungal Genetics and
Biology, 45: 446–458.
© Central University of Technology, Free State
CHAPTER 1: LITERATURE REVIEW
30 | P a g e
Lamb, D. C., Waterman, M. R., Kelly, S. L., Guengerich, F. P. (2007). Cytochromes P450
and drug discovery. Chemical biotechnology, 18: 504–512.
Lamour, K. H., Mudge, J., Gobena, D., Hurtado-Gonzales, O. P., Schmutz, J., Kuo, A.,
Miller, N. A., Rice, B. J., Raffaele, S., Cano, L. M., Bharti, A. L., Donahoo, R. S., Finley, S.,
Huitema, E., Hulvey, J., Platt, D., Salamov, A., Savidor, A., Sharma,R., Stam, R., Storey, D.,
Thines, M., Win, J., Haas, B. J., Dinwiddie, D. L.,Jenkins, J., Knight, J. R., Affourtit, J. P.,
Han, C. S., Chertkov, O., Lindquist, E. A., Detter, C., Grigoriev, I. V., Kamoun, S.,
Kingsmore, S. F. (2012). Genome Sequencing and Mapping Reveal Loss of Heterozygosity
as a Mechanism for Rapid Adaptation in the Vegetable Pathogen Phytophthora capsici.
Molecular Plant-Microbe Interactions, 25(10): 1350–1360.
Latijnhouwers, M., de Wit, P. J. G. M., Govers, F. (2003). Oomycetes and fungi: similar
weaponry to attack plants, TRENDS in Microbiology, 11: 10.
Lévesque, C. A., Brouwer, H., Cano, L Hamilton, J. P., Hol,t C., Huitema, E., Raffaele, S.,
Robideau, G. P., Thines, M., Win, J., Zerillo, M. M., Beakes, G. W., Boore, J. L., Busam, D.,
Dumas, B., Ferriera, S., Fuerstenberg, S. I., Gachon, C. M., Gaulin, E., Govers, F., Grenville-
Briggs, L., Horner, N., Hostetler, J., Jiang, R. H., Johnson, J., Krajaejun, T., Lin, H., Meijer,
H. J., Moore, B., Morris, P., Phuntmart, V., Puiu, D., Shetty, J., Stajich, J. E., Tripathy, S.,
Wawra, S., van West, P., Whitty, B. R., Coutinho, P. M., Henrissat, B., Martin, F., Thomas,
P. D., Tyler, B. M., De Vries, R. P., Kamoun, S., Yandell, M., Tisserat, N., Buell, C. R.
(2010). Genome sequence of the necrotrophic plant pathogen Pythium ultimum reveals
original pathogenicity mechanisms and effector repertoire. Genome Biology, 11: R73.
© Central University of Technology, Free State
CHAPTER 1: LITERATURE REVIEW
31 | P a g e
Mclntosh, J. A., Farwell, C. C., Arnold, F. H. (2014). Expanding P450 catalytic reaction
space through evolution and engineering. Current Opinion in Chemical Biology, 19: 126–
134.
Munro, A. W., Girvan, H. M., McLean, K. J. (2007). Cytochrome P450–redox partner fusion
enzymes. Biochimica et Biophysica Acta, 1770: 345–359.
Nigrelli, L., Thines, M. (2013). Tropical oomycetes in the German Bight-Climate warming or
overlooked diversity? fungal ecology, 6: 152-160.
Park, J., Lee, S., Choi, J., Ahn, K., Park, B., Park, J., Kang, S., Lee, Y. (2008). Fungal
cytochrome P450 database. BMC Genomics, 9:402 doi: 10.1186/1471-2164-9-402.
Pazmino, D. E. T., Winkler, M., Glieder, A., Fraaije, M. W. (2010). Monooxygenases as
biocatalysts: Classification, mechanistic aspects and biotechnological applications. Journal of
Biotechnology, 146: 9–24.
Pythium Genome Database. (n. d.) Pyhtium aphanidermatum. Available from:
(http://pythium.plantbiology.msu.edu). [Accessed: 10/06/2014]
Rossman, A.Y. Palm, M. E. (2007). Why Are Phytophthora and Other Oomycota Not True
Fungi? Inoculum, 58(1): 1-3.
Schumann, G. L., D‟Arcy, C. J. (2005).Late blight of potato and tomato. The Plant Health
Instructor. DOI: 10.1094/PHI-I-2000-0724-01 Available from:
© Central University of Technology, Free State
CHAPTER 1: LITERATURE REVIEW
32 | P a g e
http://www.apsnet.org/edcenter/intropp/lessons/fungi/Oomycetes/Pages/LateBlight.aspx.
[Accessed: 09/06/2015]
Soanes, D. M., Richards, T. A., Talbot, N. J. (2007). Insights from Sequencing Fungal and
Oomycete Genomes: What CanWe Learn about Plant Disease and the Evolution of
Pathogenicity? The Plant Cell, 19: 3318–3326.
Sohl, C. D., Guengerich, F. P. (2010). Kinetic Analysis of the Three-step Steroid Aromatase
Reaction of Human Cytochrome P450 19A1. J Biol Chem, 285(23): 17734–17743.
Syed, K., Mashele, S. S. (2014). Comparative Analysis of P450 Signature Motifs EXXR and
CXG in the Large and Diverse Kingdom of Fungi: Identification of Evolutionarily Conserved
Amino Acid Patterns Characteristic of P450 Family. PLoS ONE 9(4): e95616.
doi:10.1371/journal.pone.0095616.
Tyler, B. M., Panabieres, F., Shan, W., Grunwald, N., Machado, M. (2011). Phytophthora
parasitica INRA-310 Sequencing Project, Broad Institute of Harvard and MIT. Available
from: (http://www.broadinstitute.org/) [Accessed: 21/06/2014]
Tyler, B. M., Tripathy, S., Zhang, X. M., Dehal, P., Jiang, R. H. Y., Aerts, A., Arredondo, F.
D., Baxter, L., Bensasson, D., Beynon, J. L., Chapman, J., Damasceno, C. M. B., Dorrance,
A. E., Dou, D. L., Dickerman, A. W., Dubchak, I. L., Garbelotto, M., Gijzen, M., Gordon, S.
G., Govers, F., Grunwald, N. J., Huang, W., Ivors, K. L., Jones, R. W., Kamoun, S., Krampis,
K., Lamour, K. H., Lee, M., McDonald, W. H., Medina, M., Meijer, H. J. G., Nordberg, E.
K., Maclean, D. J., Ospina-Giraldo, M. D., Morris, P. F., Phuntumart, V., Putnam, N. H.,
© Central University of Technology, Free State
CHAPTER 1: LITERATURE REVIEW
33 | P a g e
Rash, S., Rose, J. K. C., Sakihama, Y., Salamov, A. A., Savidor, A., Scheuring, C. F., Smith,
B. M., Sobral, B. W. S., Terry, A., Torto-Alalibo, T. A., Win, J., Xu, Z., Zhang, H.,
Grigoriev, I. V., Rokhsar, D. S., Boore, J. L. (2006). Phytophthora Genome Sequences
Uncovered Evolutionary Origins and Mechanisms of pathogenesis. Science, 313: 1261-1266.
Tyler, B. M. (2007). Phytophthora sojae: root rot pathogen of soybean and model oomycete.
Molecular Plant Pathology, 8(1): 1.
UK Assays. (n. d.) Phytophthora. Available from:
http://www.ukessays.co.uk/essays/environmental-studies/phytophthora.php. [Accessed:
21/05/2015]
University of California Museum of Paleontology (UCMP). (n. d.) .Introduction to the
Oomycota. Available from: http://www.ucmp.berkeley.edu/chromista/oomycota.html.
[Accessed: 30/07/2014]
Urlacher, V. B., Eiben, S. (2006). Cytochrome P450 monooxygenases: perspectives for
synthetic application TRENDS in Biotechnology, 24(7): 324 – 330.
Van West, P. (2006). Saprolegnia parasitica, an oomycete pathogen with a fishy appetite:
new challenges for an old problem. Mycologist, 20: 99–104.
Waterman, M. R. (1995). Cytochrome P450. Molecular biology and biotechnology. Meyers,
R. A. (Ed) VCH Publishers, Inc 220 East New York, NY 10010 USA. p. 197 – 199.
© Central University of Technology, Free State
CHAPTER 1: LITERATURE REVIEW
34 | P a g e
William, E. F., Grunwald, J. G. (2010). Introduction to Oomycetes. The Plant Health
Instructor. DOI:10.1094/PHI-I-2010-1207-01. Available from:
http://www.apsnet.org/edcenter/intropp/PathogenGroups/Pages/IntroOomycetes.aspx#
[Accessed: 25/04/2015]
© Central University of Technology, Free State
CHAPTER 2: GENOME DATA-MINING, ANNOTATION AND PHYLOGENETIC ANALYSIS OF
CYTOCHROME P450 MONOOXYGENASES IN OOMYCETES
36 | P a g e
CHAPTER 2
GENOME DATA-MINING, ANNOTATION AND
PHYLOGENETIC ANALYSIS OF CYTOCHROME
P450 MONOOXYGENASES IN OOMYCETES
2.1 Introduction
2.1.1 Genome sequencing
The availability of genome sequencing data nowadays made researchers life easy in finding a
way of answering difficult biological questions that arise daily and to uncover the secrets in
the genomes of various organisms. The first DNA sequencing technique was invented by
Gilbert and Maxam followed by Sanger back in 1970s. From there new creativities sprang up
(Wessner et al., 2013).
Previously this science of genome sequencing was not as simple to perform as
nowadays, the techniques used were time consuming and expensive. However, with new
improvements, this process has been performed relatively faster and with high accuracy.
Among genome sequencing techniques early researchers developed, commonly used was
Sanger sequencing technique. With time, technology advancement transformed this method
dramatically. Newer techniques that involve automation have improved genome sequencing
and made it easier to perform within reasonable time and with high throughput.
Accumulation of genome sequences and development of genome databases has been
archived, thanks to new technology (Wessner et al., 2013). This escalated dramatically after
human genome was sequenced. Many prokaryotic organisms’ genomes were sequenced and
© Central University of Technology, Free State
CHAPTER 2: GENOME DATA-MINING, ANNOTATION AND PHYLOGENETIC ANALYSIS OF
CYTOCHROME P450 MONOOXYGENASES IN OOMYCETES
37 | P a g e
comparative genomics of various organisms started (Lee & Kim, 2008). Today, we have
repositories of genomic data accessible on the internet worldwide (Wessneret al., 2013).
2.1.2 Genome data mining
Harvesting the genome sequences was big a problem due limited data availability. This was
the problem of yesterday, as sequencing methods advanced and now genomes of many
organisms have been available (Huttenhower & Hofmann, 2010). Many genome sequencing
projects are still continuing to bridging up that gap even today (Soanes, 2007). However, it
seems the “bottle neck” has shifted to data analysis. Nonetheless, there is a relief as there is
escalating invention of analytical tools to augment on that matter (Huttenhower & Hofmann,
2010).
On genome sequencing of various organisms revealed presence of P450s in their
genomes (Nelson 2013). The availability of genome sequences has been of tremendous
benefit to researchers as analysis of huge genome data sets has enabled establishment of
relationships between microorganisms and their physiological characteristics also their
environmental conditions. Hypothesis can now be made relating to organisms based on their
genome and eventually be proven by experimental procedures (Wessner et al., 2013). Most
annotated P450s are those in fungi and a co-relation on fungal P450s and their role in
adaptation to different ecological niches has been reported (Syed et al. 2014). Genome
sequencing now provides opportunity to explore oomycetes species genomes that have been
so far under studied. Therefore, this study was aimed to perform genome-wide annotation and
phylogenetic analysis of P450s in oomycete species.
© Central University of Technology, Free State
CHAPTER 2: GENOME DATA-MINING, ANNOTATION AND PHYLOGENETIC ANALYSIS OF
CYTOCHROME P450 MONOOXYGENASES IN OOMYCETES
38 | P a g e
2.2 Methods
2.2.1 Oomycete species for P450 analysis
Thirteen oomycete species belonging to two different classes and three different orders were
used in this study. Oomycete species used in this study, their taxonomic group and general
information like host and diseases were listed in table 1.2 of Chapter 1. As listed in the table,
11 species (P. sojae, P. ramorum, P. infestans, P. parasitica, P. capsici, H. arabidopsidis
(formerly. H. parasitica), P. aphanidermatum, P. irregular, P. awayamai, P. ultimum and P.
vexan) belonging to class Peronosporomycetidae and two species (Saprolegnia parasitica and
S. declina) belonging to Class Saprolegniomycetidae were used for comparative analysis of
P450s. It is noteworthy that Peronosporomycetidae contain plant pathogens whereas
Saprolegniomycetidae contain animal pathogens.
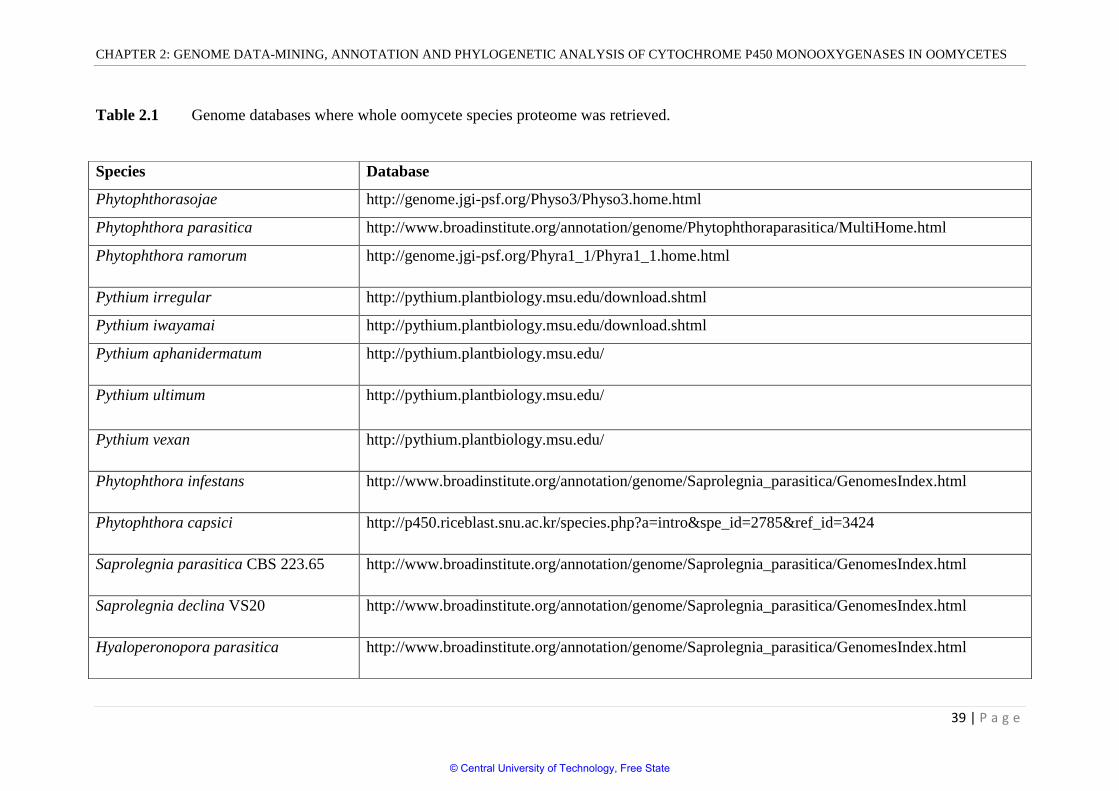
2.2.2 Genome data-mining and identification of P450s
Genomes of oomycete species in this study have been published and are publicly available.
The whole proteomes of oomycete species were downloaded from the databases listed in
table 2.1. Identification of P450 proteins in whole proteome was carried out using the
procedure described elsewhere (Syed et al., 2014 (a, b)). Briefly, the downloaded protein
sequences were grouped into different protein families using the National Centre for
Biotechnology and Information (NCBI) Conserved Domain Database: NCBI Batch Web CD-
search tool (Marchler-Bauer et al., 2011). The proteins grouped under the cytochrome P450
monooxygenases superfamily were selected for further study.
© Central University of Technology, Free State
CHAPTER 2: GENOME DATA-MINING, ANNOTATION AND PHYLOGENETIC ANALYSIS OF CYTOCHROME P450 MONOOXYGENASES IN OOMYCETES
39 | P a g e
Table 2.1 Genome databases where whole oomycete species proteome was retrieved.
Species Database
Phytophthorasojae http://genome.jgi-psf.org/Physo3/Physo3.home.html
Phytophthora parasitica http://www.broadinstitute.org/annotation/genome/Phytophthoraparasitica/MultiHome.html
Phytophthora ramorum http://genome.jgi-psf.org/Phyra1_1/Phyra1_1.home.html
Pythium irregular http://pythium.plantbiology.msu.edu/download.shtml
Pythium iwayamai http://pythium.plantbiology.msu.edu/download.shtml
Pythium aphanidermatum http://pythium.plantbiology.msu.edu/
Pythium ultimum http://pythium.plantbiology.msu.edu/
Pythium vexan http://pythium.plantbiology.msu.edu/
Phytophthora infestans http://www.broadinstitute.org/annotation/genome/Saprolegnia_parasitica/GenomesIndex.html
Phytophthora capsici http://p450.riceblast.snu.ac.kr/species.php?a=intro&spe_id=2785&ref_id=3424
Saprolegnia parasitica CBS 223.65 http://www.broadinstitute.org/annotation/genome/Saprolegnia_parasitica/GenomesIndex.html
Saprolegnia declina VS20 http://www.broadinstitute.org/annotation/genome/Saprolegnia_parasitica/GenomesIndex.html
Hyaloperonopora parasitica http://www.broadinstitute.org/annotation/genome/Saprolegnia_parasitica/GenomesIndex.html
© Central University of Technology, Free State
CHAPTER 2: GENOME DATA-MINING, ANNOTATION AND PHYLOGENETIC ANALYSIS OF
CYTOCHROME P450 MONOOXYGENASES IN OOMYCETES
40 | P a g e
2.2.3 Assigning a family and subfamily to orphan P450s
Identified P450s were subjected to BLAST analysis against all named Protists sequences on
the Cytochrome P450 Webpage (Nelson, 2009). Based on percentage identity, i.e., family
members share more than 40% amino acid identity and members of subfamilies share more
than 55% amino acid homology (Syed & Mashele, 2014), families and subfamilies were
assigned to oomycete P450s. P450s that showed less than 40% identity were assigned to a
new family. In addition, evolutionary analysis of P450s was performed in order to
authenticate the annotation. P450s that showed less than 40% identity were assessed for their
position on the phylogenetic tree and based on their location/alignment with other P450s they
were assigned to different P450 families. Annotated and publicly available P. sojae and P.
ramorum P450s were retrieved from the database and used in this study (Nelson, 2009).
2.2.4 Phylogenetic analysis of oomycete P450s
The phylogenetic tree was constructed for evolutionary analysis of oomycete P450s. Firstly,
the protein sequences were aligned by adjusting them to the hidden Markov model of P450s
in the Pfam protein families database (http://pfam.xfam.org/family/PF00067) with HMMER
package 3.1 (http://hmmer.janelia.org/) (Eddy, 2011; Finn et al., 2014). Then, the
phylogenetic tree from the alignment of protein sequences was inferred by Fast Tree version
2.1.4 using the maximum-likelihood method (http://www.microbesonline.org/fasttree/) (Price
et al., 2009). The generated tree data was submitted to iTOL (http://itol. embl.de/upload.cgi)
for viewing phylogenetic trees and making figures (Letunic & Bork, 2007).
© Central University of Technology, Free State
CHAPTER 2: GENOME DATA-MINING, ANNOTATION AND PHYLOGENETIC ANALYSIS OF
CYTOCHROME P450 MONOOXYGENASES IN OOMYCETES
41 | P a g e
2.3 Results and Discussion
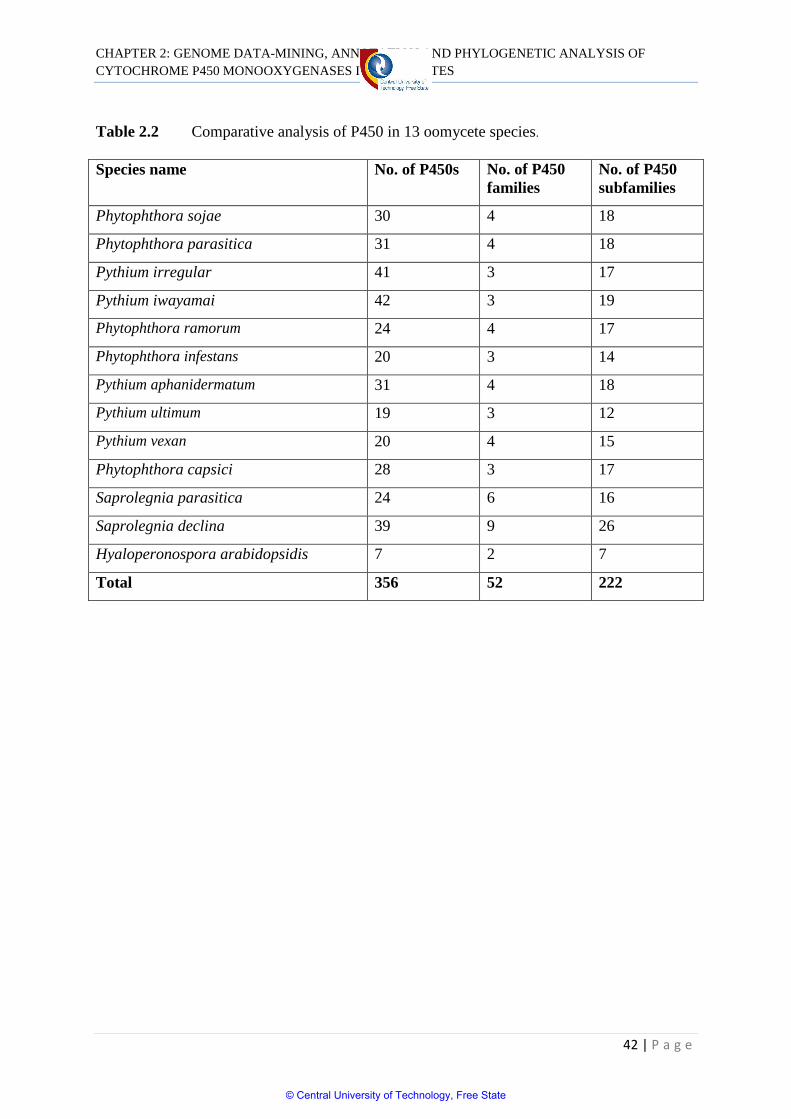
2.3.1 Oomycetes P450omes
Genome-wide identification and annotation of P450s in 13 oomycetes belonging to two
different classes and three different orders (Table 1.2, Chapter 1) revealed the presence of a
moderate number of P450s in their genomes. Three hundred and fifty-six P450s were found
in 13 oomycetes genomes (Table 2.2). The P450 count in oomycete genomes ranged from 7-
41. Among the oomycetes selected for the study, H. arabidopsidis showed the lowest number
of P450s (7) and P. iwayamai showed the highest number of P450s (41) in their genome.
Except H. arabidopsidis, all oomycete genomes had 19 or more P450s. On average,
Peronosporales showed a lower number of P450s (27), (excluding H. arabidopsis,) compared
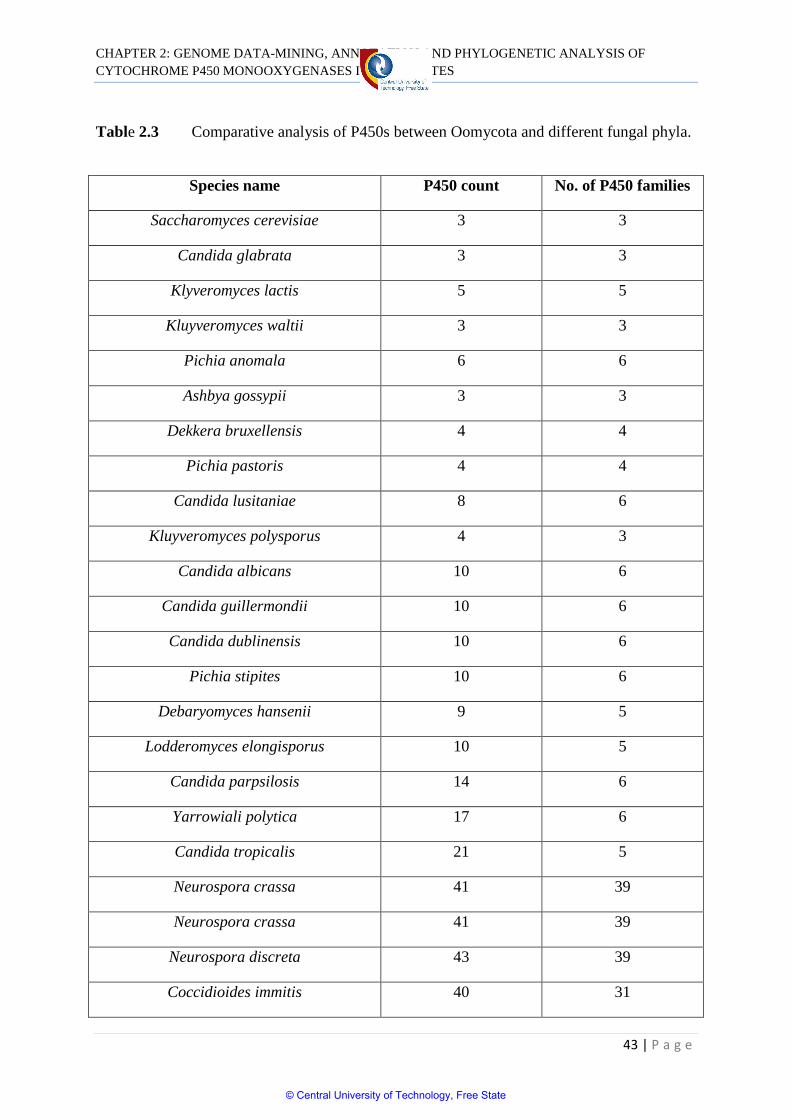
to Pythiales that showed 31 P450s. Comparison of oomycete P450omes with other lower
eukaryotes such as fungi revealed that, the number of P450s observed in oomycetes is most
similar to fungal species belonging to the sub-phylum saccharomycotina and least similar
among species belonging to the rest of the fungal kingdom, with few exceptions, as shown in
table 2.3.
© Central University of Technology, Free State
CHAPTER 2: GENOME DATA-MINING, ANNOTATION AND PHYLOGENETIC ANALYSIS OF
CYTOCHROME P450 MONOOXYGENASES IN OOMYCETES
42 | P a g e
Table 2.2 Comparative analysis of P450 in 13 oomycete species.
Species name No. of P450s No. of P450
families
No. of P450
subfamilies
Phytophthora sojae 30 4 18
Phytophthora parasitica 31 4 18
Pythium irregular 41 3 17
Pythium iwayamai 42 3 19
Phytophthora ramorum 24 4 17
Phytophthora infestans 20 3 14
Pythium aphanidermatum 31 4 18
Pythium ultimum 19 3 12
Pythium vexan 20 4 15
Phytophthora capsici 28 3 17
Saprolegnia parasitica 24 6 16
Saprolegnia declina 39 9 26
Hyaloperonospora arabidopsidis 7 2 7
Total 356 52 222
© Central University of Technology, Free State
CHAPTER 2: GENOME DATA-MINING, ANNOTATION AND PHYLOGENETIC ANALYSIS OF
CYTOCHROME P450 MONOOXYGENASES IN OOMYCETES
43 | P a g e
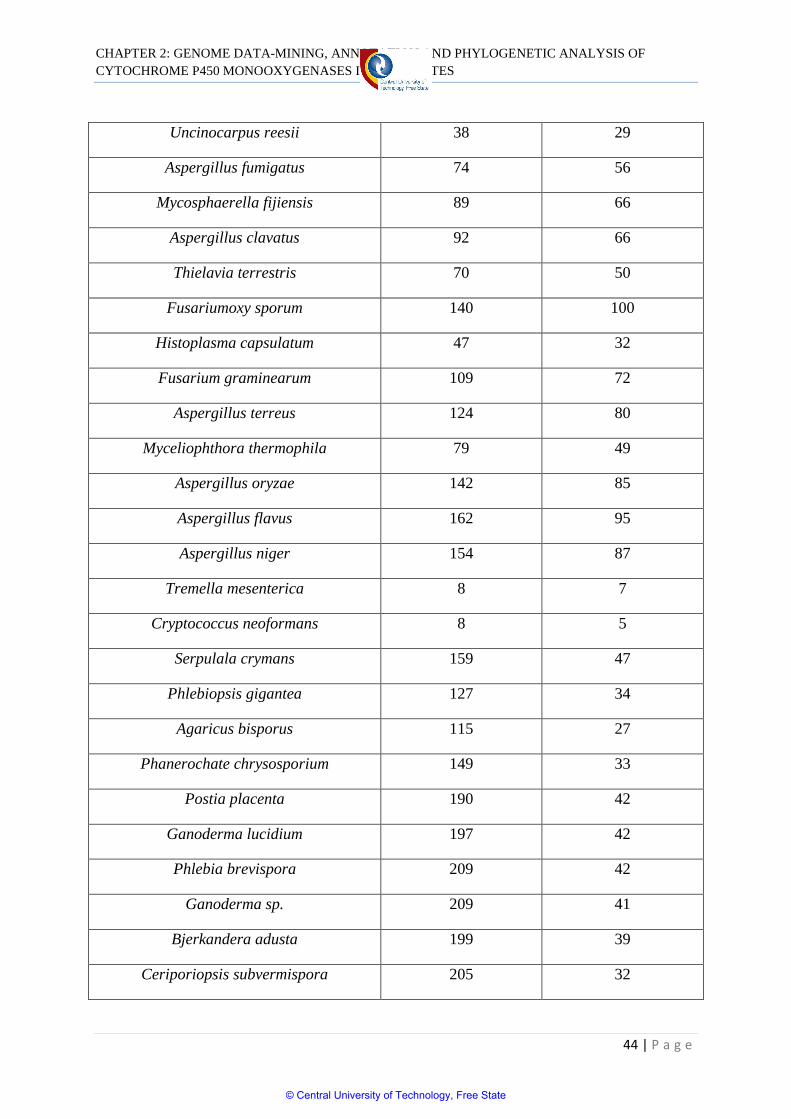
Table 2.3 Comparative analysis of P450s between Oomycota and different fungal phyla.
Species name P450 count No. of P450 families
Saccharomyces cerevisiae 3 3
Candida glabrata 3 3
Klyveromyces lactis 5 5
Kluyveromyces waltii 3 3
Pichia anomala 6 6
Ashbya gossypii 3 3
Dekkera bruxellensis 4 4
Pichia pastoris 4 4
Candida lusitaniae 8 6
Kluyveromyces polysporus 4 3
Candida albicans 10 6
Candida guillermondii 10 6
Candida dublinensis 10 6
Pichia stipites 10 6
Debaryomyces hansenii 9 5
Lodderomyces elongisporus 10 5
Candida parpsilosis 14 6
Yarrowiali polytica 17 6
Candida tropicalis 21 5
Neurospora crassa 41 39
Neurospora crassa 41 39
Neurospora discreta 43 39
Coccidioides immitis 40 31
© Central University of Technology, Free State
CHAPTER 2: GENOME DATA-MINING, ANNOTATION AND PHYLOGENETIC ANALYSIS OF
CYTOCHROME P450 MONOOXYGENASES IN OOMYCETES
44 | P a g e
Uncinocarpus reesii 38 29
Aspergillus fumigatus 74 56
Mycosphaerella fijiensis 89 66
Aspergillus clavatus 92 66
Thielavia terrestris 70 50
Fusariumoxy sporum 140 100
Histoplasma capsulatum 47 32
Fusarium graminearum 109 72
Aspergillus terreus 124 80
Myceliophthora thermophila 79 49
Aspergillus oryzae 142 85
Aspergillus flavus 162 95
Aspergillus niger 154 87
Tremella mesenterica 8 7
Cryptococcus neoformans 8 5
Serpulala crymans 159 47
Phlebiopsis gigantea 127 34
Agaricus bisporus 115 27
Phanerochate chrysosporium 149 33
Postia placenta 190 42
Ganoderma lucidium 197 42
Phlebia brevispora 209 42
Ganoderma sp. 209 41
Bjerkandera adusta 199 39
Ceriporiopsis subvermispora 205 32
© Central University of Technology, Free State
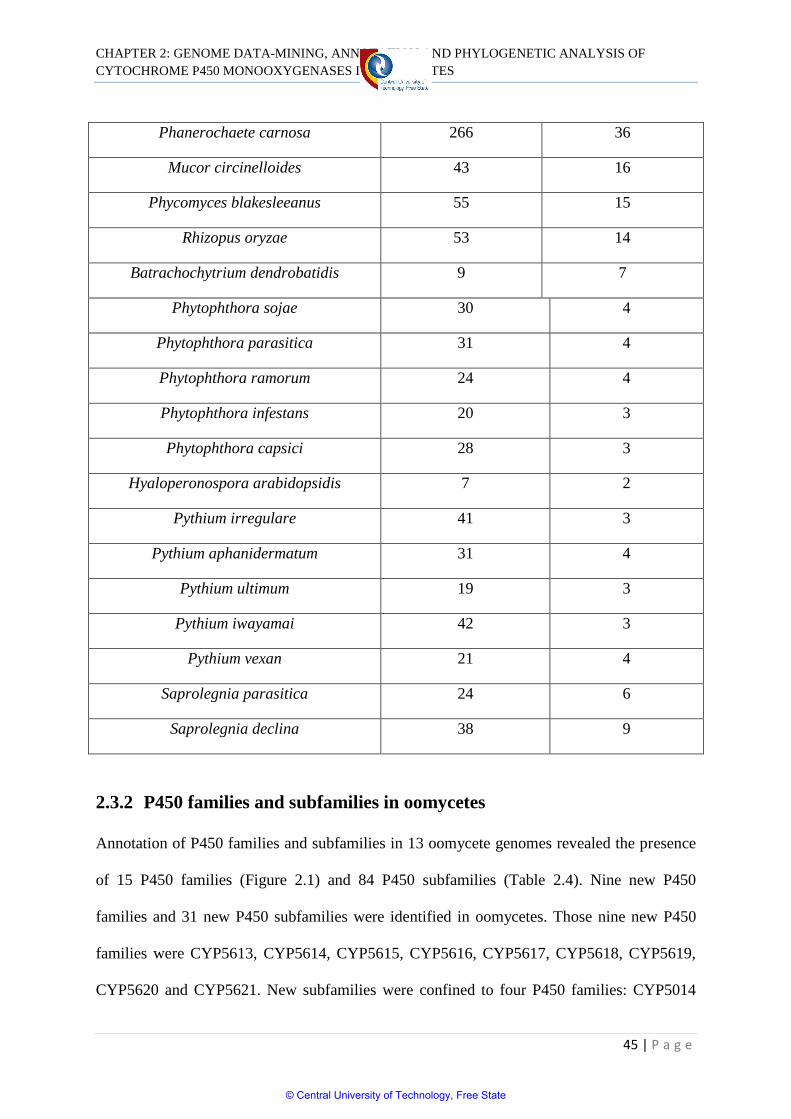
CHAPTER 2: GENOME DATA-MINING, ANNOTATION AND PHYLOGENETIC ANALYSIS OF
CYTOCHROME P450 MONOOXYGENASES IN OOMYCETES
45 | P a g e
Phanerochaete carnosa 266 36
Mucor circinelloides 43 16
Phycomyces blakesleeanus 55 15
Rhizopus oryzae 53 14
Batrachochytrium dendrobatidis 9 7
Phytophthora sojae 30 4
Phytophthora parasitica 31 4
Phytophthora ramorum 24 4
Phytophthora infestans 20 3
Phytophthora capsici 28 3
Hyaloperonospora arabidopsidis 7 2
Pythium irregulare 41 3
Pythium aphanidermatum 31 4
Pythium ultimum 19 3
Pythium iwayamai 42 3
Pythium vexan 21 4
Saprolegnia parasitica 24 6
Saprolegnia declina 38 9
2.3.2 P450 families and subfamilies in oomycetes
Annotation of P450 families and subfamilies in 13 oomycete genomes revealed the presence
of 15 P450 families (Figure 2.1) and 84 P450 subfamilies (Table 2.4). Nine new P450
families and 31 new P450 subfamilies were identified in oomycetes. Those nine new P450
families were CYP5613, CYP5614, CYP5615, CYP5616, CYP5617, CYP5618, CYP5619,
CYP5620 and CYP5621. New subfamilies were confined to four P450 families: CYP5014
© Central University of Technology, Free State
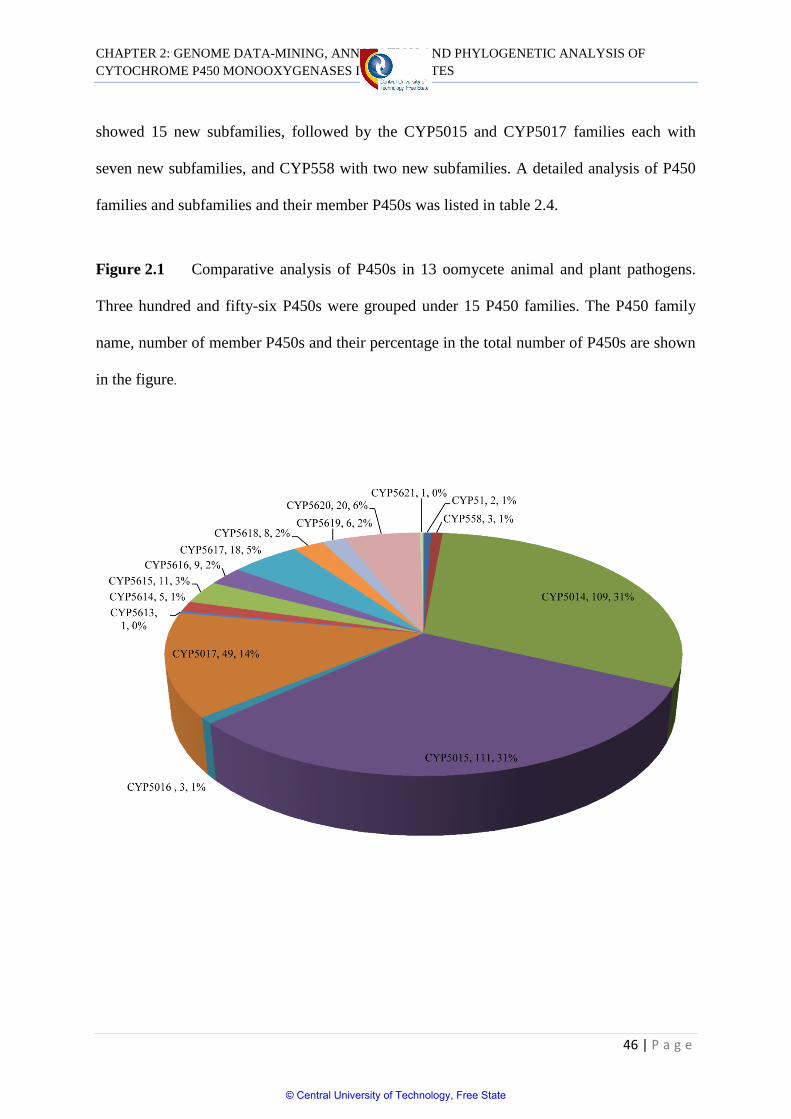
CHAPTER 2: GENOME DATA-MINING, ANNOTATION AND PHYLOGENETIC ANALYSIS OF
CYTOCHROME P450 MONOOXYGENASES IN OOMYCETES
46 | P a g e
showed 15 new subfamilies, followed by the CYP5015 and CYP5017 families each with
seven new subfamilies, and CYP558 with two new subfamilies. A detailed analysis of P450
families and subfamilies and their member P450s was listed in table 2.4.
Figure 2.1 Comparative analysis of P450s in 13 oomycete animal and plant pathogens.
Three hundred and fifty-six P450s were grouped under 15 P450 families. The P450 family
name, number of member P450s and their percentage in the total number of P450s are shown
in the figure.
© Central University of Technology, Free State
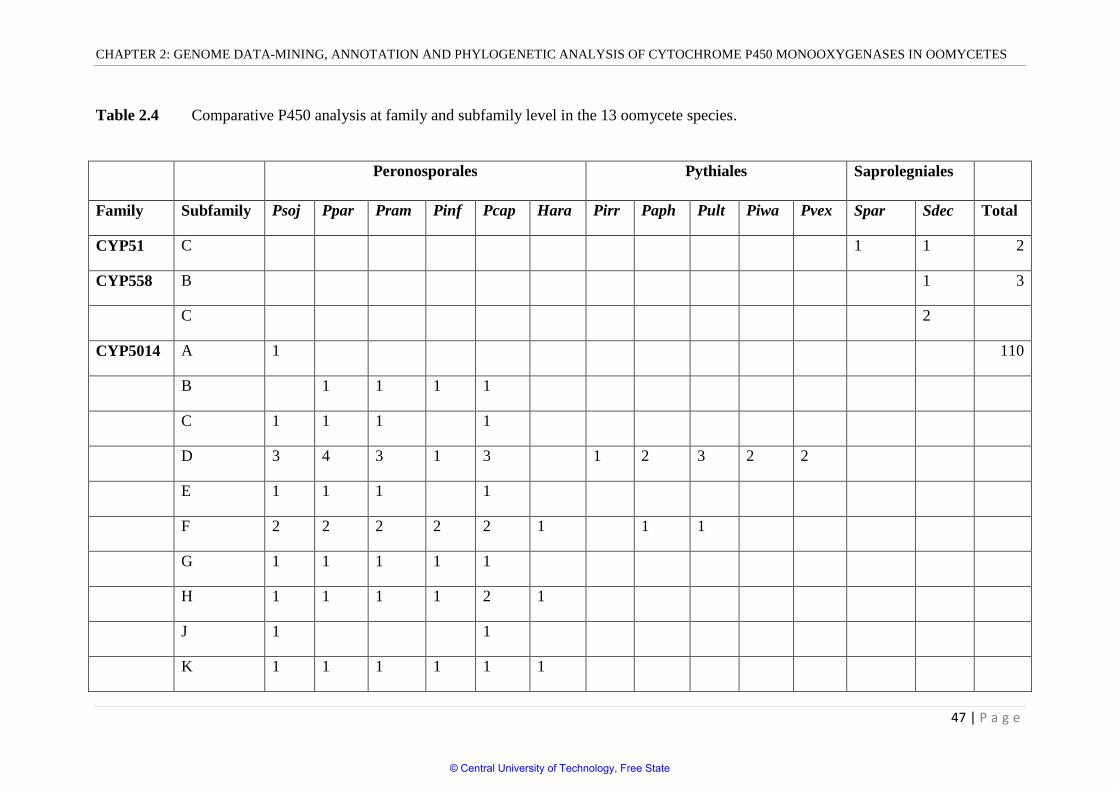
CHAPTER 2: GENOME DATA-MINING, ANNOTATION AND PHYLOGENETIC ANALYSIS OF CYTOCHROME P450 MONOOXYGENASES IN OOMYCETES
47 | P a g e
Table 2.4 Comparative P450 analysis at family and subfamily level in the 13 oomycete species.
Peronosporales Pythiales Saprolegniales
Family Subfamily Psoj Ppar Pram Pinf Pcap Hara Pirr Paph Pult Piwa Pvex Spar Sdec Total
CYP51 C 1 1 2
CYP558 B 1 3
C 2
CYP5014 A 1 110
B 1 1 1 1
C 1 1 1 1
D 3 4 3 1 3 1 2 3 2 2
E 1 1 1 1
F 2 2 2 2 2 1 1 1
G 1 1 1 1 1
H 1 1 1 1 2 1
J 1 1
K 1 1 1 1 1 1
© Central University of Technology, Free State
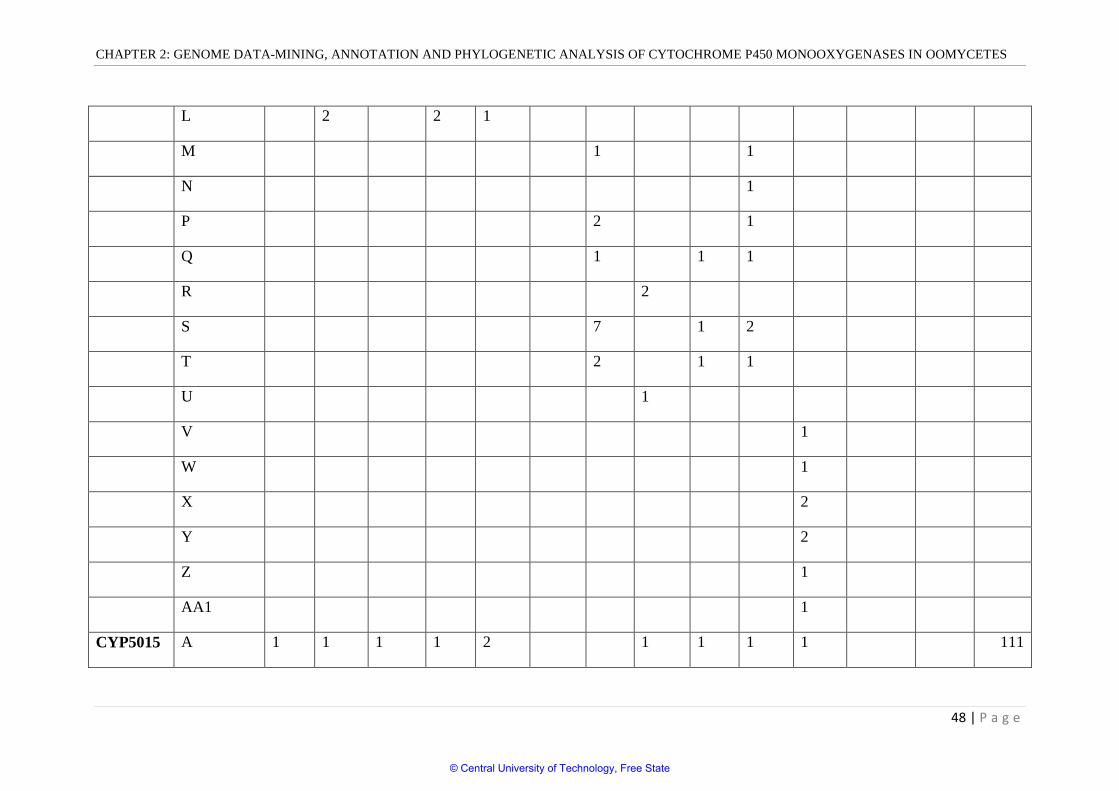
CHAPTER 2: GENOME DATA-MINING, ANNOTATION AND PHYLOGENETIC ANALYSIS OF CYTOCHROME P450 MONOOXYGENASES IN OOMYCETES
48 | P a g e
L 2 2 1
M 1 1
N 1
P 2 1
Q 1 1 1
R 2
S 7 1 2
T 2 1 1
U 1
V 1
W 1
X 2
Y 2
Z 1
AA1 1
CYP5015 A 1 1 1 1 2 1 1 1 1 111
© Central University of Technology, Free State
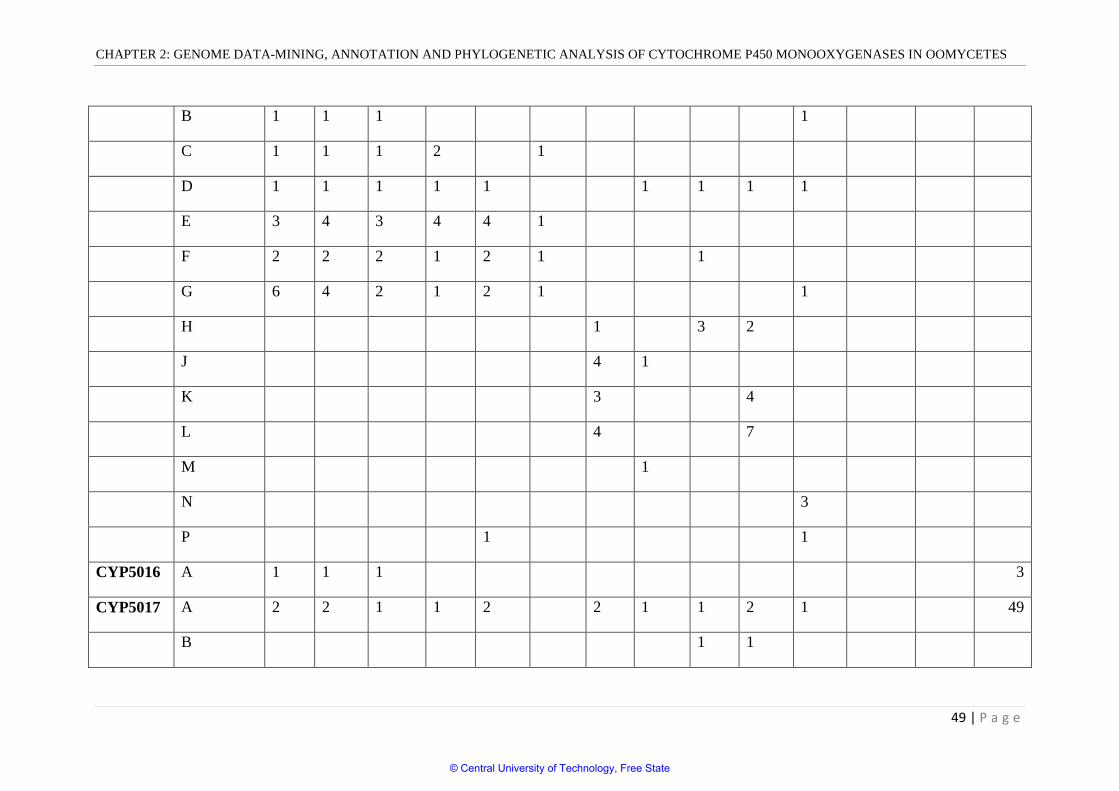
CHAPTER 2: GENOME DATA-MINING, ANNOTATION AND PHYLOGENETIC ANALYSIS OF CYTOCHROME P450 MONOOXYGENASES IN OOMYCETES
49 | P a g e
B 1 1 1 1
C 1 1 1 2 1
D 1 1 1 1 1 1 1 1 1
E 3 4 3 4 4 1
F 2 2 2 1 2 1 1
G 6 4 2 1 2 1 1
H 1 3 2
J 4 1
K 3 4
L 4 7
M 1
N 3
P 1 1
CYP5016 A 1 1 1 3
CYP5017 A 2 2 1 1 2 2 1 1 2 1 49
B 1 1
© Central University of Technology, Free State
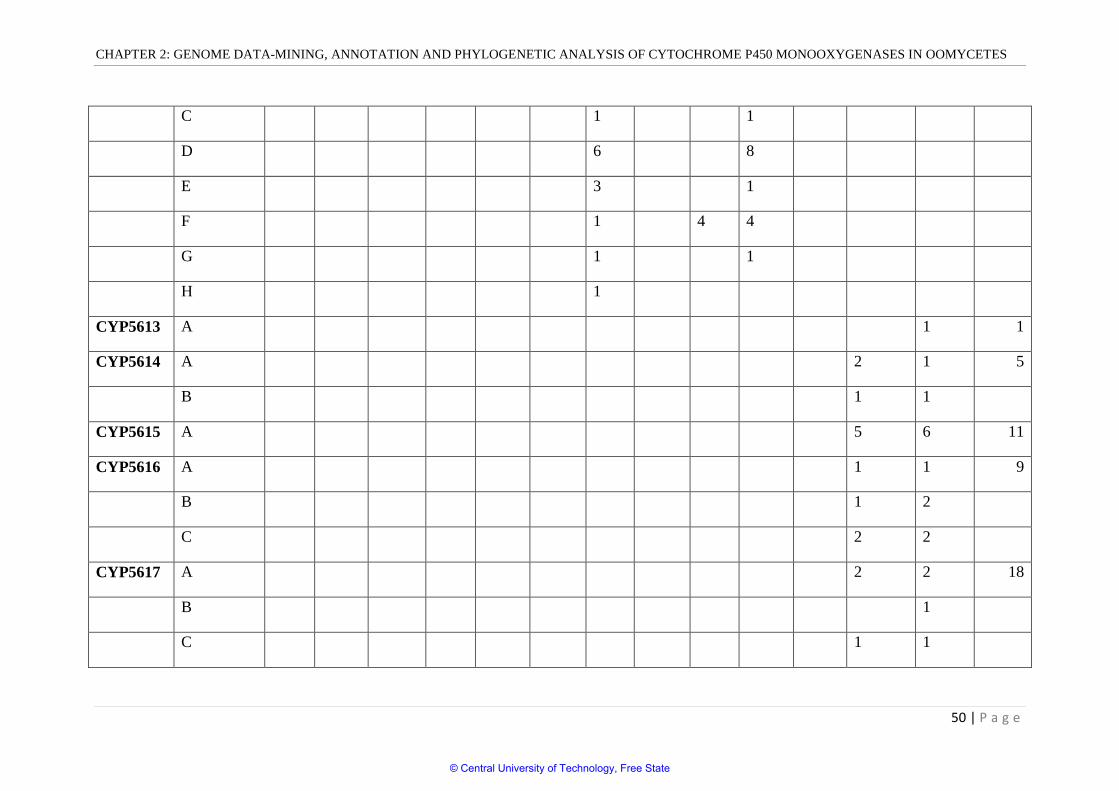
CHAPTER 2: GENOME DATA-MINING, ANNOTATION AND PHYLOGENETIC ANALYSIS OF CYTOCHROME P450 MONOOXYGENASES IN OOMYCETES
50 | P a g e
C 1 1
D 6 8
E 3 1
F 1 4 4
G 1 1
H 1
CYP5613 A 1 1
CYP5614 A 2 1 5
B 1 1
CYP5615 A 5 6 11
CYP5616 A 1 1 9
B 1 2
C 2 2
CYP5617 A 2 2 18
B 1
C 1 1
© Central University of Technology, Free State
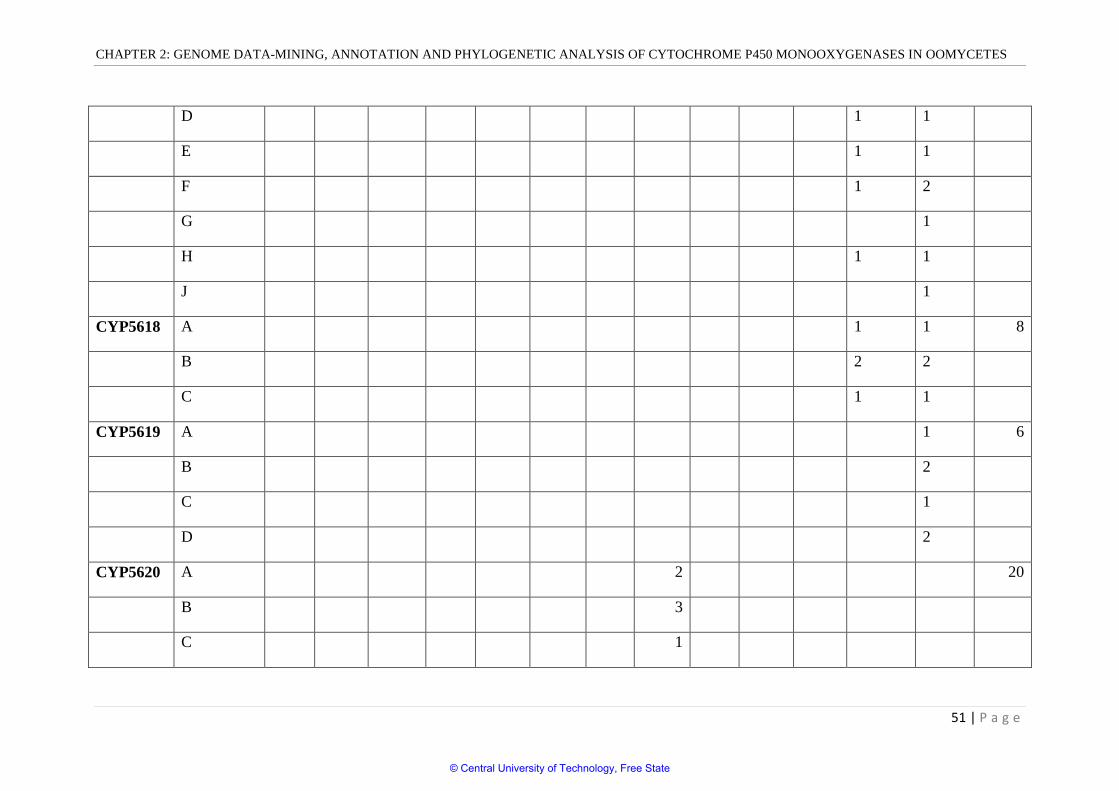
CHAPTER 2: GENOME DATA-MINING, ANNOTATION AND PHYLOGENETIC ANALYSIS OF CYTOCHROME P450 MONOOXYGENASES IN OOMYCETES
51 | P a g e
D 1 1
E 1 1
F 1 2
G 1
H 1 1
J 1
CYP5618 A 1 1 8
B 2 2
C 1 1
CYP5619 A 1 6
B 2
C 1
D 2
CYP5620 A 2 20
B 3
C 1
© Central University of Technology, Free State
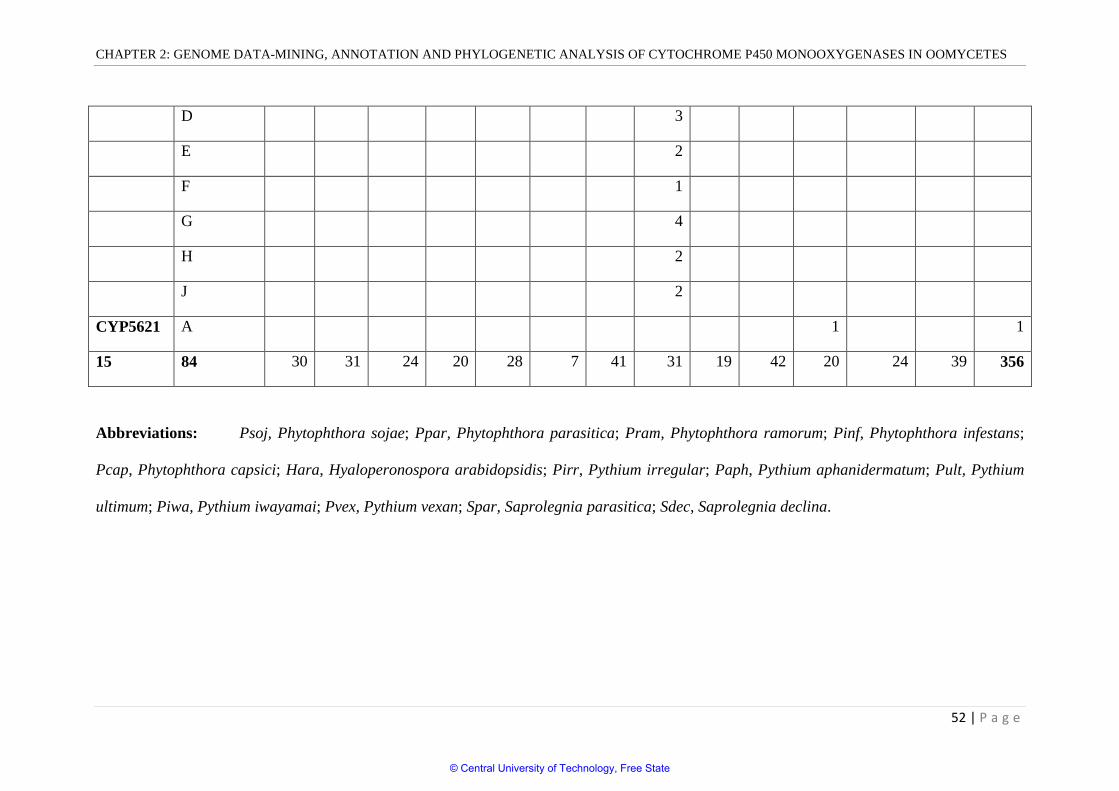
CHAPTER 2: GENOME DATA-MINING, ANNOTATION AND PHYLOGENETIC ANALYSIS OF CYTOCHROME P450 MONOOXYGENASES IN OOMYCETES
52 | P a g e
D 3
E 2
F 1
G 4
H 2
J 2
CYP5621 A 1 1
15 84 30 31 24 20 28 7 41 31 19 42 20 24 39 356
Abbreviations: Psoj, Phytophthora sojae; Ppar, Phytophthora parasitica; Pram, Phytophthora ramorum; Pinf, Phytophthora infestans;
Pcap, Phytophthora capsici; Hara, Hyaloperonospora arabidopsidis; Pirr, Pythium irregular; Paph, Pythium aphanidermatum; Pult, Pythium
ultimum; Piwa, Pythium iwayamai; Pvex, Pythium vexan; Spar, Saprolegnia parasitica; Sdec, Saprolegnia declina.
© Central University of Technology, Free State
CHAPTER 2: GENOME DATA-MINING, ANNOTATION AND PHYLOGENETIC ANALYSIS OF
CYTOCHROME P450 MONOOXYGENASES IN OOMYCETES
53 | P a g e
Comparative analysis of P450 members across 13 P450 families revealed that the CYP5014,
CYP5015 and CYP5017 P450 families are dominant P450 families in oomycetes with 109,
111 and 49 members respectively, making 76% of total P450s (Figure 2.1). This suggests a
high level of P450 blooming (Feyereisen, 2011) of these families. A single member was
found in CYP5613 and CYP5621 families (Figure 2.1). Analysis of P450 families,
particularly their member P450s and their contribution to the total number of P450s, is shown
in figure. 2.1.
2.3.4 P450 family and subfamily dynamics in oomycetes
After annotation of families and subfamilies, further study was carried out to assess the
dynamics of P450 families and subfamilies (loss or gain of P450 families/subfamilies) in
these organisms. Among oomycetes, Saprolegniales showed the highest number of P450
families compared to Peronosporales and Pythiales (Table 2.2). The number of P450 families
in oomycetes ranged from two to nine. Peronosporales showed a minimum of two and a
maximum of four families in their genomes. Pythiales showed three to four P450 families in
their genomes. Species belonging to Saprolegniales showed six (S. parasitica) and nine (S.
declina) P450 families in their genomes (Table 2.2).
Comparative analysis of P450 families revealed no common P450 family across the
oomycetes used in this study (Figure 2.2). However, the CYP5016 family was present only in
Peronosporales and the CYP5014, CYP5015 and CYP5017 families were present in both
Peronosporales and Pythiales. Saprolegniales had eleven P450 families (CYP51, CYP558 and
CYP5613-CYP5621). Nine of them (CYP5613-CYP5621) were new P450 families only
found in Saprolegniales. The answer to the presence of the highest number of P450 families
and particularly the presence of new P450 families in Saprolegniales compared to
© Central University of Technology, Free State
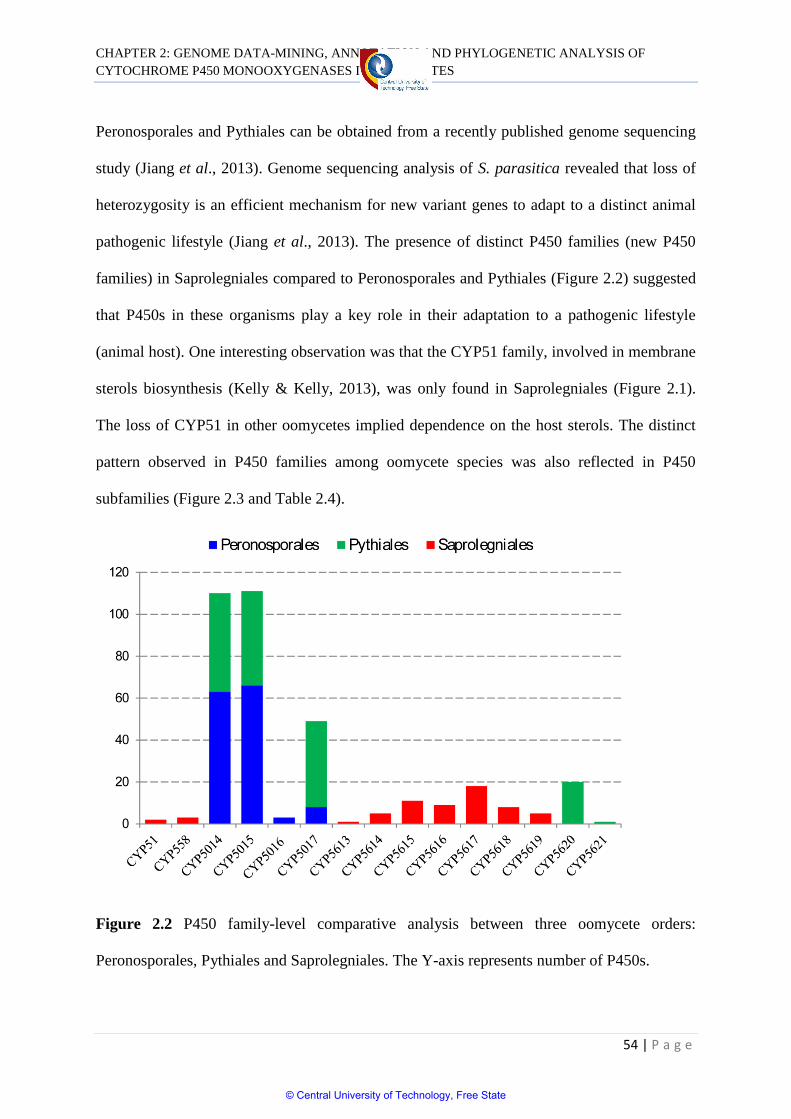
CHAPTER 2: GENOME DATA-MINING, ANNOTATION AND PHYLOGENETIC ANALYSIS OF
CYTOCHROME P450 MONOOXYGENASES IN OOMYCETES
54 | P a g e
Peronosporales and Pythiales can be obtained from a recently published genome sequencing
study (Jiang et al., 2013). Genome sequencing analysis of S. parasitica revealed that loss of
heterozygosity is an efficient mechanism for new variant genes to adapt to a distinct animal
pathogenic lifestyle (Jiang et al., 2013). The presence of distinct P450 families (new P450
families) in Saprolegniales compared to Peronosporales and Pythiales (Figure 2.2) suggested
that P450s in these organisms play a key role in their adaptation to a pathogenic lifestyle
(animal host). One interesting observation was that the CYP51 family, involved in membrane
sterols biosynthesis (Kelly & Kelly, 2013), was only found in Saprolegniales (Figure 2.1).
The loss of CYP51 in other oomycetes implied dependence on the host sterols. The distinct
pattern observed in P450 families among oomycete species was also reflected in P450
subfamilies (Figure 2.3 and Table 2.4).
Figure 2.2 P450 family-level comparative analysis between three oomycete orders:
Peronosporales, Pythiales and Saprolegniales. The Y-axis represents number of P450s.
© Central University of Technology, Free State
CHAPTER 2: GENOME DATA-MINING, ANNOTATION AND PHYLOGENETIC ANALYSIS OF
CYTOCHROME P450 MONOOXYGENASES IN OOMYCETES
55 | P a g e
Comparative analysis of subfamilies revealed that only nine subfamilies were shared between
Peronosporales and Pythiales. Analysis of P450 subfamilies revealed that all the subfamilies
shared between Peronosporales and Pythiales were found in CYP5014 (2), CYP5015 (6) and
CYP5017 (1) (Figure. 2.3). This suggests that distinct pathogenic lifestyles (host and site of
infection) of Peronosporales and Pythiales (Table 1.2, Chapter 1) influence the P450 content
in their genomes, as species belonging to these orders show distinct P450 subfamilies (Figure
2.3 and Table 2.4).
The above results revealed that oomycetes that belong to different orders show
distinct P450 families and P450 subfamilies in their genomes. This strongly suggests that
oomycetes belonging to different orders retain or evolve distinct P450 families in their
genomes possibly to adapt to a pathogenic lifestyle in different hosts. In other ways, as
recently suggested by researchers (Jiang et al., 2013), host cellular environment has driven
distinct patterns of gene expansion and loss in the genomes of plant and animal pathogens.
From the above results it is clear that the host environment plays a key role in the
development of distinct/new variants of P450 families in oomycetes.
© Central University of Technology, Free State
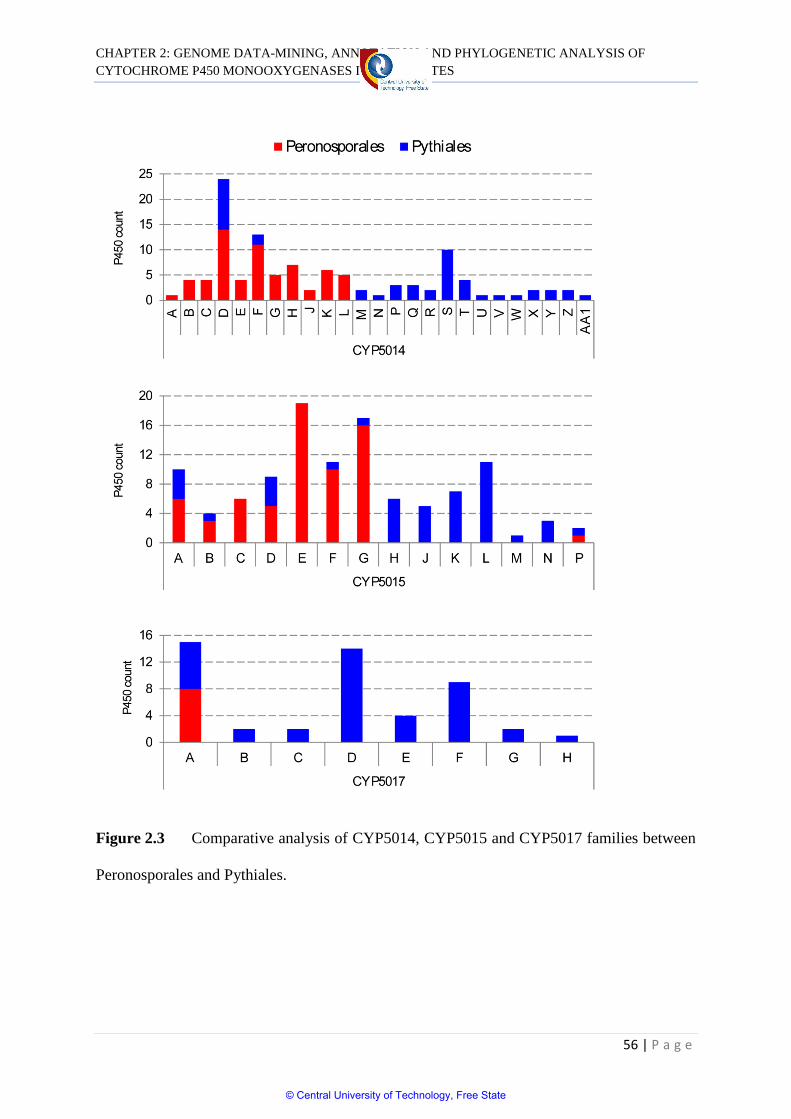
CHAPTER 2: GENOME DATA-MINING, ANNOTATION AND PHYLOGENETIC ANALYSIS OF
CYTOCHROME P450 MONOOXYGENASES IN OOMYCETES
56 | P a g e
Figure 2.3 Comparative analysis of CYP5014, CYP5015 and CYP5017 families between
Peronosporales and Pythiales.
© Central University of Technology, Free State
CHAPTER 2: GENOME DATA-MINING, ANNOTATION AND PHYLOGENETIC ANALYSIS OF
CYTOCHROME P450 MONOOXYGENASES IN OOMYCETES
57 | P a g e
2.3.5 Evolutionary analysis of oomycete P450s
The presence of distinct P450 families, particularly new families and subfamilies, in
oomycetes necessitated the performance of evolutionary analysis to allow grouping of P450s
into different clades, a higher level P450 classification (Nelson, 1998). Furthermore,
evolutionary analysis of oomycetes P450s played a key role in the annotation of oomycete
P450s into different families.
Hence in this study a phylogenetic tree of oomycete P450s was constructed for their
evolutionary analysis (Figure. 2.4). The results showed that the phylogenetic relationship of
oomycete P450s is related with their family and species taxonomy. On the whole, the P450s
of the order Saprolegniales showed a very distant phylogenetic relationship to those of the
order Pythiales and Peronosporales; they were clearly separated in the tree, while the P450s
from the order Pythiales and Peronosporales were phylogenetically close. This is in
agreement with the taxonomy relationship between the orders Saprolegniales, Pythiales and
Peronosporales, which suggests that the evolution of oomycete P450s is closely related with
their species’ evolution.
Based on phylogenetic relationships, oomycete P450s were classified into six clades
(Figure. 2.4) and the distribution of CYP families and oomycete taxonomy was investigated
in these clades (Table 2.5). Only clade 5 had members from all three orders. Clade 6 was a
very large branch, suggesting blooming in the order Pythiales and Peronosporales. Especially
CYP5014 and CYP5015 members ware not only very frequently presented in the order
Pythiales and Peronosporales, but also maintained a high gene number in their genomes
(Figures 2.1, 2.3 and Table 2.4). This suggests that CYP5014 and CYP5015 family members
may play a pivotal role in the physiological function of order Pythiales and Peronosporales.
© Central University of Technology, Free State
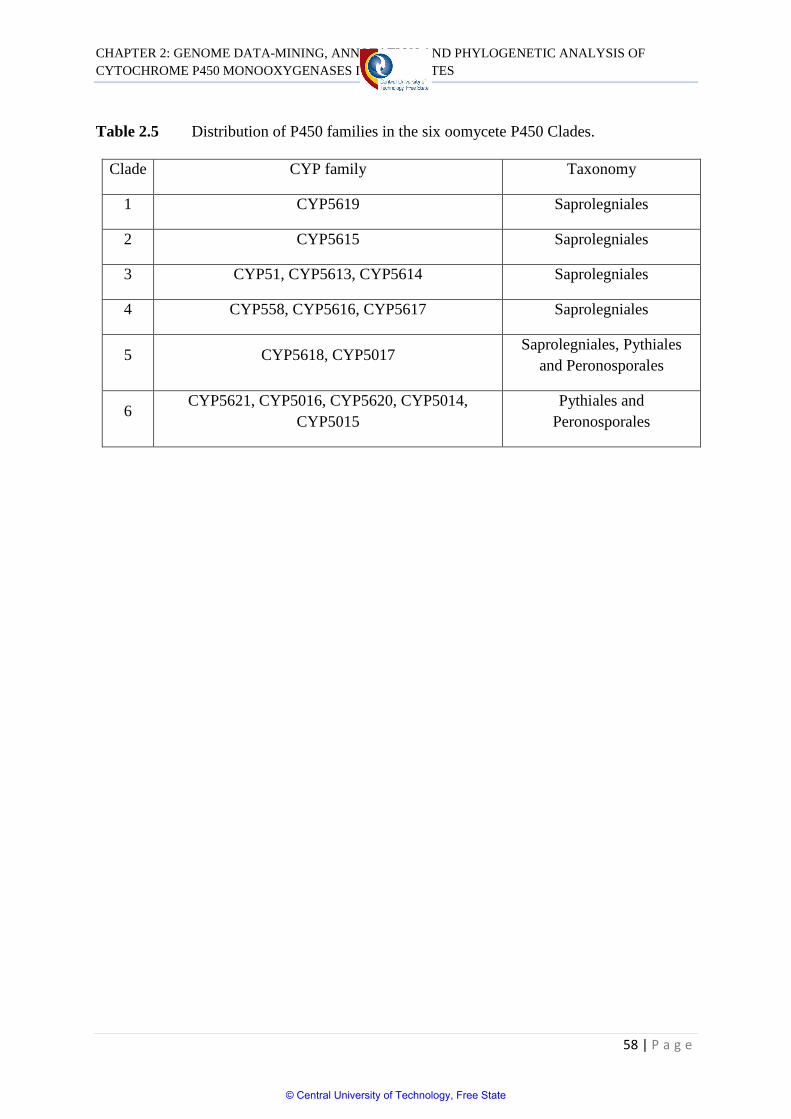
CHAPTER 2: GENOME DATA-MINING, ANNOTATION AND PHYLOGENETIC ANALYSIS OF
CYTOCHROME P450 MONOOXYGENASES IN OOMYCETES
58 | P a g e
Table 2.5 Distribution of P450 families in the six oomycete P450 Clades.
Clade CYP family Taxonomy
1 CYP5619 Saprolegniales
2 CYP5615 Saprolegniales
3 CYP51, CYP5613, CYP5614 Saprolegniales
4 CYP558, CYP5616, CYP5617 Saprolegniales
5 CYP5618, CYP5017 Saprolegniales, Pythiales
and Peronosporales
6 CYP5621, CYP5016, CYP5620, CYP5014,
CYP5015
Pythiales and
Peronosporales
© Central University of Technology, Free State
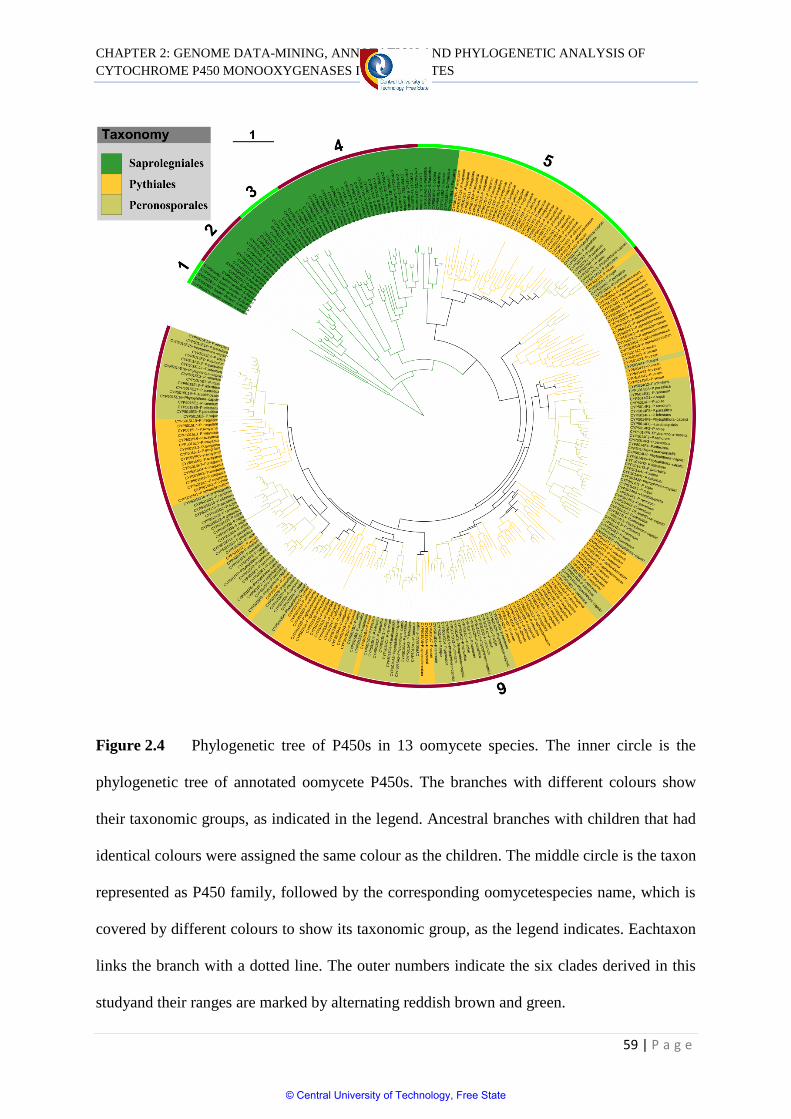
CHAPTER 2: GENOME DATA-MINING, ANNOTATION AND PHYLOGENETIC ANALYSIS OF
CYTOCHROME P450 MONOOXYGENASES IN OOMYCETES
59 | P a g e
Figure 2.4 Phylogenetic tree of P450s in 13 oomycete species. The inner circle is the
phylogenetic tree of annotated oomycete P450s. The branches with different colours show
their taxonomic groups, as indicated in the legend. Ancestral branches with children that had
identical colours were assigned the same colour as the children. The middle circle is the taxon
represented as P450 family, followed by the corresponding oomycetespecies name, which is
covered by different colours to show its taxonomic group, as the legend indicates. Eachtaxon
links the branch with a dotted line. The outer numbers indicate the six clades derived in this
studyand their ranges are marked by alternating reddish brown and green.
© Central University of Technology, Free State
CHAPTER 2: GENOME DATA-MINING, ANNOTATION AND PHYLOGENETIC ANALYSIS OF
CYTOCHROME P450 MONOOXYGENASES IN OOMYCETES
60 | P a g e
2.4 Conclusion
This study revealed presence of low number of P450s in oomycetes. Large number of new
P450 families was found in oomycetes. Comparative analysis of P450s revealed that plant
and animal pathogenic oomycetes have unique P450 families in their genomes. This study
also revealed number of P450s in oomycetes genomes is matched with P450s numbers
observed in fungal species belong to Saccharomycotina.
© Central University of Technology, Free State
CHAPTER 2: GENOME DATA-MINING, ANNOTATION AND PHYLOGENETIC ANALYSIS OF
CYTOCHROME P450 MONOOXYGENASES IN OOMYCETES
61 | P a g e
2.5 References
Chen, W., Lee, M., Jefcoate, C., Kim, S., Chen, F., Yu, J. (2014). Fungal Cytochrome P450
Monooxygenases: Their Distribution, Structure, Functions, Family Expansion, and
Evolutionary Origin.Genome Biol. Evol, 6(7): 1620–1634.
Danielson, P. B. (2002).The Cytochrome P450 Superfamily: Biochemistry, Evolution and
DrugMetabolism in Humans. Current Drug Metabolism, 3(6): 561 – 596.
Eddy, S. R. (2011). Accelerated profile HMM searches. PLoS Comp. Biol,7:e1002195.
Feyereisen, R. (2011). Arthropod CYPomes illustrate the tempo and mode in P450 evolution.
Biochim.Biophys.Acta, 1814: 19–28.
Finn, R. D., Bateman, A., Jody Clements, J., Coggill, P., Eberhardt, R. Y., Eddy, S. R.,
Heger, A., Hetherington, K., Holm, L., Mistry, J., Sonnhammer, E. L. L., Tate, J., Punta, M.
(2014).The Pfam protein families database. Nucleic Acids Res, 42: D222–D230.
Huttenhower, C., Hofmann, O.(2010).A Quick Guide to Large Scale Genomic Data
Mining.PLoS Computational Biology, 6(5): 1 – 6.
Higgins, D. G. (2007). Clustal W and Clutal X version 2.0.Bioinformatics 23(21):2947–2948.
Jiang, R. H. Y. de Bruijn, I., Haas, B. J., Belmonte, R., Lo bach, L., Christie,J., Ackerveken,
G., Bottin, A., Bulone, V., Dı´az-Moreno, S. M., Dumas, B., Fan, L., Gaulin, E., Govers, F.,
Grenville-Briggs, L. J., Horner, N. R., Levin, J. Z., Mammella, M., Meijer, H. J. G., Morris,
P., Nusbaum, C., Oome, S., Phillips, A. J., van Rooyen, D., Rzeszutek, E., Saraiva, M.,
© Central University of Technology, Free State
CHAPTER 2: GENOME DATA-MINING, ANNOTATION AND PHYLOGENETIC ANALYSIS OF
CYTOCHROME P450 MONOOXYGENASES IN OOMYCETES
62 | P a g e
Secombes, C. J., Seidl, M. F., Snel, B., Stassen, J. H. M., Sykes, S., Tripathy, S., van den
Berg, H., Vega-Arreguin, J. C., Wawra, S., Young, S. K., Zeng, Q., Dieguez-Uribeondo, J.,
Russ, C., Tyler, B. M., van West, P. (2013). Distinctive expansion of potential virulence
genes in the genome of the oomycete fish pathogen Saprolegniaparasitica.PLOS Genet, 9:
e1003272.
Kelly, S. L., Kelly, D. E. (2013). Microbial cytochrome P450: Biodiversity and
biotechnology, where do cytochrome P450 come from, what do they do and what can they do
for us? Phil. Trans. R. Soc. B. Biol. Sci, 368: 161220120430.
Larkin, M. A.,Blackshields,G., Brown, N. P., Chenna, R., McGettigan, P. A.,McWilliam, H.,
Valentin, F., Wallace, I. M., Wilm, A., Lopez, R., Thompson, J. D., Gibson, T. J.,
Letunic, I., Bork, P. (2007). Interactive Tree of Life (iTOL): an online tool for phylogenetic
tree display and annotation. Bioinformatics, 23:127–128.
Marchler-Bauer, A., Lu, S., Anderson, J. B.,ChitsazF.,Derbyshire, M. K.,DeWeese-Scott, C.,
Fong, J. H., Geer, L. Y.,Geer, R. C., Gonzales, N. R.,Gwadz, M., Hurwitz, D. I., Jackson, J.
D.,Ke, Z.,Lanczycki, C. J., Fu Lu, Marchler, G. H.,Mullokandov, M.,Omelchenko, M. V.,
Robertson, C. L., James S. Song, J. S.,Thanki,N., Yamashita, R. A., Zhang, D.,Zhang, N.,
Zheng, C., Bryant, S. H.(2011). CDD: A conserved domain database for the functional
annotation of proteins. Nucleic Acids Res, 39: D225–9.
McLean, K. J., Belcher, J., Driscoll, M. D. (2010).The Mycobacterium tuberculosis
cytochromes P450: physiology, biochemistry & molecular intervention. Future Med Chem,
2(8): 1339 – 53.
© Central University of Technology, Free State
CHAPTER 2: GENOME DATA-MINING, ANNOTATION AND PHYLOGENETIC ANALYSIS OF
CYTOCHROME P450 MONOOXYGENASES IN OOMYCETES
63 | P a g e
Meadows, R. (2011). Why Biotrophs Can't Live Alone.PLoS Biol. 9(7), e1001097.
Nelson, D. R. (1998). Metazoan cytochrome P450 evolution. Comp.Biochem. Physiol. C
Pharmacol.Toxicol.Endocrinol, 121:15–22.
Nelson, D. R. (2009). Cytochrome P450 monooxygenases homepage. Human Genomics,
4(1): 59 – 65.
Nelson, D. (2013). A world of P450s. Phil Trans R Soc B, 368:20120430.
http://dx.doi.org/10.1098/rstb.2012.0430.
Price, M. N., Dehal, P. S., Arkin, A. P. (2009). FastTree: Computing large minimum
evolution trees with profiles instead of a distancematrix. Mol. Biol. Evol, 26:1641–1650.
Soanes, D. M. (2007). Insights from Sequencing Fungal and Oomycete Genomes: What Can
We Learn about Plant Disease and the Evolution of Pathogenicity? The Plant Cell, 19(1)
1:3318-3326.
Syed, K., Shale, K., Nazir, K. H. M. N. H., Krasevec, N., Mashele, S. S., Pagadala, N. S.
(2014a). Genome-wide identification, annotation and characterization of novel thermostable
cytochrome P450monooxygenases from the thermophilic biomass-degrading fungi Thielavia
terrestris and Myceliophthora thermophila. Genes Genom, 36:321–333.
Syed, K., Shale, K., Pagadala, N. S., Tuszynski, J. (2014b). Systematic identification and
evolutionary analysis of catalytically versatilecytochrome P450 monooxygenase families
enriched in model basidiomycete fungi. PLoS ONE, 9(1):e86683.
© Central University of Technology, Free State
CHAPTER 2: GENOME DATA-MINING, ANNOTATION AND PHYLOGENETIC ANALYSIS OF
CYTOCHROME P450 MONOOXYGENASES IN OOMYCETES
64 | P a g e
Syed, K., Mashele, S. S. (2014). Comparative Analysis of P450 Signature Motifs EXXR
andCXG in the Large and Diverse Kingdom of Fungi: Identification of Evolutionarily
Conserved Amino Acid Patterns Characteristic of P450 Family. PLOS ONE, 9(4).
Wessner, D. R., Dupont, C., Charles, T.C. (2013). Microbiology: Microbial genomics. John
Wiley & Sons, Inc., 111 River Street, Hoboken, NJ, USA. p. 302 – 323.
Zhang, S., Widemann, E., Bernard, G., Lesot, A., Pinot, F., Pedrini, N., Nemat, O., Keyhani,
N. O. (2012). CYP52X1, Representing New Cytochrome P450 Subfamily, Displays Fatty
Acid Hydroxylase Activity and Contributes to Virulence and Growth on Insect Cuticular
Substrates in Entomopathogenic Fungus Beauveria bassiana. J Biol Chem, 13(287)16:
13477–13486.
© Central University of Technology, Free State
CHAPTER 3: INSIGHTS ON OOMYCETES P450S: HOMOLOGY, DUPLICATIONS, DIVERSITY AND
SIGNATURE SEQUENCES
65 | P a g e
CHAPTER 3
INSIGHTS ON OOMYCETES P450S: HOMOLOGY,
DIVERSITY, DUPLICATIONS AND SIGNATURE
SEQUENCES
3.1 Introduction
Information on oomycetes, their life style and pathogenesis has not been explored (Kamoun,
2003) and recently researchers across the world turned their focus on this deadliest
pathogens. The present chapter is focused on oomycetes cytochrome P450 monooxygenase
enzymes (P450s) aspects that include homology, duplications, diversity and signature. These
aspects are very important in revealing evolution of P450s in an organism.
3.1.1 Homology
Homology is a key aspect in evolutionary biology applied to deduce the relationship between
organisms and to “examine the evolutionary processes driving evolution at a molecular
level”. This is based on similarities in characteristics. Homology analysis can be done in
nucleic acids or proteins (National Centre for Science Education, 2008). With many genome
sequences now available it is easy to classify and predict protein or gene function by
comparative analysis based on sequence pattern and structure (Loewenstein et al., 2009).
© Central University of Technology, Free State
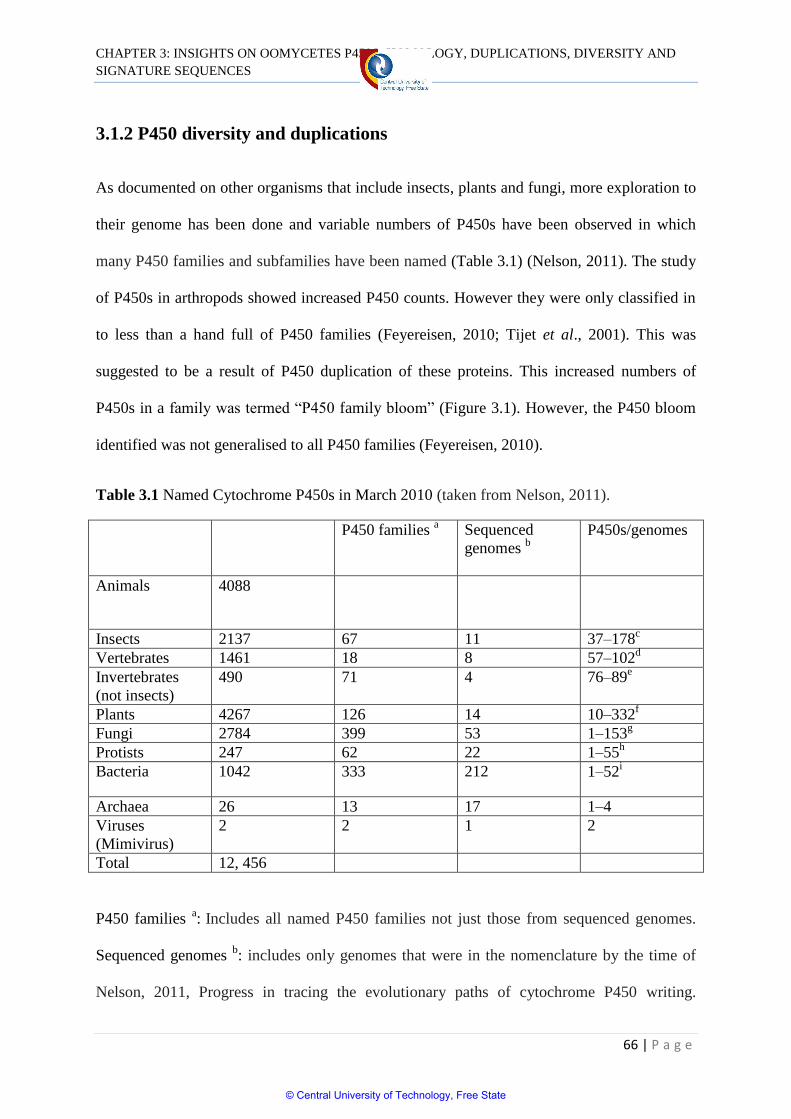
CHAPTER 3: INSIGHTS ON OOMYCETES P450S: HOMOLOGY, DUPLICATIONS, DIVERSITY AND
SIGNATURE SEQUENCES
66 | P a g e
3.1.2 P450 diversity and duplications
As documented on other organisms that include insects, plants and fungi, more exploration to
their genome has been done and variable numbers of P450s have been observed in which
many P450 families and subfamilies have been named (Table 3.1) (Nelson, 2011). The study
of P450s in arthropods showed increased P450 counts. However they were only classified in
to less than a hand full of P450 families (Feyereisen, 2010; Tijet et al., 2001). This was
suggested to be a result of P450 duplication of these proteins. This increased numbers of
P450s in a family was termed “P450 family bloom” (Figure 3.1). However, the P450 bloom
identified was not generalised to all P450 families (Feyereisen, 2010).
Table 3.1 Named Cytochrome P450s in March 2010 (taken from Nelson, 2011).
P450 families a Sequenced
genomes b
P450s/genomes
Animals 4088
Insects 2137 67 11 37–178c
Vertebrates 1461 18 8 57–102d
Invertebrates
(not insects)
490 71 4 76–89e
Plants 4267 126 14 10–332f
Fungi 2784 399 53 1–153g
Protists 247 62 22 1–55h
Bacteria 1042 333 212 1–52i
Archaea 26 13 17 1–4
Viruses
(Mimivirus)
2 2 1 2
Total 12, 456
P450 families a: Includes all named P450 families not just those from sequenced genomes.
Sequenced genomes b: includes only genomes that were in the nomenclature by the time of
Nelson, 2011, Progress in tracing the evolutionary paths of cytochrome P450 writing.
© Central University of Technology, Free State
CHAPTER 3: INSIGHTS ON OOMYCETES P450S: HOMOLOGY, DUPLICATIONS, DIVERSITY AND
SIGNATURE SEQUENCES
67 | P a g e
Bacterial, archaeal or viral counting exclude genomes without any P450s. Small letters (c, d, e,
f, g, h and i) identify the number of P450s per genomes for Aedes aegypti, Mouse, Tetranychus
urticae (two-spotted spider mite), Rice, Aspergillus oryzae, Dictyostelium discoideum, and
Frankia sp. EAN1pec respectively.
© Central University of Technology, Free State
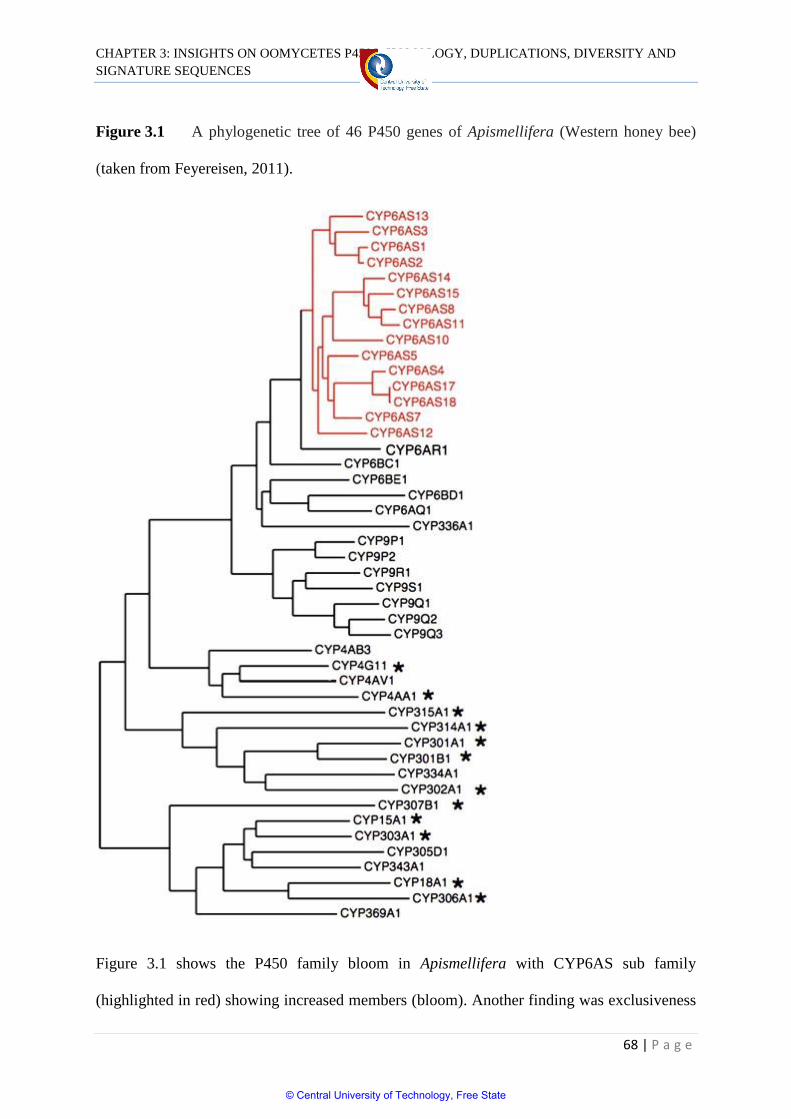
CHAPTER 3: INSIGHTS ON OOMYCETES P450S: HOMOLOGY, DUPLICATIONS, DIVERSITY AND
SIGNATURE SEQUENCES
68 | P a g e
Figure 3.1 A phylogenetic tree of 46 P450 genes of Apismellifera (Western honey bee)
(taken from Feyereisen, 2011).
Figure 3.1 shows the P450 family bloom in Apismellifera with CYP6AS sub family
(highlighted in red) showing increased members (bloom). Another finding was exclusiveness
© Central University of Technology, Free State
CHAPTER 3: INSIGHTS ON OOMYCETES P450S: HOMOLOGY, DUPLICATIONS, DIVERSITY AND
SIGNATURE SEQUENCES
69 | P a g e
of certain P450 families to other organism classes while others were observed to be dispersed
across several organism classes or species. CYP6 is confined in insects whereas CYP4
spreads to vertebrates (Tijet et al., 2001). CYP 56 and CYP 61 are limited to fungi (Cresna &
Petric, 2010). Figure 3.1 also shows orthologous P450s in insects (marked with an asterisk)
(Feyereisen, 2011). Not only have the distribution of P450s been determined but also the
function. CYP51 is widely spread in animals and plants, but not recognised in insects and
nematodes, it is important for sterol biosynthesis (Lepesheva & Waterman, 2004; Tijet et al.,
2001).
3.1.4 P450 signature sequences
P 450s possess two unique amino acids patterns in their protein sequences. These are referred
to as P450 signature motifs (FXXGXRXCXG/CXG and EXXR). The CXG is found on the
heme-binding group while the EXXR is found in the K-helix. They are the key markers for
identification of P450s (Gotoh, 1992; Sirim et al., 2010). In these motifs especially CXG,
among nine amino acid that form the in the beta bulge region, cysteine is the same in all
P450s, whereas two glycines and a single phenylalanine are “generally” the same but not in
all cases (Gotoh, 1992; Sirim et al., 2010). In the EXXR motif, glutamic acid and arginine are
generally the same (Rupasinghe et al., 2006; Li et al., 2013).
Recent study from Syed and Mashele (2014) revealed that the amino acid patterns in
these two signature motifs are characteristic of a P450 family. Authors further suggested that
during the divergence of P450 families from a common ancestor these amino acids patterns
evolve and are retained in each P450 family as a signature of that family.
© Central University of Technology, Free State
CHAPTER 3: INSIGHTS ON OOMYCETES P450S: HOMOLOGY, DUPLICATIONS, DIVERSITY AND
SIGNATURE SEQUENCES
70 | P a g e
3.2 Methods
3.2.1 Analysis of homology
Percentage identity between P450s was determined using ClustalW2 multiple sequence
analysis (Larkin et al 2007). The ClustalW2 result file designated as percentage identity
matrix was downloaded and checked for the percentage identity between P450s.
3.2.2 P450 diversity percentage
The percentage contribution of the number of P450 families in the totalnumber of P450s in an
organism was considered as P450 diversity percentage. P450 count and P450 familiesin
fungal species were retrieved from published literature (Kgosiemang, 2014; Syed et al., 2013;
Syed et al., 2014b).
3.2.3 Analysis of tandem arrangement of P450s
P450s localized in proximity on the genome wereidentified by scanning manually in the
respective genome databases for each oomycete (Chapter 2, Table 2.2). P450s localized on
the same scaffold/contig/supercontig were noted. P450s that were tandemly localized and
belonged to the same family were expressed as percentage in the total number of P450s in an
organism. Tandem arrangement of P450s was omitted for P. irregular and P. Iwayamai with
the shorter length of scaffold/contig/supercontigbeing the reason.
3.2.4 Analysis of EXXR and CXG motifs
Identification of P450 family-specific amino acid patterns at EXXR and CXG motifs was
carried out using the procedure described elsewhere (Syed & Mashele, 2014). Briefly, P450
members were subjected to ClustalW multiple alignment using Molecular Evolutionary
© Central University of Technology, Free State
CHAPTER 3: INSIGHTS ON OOMYCETES P450S: HOMOLOGY, DUPLICATIONS, DIVERSITY AND
SIGNATURE SEQUENCES
71 | P a g e
Genetics Analysis (MEGA5.2.2) (Schneider & Stephens, 1990). After ClustalW alignment of
P450s, amino acids in the EXXR and CXG motifs were selectedand used for generation of
WebLogos and calculation of percentage contribution by an amino acid ateach position in the
motifs. Only four amino acids were selected for EXXR motif analysis, whereas forCXG
motifs upstream seven amino acids were included in the analysis, exactly as previously
described (Syed & Mashele, 2014).
3.2.5 Generation of sequence logos
Sequence logos for EXXR and CXG motifs were generated using the published method
(Syed & Mashele, 2014). Briefly, WebLogo, a sequence logo generator programme
(http://weblogo.threeplusone.com/create.cgi) (Schneider & Stephens, 1990; Crooks et al.,
2004), was used to create sequence logos at EXXR and CXG motifs. After ClustalW
alignment of member P450s, the EXXR and CXG (FXXGXRXCXG) motifs’ amino acids
were selected and pasted in the WebLogo program. As a selection parameter, image format
was selected as PDF and 32symbols per line were selected. The generated EXXR and CXG
sequence logos were used for the analysis.
3.3 Results and Discussion
3.3.1 P450 blooming in oomycetes
As defined earlier, in comparative analysis of P450s in arthropods, mainly insects, P450
families with the high number of members in their genomes were revealed and authors
termed this nature of the highest number of members for a P450 family “P450 family
blooming” (Feyereisen, 2011). A recent study on fungal P450s also revealed the blooming
nature of a large number of P450 families in fungi (Syed et al., 2014a). Blooming of P450
© Central University of Technology, Free State
CHAPTER 3: INSIGHTS ON OOMYCETES P450S: HOMOLOGY, DUPLICATIONS, DIVERSITY AND
SIGNATURE SEQUENCES
72 | P a g e
families might play a key role in an organism’s metabolism or its adaptation to diverse
ecological niches, for example fungal colonization of wood substrates (Syed et al., 2014a).
In order to analyse P450 bloom or the direct opposite P450 diversity in oomycetes, a
comprehensive comparison of P450 count and P450 families between Oomycota and
different fungal phyla was performed (Chapter 2, Table 2.3). Another reason for using fungal
organisms for comparison, apart from what is mentionedin the introduction, is that for a long
time oomycetes were regarded as true fungi; it was only recently that these organisms were
grouped under the biological kingdom “Stramenopile”. Furthermore, analysis of P450
diversity/blooming between these organisms will provide insights in evolution of P450
families, considering the primitive nature of oomycetes.
Comparative analysis of P450 families across Oomycota and other fungal phyla
revealed that a number of P450 families present in oomycetes are to some extent matched
with species belonging toAscomycota, particularly the subphylum Saccharomycotina
(Chapter 2, Table 2.3). In order to identify the P450 diversity/blooming in oomycetes, an
average number of P450s and an average number of P450 families across different phyla and
the average P450 diversity percentage were measured (Figure 3.2 and Chapter 2, Table 2.3).
© Central University of Technology, Free State
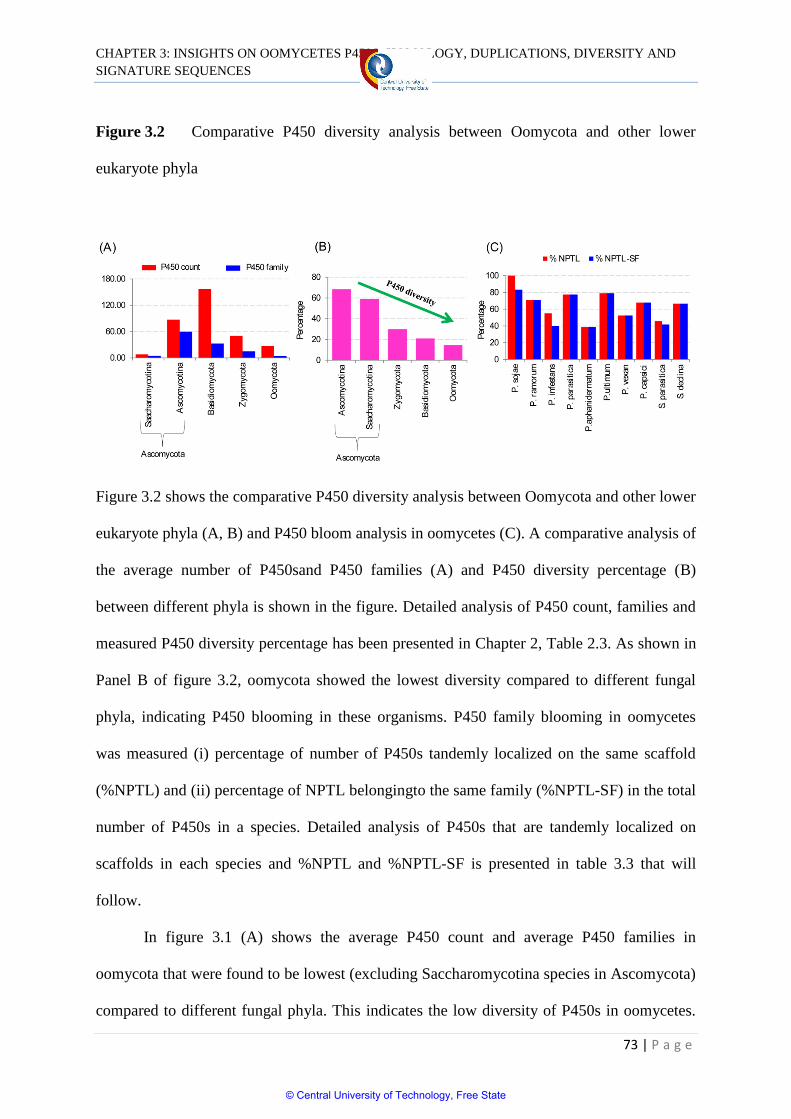
CHAPTER 3: INSIGHTS ON OOMYCETES P450S: HOMOLOGY, DUPLICATIONS, DIVERSITY AND
SIGNATURE SEQUENCES
73 | P a g e
Figure 3.2 Comparative P450 diversity analysis between Oomycota and other lower
eukaryote phyla
Figure 3.2 shows the comparative P450 diversity analysis between Oomycota and other lower
eukaryote phyla (A, B) and P450 bloom analysis in oomycetes (C). A comparative analysis of
the average number of P450sand P450 families (A) and P450 diversity percentage (B)
between different phyla is shown in the figure. Detailed analysis of P450 count, families and
measured P450 diversity percentage has been presented in Chapter 2, Table 2.3. As shown in
Panel B of figure 3.2, oomycota showed the lowest diversity compared to different fungal
phyla, indicating P450 blooming in these organisms. P450 family blooming in oomycetes
was measured (i) percentage of number of P450s tandemly localized on the same scaffold
(%NPTL) and (ii) percentage of NPTL belongingto the same family (%NPTL-SF) in the total
number of P450s in a species. Detailed analysis of P450s that are tandemly localized on
scaffolds in each species and %NPTL and %NPTL-SF is presented in table 3.3 that will
follow.
In figure 3.1 (A) shows the average P450 count and average P450 families in
oomycota that were found to be lowest (excluding Saccharomycotina species in Ascomycota)
compared to different fungal phyla. This indicates the low diversity of P450s in oomycetes.
© Central University of Technology, Free State
CHAPTER 3: INSIGHTS ON OOMYCETES P450S: HOMOLOGY, DUPLICATIONS, DIVERSITY AND
SIGNATURE SEQUENCES
74 | P a g e
On the other hand, this implies the highest blooming of P450 families in oomycetes. To
identify the blooming nature of oomycota P450ome the average P450 diversity percentage
between oomycota and other fungal phyla was measured (Figure 3.1B). As in Figure 3.1B,
oomycota showed the lowest P450 diversity percentage (15%) compared to other fungal
phyla indicating the highest P450 blooming in oomycetes or the lowest diversity.
A contribution of 76% of P450s by three P450 families CYP5014, CYP5015 and
CYP5017 (Chapter 2, Figure 2.1) resulted in the lowest diversity in oomycetes. This suggests
the blooming of CYP5014, CYP5015 andCYP5017 families in oomycetes. The blooming
nature of P450 families is attributed by tandem duplication of their members (Syed et al.,
2014a; Feyereisen, 2011). The duplicating nature of member P450s is easily identified either
by the highest identity at protein level or analysis of the gene structure (analysis of introns
and exons) between members. Since the oomycetes, genes show the lowest number of introns
in their structure (Kamoun, 2003), it was notideal to perform gene structure analysis to
identify genome-duplicated P450s. Hence, in this study, protein percentage identity criteria
were used to identify P450s that were possibly duplicated in oomycetes.
Detailed analysis of P450 count, families and measured P450 diversity percentage has
been presented previously (Chapter 2, Table 2.4.)As shown in Panel B (Figure 3.1),
Oomycota showed the lowest diversity compared to different fungal phyla, indicating P450
blooming in these organisms. P450 family blooming in oomycetes was measured (i)
percentage of number of P450s tandemly localized on the same scaffold (%NPTL) and (ii)
percentage of NPTL belonging to the same family (%NPTL-SF) in the total number of P450s
in a species. Detailed analysis of P450s that are tandemly localized on scaffolds in each
species and %NPTL and %NPTL-SF is presented in table 3.2.
To assess the duplicate nature of P450s, oomycete P450omes were subjected to
ClustalW2 analysis(Larkin, 2007).The percentage identity between oomycete P450s was
© Central University of Technology, Free State
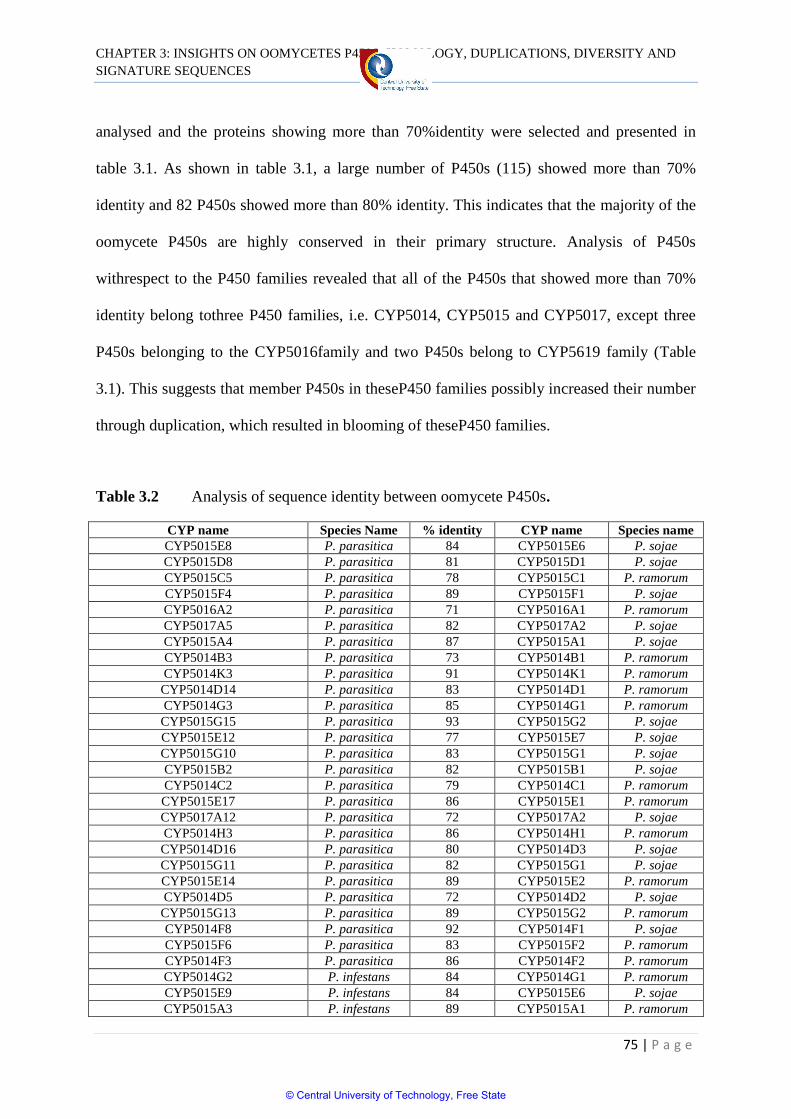
CHAPTER 3: INSIGHTS ON OOMYCETES P450S: HOMOLOGY, DUPLICATIONS, DIVERSITY AND
SIGNATURE SEQUENCES
75 | P a g e
analysed and the proteins showing more than 70%identity were selected and presented in
table 3.1. As shown in table 3.1, a large number of P450s (115) showed more than 70%
identity and 82 P450s showed more than 80% identity. This indicates that the majority of the
oomycete P450s are highly conserved in their primary structure. Analysis of P450s
withrespect to the P450 families revealed that all of the P450s that showed more than 70%
identity belong tothree P450 families, i.e. CYP5014, CYP5015 and CYP5017, except three
P450s belonging to the CYP5016family and two P450s belong to CYP5619 family (Table
3.1). This suggests that member P450s in theseP450 families possibly increased their number
through duplication, which resulted in blooming of theseP450 families.
Table 3.2 Analysis of sequence identity between oomycete P450s.
CYP name Species Name % identity CYP name Species name
CYP5015E8 P. parasitica 84 CYP5015E6 P. sojae
CYP5015D8 P. parasitica 81 CYP5015D1 P. sojae
CYP5015C5 P. parasitica 78 CYP5015C1 P. ramorum
CYP5015F4 P. parasitica 89 CYP5015F1 P. sojae
CYP5016A2 P. parasitica 71 CYP5016A1 P. ramorum
CYP5017A5 P. parasitica 82 CYP5017A2 P. sojae
CYP5015A4 P. parasitica 87 CYP5015A1 P. sojae
CYP5014B3 P. parasitica 73 CYP5014B1 P. ramorum
CYP5014K3 P. parasitica 91 CYP5014K1 P. ramorum
CYP5014D14 P. parasitica 83 CYP5014D1 P. ramorum
CYP5014G3 P. parasitica 85 CYP5014G1 P. ramorum
CYP5015G15 P. parasitica 93 CYP5015G2 P. sojae
CYP5015E12 P. parasitica 77 CYP5015E7 P. sojae
CYP5015G10 P. parasitica 83 CYP5015G1 P. sojae
CYP5015B2 P. parasitica 82 CYP5015B1 P. sojae
CYP5014C2 P. parasitica 79 CYP5014C1 P. ramorum
CYP5015E17 P. parasitica 86 CYP5015E1 P. ramorum
CYP5017A12 P. parasitica 72 CYP5017A2 P. sojae
CYP5014H3 P. parasitica 86 CYP5014H1 P. ramorum
CYP5014D16 P. parasitica 80 CYP5014D3 P. sojae
CYP5015G11 P. parasitica 82 CYP5015G1 P. sojae
CYP5015E14 P. parasitica 89 CYP5015E2 P. ramorum
CYP5014D5 P. parasitica 72 CYP5014D2 P. sojae
CYP5015G13 P. parasitica 89 CYP5015G2 P. ramorum
CYP5014F8 P. parasitica 92 CYP5014F1 P. sojae
CYP5015F6 P. parasitica 83 CYP5015F2 P. ramorum
CYP5014F3 P. parasitica 86 CYP5014F2 P. ramorum
CYP5014G2 P. infestans 84 CYP5014G1 P. ramorum
CYP5015E9 P. infestans 84 CYP5015E6 P. sojae
CYP5015A3 P. infestans 89 CYP5015A1 P. ramorum
© Central University of Technology, Free State
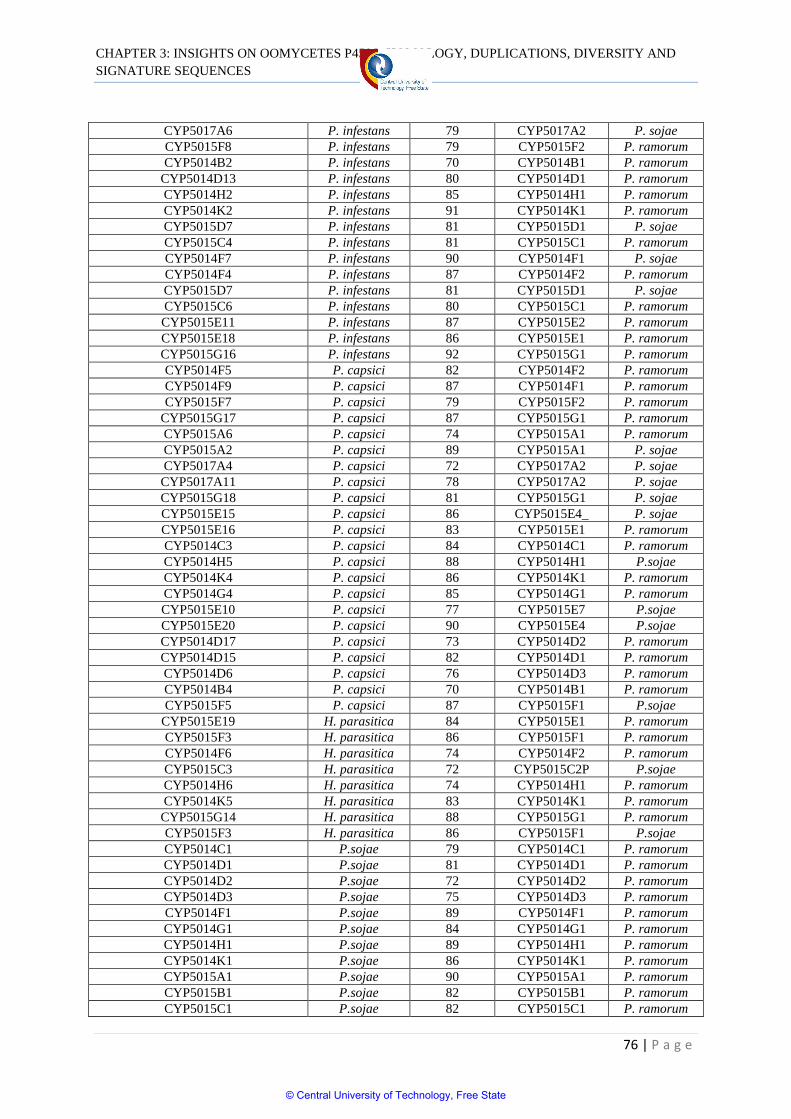
CHAPTER 3: INSIGHTS ON OOMYCETES P450S: HOMOLOGY, DUPLICATIONS, DIVERSITY AND
SIGNATURE SEQUENCES
76 | P a g e
CYP5017A6 P. infestans 79 CYP5017A2 P. sojae
CYP5015F8 P. infestans 79 CYP5015F2 P. ramorum
CYP5014B2 P. infestans 70 CYP5014B1 P. ramorum
CYP5014D13 P. infestans 80 CYP5014D1 P. ramorum
CYP5014H2 P. infestans 85 CYP5014H1 P. ramorum
CYP5014K2 P. infestans 91 CYP5014K1 P. ramorum
CYP5015D7 P. infestans 81 CYP5015D1 P. sojae
CYP5015C4 P. infestans 81 CYP5015C1 P. ramorum
CYP5014F7 P. infestans 90 CYP5014F1 P. sojae
CYP5014F4 P. infestans 87 CYP5014F2 P. ramorum
CYP5015D7 P. infestans 81 CYP5015D1 P. sojae
CYP5015C6 P. infestans 80 CYP5015C1 P. ramorum
CYP5015E11 P. infestans 87 CYP5015E2 P. ramorum
CYP5015E18 P. infestans 86 CYP5015E1 P. ramorum
CYP5015G16 P. infestans 92 CYP5015G1 P. ramorum
CYP5014F5 P. capsici 82 CYP5014F2 P. ramorum
CYP5014F9 P. capsici 87 CYP5014F1 P. ramorum
CYP5015F7 P. capsici 79 CYP5015F2 P. ramorum
CYP5015G17 P. capsici 87 CYP5015G1 P. ramorum
CYP5015A6 P. capsici 74 CYP5015A1 P. ramorum
CYP5015A2 P. capsici 89 CYP5015A1 P. sojae
CYP5017A4 P. capsici 72 CYP5017A2 P. sojae
CYP5017A11 P. capsici 78 CYP5017A2 P. sojae
CYP5015G18 P. capsici 81 CYP5015G1 P. sojae
CYP5015E15 P. capsici 86 CYP5015E4_ P. sojae
CYP5015E16 P. capsici 83 CYP5015E1 P. ramorum
CYP5014C3 P. capsici 84 CYP5014C1 P. ramorum
CYP5014H5 P. capsici 88 CYP5014H1 P.sojae
CYP5014K4 P. capsici 86 CYP5014K1 P. ramorum
CYP5014G4 P. capsici 85 CYP5014G1 P. ramorum
CYP5015E10 P. capsici 77 CYP5015E7 P.sojae
CYP5015E20 P. capsici 90 CYP5015E4 P.sojae
CYP5014D17 P. capsici 73 CYP5014D2 P. ramorum
CYP5014D15 P. capsici 82 CYP5014D1 P. ramorum
CYP5014D6 P. capsici 76 CYP5014D3 P. ramorum
CYP5014B4 P. capsici 70 CYP5014B1 P. ramorum
CYP5015F5 P. capsici 87 CYP5015F1 P.sojae
CYP5015E19 H. parasitica 84 CYP5015E1 P. ramorum
CYP5015F3 H. parasitica 86 CYP5015F1 P. ramorum
CYP5014F6 H. parasitica 74 CYP5014F2 P. ramorum
CYP5015C3 H. parasitica 72 CYP5015C2P P.sojae
CYP5014H6 H. parasitica 74 CYP5014H1 P. ramorum
CYP5014K5 H. parasitica 83 CYP5014K1 P. ramorum
CYP5015G14 H. parasitica 88 CYP5015G1 P. ramorum
CYP5015F3 H. parasitica 86 CYP5015F1 P.sojae
CYP5014C1 P.sojae 79 CYP5014C1 P. ramorum
CYP5014D1 P.sojae 81 CYP5014D1 P. ramorum
CYP5014D2 P.sojae 72 CYP5014D2 P. ramorum
CYP5014D3 P.sojae 75 CYP5014D3 P. ramorum
CYP5014F1 P.sojae 89 CYP5014F1 P. ramorum
CYP5014G1 P.sojae 84 CYP5014G1 P. ramorum
CYP5014H1 P.sojae 89 CYP5014H1 P. ramorum
CYP5014K1 P.sojae 86 CYP5014K1 P. ramorum
CYP5015A1 P.sojae 90 CYP5015A1 P. ramorum
CYP5015B1 P.sojae 82 CYP5015B1 P. ramorum
CYP5015C1 P.sojae 82 CYP5015C1 P. ramorum
© Central University of Technology, Free State
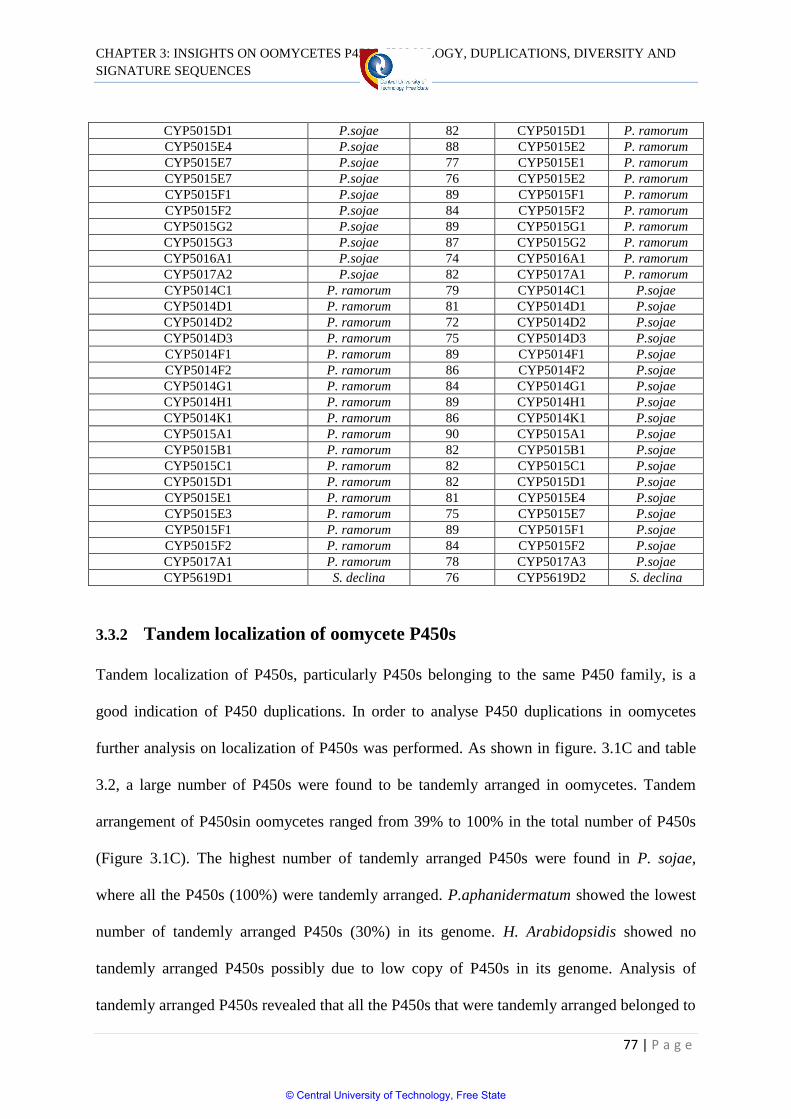
CHAPTER 3: INSIGHTS ON OOMYCETES P450S: HOMOLOGY, DUPLICATIONS, DIVERSITY AND
SIGNATURE SEQUENCES
77 | P a g e
CYP5015D1 P.sojae 82 CYP5015D1 P. ramorum
CYP5015E4 P.sojae 88 CYP5015E2 P. ramorum
CYP5015E7 P.sojae 77 CYP5015E1 P. ramorum
CYP5015E7 P.sojae 76 CYP5015E2 P. ramorum
CYP5015F1 P.sojae 89 CYP5015F1 P. ramorum
CYP5015F2 P.sojae 84 CYP5015F2 P. ramorum
CYP5015G2 P.sojae 89 CYP5015G1 P. ramorum
CYP5015G3 P.sojae 87 CYP5015G2 P. ramorum
CYP5016A1 P.sojae 74 CYP5016A1 P. ramorum
CYP5017A2 P.sojae 82 CYP5017A1 P. ramorum
CYP5014C1 P. ramorum 79 CYP5014C1 P.sojae
CYP5014D1 P. ramorum 81 CYP5014D1 P.sojae
CYP5014D2 P. ramorum 72 CYP5014D2 P.sojae
CYP5014D3 P. ramorum 75 CYP5014D3 P.sojae
CYP5014F1 P. ramorum 89 CYP5014F1 P.sojae
CYP5014F2 P. ramorum 86 CYP5014F2 P.sojae
CYP5014G1 P. ramorum 84 CYP5014G1 P.sojae
CYP5014H1 P. ramorum 89 CYP5014H1 P.sojae
CYP5014K1 P. ramorum 86 CYP5014K1 P.sojae
CYP5015A1 P. ramorum 90 CYP5015A1 P.sojae
CYP5015B1 P. ramorum 82 CYP5015B1 P.sojae
CYP5015C1 P. ramorum 82 CYP5015C1 P.sojae
CYP5015D1 P. ramorum 82 CYP5015D1 P.sojae
CYP5015E1 P. ramorum 81 CYP5015E4 P.sojae
CYP5015E3 P. ramorum 75 CYP5015E7 P.sojae
CYP5015F1 P. ramorum 89 CYP5015F1 P.sojae
CYP5015F2 P. ramorum 84 CYP5015F2 P.sojae
CYP5017A1 P. ramorum 78 CYP5017A3 P.sojae
CYP5619D1 S. declina 76 CYP5619D2 S. declina
3.3.2 Tandem localization of oomycete P450s
Tandem localization of P450s, particularly P450s belonging to the same P450 family, is a
good indication of P450 duplications. In order to analyse P450 duplications in oomycetes
further analysis on localization of P450s was performed. As shown in figure. 3.1C and table
3.2, a large number of P450s were found to be tandemly arranged in oomycetes. Tandem
arrangement of P450sin oomycetes ranged from 39% to 100% in the total number of P450s
(Figure 3.1C). The highest number of tandemly arranged P450s were found in P. sojae,
where all the P450s (100%) were tandemly arranged. P.aphanidermatum showed the lowest
number of tandemly arranged P450s (30%) in its genome. H. Arabidopsidis showed no
tandemly arranged P450s possibly due to low copy of P450s in its genome. Analysis of
tandemly arranged P450s revealed that all the P450s that were tandemly arranged belonged to
© Central University of Technology, Free State
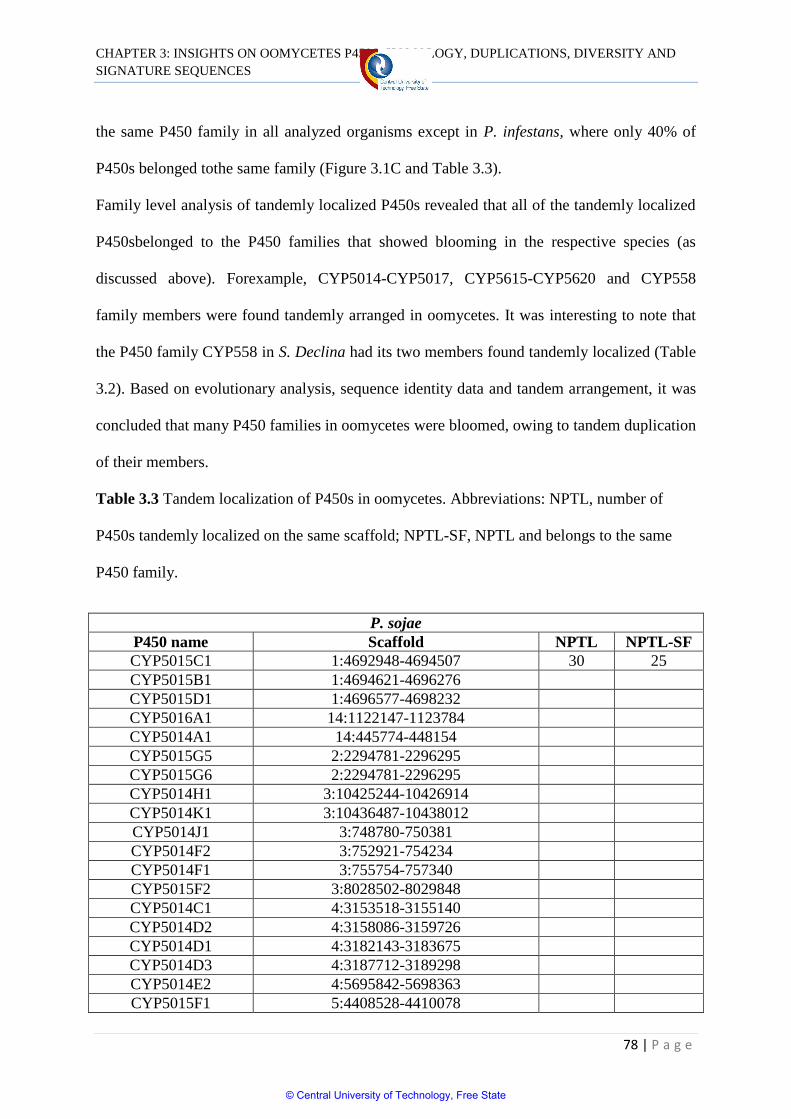
CHAPTER 3: INSIGHTS ON OOMYCETES P450S: HOMOLOGY, DUPLICATIONS, DIVERSITY AND
SIGNATURE SEQUENCES
78 | P a g e
the same P450 family in all analyzed organisms except in P. infestans, where only 40% of
P450s belonged tothe same family (Figure 3.1C and Table 3.3).
Family level analysis of tandemly localized P450s revealed that all of the tandemly localized
P450sbelonged to the P450 families that showed blooming in the respective species (as
discussed above). Forexample, CYP5014-CYP5017, CYP5615-CYP5620 and CYP558
family members were found tandemly arranged in oomycetes. It was interesting to note that
the P450 family CYP558 in S. Declina had its two members found tandemly localized (Table
3.2). Based on evolutionary analysis, sequence identity data and tandem arrangement, it was
concluded that many P450 families in oomycetes were bloomed, owing to tandem duplication
of their members.
Table 3.3 Tandem localization of P450s in oomycetes. Abbreviations: NPTL, number of
P450s tandemly localized on the same scaffold; NPTL-SF, NPTL and belongs to the same
P450 family.
P. sojae
P450 name Scaffold NPTL NPTL-SF
CYP5015C1 1:4692948-4694507 30 25
CYP5015B1 1:4694621-4696276
CYP5015D1 1:4696577-4698232
CYP5016A1 14:1122147-1123784
CYP5014A1 14:445774-448154
CYP5015G5 2:2294781-2296295
CYP5015G6 2:2294781-2296295
CYP5014H1 3:10425244-10426914
CYP5014K1 3:10436487-10438012
CYP5014J1 3:748780-750381
CYP5014F2 3:752921-754234
CYP5014F1 3:755754-757340
CYP5015F2 3:8028502-8029848
CYP5014C1 4:3153518-3155140
CYP5014D2 4:3158086-3159726
CYP5014D1 4:3182143-3183675
CYP5014D3 4:3187712-3189298
CYP5014E2 4:5695842-5698363
CYP5015F1 5:4408528-4410078
© Central University of Technology, Free State
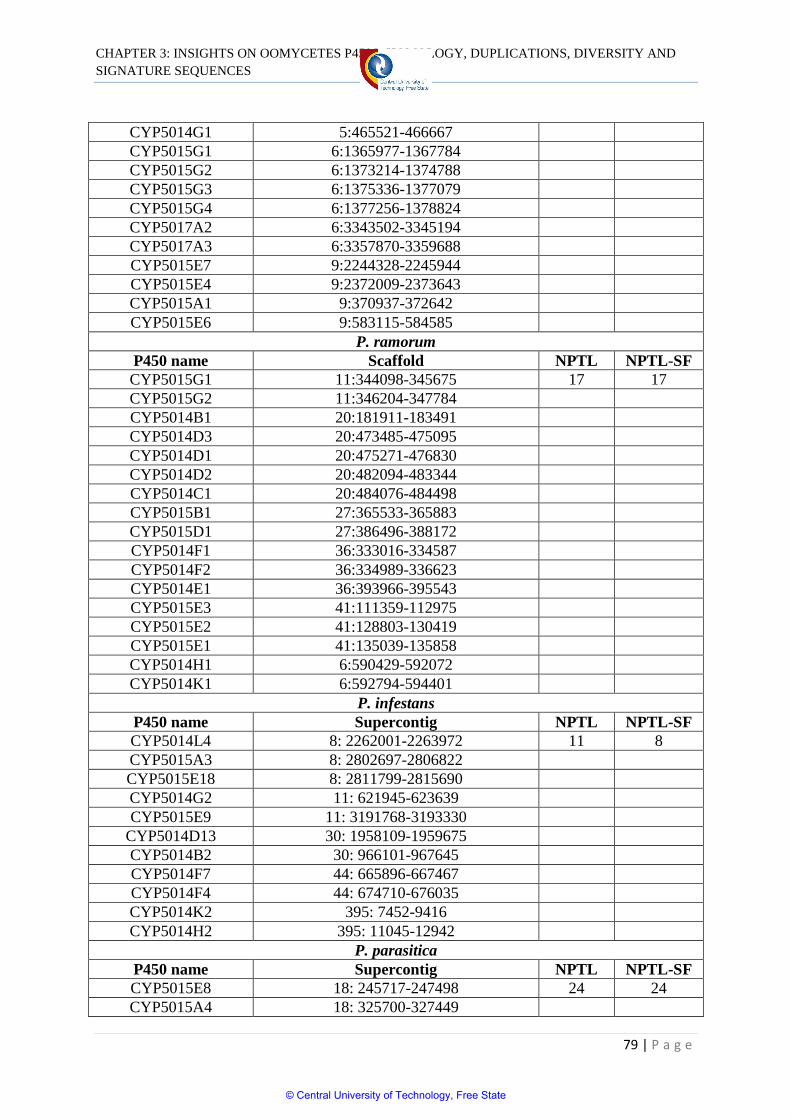
CHAPTER 3: INSIGHTS ON OOMYCETES P450S: HOMOLOGY, DUPLICATIONS, DIVERSITY AND
SIGNATURE SEQUENCES
79 | P a g e
CYP5014G1 5:465521-466667
CYP5015G1 6:1365977-1367784
CYP5015G2 6:1373214-1374788
CYP5015G3 6:1375336-1377079
CYP5015G4 6:1377256-1378824
CYP5017A2 6:3343502-3345194
CYP5017A3 6:3357870-3359688
CYP5015E7 9:2244328-2245944
CYP5015E4 9:2372009-2373643
CYP5015A1 9:370937-372642
CYP5015E6 9:583115-584585
P. ramorum
P450 name Scaffold NPTL NPTL-SF
CYP5015G1 11:344098-345675 17 17
CYP5015G2 11:346204-347784
CYP5014B1 20:181911-183491
CYP5014D3 20:473485-475095
CYP5014D1 20:475271-476830
CYP5014D2 20:482094-483344
CYP5014C1 20:484076-484498
CYP5015B1 27:365533-365883
CYP5015D1 27:386496-388172
CYP5014F1 36:333016-334587
CYP5014F2 36:334989-336623
CYP5014E1 36:393966-395543
CYP5015E3 41:111359-112975
CYP5015E2 41:128803-130419
CYP5015E1 41:135039-135858
CYP5014H1 6:590429-592072
CYP5014K1 6:592794-594401
P. infestans
P450 name Supercontig NPTL NPTL-SF
CYP5014L4 8: 2262001-2263972 11 8
CYP5015A3 8: 2802697-2806822
CYP5015E18 8: 2811799-2815690
CYP5014G2 11: 621945-623639
CYP5015E9 11: 3191768-3193330
CYP5014D13 30: 1958109-1959675
CYP5014B2 30: 966101-967645
CYP5014F7 44: 665896-667467
CYP5014F4 44: 674710-676035
CYP5014K2 395: 7452-9416
CYP5014H2 395: 11045-12942
P. parasitica
P450 name Supercontig NPTL NPTL-SF
CYP5015E8 18: 245717-247498 24 24
CYP5015A4 18: 325700-327449
© Central University of Technology, Free State
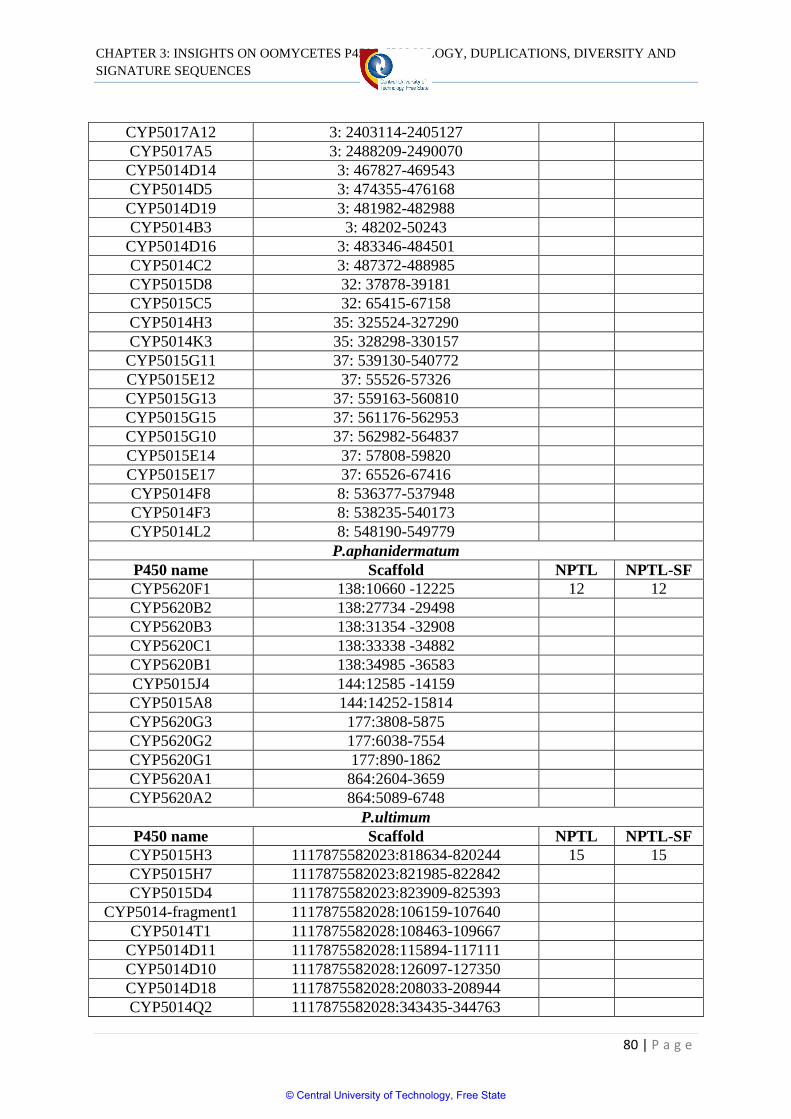
CHAPTER 3: INSIGHTS ON OOMYCETES P450S: HOMOLOGY, DUPLICATIONS, DIVERSITY AND
SIGNATURE SEQUENCES
80 | P a g e
CYP5017A12 3: 2403114-2405127
CYP5017A5 3: 2488209-2490070
CYP5014D14 3: 467827-469543
CYP5014D5 3: 474355-476168
CYP5014D19 3: 481982-482988
CYP5014B3 3: 48202-50243
CYP5014D16 3: 483346-484501
CYP5014C2 3: 487372-488985
CYP5015D8 32: 37878-39181
CYP5015C5 32: 65415-67158
CYP5014H3 35: 325524-327290
CYP5014K3 35: 328298-330157
CYP5015G11 37: 539130-540772
CYP5015E12 37: 55526-57326
CYP5015G13 37: 559163-560810
CYP5015G15 37: 561176-562953
CYP5015G10 37: 562982-564837
CYP5015E14 37: 57808-59820
CYP5015E17 37: 65526-67416
CYP5014F8 8: 536377-537948
CYP5014F3 8: 538235-540173
CYP5014L2 8: 548190-549779
P.aphanidermatum
P450 name Scaffold NPTL NPTL-SF
CYP5620F1 138:10660 -12225 12 12
CYP5620B2 138:27734 -29498
CYP5620B3 138:31354 -32908
CYP5620C1 138:33338 -34882
CYP5620B1 138:34985 -36583
CYP5015J4 144:12585 -14159
CYP5015A8 144:14252-15814
CYP5620G3 177:3808-5875
CYP5620G2 177:6038-7554
CYP5620G1 177:890-1862
CYP5620A1 864:2604-3659
CYP5620A2 864:5089-6748
P.ultimum
P450 name Scaffold NPTL NPTL-SF
CYP5015H3 1117875582023:818634-820244 15 15
CYP5015H7 1117875582023:821985-822842
CYP5015D4 1117875582023:823909-825393
CYP5014-fragment1 1117875582028:106159-107640
CYP5014T1 1117875582028:108463-109667
CYP5014D11 1117875582028:115894-117111
CYP5014D10 1117875582028:126097-127350
CYP5014D18 1117875582028:208033-208944
CYP5014Q2 1117875582028:343435-344763
© Central University of Technology, Free State
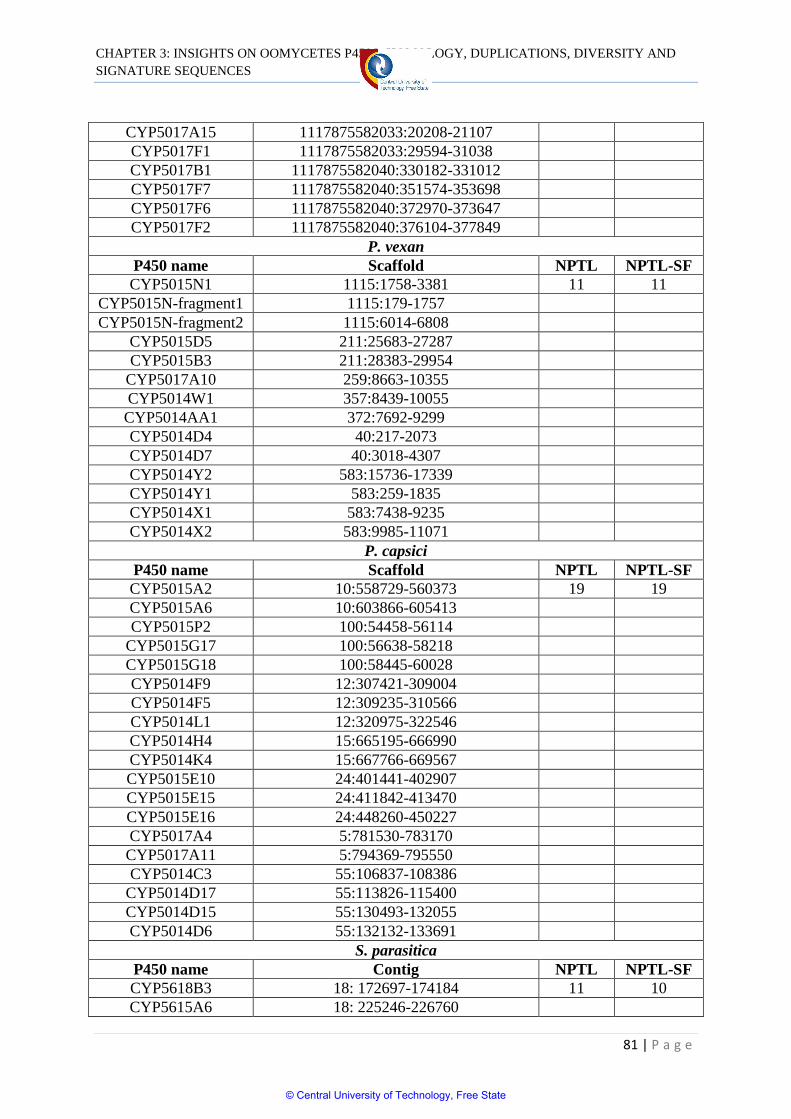
CHAPTER 3: INSIGHTS ON OOMYCETES P450S: HOMOLOGY, DUPLICATIONS, DIVERSITY AND
SIGNATURE SEQUENCES
81 | P a g e
CYP5017A15 1117875582033:20208-21107
CYP5017F1 1117875582033:29594-31038
CYP5017B1 1117875582040:330182-331012
CYP5017F7 1117875582040:351574-353698
CYP5017F6 1117875582040:372970-373647
CYP5017F2 1117875582040:376104-377849
P. vexan
P450 name Scaffold NPTL NPTL-SF
CYP5015N1 1115:1758-3381 11 11
CYP5015N-fragment1 1115:179-1757
CYP5015N-fragment2 1115:6014-6808
CYP5015D5 211:25683-27287
CYP5015B3 211:28383-29954
CYP5017A10 259:8663-10355
CYP5014W1 357:8439-10055
CYP5014AA1 372:7692-9299
CYP5014D4 40:217-2073
CYP5014D7 40:3018-4307
CYP5014Y2 583:15736-17339
CYP5014Y1 583:259-1835
CYP5014X1 583:7438-9235
CYP5014X2 583:9985-11071
P. capsici
P450 name Scaffold NPTL NPTL-SF
CYP5015A2 10:558729-560373 19 19
CYP5015A6 10:603866-605413
CYP5015P2 100:54458-56114
CYP5015G17 100:56638-58218
CYP5015G18 100:58445-60028
CYP5014F9 12:307421-309004
CYP5014F5 12:309235-310566
CYP5014L1 12:320975-322546
CYP5014H4 15:665195-666990
CYP5014K4 15:667766-669567
CYP5015E10 24:401441-402907
CYP5015E15 24:411842-413470
CYP5015E16 24:448260-450227
CYP5017A4 5:781530-783170
CYP5017A11 5:794369-795550
CYP5014C3 55:106837-108386
CYP5014D17 55:113826-115400
CYP5014D15 55:130493-132055
CYP5014D6 55:132132-133691
S. parasitica
P450 name Contig NPTL NPTL-SF
CYP5618B3 18: 172697-174184 11 10
CYP5615A6 18: 225246-226760
© Central University of Technology, Free State
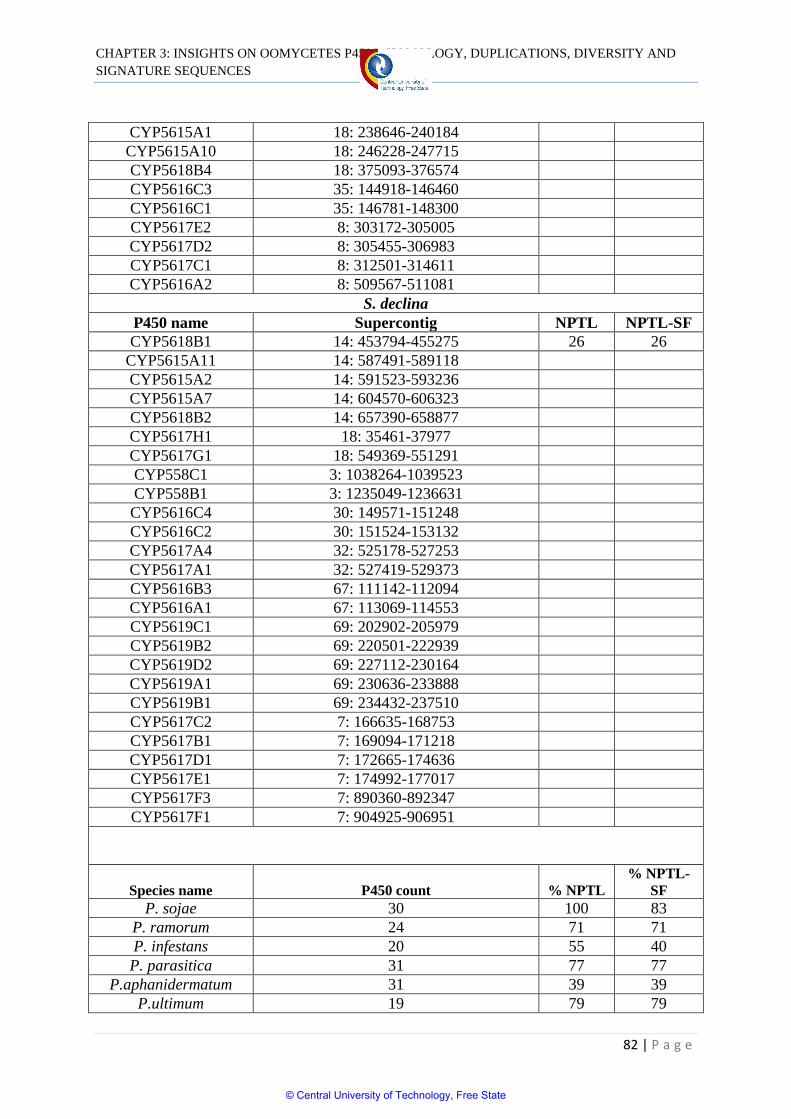
CHAPTER 3: INSIGHTS ON OOMYCETES P450S: HOMOLOGY, DUPLICATIONS, DIVERSITY AND
SIGNATURE SEQUENCES
82 | P a g e
CYP5615A1 18: 238646-240184
CYP5615A10 18: 246228-247715
CYP5618B4 18: 375093-376574
CYP5616C3 35: 144918-146460
CYP5616C1 35: 146781-148300
CYP5617E2 8: 303172-305005
CYP5617D2 8: 305455-306983
CYP5617C1 8: 312501-314611
CYP5616A2 8: 509567-511081
S. declina
P450 name Supercontig NPTL NPTL-SF
CYP5618B1 14: 453794-455275 26 26
CYP5615A11 14: 587491-589118
CYP5615A2 14: 591523-593236
CYP5615A7 14: 604570-606323
CYP5618B2 14: 657390-658877
CYP5617H1 18: 35461-37977
CYP5617G1 18: 549369-551291
CYP558C1 3: 1038264-1039523
CYP558B1 3: 1235049-1236631
CYP5616C4 30: 149571-151248
CYP5616C2 30: 151524-153132
CYP5617A4 32: 525178-527253
CYP5617A1 32: 527419-529373
CYP5616B3 67: 111142-112094
CYP5616A1 67: 113069-114553
CYP5619C1 69: 202902-205979
CYP5619B2 69: 220501-222939
CYP5619D2 69: 227112-230164
CYP5619A1 69: 230636-233888
CYP5619B1 69: 234432-237510
CYP5617C2 7: 166635-168753
CYP5617B1 7: 169094-171218
CYP5617D1 7: 172665-174636
CYP5617E1 7: 174992-177017
CYP5617F3 7: 890360-892347
CYP5617F1 7: 904925-906951
Species name P450 count % NPTL
% NPTL-
SF
P. sojae 30 100 83
P. ramorum 24 71 71
P. infestans 20 55 40
P. parasitica 31 77 77
P.aphanidermatum 31 39 39
P.ultimum 19 79 79
© Central University of Technology, Free State
CHAPTER 3: INSIGHTS ON OOMYCETES P450S: HOMOLOGY, DUPLICATIONS, DIVERSITY AND
SIGNATURE SEQUENCES
83 | P a g e
P. vexan 21 52 52
P. capsici 28 68 68
S. parasitica 24 46 42
S. declina 39 67 67
3.3.3 Oomycete P450 family characteristic amino acid patterns at EXXR
and CXG motifs
A recent study revealed that a certain combination of amino acid patterns at EXXR and CXG
motifs are characteristic of a P450 family (Syed & Mashele, 2014). Authors have suggested
that these amino acid patterns are evolved during theP450 family divergence from a common
ancestor and are retained in family members as a characteristic of the family (Syed &
Mashele, 2014). Considering the large number of member P450s, in this study, amino
acidcombinations for P450 families such as CYP5014, CYP5015 and CYP5017were
analysed (Figure 3.3 and Table 3.3). Analysis of the EXXR motif revealed that the first and
fourth amino acids of this motif “E” and “R” is conserved in all P450 families CYP5014,
CYP5015 and CYP5017 with rare exceptions. CYP5017F8 showed “K” instead of “E” and
CYP5014N1 and CYP5015L showed “W” and “H” instead of “R” (Figure 3.3) below. Non-
conservation of “E” and “R” amino acids at the EXXR motif are reported rarely (Sezutsu et
al., 2013). Leucine is the major amino acid appearing at the third position in this motif in all
three oomycetes P450 families. Threonine is the predominant amino acid at the second
position in P450 families CYP5014 and CYP5017, whereas serine and aspargine are the
predominant amino acids at this position in the CYP5015 family (Figure 3.3). Compared to
P450 families across the biological kingdoms (Syed & Mashele, 2014), oomycete P450
families CYP5014 and CYP5017 alsoshowed ETLR as predominant amino pattern. However,
the E-S/N-L-R amino acid pattern where “S/N”is the predominant amino acid at the second
© Central University of Technology, Free State
CHAPTER 3: INSIGHTS ON OOMYCETES P450S: HOMOLOGY, DUPLICATIONS, DIVERSITY AND
SIGNATURE SEQUENCES
84 | P a g e
position is unique to the CYP5015 family and this patternwas not found in P450 families
published in the literature(Syed & Mashele, 2014). Analysis of the CXG motif
(FXXGXRXCXG) across the three P450 families revealed conservation of amino acids such
as “F”, “G” and “C” at the first, fourth and eighth positions. These amino acids at these
positions are well known to be conserved inthe P450s across the biological kingdoms (Syed
& Mashele, 2014; Gotoh, 1992; Sirim et al., 2010), with some P450s showing variant amino
acids at these positions (Sezutsu, 3013). The canonical amino acids “R” and “G” at the sixth
and tenth positions are conserved in theCYP5014 family and are predominant in CYP5015
and CYP5017 (Figure 3.3). The amino acid pattern at the CXG motif of the CYP5017 family
is to some extent matched with the CYP94 and CYP704 families (Syed & Mashele, 2014)
where “Q” is dominant at the second position in all these P450 families. However,
differences were found at the seventh and ninth position amino acids among the three P450
families CYP5017, CYP94and CYP704. Comparison of CXG motif amino acid patterns for
CYP5014 and CYP5015 with publishedP450 families CXG motif amino acid patterns (Syed
& Mashele, 2014) suggested that these families have unique amino acid patterns. This
strongly supports the hypothesis previously proposed (Syed &Mashele, 2014) that the amino
acid pattern at these motifs is unique for a P450 family. Overall, amino acid patterns at the
EXXR and CXG motifs of the three oomycete P450 families CYP5014, CYP5015 and
CYP5017 are unique and these amino acid patterns (Figure 3.2) can be considered
characteristics of these P450 families.
© Central University of Technology, Free State
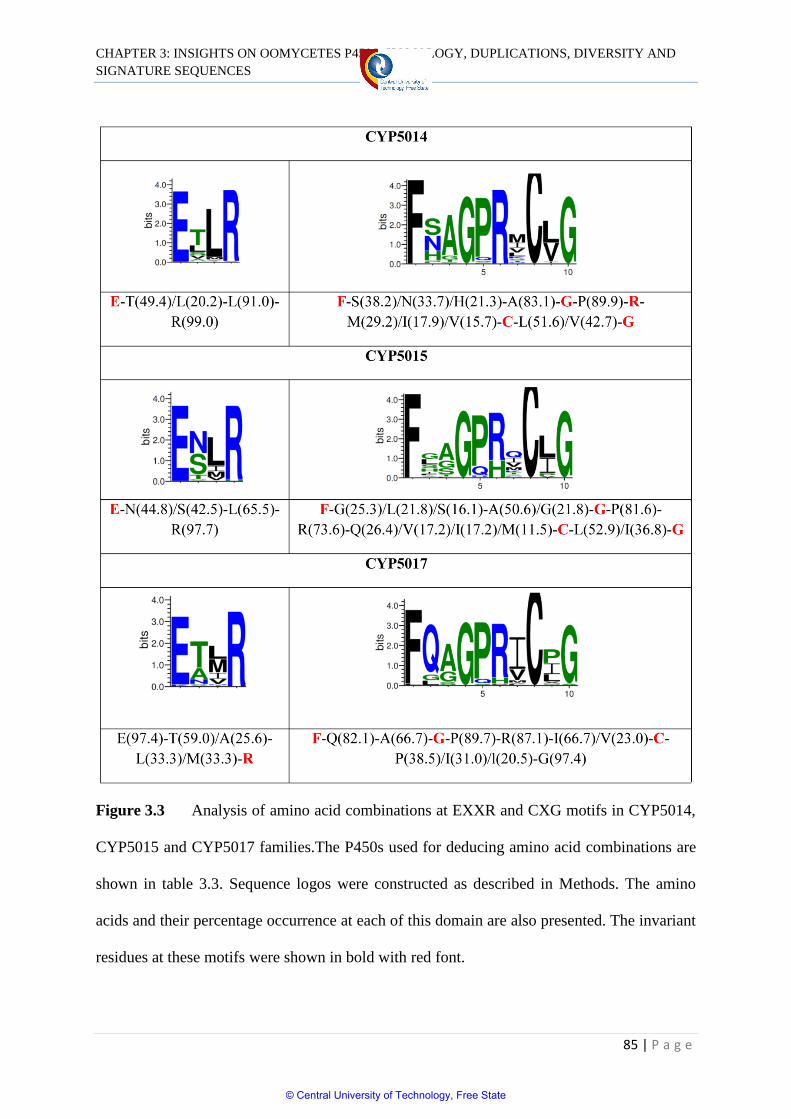
CHAPTER 3: INSIGHTS ON OOMYCETES P450S: HOMOLOGY, DUPLICATIONS, DIVERSITY AND
SIGNATURE SEQUENCES
85 | P a g e
Figure 3.3 Analysis of amino acid combinations at EXXR and CXG motifs in CYP5014,
CYP5015 and CYP5017 families.The P450s used for deducing amino acid combinations are
shown in table 3.3. Sequence logos were constructed as described in Methods. The amino
acids and their percentage occurrence at each of this domain are also presented. The invariant
residues at these motifs were shown in bold with red font.
© Central University of Technology, Free State
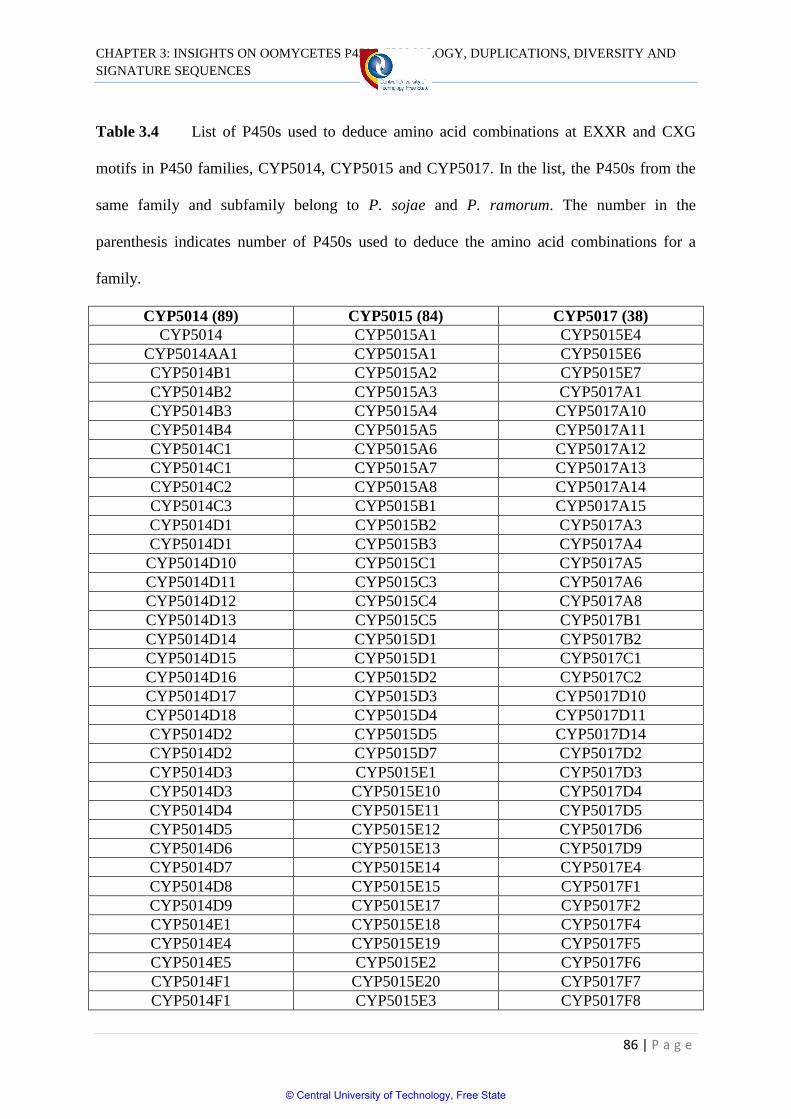
CHAPTER 3: INSIGHTS ON OOMYCETES P450S: HOMOLOGY, DUPLICATIONS, DIVERSITY AND
SIGNATURE SEQUENCES
86 | P a g e
Table 3.4 List of P450s used to deduce amino acid combinations at EXXR and CXG
motifs in P450 families, CYP5014, CYP5015 and CYP5017. In the list, the P450s from the
same family and subfamily belong to P. sojae and P. ramorum. The number in the
parenthesis indicates number of P450s used to deduce the amino acid combinations for a
family.
CYP5014 (89) CYP5015 (84) CYP5017 (38)
CYP5014 CYP5015A1 CYP5015E4
CYP5014AA1 CYP5015A1 CYP5015E6
CYP5014B1 CYP5015A2 CYP5015E7
CYP5014B2 CYP5015A3 CYP5017A1
CYP5014B3 CYP5015A4 CYP5017A10
CYP5014B4 CYP5015A5 CYP5017A11
CYP5014C1 CYP5015A6 CYP5017A12
CYP5014C1 CYP5015A7 CYP5017A13
CYP5014C2 CYP5015A8 CYP5017A14
CYP5014C3 CYP5015B1 CYP5017A15
CYP5014D1 CYP5015B2 CYP5017A3
CYP5014D1 CYP5015B3 CYP5017A4
CYP5014D10 CYP5015C1 CYP5017A5
CYP5014D11 CYP5015C3 CYP5017A6
CYP5014D12 CYP5015C4 CYP5017A8
CYP5014D13 CYP5015C5 CYP5017B1
CYP5014D14 CYP5015D1 CYP5017B2
CYP5014D15 CYP5015D1 CYP5017C1
CYP5014D16 CYP5015D2 CYP5017C2
CYP5014D17 CYP5015D3 CYP5017D10
CYP5014D18 CYP5015D4 CYP5017D11
CYP5014D2 CYP5015D5 CYP5017D14
CYP5014D2 CYP5015D7 CYP5017D2
CYP5014D3 CYP5015E1 CYP5017D3
CYP5014D3 CYP5015E10 CYP5017D4
CYP5014D4 CYP5015E11 CYP5017D5
CYP5014D5 CYP5015E12 CYP5017D6
CYP5014D6 CYP5015E13 CYP5017D9
CYP5014D7 CYP5015E14 CYP5017E4
CYP5014D8 CYP5015E15 CYP5017F1
CYP5014D9 CYP5015E17 CYP5017F2
CYP5014E1 CYP5015E18 CYP5017F4
CYP5014E4 CYP5015E19 CYP5017F5
CYP5014E5 CYP5015E2 CYP5017F6
CYP5014F1 CYP5015E20 CYP5017F7
CYP5014F1 CYP5015E3 CYP5017F8
© Central University of Technology, Free State
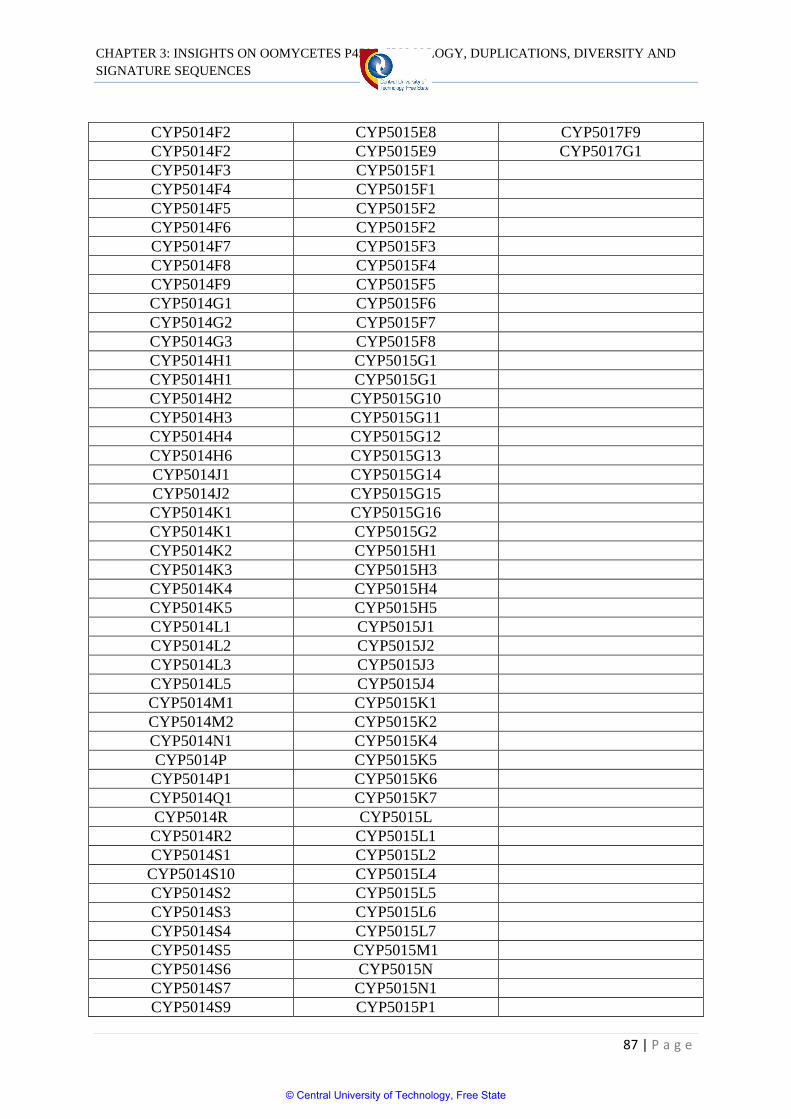
CHAPTER 3: INSIGHTS ON OOMYCETES P450S: HOMOLOGY, DUPLICATIONS, DIVERSITY AND
SIGNATURE SEQUENCES
87 | P a g e
CYP5014F2 CYP5015E8 CYP5017F9
CYP5014F2 CYP5015E9 CYP5017G1
CYP5014F3 CYP5015F1
CYP5014F4 CYP5015F1
CYP5014F5 CYP5015F2
CYP5014F6 CYP5015F2
CYP5014F7 CYP5015F3
CYP5014F8 CYP5015F4
CYP5014F9 CYP5015F5
CYP5014G1 CYP5015F6
CYP5014G2 CYP5015F7
CYP5014G3 CYP5015F8
CYP5014H1 CYP5015G1
CYP5014H1 CYP5015G1
CYP5014H2 CYP5015G10
CYP5014H3 CYP5015G11
CYP5014H4 CYP5015G12
CYP5014H6 CYP5015G13
CYP5014J1 CYP5015G14
CYP5014J2 CYP5015G15
CYP5014K1 CYP5015G16
CYP5014K1 CYP5015G2
CYP5014K2 CYP5015H1
CYP5014K3 CYP5015H3
CYP5014K4 CYP5015H4
CYP5014K5 CYP5015H5
CYP5014L1 CYP5015J1
CYP5014L2 CYP5015J2
CYP5014L3 CYP5015J3
CYP5014L5 CYP5015J4
CYP5014M1 CYP5015K1
CYP5014M2 CYP5015K2
CYP5014N1 CYP5015K4
CYP5014P CYP5015K5
CYP5014P1 CYP5015K6
CYP5014Q1 CYP5015K7
CYP5014R CYP5015L
CYP5014R2 CYP5015L1
CYP5014S1 CYP5015L2
CYP5014S10 CYP5015L4
CYP5014S2 CYP5015L5
CYP5014S3 CYP5015L6
CYP5014S4 CYP5015L7
CYP5014S5 CYP5015M1
CYP5014S6 CYP5015N
CYP5014S7 CYP5015N1
CYP5014S9 CYP5015P1
© Central University of Technology, Free State
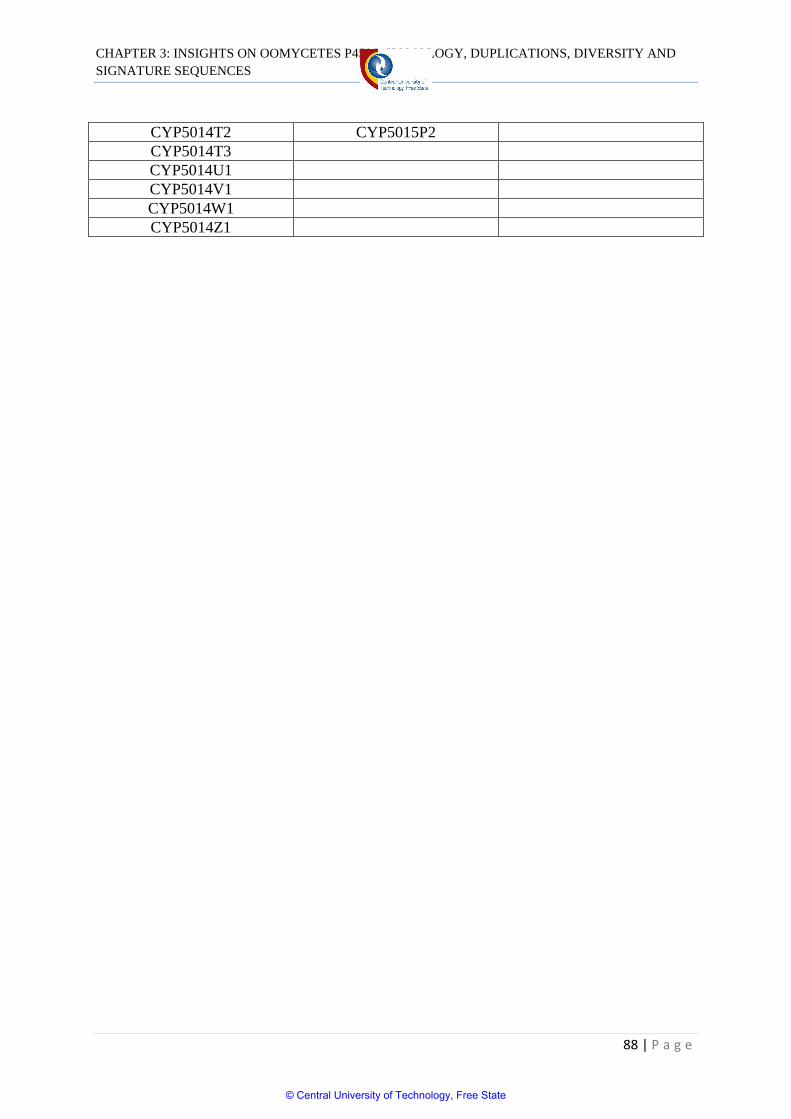
CHAPTER 3: INSIGHTS ON OOMYCETES P450S: HOMOLOGY, DUPLICATIONS, DIVERSITY AND
SIGNATURE SEQUENCES
88 | P a g e
CYP5014T2 CYP5015P2
CYP5014T3
CYP5014U1
CYP5014V1
CYP5014W1
CYP5014Z1
© Central University of Technology, Free State
CHAPTER 3: INSIGHTS ON OOMYCETES P450S: HOMOLOGY, DUPLICATIONS, DIVERSITY AND
SIGNATURE SEQUENCES
89 | P a g e
3.4 Conclusion
Though they have shown lower statistics in comparison with fungi in this study, oomycetes
are not left behind in the P450 evolutionary race, thereby keeping up with the ecosystem. The
increased percentage identity suggesting duplication and hence family bloom is observed in
their P450s.The P450 signature motifs are highly conserved across all P450 families in all
organisms however, the amino acids patterns at these regions are totally different among
P450 families, and hence each family has its own amino acids display.
© Central University of Technology, Free State
CHAPTER 3: INSIGHTS ON OOMYCETES P450S: HOMOLOGY, DUPLICATIONS, DIVERSITY AND
SIGNATURE SEQUENCES
90 | P a g e
3.5 References
Cresnar, B., Petric, S. (2011). Cytochrome enzymes in the fungal kingdom. Biochimica et
BiophysicaActa, 1814: 29–35.
Crooks, G. E., Hon, G., Chandonia, J. M., Brenner, S. E. (2004). WebLogo: A sequence logo
generator. Genome Research,14:1188–1190.
Feyereisen, R. (2011). Arthropod CYPomes illustrate the tempo and mode in P450 evolution.
Biochim.Biophys.Acta, 1814: 19–28.
Gotoh, O. (1992). Substrate recognition sites in cytochrome P450 family 2 (CYP2) proteins
inferred from comparative analyses of amino acid and coding nucleotide sequences. J. Biol.
Chem, 267: 83–90.
Kamoun, S. (2003). Molecular genetics of pathogenic oomycetes.Eukaryot. Cell, 2: 191–199.
Kgosiemang, I. K. R., Mashele, S. S., Syed, K. (2014). Comparative genomics and
evolutionary analysis of cytochrome P450monooxygenases in fungal subphylum
saccharomycotina.J. Pure Appl. Microbiol, 8:291–302.
Larkin, M. A., Blackshields, G., Brown, N. P., henna, R., McGettigan1, H. McWilliam, P.A.,
Valentin, F., Wallace, I.M.,Wilm, A., Lopez, R., Thompson, J.D., Gibson, T.J., Higgins,
D.G. (2007). Clustal W and Clutal X version 2.0. Bioinformatics, 23: 2947–2948.
© Central University of Technology, Free State
CHAPTER 3: INSIGHTS ON OOMYCETES P450S: HOMOLOGY, DUPLICATIONS, DIVERSITY AND
SIGNATURE SEQUENCES
91 | P a g e
Li, Z. Z., Li, X. F., Yang, W., Dong, X., Yu, J. (2013). Identification and functional analysis
of cytochrome P450 complement in Streptomyces virginiae IBL14. BMC Genomics, 14: 130.
doi: 10.1186/1471-2164-14-130.
Loewenstein, Y., Raimondo, D., Redfern, O. C., Watson, J., Frishman, D., Linial, M.,
Orengo, C., Thornton, J., Tramontano, A. (2009). Protein function annotation by homology-
based inference. Genome Biology, 10:207 doi:10.1186/gb-2009-10-2-207.
National Centre for Science Education (NCSE), (2008). Molecular homology. Available
from: http://ncse.com/creationism/analysis/molecular-homology. [Accessed: 02/10/2015]
Nelson, D. (2011). Progress in tracing the evolutionary paths of cytochrome P450.
Biochimica et Biophysica Acta 1814: 14–18.
Rupasinghe, S., Schuler, M. A., Kagawa, N., Yuan, H., Lei, L., Zhao, B., Kelly, S. L.,
Waterman, M. R., Lamb, D. C. (2006). The cytochrome P450 gene family CYP157 does not
contain EXXR in the K-helix reducing the absolute conserved P450 residues to a single
cysteine. FEBS Lett, 580: 6338–6342. doi: 10.1016/j.febslet.2006.10.043.
Schneider, T. D., Stephens, R. M. (1990). Sequence logos: A new way to display consensus
sequences. Nucleic Acids Res, 18:6097–6100.
Sezutsu, H., Le Goff, G., Feyereisen, R. (2013). Origins of P450 diversity. Phil. Trans. R.
Soc. B. Biol. Sci. 368, 20120428.
© Central University of Technology, Free State
CHAPTER 3: INSIGHTS ON OOMYCETES P450S: HOMOLOGY, DUPLICATIONS, DIVERSITY AND
SIGNATURE SEQUENCES
92 | P a g e
Sirim, D., Widmann, M., Wagner, F., Pleiss, J. (2010). Prediction and analysis of the modular
structure of cytochrome P450 monooxygenases. BMC Struct, Biol. 10: 34.
Syed, K., Nelson, D. R., Riley, R., Yadav, J. S. (2013). Genome-wide annotation and
comparative genomics of cytochrome P450monooxygenases (P450s) in the Polyporale
species Bjerkanderaadusta, Ganodermasp.AndPhlebiabrevispora.Mycologia, 105:1445–145.
Syed, K., Shale, K., Pagadala, N. S., Tuszynski, J. (2014a). Systematic identification and
evolutionary analysis of catalytically versatile cytochrome P450 monooxygenase families
enriched in model basidiomycete fungi. PLoS ONE, 9(1): e86683.
Syed, K., Shale, K., Nazir, K. H. M. N. H., Krasevec, N., Mashele, S. S.,Pagadala, N. S
.(2014b). Genome-wide identification, annotation and characterization of novel
thermostablecytochrome P450monooxygenases from the thermophilic biomass-degrading
fungi Thielavia terrestris and Myceliophthora thermophila. GeneGenom, 36:321–333.
Syed, K., Mashele, S. S. (2014). Comparative analysis of P450 signature motifs EXXR and
CXG in the large and diverse kingdom of fungi: Identification of evolutionarily conserved
amino acid patterns characteristic of P450 family. PLoS ONE, 9(4):e95616.
Tamura, K., .Peterson, D., Peterson, N., Stecher, G., Nei, M., Kumar, S. (2011). MEGA5:
Molecular evolutionary genetics analysis using maximum likelihood, evolutionary distance,
andmaximum parsimony methods. Mol. Biol. Evol, 28:2731–2739.
© Central University of Technology, Free State
CHAPTER 4: GENOME DATA MINING, ANNOTATION AND PHYLOGENETIC ANALYSIS OF
P450 FUSED PROTEINS
93 | P a g e
CHAPTER 4
GENOME DATA MINING, ANNOTATION AND
PHYLOGENETIC ANALYSIS OF P450 FUSED
PROTEINS
4.1 Introduction
The general knowledge about P450s is that they are very versatile redox enzymes, consisting
of a heme group tethered to a thiolate group hence why called heme-thiolate proteins and
they can activate dormant molecular oxygen. However, P450s are also involved in catalytic
reactions that are not of redox nature. The “mixed function” of P450s has been elucidated in
Guengerich & Munro (2013). Before the discovery of unusual P450 properties, they were
divided into two classes. Class I found in prokaryotes‟ cytosol in three component form
(P450–Fdx–FDR electron chain) and class II which is in eukaryotes‟ endoplasmic reticulum
(ER) with P450–CPR electron chain. The classification took a turn after discovery of a
reductase partner system consisting of two-iron, two-sulfur cluster/protein, bovine
adrenodoxin and a flavin adenine dinucleotide containing adrenodoxin reductase (2Fe–2S-
Adx-FAD-ADR) (Lamb & Waterman, 2013).
In both prokaryotes and eukaryotes, some P450s have been identified to be attached to
reductases by a covalent bond. This is believed to be of advantage over the non-linked P450s
as it enhances efficacy (The European Bioinformatics Institute. n.d.; McLean et al., 2007).
Usually the fusion proteins comprise of only functional groups “domains” of the two joined
proteins not the other remnants of the involved proteins (Fisher et al., 2003). This P450
© Central University of Technology, Free State
CHAPTER 4: GENOME DATA MINING, ANNOTATION AND PHYLOGENETIC ANALYSIS OF
P450 FUSED PROTEINS
94 | P a g e
fusion system has sketched a direction on how to utilise P450s for synthesis of various
products. Nowadays P450s have been manipulated by fusion with other enzymes to produce
catalysts of desired function (McLean et al., 2007).
The first P450 protein that was identified to be fused with a reductase was CYP102
also known as P450BM3 from a bacterium Bacillus megaterium (Kitazume et al., 2000).
CYP102 is attached to the cytochrome P450 reductase (CPR) that contains flavin
mononucleotide (FMN) and flavin adenine dinucleotide (FAD) at its C-terminal end (Lamb
& Waterman, 2013). The catalytic rate of CYP102 has never been matched by any P450
enzyme known since the discovery of P450 fused proteins. This has made it the enzyme of
interest as it has been engineered to produce many of its variants for different desired out
comes. Other reductase fused P450s have been identified also and manipulation of these
proteins, particularly CYP116B1 and CYP116B2 resulted in identification of the binding
pattern or arrangement of constituents that form the P450 fused protein (Guengerich &
Munro, 2013). Eventually, the “diversity of P450 redox system” was established (Figure 4.1)
(Lamb & Waterman, 2013; Guengerich & Munro, 2013).
© Central University of Technology, Free State
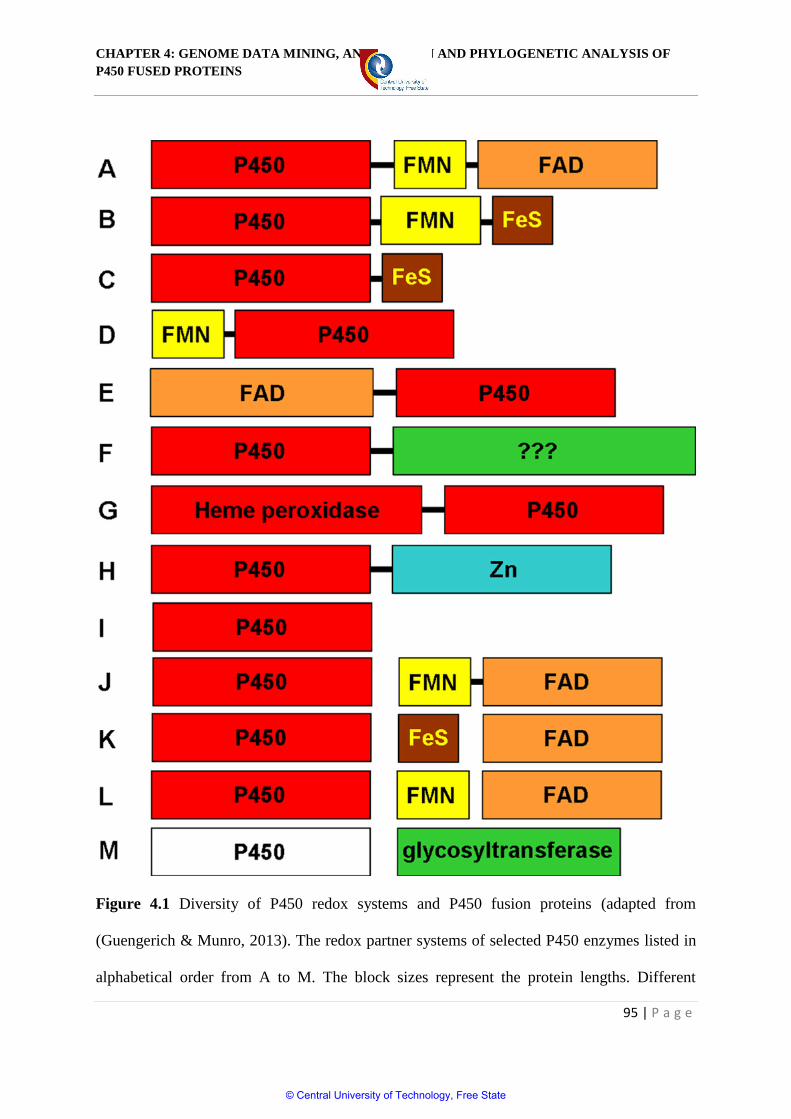
CHAPTER 4: GENOME DATA MINING, ANNOTATION AND PHYLOGENETIC ANALYSIS OF
P450 FUSED PROTEINS
95 | P a g e
Figure 4.1 Diversity of P450 redox systems and P450 fusion proteins (adapted from
(Guengerich & Munro, 2013). The redox partner systems of selected P450 enzymes listed in
alphabetical order from A to M. The block sizes represent the protein lengths. Different
© Central University of Technology, Free State
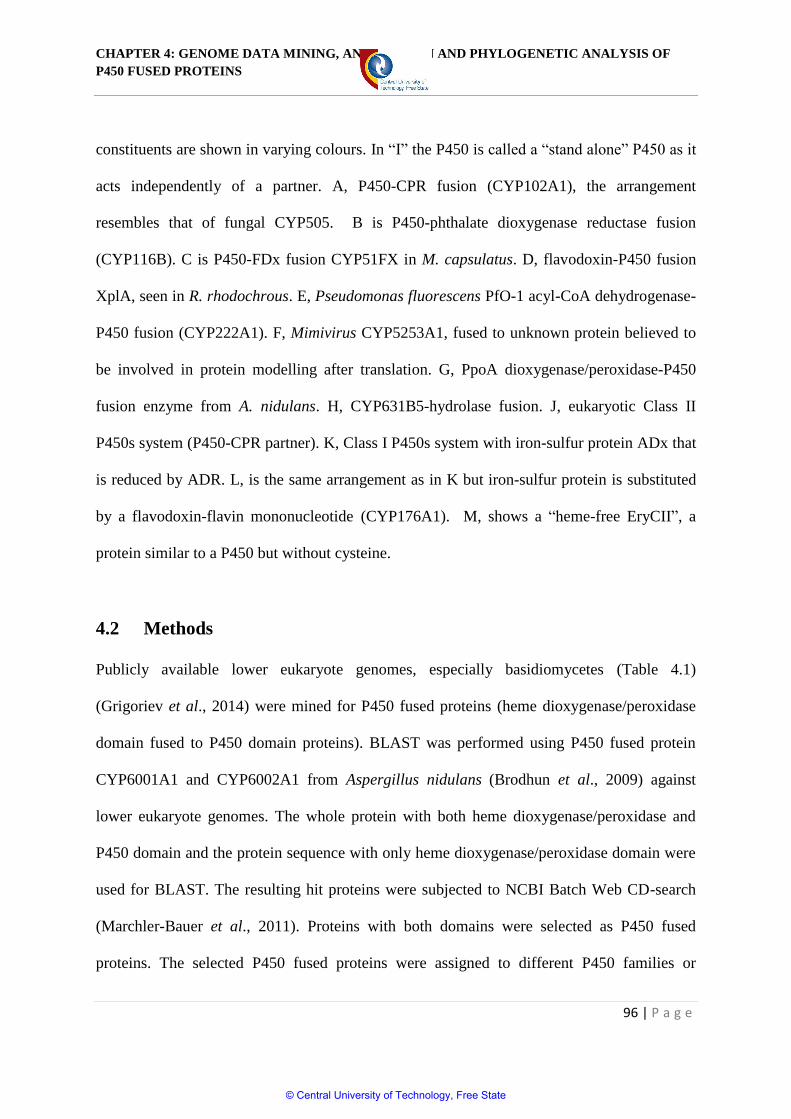
CHAPTER 4: GENOME DATA MINING, ANNOTATION AND PHYLOGENETIC ANALYSIS OF
P450 FUSED PROTEINS
96 | P a g e
constituents are shown in varying colours. In “I” the P450 is called a “stand alone” P450 as it
acts independently of a partner. A, P450-CPR fusion (CYP102A1), the arrangement
resembles that of fungal CYP505. B is P450-phthalate dioxygenase reductase fusion
(CYP116B). C is P450-FDx fusion CYP51FX in M. capsulatus. D, flavodoxin-P450 fusion
XplA, seen in R. rhodochrous. E, Pseudomonas fluorescens PfO-1 acyl-CoA dehydrogenase-
P450 fusion (CYP222A1). F, Mimivirus CYP5253A1, fused to unknown protein believed to
be involved in protein modelling after translation. G, PpoA dioxygenase/peroxidase-P450
fusion enzyme from A. nidulans. H, CYP631B5-hydrolase fusion. J, eukaryotic Class II
P450s system (P450-CPR partner). K, Class I P450s system with iron-sulfur protein ADx that
is reduced by ADR. L, is the same arrangement as in K but iron-sulfur protein is substituted
by a flavodoxin-flavin mononucleotide (CYP176A1). M, shows a “heme-free EryCII”, a
protein similar to a P450 but without cysteine.
4.2 Methods
Publicly available lower eukaryote genomes, especially basidiomycetes (Table 4.1)
(Grigoriev et al., 2014) were mined for P450 fused proteins (heme dioxygenase/peroxidase
domain fused to P450 domain proteins). BLAST was performed using P450 fused protein
CYP6001A1 and CYP6002A1 from Aspergillus nidulans (Brodhun et al., 2009) against
lower eukaryote genomes. The whole protein with both heme dioxygenase/peroxidase and
P450 domain and the protein sequence with only heme dioxygenase/peroxidase domain were
used for BLAST. The resulting hit proteins were subjected to NCBI Batch Web CD-search
(Marchler-Bauer et al., 2011). Proteins with both domains were selected as P450 fused
proteins. The selected P450 fused proteins were assigned to different P450 families or
© Central University of Technology, Free State
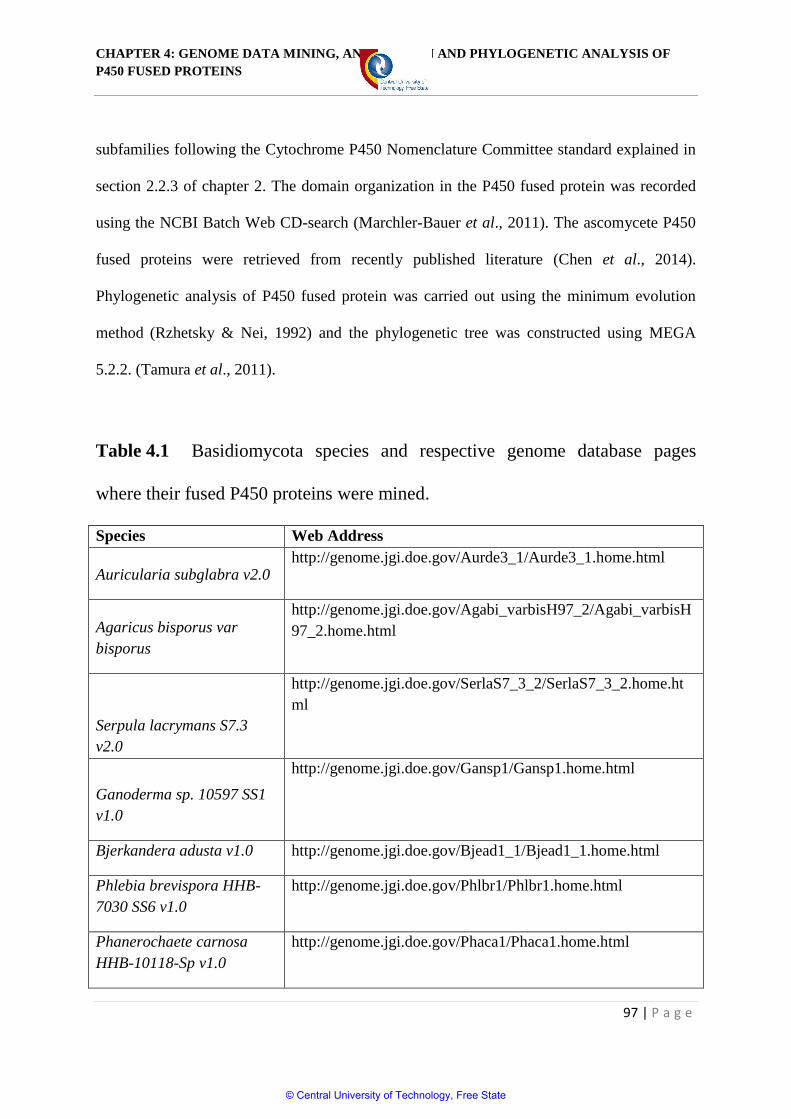
CHAPTER 4: GENOME DATA MINING, ANNOTATION AND PHYLOGENETIC ANALYSIS OF
P450 FUSED PROTEINS
97 | P a g e
subfamilies following the Cytochrome P450 Nomenclature Committee standard explained in
section 2.2.3 of chapter 2. The domain organization in the P450 fused protein was recorded
using the NCBI Batch Web CD-search (Marchler-Bauer et al., 2011). The ascomycete P450
fused proteins were retrieved from recently published literature (Chen et al., 2014).
Phylogenetic analysis of P450 fused protein was carried out using the minimum evolution
method (Rzhetsky & Nei, 1992) and the phylogenetic tree was constructed using MEGA
5.2.2. (Tamura et al., 2011).
Table 4.1 Basidiomycota species and respective genome database pages
where their fused P450 proteins were mined.
Species Web Address
Auricularia subglabra v2.0 http://genome.jgi.doe.gov/Aurde3_1/Aurde3_1.home.html
Agaricus bisporus var
bisporus
http://genome.jgi.doe.gov/Agabi_varbisH97_2/Agabi_varbisH
97_2.home.html
Serpula lacrymans S7.3
v2.0
http://genome.jgi.doe.gov/SerlaS7_3_2/SerlaS7_3_2.home.ht
ml
Ganoderma sp. 10597 SS1
v1.0
http://genome.jgi.doe.gov/Gansp1/Gansp1.home.html
Bjerkandera adusta v1.0 http://genome.jgi.doe.gov/Bjead1_1/Bjead1_1.home.html
Phlebia brevispora HHB-
7030 SS6 v1.0
http://genome.jgi.doe.gov/Phlbr1/Phlbr1.home.html
Phanerochaete carnosa
HHB-10118-Sp v1.0
http://genome.jgi.doe.gov/Phaca1/Phaca1.home.html
© Central University of Technology, Free State
CHAPTER 4: GENOME DATA MINING, ANNOTATION AND PHYLOGENETIC ANALYSIS OF
P450 FUSED PROTEINS
98 | P a g e
Wolfiporia cocos MD-104
SS10 v1.0
http://genome.jgi.doe.gov/Wolco1/Wolco1.home.html
Trametes versicolor v1.0 http://genome.jgi.doe.gov/Trave1/Trave1.home.html
Fomitopsis pinicola FP-
58527 SS1 v3.0
http://genome.jgi.doe.gov/Fompi3/Fompi3.home.html
Fomitiporia mediterranea
v1.0
http://genome.jgi.doe.gov/Fomme1/Fomme1.home.html
Dacryopinax sp. DJM 731
SSP1 v1.0
http://genome.jgi.doe.gov/Dacsp1/Dacsp1.home.html
Dichomitus squalens v1.0 http://genome.jgi.doe.gov/Dicsq1/Dicsq1.home.html
Stereum hirsutum FP-
91666 SS1 v1.0
http://genome.jgi.doe.gov/Stehi1/Stehi1.home.html
Coniophora puteana v1.0 http://genome.jgi.doe.gov/Conpu1/Conpu1.home.html
4.3 Results and discussion
4.3.1 Novel P450 fused proteins in oomycetes
P450s fused to redox partners and different proteins are well documented in the literature
(Guengerich & Munro, 2013; Lamb & Waterman, 2013). Two different types of P450 fused
proteins were reported in lower eukaryotes (fungi). These two different types were: (i) P450
fused to CPR at the C-terminal end, which is well-known as P450foxy (CYP505 family)
(Kitazume et al., 2000) and (ii) P450 fused to heme peroxidase/dioxygenase at the N-terminal
end (CYP6001 family) (Brodhun et al., 2009).
Analysis of P450s in oomycetes revealed the presence of P450 fused proteins. The
new P450 family CYP5619 with six members found in S. declina is fused to heme
peroxidase/dioxygenase protein. However, the combination of fusion is different compared to
© Central University of Technology, Free State
CHAPTER 4: GENOME DATA MINING, ANNOTATION AND PHYLOGENETIC ANALYSIS OF
P450 FUSED PROTEINS
99 | P a g e
the reported combination of P450 fused proteins in lower eukaryotes (Guengerich & Munro,
2013; Lamb & Waterman, 2013). In oomycetes, the heme peroxidase/dioxygenase protein is
fused at the C-terminal end to P450 (Figure 4.2). This combination, i.e. N-terminal P450
domain fused to heme peroxidase/dioxygenase at its C-terminal, is a novel combination and it
is not reported in the literature (Guengerich & Munro, 2013; Lamb & Waterman, 2013).
To confirm the novelty of this P450 fused protein, performed was a comprehensive genome
data mining to identify fused P450s, particularly heme peroxidase/dioxygenase protein fused
to P450 in the publicly available lower eukaryote genomes (Grigoriev et al., 2014). A total
number of 61 P450 fused proteins were identified (Figure 4.2 and Table 4.2). The identified
P450 fused proteins were grouped under five different P450 families namely CYP6001-
CYP6005. Interestingly, the CYP6005 family is found only in Basidiomycota, whereas
Ascomycota showed four different P450 fused families, CYP6001-CYP6004 (Figure 4.2 and
Table 4.2). The identified P450 fused proteins were subjected to heme
peroxidase/dioxygenase and P450 domain analysis. As shown in Figure 4.2, all the P450
fused proteins (CYP6001-CYP6005 family) identified in fungi showed an N-terminal heme
peroxidase/dioxygenase domain and a P450 domain at the C-terminal end. This clearly
confirms that the combination identified in CYP5619 family members is novel. Considering
the nature of P450 fused protein, it can be concluded that CYP5619 family members are
possibly involved in the oxidation of fatty acids, like CYP6001A1 (Brodhun et al., 2009).
However, experimental analysis is needed to unravel the difference between the two different
domains‟ combinations.
© Central University of Technology, Free State
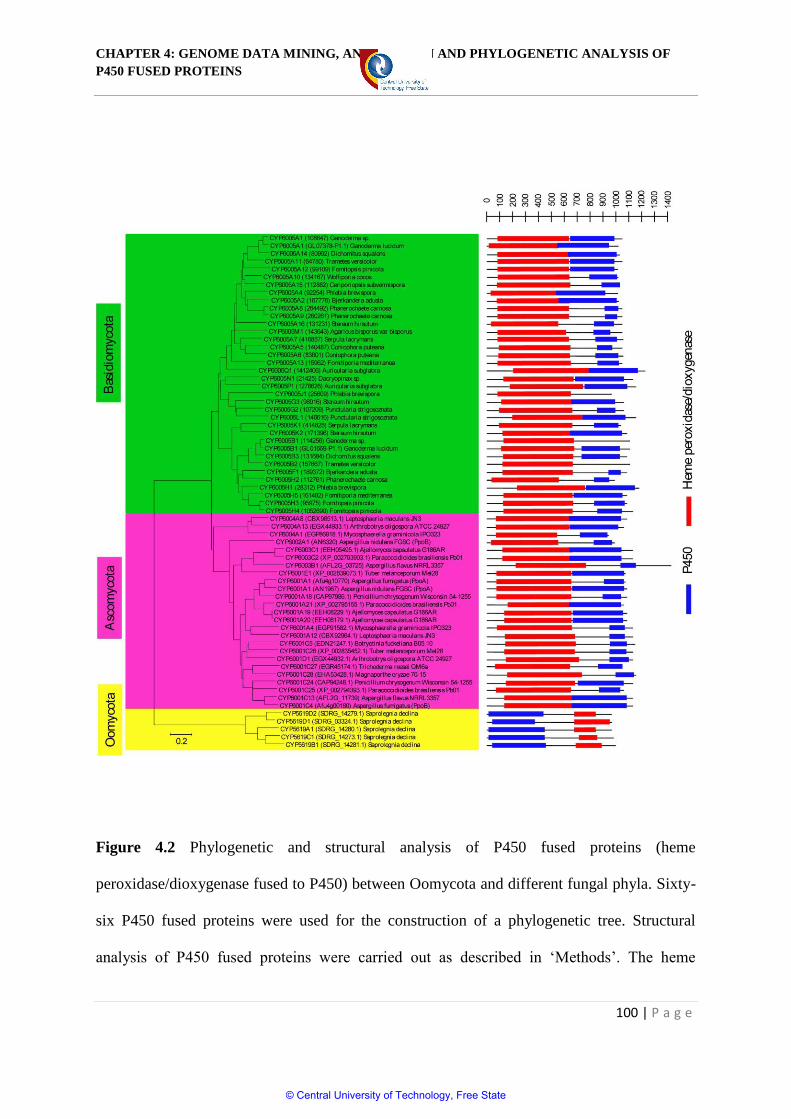
CHAPTER 4: GENOME DATA MINING, ANNOTATION AND PHYLOGENETIC ANALYSIS OF
P450 FUSED PROTEINS
100 | P a g e
Figure 4.2 Phylogenetic and structural analysis of P450 fused proteins (heme
peroxidase/dioxygenase fused to P450) between Oomycota and different fungal phyla. Sixty-
six P450 fused proteins were used for the construction of a phylogenetic tree. Structural
analysis of P450 fused proteins were carried out as described in „Methods‟. The heme
© Central University of Technology, Free State
CHAPTER 4: GENOME DATA MINING, ANNOTATION AND PHYLOGENETIC ANALYSIS OF
P450 FUSED PROTEINS
101 | P a g e
peroxidase/dioxygenase and P450 domain boxes is indicative of the domain length. For three
P450 fused proteins (CYP6005J1, CYP6005B1 and CYP6005B2) NCBI CDD (Marchler-
Bauer et al., 2011) did not identify the P450 domain length, suggesting the presence of non-
variant amino acids at P450 signature motifs in these proteins. A detailed analysis of the P450
fused proteins, species, size of the proteins and size of each of the domains is presented in
table 4.2.
© Central University of Technology, Free State
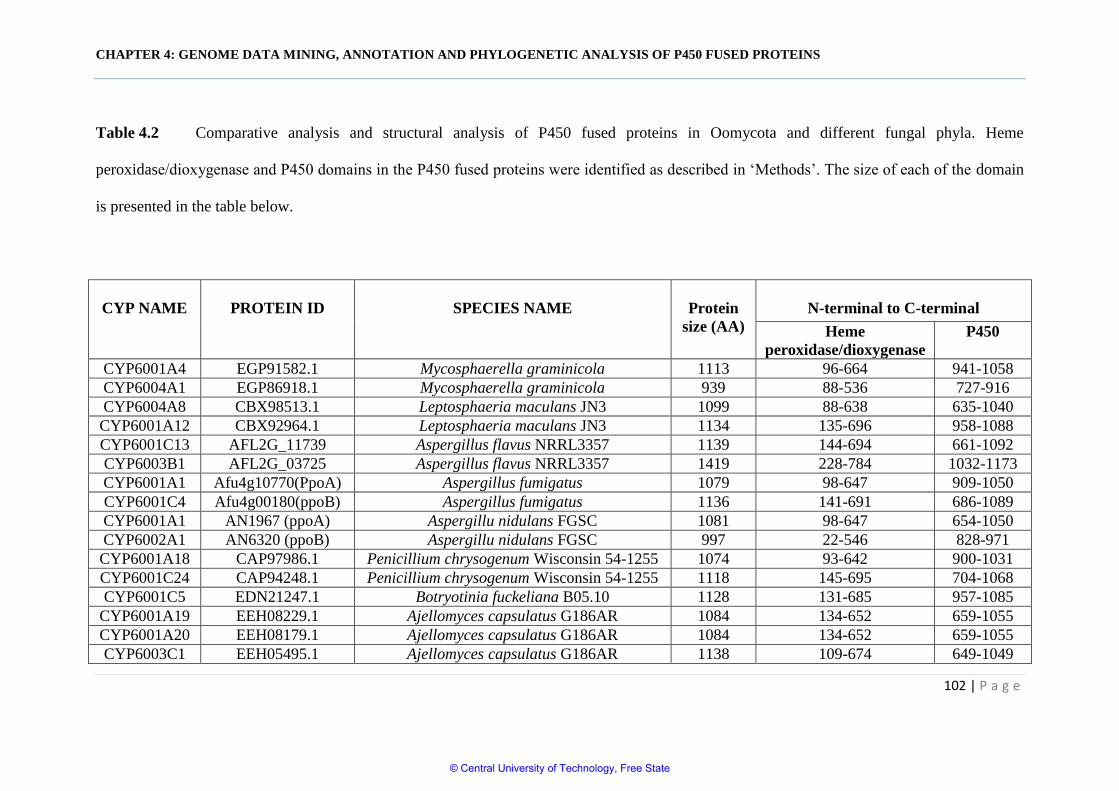
CHAPTER 4: GENOME DATA MINING, ANNOTATION AND PHYLOGENETIC ANALYSIS OF P450 FUSED PROTEINS
102 | P a g e
Table 4.2 Comparative analysis and structural analysis of P450 fused proteins in Oomycota and different fungal phyla. Heme
peroxidase/dioxygenase and P450 domains in the P450 fused proteins were identified as described in „Methods‟. The size of each of the domain
is presented in the table below.
CYP NAME
PROTEIN ID
SPECIES NAME
Protein
size (AA)
N-terminal to C-terminal
Heme
peroxidase/dioxygenase
P450
CYP6001A4 EGP91582.1 Mycosphaerella graminicola 1113 96-664 941-1058
CYP6004A1 EGP86918.1 Mycosphaerella graminicola 939 88-536 727-916
CYP6004A8 CBX98513.1 Leptosphaeria maculans JN3 1099 88-638 635-1040
CYP6001A12 CBX92964.1 Leptosphaeria maculans JN3 1134 135-696 958-1088
CYP6001C13 AFL2G_11739 Aspergillus flavus NRRL3357 1139 144-694 661-1092
CYP6003B1 AFL2G_03725 Aspergillus flavus NRRL3357 1419 228-784 1032-1173
CYP6001A1 Afu4g10770(PpoA) Aspergillus fumigatus 1079 98-647 909-1050
CYP6001C4 Afu4g00180(ppoB) Aspergillus fumigatus 1136 141-691 686-1089
CYP6001A1 AN1967 (ppoA) Aspergillu nidulans FGSC 1081 98-647 654-1050
CYP6002A1 AN6320 (ppoB) Aspergillu nidulans FGSC 997 22-546 828-971
CYP6001A18 CAP97986.1 Penicillium chrysogenum Wisconsin 54-1255 1074 93-642 900-1031
CYP6001C24 CAP94248.1 Penicillium chrysogenum Wisconsin 54-1255 1118 145-695 704-1068
CYP6001C5 EDN21247.1 Botryotinia fuckeliana B05.10 1128 131-685 957-1085
CYP6001A19 EEH08229.1 Ajellomyces capsulatus G186AR 1084 134-652 659-1055
CYP6001A20 EEH08179.1 Ajellomyces capsulatus G186AR 1084 134-652 659-1055
CYP6003C1 EEH05495.1 Ajellomyces capsulatus G186AR 1138 109-674 649-1049
© Central University of Technology, Free State
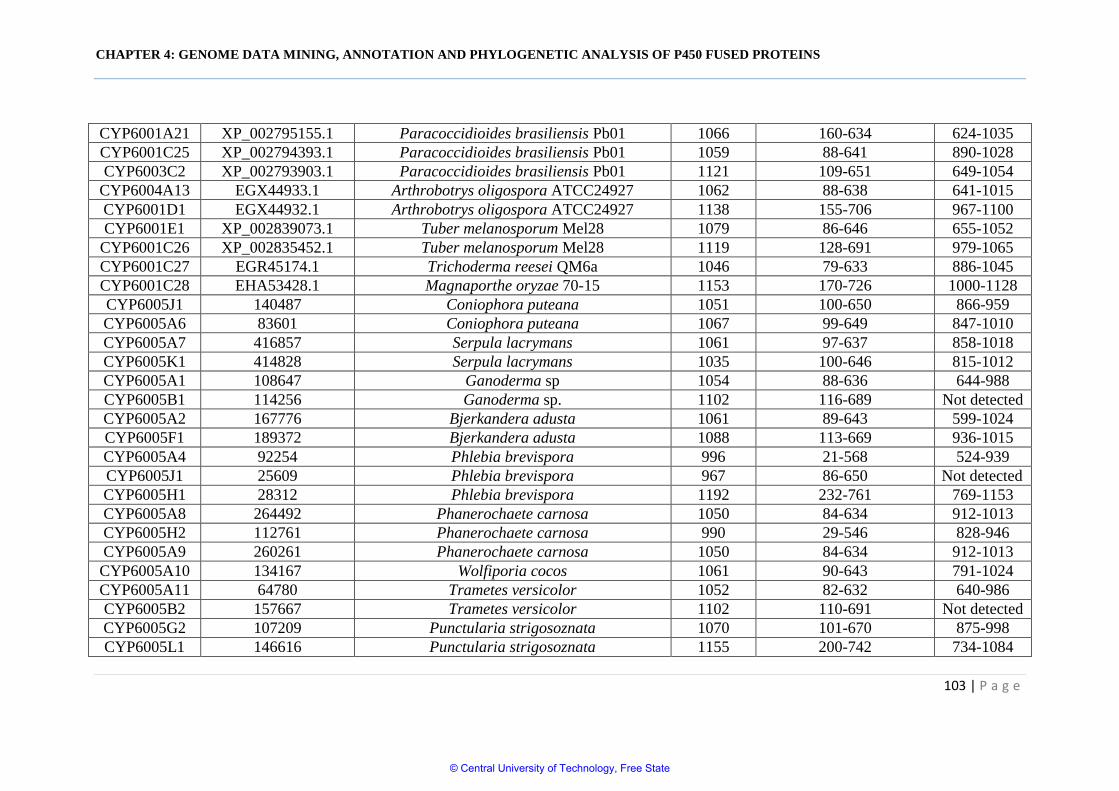
CHAPTER 4: GENOME DATA MINING, ANNOTATION AND PHYLOGENETIC ANALYSIS OF P450 FUSED PROTEINS
103 | P a g e
CYP6001A21 XP_002795155.1 Paracoccidioides brasiliensis Pb01 1066 160-634 624-1035
CYP6001C25 XP_002794393.1 Paracoccidioides brasiliensis Pb01 1059 88-641 890-1028
CYP6003C2 XP_002793903.1 Paracoccidioides brasiliensis Pb01 1121 109-651 649-1054
CYP6004A13 EGX44933.1 Arthrobotrys oligospora ATCC24927 1062 88-638 641-1015
CYP6001D1 EGX44932.1 Arthrobotrys oligospora ATCC24927 1138 155-706 967-1100
CYP6001E1 XP_002839073.1 Tuber melanosporum Mel28 1079 86-646 655-1052
CYP6001C26 XP_002835452.1 Tuber melanosporum Mel28 1119 128-691 979-1065
CYP6001C27 EGR45174.1 Trichoderma reesei QM6a 1046 79-633 886-1045
CYP6001C28 EHA53428.1 Magnaporthe oryzae 70-15 1153 170-726 1000-1128
CYP6005J1 140487 Coniophora puteana 1051 100-650 866-959
CYP6005A6 83601 Coniophora puteana 1067 99-649 847-1010
CYP6005A7 416857 Serpula lacrymans 1061 97-637 858-1018
CYP6005K1 414828 Serpula lacrymans 1035 100-646 815-1012
CYP6005A1 108647 Ganoderma sp 1054 88-636 644-988
CYP6005B1 114256 Ganoderma sp. 1102 116-689 Not detected
CYP6005A2 167776 Bjerkandera adusta 1061 89-643 599-1024
CYP6005F1 189372 Bjerkandera adusta 1088 113-669 936-1015
CYP6005A4 92254 Phlebia brevispora 996 21-568 524-939
CYP6005J1 25609 Phlebia brevispora 967 86-650 Not detected
CYP6005H1 28312 Phlebia brevispora 1192 232-761 769-1153
CYP6005A8 264492 Phanerochaete carnosa 1050 84-634 912-1013
CYP6005H2 112761 Phanerochaete carnosa 990 29-546 828-946
CYP6005A9 260261 Phanerochaete carnosa 1050 84-634 912-1013
CYP6005A10 134167 Wolfiporia cocos 1061 90-643 791-1024
CYP6005A11 64780 Trametes versicolor 1052 82-632 640-986
CYP6005B2 157667 Trametes versicolor 1102 110-691 Not detected
CYP6005G2 107209 Punctularia strigosoznata 1070 101-670 875-998
CYP6005L1 146616 Punctularia strigosoznata 1155 200-742 734-1084
© Central University of Technology, Free State
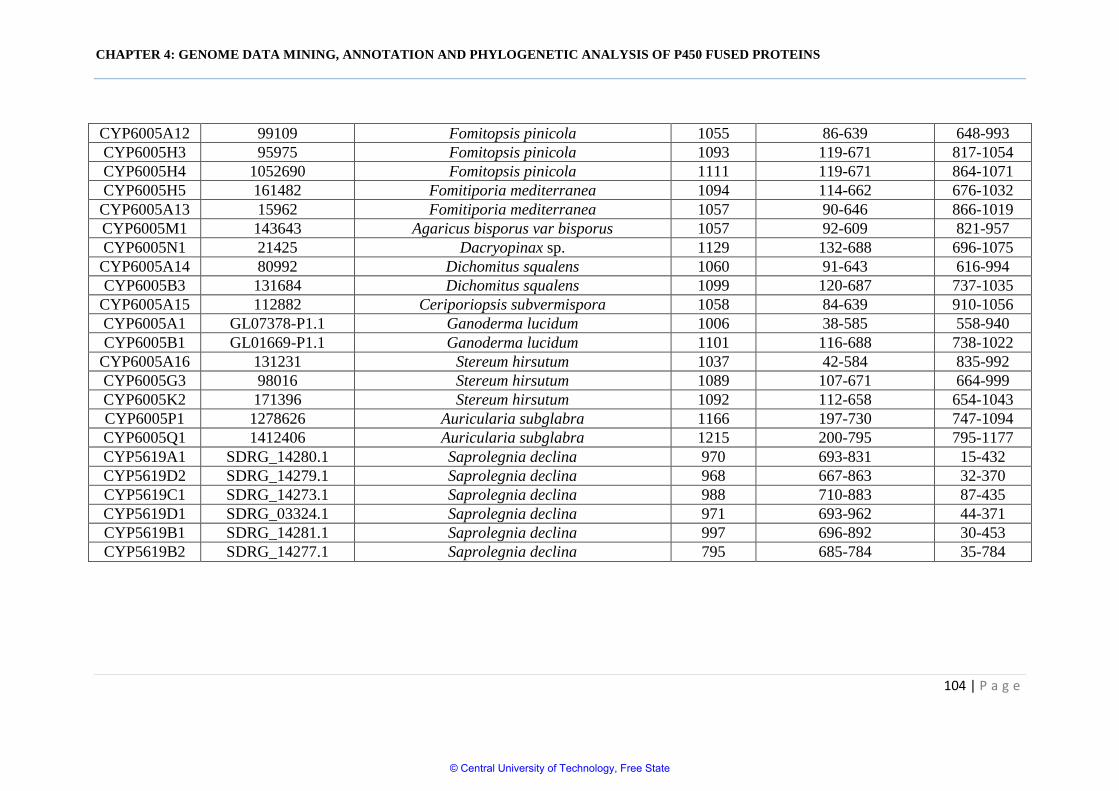
CHAPTER 4: GENOME DATA MINING, ANNOTATION AND PHYLOGENETIC ANALYSIS OF P450 FUSED PROTEINS
104 | P a g e
CYP6005A12 99109 Fomitopsis pinicola 1055 86-639 648-993
CYP6005H3 95975 Fomitopsis pinicola 1093 119-671 817-1054
CYP6005H4 1052690 Fomitopsis pinicola 1111 119-671 864-1071
CYP6005H5 161482 Fomitiporia mediterranea 1094 114-662 676-1032
CYP6005A13 15962 Fomitiporia mediterranea 1057 90-646 866-1019
CYP6005M1 143643 Agaricus bisporus var bisporus 1057 92-609 821-957
CYP6005N1 21425 Dacryopinax sp. 1129 132-688 696-1075
CYP6005A14 80992 Dichomitus squalens 1060 91-643 616-994
CYP6005B3 131684 Dichomitus squalens 1099 120-687 737-1035
CYP6005A15 112882 Ceriporiopsis subvermispora 1058 84-639 910-1056
CYP6005A1 GL07378-P1.1 Ganoderma lucidum 1006 38-585 558-940
CYP6005B1 GL01669-P1.1 Ganoderma lucidum 1101 116-688 738-1022
CYP6005A16 131231 Stereum hirsutum 1037 42-584 835-992
CYP6005G3 98016 Stereum hirsutum 1089 107-671 664-999
CYP6005K2 171396 Stereum hirsutum 1092 112-658 654-1043
CYP6005P1 1278626 Auricularia subglabra 1166 197-730 747-1094
CYP6005Q1 1412406 Auricularia subglabra 1215 200-795 795-1177
CYP5619A1 SDRG_14280.1 Saprolegnia declina 970 693-831 15-432
CYP5619D2 SDRG_14279.1 Saprolegnia declina 968 667-863 32-370
CYP5619C1 SDRG_14273.1 Saprolegnia declina 988 710-883 87-435
CYP5619D1 SDRG_03324.1 Saprolegnia declina 971 693-962 44-371
CYP5619B1 SDRG_14281.1 Saprolegnia declina 997 696-892 30-453
CYP5619B2 SDRG_14277.1 Saprolegnia declina 795 685-784 35-784
© Central University of Technology, Free State
CHAPTER 4: GENOME DATA MINING, ANNOTATION AND PHYLOGENETIC ANALYSIS OF
P450 FUSED PROTEINS
105 | P a g e
4.4 Conclusion
P450 fused proteins may have been a result of protein evolution to improve the metabolic
processes of the organisms as this system has been recognised to have improved speed and
efficiency in undertaking the catalytic functions as compared to non-fused system, or to
augment the vulnerability of organisms to different ecological niches as one of P450s
significance. The P450 fused proteins is of novel discovery to the industry world. Though
function of other P450 fused proteins has not been established, their applications in various
processes in industry have been of value.
Different arrays of P450 fusion systems and diversity are well documented in
literature and identification of P450 fused proteins in oomycetes especially that of a non-
common arrangement is intriguing. It raises a perception that there are yet other P450
proteins and their other remarkable properties yet to be discovered. May be there is still other
enzymes out there that could out match the capacity of P450BM3 (CYP102A1).
© Central University of Technology, Free State
CHAPTER 4: GENOME DATA MINING, ANNOTATION AND PHYLOGENETIC ANALYSIS OF
P450 FUSED PROTEINS
106 | P a g e
4.5 References
Brodhun, F., Gobel, C., Hornung, E., Feussner, I. (2009). Identification of PpoA from
Aspergillus nidulans as a fusion protein of a fatty acid heme dioxygenase/peroxidase and a
cytochrome P450. J. Biol. Chem, 284: 11792–11805.
Chen, W., Lee, M., Jefcoate, C., Kim, S., Chen, F., Yu Y. (2014). Fungal cytochrome P450
monooxygenases: Their distribution, structure, functions, family expansion, and evolutionary
origin. Genome Biol. Evol, 6: 1620-34.
Fisher, C. W., Barnes, H. J., Estabrook, R. W. (2003). FUSION PROTEINS COMPRISING
EUKARYOTIC CYTOCHROME P450 FUSED TO A REDUCTASE. Patent: EP0649472.
Available from: http://www.freepatentsonline.com/EP0649472B1.html. [Accessed:
31/08/2015]
Guengerich, F. P., Munro, A. W. (2013). Unusual cytochrome p450 enzymes and reactions.
J. Biol. Chem, 288: 17065-73.
Grigoriev, I. V. Nikitin, R., Haridas, S., Kuo, A., Ohm, R., Otillar, R., Riley, R., Salamov, A.,
Zhao, X., Korzeniewski, F., Smirnova, T., Nordberg, H., Dubchak, I., Shabalov, I (2014).
MycoCosm portal: Gearing up for 1000 fungal genomes. Nucleic Acids Res, 42: D699-704.
© Central University of Technology, Free State
CHAPTER 4: GENOME DATA MINING, ANNOTATION AND PHYLOGENETIC ANALYSIS OF
P450 FUSED PROTEINS
107 | P a g e
Kitazume, T., Takaya, N., Nakayama, N., Shoun, H. (2000). Fusarium oxysporum fatty-acid
subterminal hydroxylase (CYP505) is a membrane bound eukaryotic counterpart of Bacillus
megaterium cytochrome P450BM3. J. Biol. Chem, 275: 39734–39740.
Lamb, D. C., Waterman, M. R. (2013). Unusual properties of the cytochrome P450
superfamily. Phil. Trans. R. Soc. Lond. B. Biol. Sci, 368: 20120434.
Madoui, M. A., Bertrand-Michel, J., Gaulin, E., Dumas, B. (2009). Sterol metabolism in the
oomycete Aphanomyces euteiches, a legume root pathogen. New Phytol, 183: 291-300.
Marchler-Bauer, A., Lu, S., Anderson, J. B., Chitsaz, F., Derbyshire, M. K., DeWeese-Scott,
C., Fong, J. H., Geer, L. Y., Geer, R. C., Gonzales, N. R., Gwadz, M., Hurwitz, D. I.,
Jackson, J. D., Ke, Z., Lanczycki, C. J., Lu, F., Marchler, G. H., Mullokandov, M.,
Omelchenko, M. V., Robertson, C. L., Song, J. S., Thanki, N., Yamashita, R. A., Zhang, D.,
McLean, K. J., Girvan, H. M., Munro, A. W. (2007). Cytochrome P450/redox partner fusion
enzymes: biotechnological and toxicological prospects. 3(6): 847-863.
Moktali, V., Park, J., Fedorova-Abrams, N. D., Park, B., Choi, J., Lee, Y., Kang, S. (2012).
Systematic and searchable classification of cytochrome P450 proteins encoded by fungal and
oomycete genomes. BMC Genomics, 13: 525.
Rzhetsky, A., Nei, M. (1992). A simple method for estimating and testing minimum
evolution trees. Mol. Biol. Evol, 9: 945–967.
© Central University of Technology, Free State
CHAPTER 4: GENOME DATA MINING, ANNOTATION AND PHYLOGENETIC ANALYSIS OF
P450 FUSED PROTEINS
108 | P a g e
Tamura, K. Peterson, D., Peterson, N., Stecher, G., Nei, M., Kumar, S. (2011). MEGA5:
Molecular evolutionary genetics analysis using maximum likelihood, evolutionary distance,
and maximum parsimony methods. Mol. Biol. Evol, 28: 2731–2739.
The European Bioinformatics Institute. n.d. Cytochrome P450. Available from:
http://www.ebi.ac.uk/interpro/potm/2006_10/Page2.htm. [Accessed: 31/08/2015]
Warrilow, A. G., Hulla, C. M., Rolleya, N. J., Parkera, J. E., Nesb, W. D., Smitha, S. N.,
Kelly D. E., Kelly, S. L. (2014). Clotrimazole as a potent agent for treating the oomycete fish
pathogen Saprolegnia parasitica through inhibition of sterol 14α-demethylase (CYP51).
Appl. Environ. Microbiol, 80: 6154-66.
Zhang, N., Zheng, C., Bryant, S. H. (2011). CDD: A conserved domain database for the
functional annotation of proteins. Nucleic Acids Res, 39: D225–9.
© Central University of Technology, Free State
CHAPTER 5: CONCLUSION
109 | P a g e
CHAPTER 5
CONCLUSION
In conclusion, oomycetes are very important organisms in terms of their hard-wired
parasitism leading to the loss of billions of dollars in agriculture and aquaculture. Analysis of
P450s in these organisms provided insights into the evolutionary pattern of P450s. Genome-
wide analysis of P450s revealed the presence of moderate number of P450s in these
organisms. Despite presence of a large number of new P450 families and subfamilies, P450
family blooming resulted in a low P450 diversity in oomycetes. CYP51 and novel P450
fusion proteins with different combination of heme peroxidase/dioxygenase and P450 domain
were common between oomycetes and lower eukaryote fungi. The speciation and adaption to
diverse ecological niches or lifestyle of oomycetes and fungi resulted in generation of distinct
P450 families in both groups. Furthermore, at order level, oomycetes showed distinct P450
families and subfamilies. This confirms that the host influence is a major factor in shaping the
oomycetes genomic content and thus also reflected in terms of P450s. Presence of unique
combination of amino acid patterns at EXXR and CXG motifs in oomycetes P450 families
strongly supported previously proposed hypothesis that the amino acid patterns at these
motifs are characteristic of a P450 family. This study serves as a reference and will open new
vistas for future genome-wide annotation of P450s in oomycetes. Future genome sequencing
of more oomycetes will provide a broader picture of P450 evolution in these organisms and
also possibly results in discovery of novel P450 families.
© Central University of Technology, Free State
1Scientific RepoRts | 5:11572 | DOi: 10.1038/srep11572
www.nature.com/scientificreports
Diversity and evolution of cytochrome P450 monooxygenases in OomycetesMopeli Marshal Sello1, Norventia Jafta1, David R Nelson2, Wanping Chen3, Jae-Hyuk Yu4, Mohammad Parvez1, Ipeleng Kopano Rosinah Kgosiemang1, Richie Monyaki1, Seiso Caiphus Raselemane1, Lehlohonolo Benedict Qhanya1, Ntsane Trevor Mthakathi1, Samson Sitheni Mashele1 & Khajamohiddin Syed1
Cytochrome P450 monooxygenases (P450s) are heme-thiolate proteins whose role as drug targets against pathogens, as well as in valuable chemical production and bioremediation, has been explored. In this study we performed comprehensive comparative analysis of P450s in 13 newly explored oomycete pathogens. Three hundred and fifty-six P450s were found in oomycetes. These P450s were grouped into 15 P450 families and 84 P450 subfamilies. Among these, nine P450 families and 31 P450 subfamilies were newly found in oomycetes. Research revealed that oomycetes belonging to different orders contain distinct P450 families and subfamilies in their genomes. Evolutionary analysis and sequence homology data revealed P450 family blooms in oomycetes. Tandem arrangement of a large number of P450s belonging to the same family indicated that P450 family blooming is possibly due to its members’ duplications. A unique combination of amino acid patterns was observed at EXXR and CXG motifs for the P450 families CYP5014, CYP5015 and CYP5017. A novel P450 fusion protein (CYP5619 family) with an N-terminal P450 domain fused to a heme peroxidase/dioxygenase domain was discovered in Saprolegnia declina. Oomycete P450 patterns suggested host influence in shaping their P450 content. This manuscript serves as reference for future P450 annotations in newly explored oomycetes.
Ongoing genome sequencing momentum has resulted in genome sequencing of a large number of spe-cies from different biological kingdoms. Lower eukaryotic kingdoms occupy a special place among bio-logical kingdoms because of the presence of a large number of species and their adaptation to diverse ecological niches. Genome sequencing of lower eukaryotes such as fungi revealed high diversity in their genomes compared to other biological kingdoms. For example, not only the presence of a large number of cytochrome P450 monooxygenases (P450s) was detected in many of their genomes, but also high diversity in terms of the number of P450 families1.
P450s are heme-thiolate proteins and ubiquitously present in species across the biological kingdoms2. These proteins are well known to perform enzymatic reactions in a stereo- and regio-specific man-ner3,4. Because of this characteristic these enzymes become critical in organisms’ primary and secondary metabolism, drug development, generation of human valuables and xenobiotic compound degrada-tion2,5. Progress has been made in understanding P450s from lower eukaryotic organisms, such as their
1Unit for Drug Discovery Research, Department of Health Sciences, Faculty of Health and Environmental Sciences, Central University of Technology, Bloemfontein 9300, Free State, South Africa. 2Department of Microbiology, Immunology and Biochemistry, University of Tennessee Health Science Center, Memphis, TN 38163, USA. 3College of Food Science and Technology, Huazhong Agricultural University, Wuhan, Hubei Province, China. 4Department of Bacteriology, University of Wisconsin-Madison, 3155 MSB, 1550 Linden Drive, Madison WI 53706, USA. Correspondence and requests for materials should be addressed to K.S. (email: [email protected]) or S.S.M. (email: [email protected])
Received: 19 March 2015
Accepted: 27 May 2015
Published: 01 July 2015
OPEN
© Central University of Technology, Free State
www.nature.com/scientificreports/
2Scientific RepoRts | 5:11572 | DOi: 10.1038/srep11572
genome-wide annotation and comparative analysis6–11, heterologous expression and characterization12–14, that eventually resulted in identification of catalytically versatile P450s15,16, their engineering17 and fur-ther unraveling of their potential as anti-fungal drug targets5,18,19.
However, lower eukaryotes belonging to the kingdom Stramenopile, especially phylum Oomycota species P450s, have been underexplored. Oomycetes live as saprophytes or parasites20,21. These are organ-isms considered “hard-wired parasites”22. Oomycetes cause diseases in both plants and animals20,21,23. Oomycetes are counted among the most widespread and deadliest disease-causing agents of plants and crops worldwide. Their destructive behaviour lies in their ability to breach the host surface and break it down, promptly resulting in extensive destruction that hinders agricultural growth24. There has been a huge impairment of aquaculture owing to oomycetes and as for plants, serious diseases are caused not only in agriculturally and ornamentally important plants, but also other plants in the environment. A summary of diseases caused by oomycetes is listed in Table S1. To date, oomycetes remain a serious problem in agriculture and aquaculture20,21,23. Oomycete diseases are not commonly easy to control. Moreover, some oomycete species, particularly Phytophthora species, have the ability to build up resist-ance against chemicals by producing new genetically tougher strains. Plants are also very sensitive to oomycete attacks owing to their weak disease resistance.
The impact of oomycete species on the economy triggered various investigations on pathogenesis and control methods for these pathogens. In the quest to find a remedy, genome sequencing of oomycetes was carried out25–31. Genome sequencing analysis of oomycetes revealed the presence of a moderate number of P450s27. However, the genome sequencing studies were limited to mentioning the count of P450s in oomycetes27. A comparative P450 genomics study was limited to P450 analysis in a few species7. The study showed that the CYP51 of oomycetes can be a good drug target against these pathogens32,33. Despite this great importance, analysis of P450 enzymes in oomycetes has been underexplored. The recent public availability of quite a number of oomycete genomes25–31 gives us an opportunity to perform comprehensive comparative analysis of P450s in these species. In this study we performed systematic analysis of P450s across 13 oomycete species. Furthermore, considering that the lower eukaryote fungi P450s are well annotated and the poor availability or unavailability of other lower eukaryotic P450s, in this study we compared Oomycota P450s with different fungal phyla P450s.
MethodsOomycete species for P450 analysis. Thirteen oomycete species belonging to two different classes and three different orders were used in this study. The oomycete species used in this study, their taxo-nomic group and general information such as their host and diseases caused by these organisms were listed in Table S1. As listed in Table S1, 11 species (Phytophthora sojae, P. ramorum, P. infestans, P. para-sitica, P. capsici, Hyaloperonospora arabidopsidis (formerly Hyaloperonospora parasitica), Pythium aphani-dermatum, P. irregular, P. awayamai, P. ultimum and P. vexan) belonging to class Peronosporomycetidae and two species (Saprolegnia parasitica and S. declina) belonging to Class Saprolegniomycetidae are used for comparative analysis of P450s. It is noteworthy that Peronosporomycetidae contain plant pathogens whereas Saprolegniomycetidae contain animal pathogens.
Genome data-mining and identification of P450s. Oomycete species genomes whose details have been published (Table S1) and are publicly available (Table S2) were used in this study. The whole pro-teomes of oomycete species were downloaded from the databases listed in Table S2. Identification of P450 proteins in whole proteome is carried out using the procedure described elsewhere11,16. Briefly, the downloaded protein sequences were grouped into different protein families using the National Centre for Biotechnology and Information (NCBI) Conserved Domain Database: NCBI Batch Web CD-search tool34. The proteins grouped under the cytochrome P450 monooxygenases superfamily were selected for further study.
Assigning a family and subfamily to orphan P450s. The above selected P450s were subjected to BLAST analysis against all named protist sequences on the Cytochrome P450 Webpage35. Based on percentage identity, i.e., family members share more than 40% amino acid identity and members of sub-families share more than 55% amino acid homology, families and subfamilies were assigned to oomycete P450s. P450s that showed less than 40% identity were assigned to a new family. In addition, evolutionary analysis of P450s was performed in order to authenticate the annotation. P450s that showed less than 40% identity were assessed for their position on the phylogenetic tree and based on their location/align-ment with other P450s they were assigned to different P450 families. The annotated and publicly available P. sojae and P. ramorum P450s were retrieved from the database35 and used in this study.
Phylogenetic analysis of oomycete P450s. The phylogenetic tree was constructed for evolutionary analysis of oomycete P450s. Firstly, the protein sequences were aligned by adjusting them to the hidden Markov model of P450s in the Pfam protein families database (http://pfam.xfam.org/family/PF00067) with HMMER package 3.1 (http://hmmer.janelia.org/)36,37. Then, the phylogenetic tree from the align-ment of protein sequences was inferred by FastTree version 2.1.4 using the maximum-likelihood method (http://www.microbesonline.org/fasttree/)38. The generated tree data were submitted to iTOL (http://itol.embl.de/upload.cgi) for viewing phylogenetic trees and making figures39.
© Central University of Technology, Free State
www.nature.com/scientificreports/
3Scientific RepoRts | 5:11572 | DOi: 10.1038/srep11572
Analysis of homology. Percentage identity between P450s was determined using ClustalW2 multiple sequence analysis40. The ClustalW2 result file designated as percentage identity matrix was downloaded and checked for the percentage identity between P450s.
P450 diversity percentage. The percentage contribution of the number of P450 families in the total number of P450s in an organism is considered as P450 diversity percentage. P450 count and P450 fam-ilies in fungal species were retrieved from published literature9–11,35.
Analysis of tandem arrangement of P450s. P450s localized in proximity on the genome were identified by scanning manually in the respective genome databases for each oomycete (Table S2). P450s localized on the same scaffold/contig/supercontig were noted. P450s that were tandemly localized and belonged to the same family were expressed as percentage in the total number of P450s in an organ-ism. Tandem arrangement of P450s was not carried out for P. irregulare and P. iwayamai because of the shorter length of scaffold/contig/supercontig.
Analysis of EXXR and CXG motifs. Identification of P450 family-specific amino acid patterns at EXXR and CXG motifs was carried out using the procedure described elsewhere41. Briefly, P450 members were subjected to ClustalW multiple alignment using Molecular Evolutionary Genetics Analysis (MEGA 5.2.2)42. After ClustalW alignment of P450s, amino acids in the EXXR and CXG motifs were selected and used for generation of WebLogos and calculation of percentage contribution by an amino acid at each position in the motifs. Only four amino acids were selected for EXXR motif analysis, whereas for CXG motifs upstream seven amino acids were included in the analysis, exactly as previously described41.
Generation of sequence logos. Sequence logos for EXXR and CXG motifs were generated using the published method41. Briefly, WebLogo, a sequence logo generator programme (http://weblogo.threeplu-sone.com/create.cgi)43,44, was used to create sequence logos at EXXR and CXG motifs. After ClustalW alignment of member P450s, the EXXR and CXG (FXXGXRXCXG) motifs’ amino acids were selected and pasted in the WebLogo program. As a selection parameter, image format was selected as PDF and 32 symbols per line were selected. The generated EXXR and CXG sequence logos were used for the analysis.
Genome data mining, annotation and phylogenetic analysis of P450 fused proteins. Publicly available lower eukaryote genomes, especially basidiomycetes (http://genome.jgi-psf.org/programs/fungi/index.jsf)45, were mined for P450 fused proteins (heme dioxygenase/peroxidase domain fused to P450 domain proteins). BLAST was performed using P450 fused protein CYP6001A1 and CYP6002A1 from Aspergillus nidulans46 against lower eukaryote genomes. The whole protein with both heme dioxygenase/peroxidase and P450 domain and the protein sequence with only heme dioxygenase/peroxidase domain were used for BLAST. The resulting hit proteins were subjected to NCBI Batch Web CD-search34. Proteins with both domains were selected as P450 fused proteins. The selected P450 fused proteins were assigned to different P450 families or subfamilies following the above described criteria. The domain organization in the P450 fused protein is recorded using the NCBI Batch Web CD-search34. The ascomycete P450 fused proteins were retrieved from recently published literature8. Phylogenetic analysis of P450 fused protein was carried out using the minimum evolution method47. The phylogenetic tree was constructed using MEGA 5.2.242.
Results and DiscussionOomycetes P450omes. Genome-wide identification and annotation of P450s in 13 oomycetes belonging to two different classes and three different orders (Table S1) revealed the presence of a mod-erate number of P450s in their genomes (Table 1). Three hundred and fifty-six P450s were found in 13 oomycetes genomes (Table S3). The P450 count in oomycete genomes ranged from 7-41. Among the oomycetes selected for the study, H. arabidopsidis showed the lowest number of P450s (7) and P. iway-amai showed the highest number of P450s (41) in their genome. Except H. arabidopsidis, all oomycete genomes had 19 or more P450s (Table 1). On average, Peronosporales showed a lower number of P450s (27), excluding H. arabidopsis, compared to Pythiales that showed 31 P450s. Comparison of oomycete P450omes with other lower eukaryotes such as fungi revealed that the number of P450s observed in oomycetes is most similar to fungal species belonging to the subphylum saccharomycotina and least similar among species belonging to the rest of the fungal kingdom, with a few exceptions, as shown in Table S4.
P450 families and subfamilies in oomycetes. Annotation of P450 families and subfamilies in 13 oomycete genomes revealed the presence of 15 P450 families (Fig. 1) and 84 P450 subfamilies (Table S5). Nine new P450 families and 31 new P450 subfamilies were found in oomycetes. The nine new P450 families are CYP5613, CYP5614, CYP5615, CYP5616, CYP5617, CYP5618, CYP5619, CYP5620 and CYP5621. New subfamilies were confined to four P450 families: CYP5014 showed 15 new subfamilies, followed by the CYP5015 and CYP5017 families each with seven new subfamilies, and CYP558 with two new subfamilies. A detailed analysis of P450 families and subfamilies and their member P450s was listed in Table S5.
© Central University of Technology, Free State
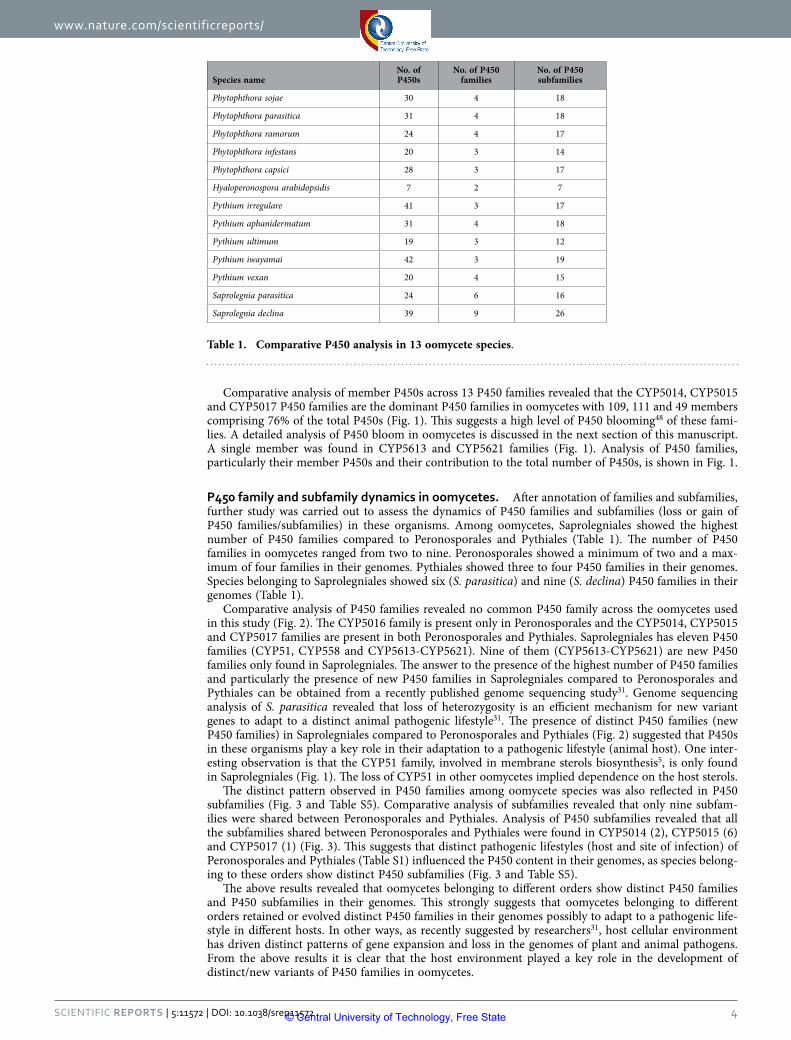
www.nature.com/scientificreports/
4Scientific RepoRts | 5:11572 | DOi: 10.1038/srep11572
Comparative analysis of member P450s across 13 P450 families revealed that the CYP5014, CYP5015 and CYP5017 P450 families are the dominant P450 families in oomycetes with 109, 111 and 49 members comprising 76% of the total P450s (Fig. 1). This suggests a high level of P450 blooming48 of these fami-lies. A detailed analysis of P450 bloom in oomycetes is discussed in the next section of this manuscript. A single member was found in CYP5613 and CYP5621 families (Fig. 1). Analysis of P450 families, particularly their member P450s and their contribution to the total number of P450s, is shown in Fig. 1.
P450 family and subfamily dynamics in oomycetes. After annotation of families and subfamilies, further study was carried out to assess the dynamics of P450 families and subfamilies (loss or gain of P450 families/subfamilies) in these organisms. Among oomycetes, Saprolegniales showed the highest number of P450 families compared to Peronosporales and Pythiales (Table 1). The number of P450 families in oomycetes ranged from two to nine. Peronosporales showed a minimum of two and a max-imum of four families in their genomes. Pythiales showed three to four P450 families in their genomes. Species belonging to Saprolegniales showed six (S. parasitica) and nine (S. declina) P450 families in their genomes (Table 1).
Comparative analysis of P450 families revealed no common P450 family across the oomycetes used in this study (Fig. 2). The CYP5016 family is present only in Peronosporales and the CYP5014, CYP5015 and CYP5017 families are present in both Peronosporales and Pythiales. Saprolegniales has eleven P450 families (CYP51, CYP558 and CYP5613-CYP5621). Nine of them (CYP5613-CYP5621) are new P450 families only found in Saprolegniales. The answer to the presence of the highest number of P450 families and particularly the presence of new P450 families in Saprolegniales compared to Peronosporales and Pythiales can be obtained from a recently published genome sequencing study31. Genome sequencing analysis of S. parasitica revealed that loss of heterozygosity is an efficient mechanism for new variant genes to adapt to a distinct animal pathogenic lifestyle31. The presence of distinct P450 families (new P450 families) in Saprolegniales compared to Peronosporales and Pythiales (Fig. 2) suggested that P450s in these organisms play a key role in their adaptation to a pathogenic lifestyle (animal host). One inter-esting observation is that the CYP51 family, involved in membrane sterols biosynthesis5, is only found in Saprolegniales (Fig. 1). The loss of CYP51 in other oomycetes implied dependence on the host sterols.
The distinct pattern observed in P450 families among oomycete species was also reflected in P450 subfamilies (Fig. 3 and Table S5). Comparative analysis of subfamilies revealed that only nine subfam-ilies were shared between Peronosporales and Pythiales. Analysis of P450 subfamilies revealed that all the subfamilies shared between Peronosporales and Pythiales were found in CYP5014 (2), CYP5015 (6) and CYP5017 (1) (Fig. 3). This suggests that distinct pathogenic lifestyles (host and site of infection) of Peronosporales and Pythiales (Table S1) influenced the P450 content in their genomes, as species belong-ing to these orders show distinct P450 subfamilies (Fig. 3 and Table S5).
The above results revealed that oomycetes belonging to different orders show distinct P450 families and P450 subfamilies in their genomes. This strongly suggests that oomycetes belonging to different orders retained or evolved distinct P450 families in their genomes possibly to adapt to a pathogenic life-style in different hosts. In other ways, as recently suggested by researchers31, host cellular environment has driven distinct patterns of gene expansion and loss in the genomes of plant and animal pathogens. From the above results it is clear that the host environment played a key role in the development of distinct/new variants of P450 families in oomycetes.
Species nameNo. of P450s
No. of P450 families
No. of P450 subfamilies
Phytophthora sojae 30 4 18
Phytophthora parasitica 31 4 18
Phytophthora ramorum 24 4 17
Phytophthora infestans 20 3 14
Phytophthora capsici 28 3 17
Hyaloperonospora arabidopsidis 7 2 7
Pythium irregulare 41 3 17
Pythium aphanidermatum 31 4 18
Pythium ultimum 19 3 12
Pythium iwayamai 42 3 19
Pythium vexan 20 4 15
Saprolegnia parasitica 24 6 16
Saprolegnia declina 39 9 26
Table 1. Comparative P450 analysis in 13 oomycete species.
© Central University of Technology, Free State
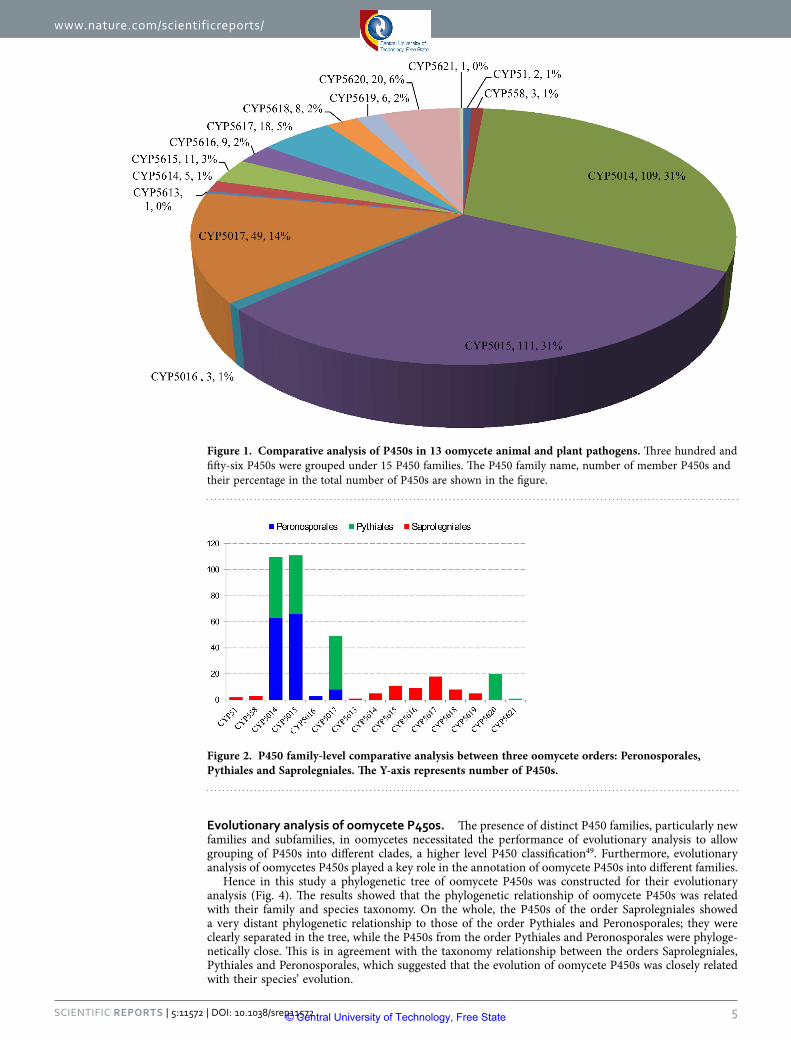
www.nature.com/scientificreports/
5Scientific RepoRts | 5:11572 | DOi: 10.1038/srep11572
Evolutionary analysis of oomycete P450s. The presence of distinct P450 families, particularly new families and subfamilies, in oomycetes necessitated the performance of evolutionary analysis to allow grouping of P450s into different clades, a higher level P450 classification49. Furthermore, evolutionary analysis of oomycetes P450s played a key role in the annotation of oomycete P450s into different families.
Hence in this study a phylogenetic tree of oomycete P450s was constructed for their evolutionary analysis (Fig. 4). The results showed that the phylogenetic relationship of oomycete P450s was related with their family and species taxonomy. On the whole, the P450s of the order Saprolegniales showed a very distant phylogenetic relationship to those of the order Pythiales and Peronosporales; they were clearly separated in the tree, while the P450s from the order Pythiales and Peronosporales were phyloge-netically close. This is in agreement with the taxonomy relationship between the orders Saprolegniales, Pythiales and Peronosporales, which suggested that the evolution of oomycete P450s was closely related with their species’ evolution.
Figure 1. Comparative analysis of P450s in 13 oomycete animal and plant pathogens. Three hundred and fifty-six P450s were grouped under 15 P450 families. The P450 family name, number of member P450s and their percentage in the total number of P450s are shown in the figure.
Figure 2. P450 family-level comparative analysis between three oomycete orders: Peronosporales, Pythiales and Saprolegniales. The Y-axis represents number of P450s.
© Central University of Technology, Free State
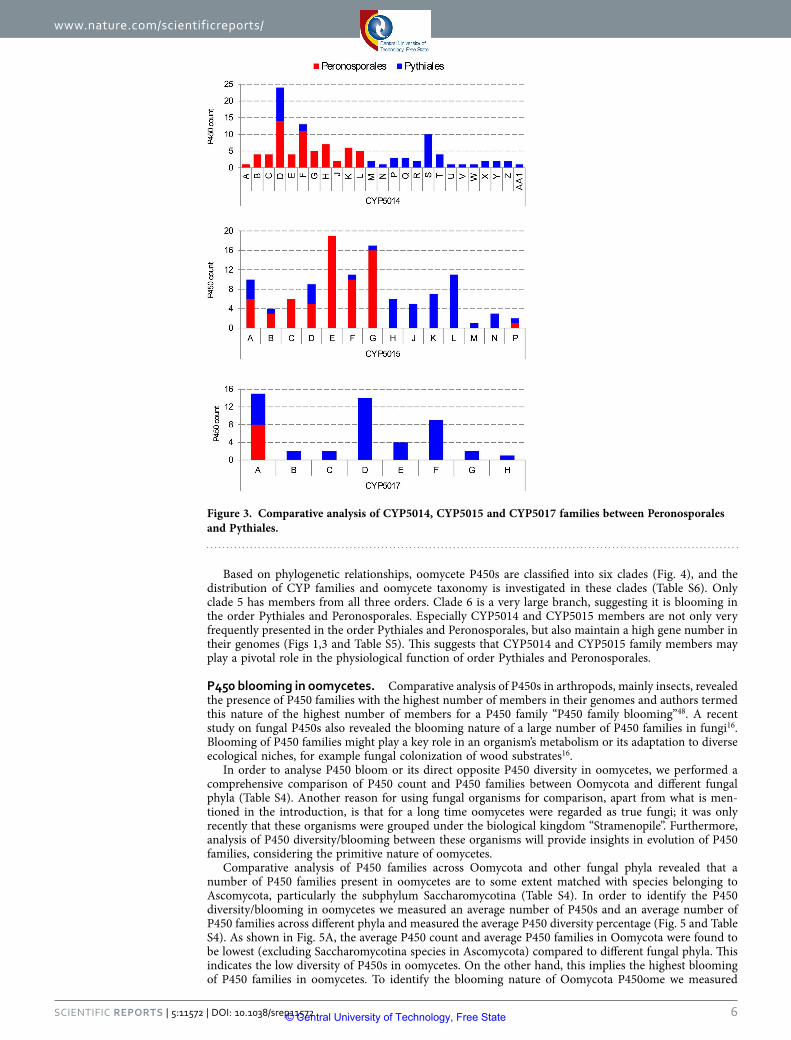
www.nature.com/scientificreports/
6Scientific RepoRts | 5:11572 | DOi: 10.1038/srep11572
Based on phylogenetic relationships, oomycete P450s are classified into six clades (Fig. 4), and the distribution of CYP families and oomycete taxonomy is investigated in these clades (Table S6). Only clade 5 has members from all three orders. Clade 6 is a very large branch, suggesting it is blooming in the order Pythiales and Peronosporales. Especially CYP5014 and CYP5015 members are not only very frequently presented in the order Pythiales and Peronosporales, but also maintain a high gene number in their genomes (Figs 1,3 and Table S5). This suggests that CYP5014 and CYP5015 family members may play a pivotal role in the physiological function of order Pythiales and Peronosporales.
P450 blooming in oomycetes. Comparative analysis of P450s in arthropods, mainly insects, revealed the presence of P450 families with the highest number of members in their genomes and authors termed this nature of the highest number of members for a P450 family “P450 family blooming”48. A recent study on fungal P450s also revealed the blooming nature of a large number of P450 families in fungi16. Blooming of P450 families might play a key role in an organism’s metabolism or its adaptation to diverse ecological niches, for example fungal colonization of wood substrates16.
In order to analyse P450 bloom or its direct opposite P450 diversity in oomycetes, we performed a comprehensive comparison of P450 count and P450 families between Oomycota and different fungal phyla (Table S4). Another reason for using fungal organisms for comparison, apart from what is men-tioned in the introduction, is that for a long time oomycetes were regarded as true fungi; it was only recently that these organisms were grouped under the biological kingdom “Stramenopile”. Furthermore, analysis of P450 diversity/blooming between these organisms will provide insights in evolution of P450 families, considering the primitive nature of oomycetes.
Comparative analysis of P450 families across Oomycota and other fungal phyla revealed that a number of P450 families present in oomycetes are to some extent matched with species belonging to Ascomycota, particularly the subphylum Saccharomycotina (Table S4). In order to identify the P450 diversity/blooming in oomycetes we measured an average number of P450s and an average number of P450 families across different phyla and measured the average P450 diversity percentage (Fig. 5 and Table S4). As shown in Fig. 5A, the average P450 count and average P450 families in Oomycota were found to be lowest (excluding Saccharomycotina species in Ascomycota) compared to different fungal phyla. This indicates the low diversity of P450s in oomycetes. On the other hand, this implies the highest blooming of P450 families in oomycetes. To identify the blooming nature of Oomycota P450ome we measured
Figure 3. Comparative analysis of CYP5014, CYP5015 and CYP5017 families between Peronosporales and Pythiales.
© Central University of Technology, Free State
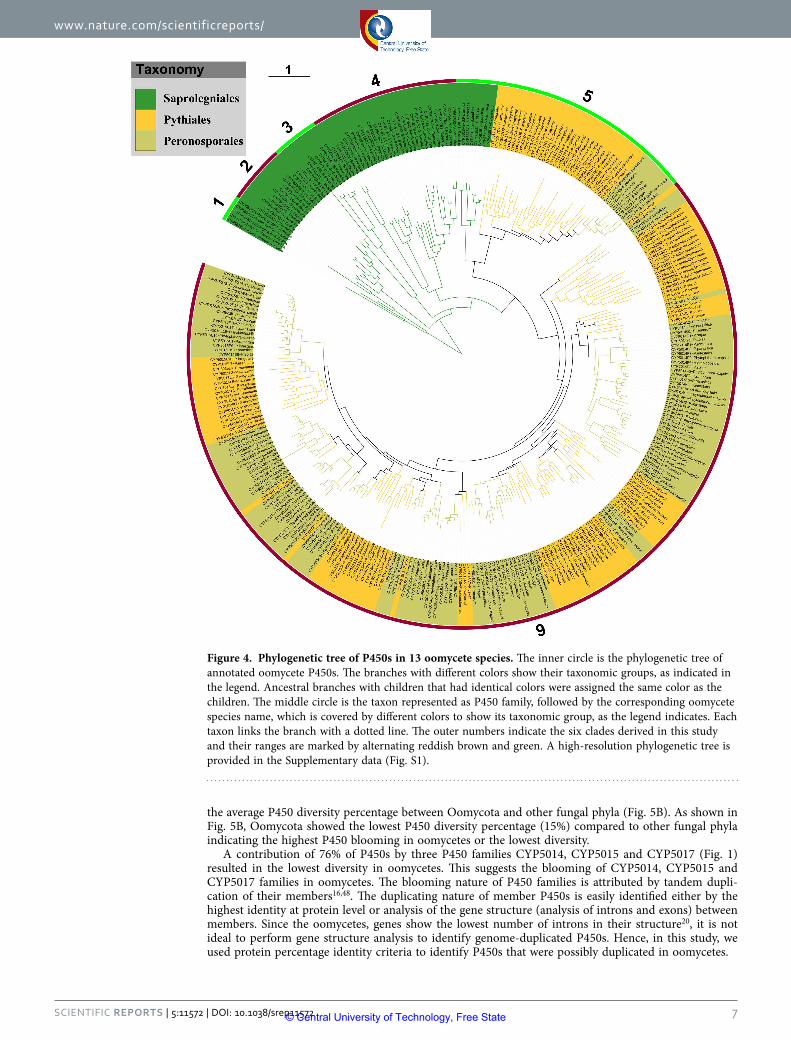
www.nature.com/scientificreports/
7Scientific RepoRts | 5:11572 | DOi: 10.1038/srep11572
the average P450 diversity percentage between Oomycota and other fungal phyla (Fig. 5B). As shown in Fig. 5B, Oomycota showed the lowest P450 diversity percentage (15%) compared to other fungal phyla indicating the highest P450 blooming in oomycetes or the lowest diversity.
A contribution of 76% of P450s by three P450 families CYP5014, CYP5015 and CYP5017 (Fig. 1) resulted in the lowest diversity in oomycetes. This suggests the blooming of CYP5014, CYP5015 and CYP5017 families in oomycetes. The blooming nature of P450 families is attributed by tandem dupli-cation of their members16,48. The duplicating nature of member P450s is easily identified either by the highest identity at protein level or analysis of the gene structure (analysis of introns and exons) between members. Since the oomycetes, genes show the lowest number of introns in their structure20, it is not ideal to perform gene structure analysis to identify genome-duplicated P450s. Hence, in this study, we used protein percentage identity criteria to identify P450s that were possibly duplicated in oomycetes.
Figure 4. Phylogenetic tree of P450s in 13 oomycete species. The inner circle is the phylogenetic tree of annotated oomycete P450s. The branches with different colors show their taxonomic groups, as indicated in the legend. Ancestral branches with children that had identical colors were assigned the same color as the children. The middle circle is the taxon represented as P450 family, followed by the corresponding oomycete species name, which is covered by different colors to show its taxonomic group, as the legend indicates. Each taxon links the branch with a dotted line. The outer numbers indicate the six clades derived in this study and their ranges are marked by alternating reddish brown and green. A high-resolution phylogenetic tree is provided in the Supplementary data (Fig. S1).
© Central University of Technology, Free State
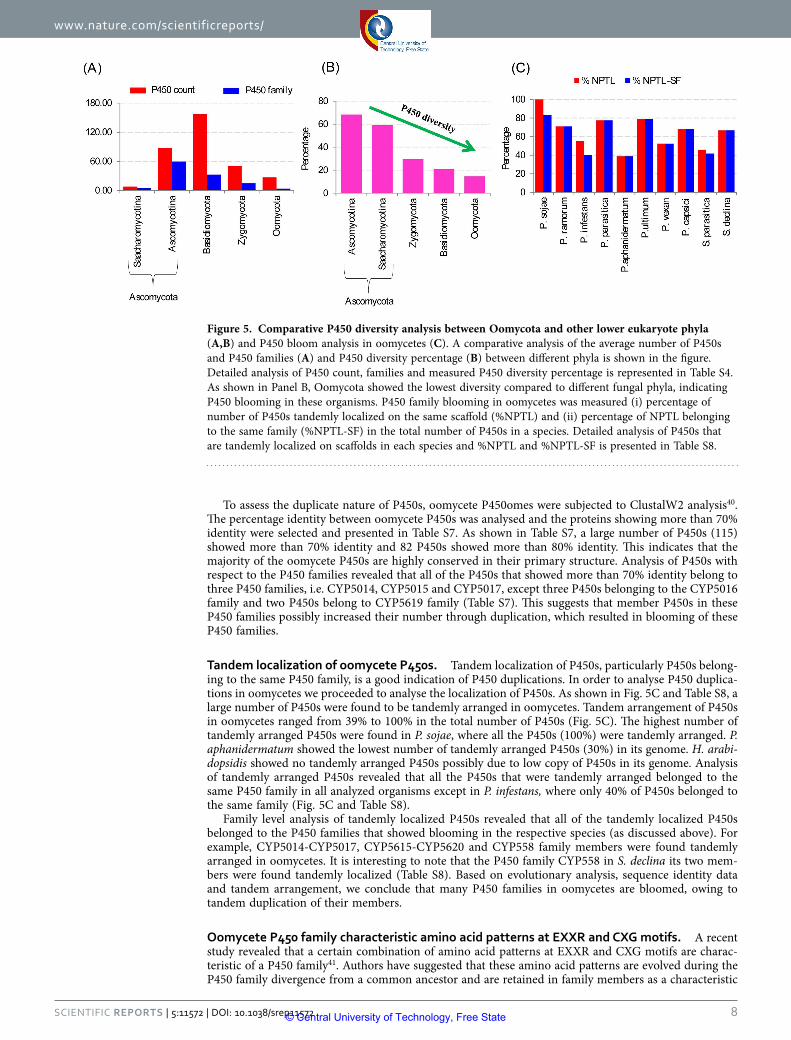
www.nature.com/scientificreports/
8Scientific RepoRts | 5:11572 | DOi: 10.1038/srep11572
To assess the duplicate nature of P450s, oomycete P450omes were subjected to ClustalW2 analysis40. The percentage identity between oomycete P450s was analysed and the proteins showing more than 70% identity were selected and presented in Table S7. As shown in Table S7, a large number of P450s (115) showed more than 70% identity and 82 P450s showed more than 80% identity. This indicates that the majority of the oomycete P450s are highly conserved in their primary structure. Analysis of P450s with respect to the P450 families revealed that all of the P450s that showed more than 70% identity belong to three P450 families, i.e. CYP5014, CYP5015 and CYP5017, except three P450s belonging to the CYP5016 family and two P450s belong to CYP5619 family (Table S7). This suggests that member P450s in these P450 families possibly increased their number through duplication, which resulted in blooming of these P450 families.
Tandem localization of oomycete P450s. Tandem localization of P450s, particularly P450s belong-ing to the same P450 family, is a good indication of P450 duplications. In order to analyse P450 duplica-tions in oomycetes we proceeded to analyse the localization of P450s. As shown in Fig. 5C and Table S8, a large number of P450s were found to be tandemly arranged in oomycetes. Tandem arrangement of P450s in oomycetes ranged from 39% to 100% in the total number of P450s (Fig. 5C). The highest number of tandemly arranged P450s were found in P. sojae, where all the P450s (100%) were tandemly arranged. P. aphanidermatum showed the lowest number of tandemly arranged P450s (30%) in its genome. H. arabi-dopsidis showed no tandemly arranged P450s possibly due to low copy of P450s in its genome. Analysis of tandemly arranged P450s revealed that all the P450s that were tandemly arranged belonged to the same P450 family in all analyzed organisms except in P. infestans, where only 40% of P450s belonged to the same family (Fig. 5C and Table S8).
Family level analysis of tandemly localized P450s revealed that all of the tandemly localized P450s belonged to the P450 families that showed blooming in the respective species (as discussed above). For example, CYP5014-CYP5017, CYP5615-CYP5620 and CYP558 family members were found tandemly arranged in oomycetes. It is interesting to note that the P450 family CYP558 in S. declina its two mem-bers were found tandemly localized (Table S8). Based on evolutionary analysis, sequence identity data and tandem arrangement, we conclude that many P450 families in oomycetes are bloomed, owing to tandem duplication of their members.
Oomycete P450 family characteristic amino acid patterns at EXXR and CXG motifs. A recent study revealed that a certain combination of amino acid patterns at EXXR and CXG motifs are charac-teristic of a P450 family41. Authors have suggested that these amino acid patterns are evolved during the P450 family divergence from a common ancestor and are retained in family members as a characteristic
Figure 5. Comparative P450 diversity analysis between Oomycota and other lower eukaryote phyla (A,B) and P450 bloom analysis in oomycetes (C). A comparative analysis of the average number of P450s and P450 families (A) and P450 diversity percentage (B) between different phyla is shown in the figure. Detailed analysis of P450 count, families and measured P450 diversity percentage is represented in Table S4. As shown in Panel B, Oomycota showed the lowest diversity compared to different fungal phyla, indicating P450 blooming in these organisms. P450 family blooming in oomycetes was measured (i) percentage of number of P450s tandemly localized on the same scaffold (%NPTL) and (ii) percentage of NPTL belonging to the same family (%NPTL-SF) in the total number of P450s in a species. Detailed analysis of P450s that are tandemly localized on scaffolds in each species and %NPTL and %NPTL-SF is presented in Table S8.
© Central University of Technology, Free State
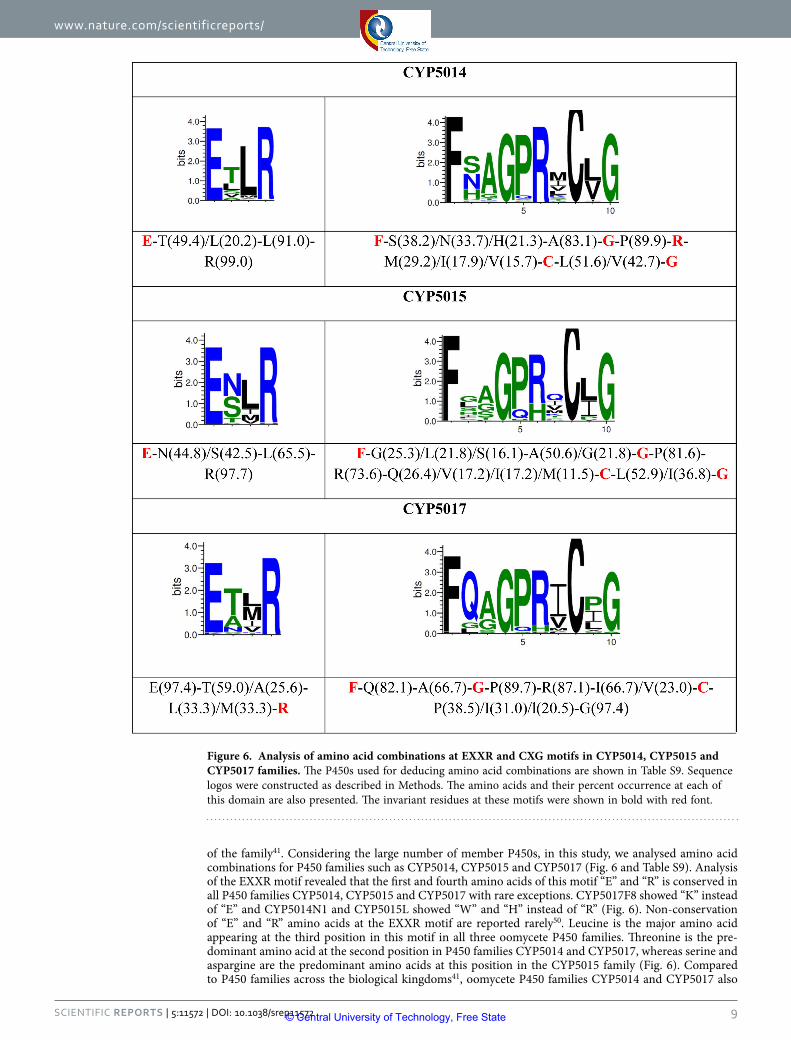
www.nature.com/scientificreports/
9Scientific RepoRts | 5:11572 | DOi: 10.1038/srep11572
of the family41. Considering the large number of member P450s, in this study, we analysed amino acid combinations for P450 families such as CYP5014, CYP5015 and CYP5017 (Fig. 6 and Table S9). Analysis of the EXXR motif revealed that the first and fourth amino acids of this motif “E” and “R” is conserved in all P450 families CYP5014, CYP5015 and CYP5017 with rare exceptions. CYP5017F8 showed “K” instead of “E” and CYP5014N1 and CYP5015L showed “W” and “H” instead of “R” (Fig. 6). Non-conservation of “E” and “R” amino acids at the EXXR motif are reported rarely50. Leucine is the major amino acid appearing at the third position in this motif in all three oomycete P450 families. Threonine is the pre-dominant amino acid at the second position in P450 families CYP5014 and CYP5017, whereas serine and aspargine are the predominant amino acids at this position in the CYP5015 family (Fig. 6). Compared to P450 families across the biological kingdoms41, oomycete P450 families CYP5014 and CYP5017 also
Figure 6. Analysis of amino acid combinations at EXXR and CXG motifs in CYP5014, CYP5015 and CYP5017 families. The P450s used for deducing amino acid combinations are shown in Table S9. Sequence logos were constructed as described in Methods. The amino acids and their percent occurrence at each of this domain are also presented. The invariant residues at these motifs were shown in bold with red font.
© Central University of Technology, Free State
www.nature.com/scientificreports/
1 0Scientific RepoRts | 5:11572 | DOi: 10.1038/srep11572
showed ETLR as predominant amino pattern. However, the E-S/N-L-R amino acid pattern where “S/N” is the predominant amino acid at the second position is unique to the CYP5015 family and this pattern was not found in P450 families published in the literature41. Analysis of the CXG motif (FXXGXRXCXG) across the three P450 families revealed conservation of amino acids such as “F”, “G” and “C” at the first, fourth and eighth positions. These amino acids at these positions are well known to be conserved in the P450s across the biological kingdoms41,51,52, with some P450s showing variant amino acids at these positions50. The canonical amino acids “R” and “G” at the sixth and tenth positions are conserved in the CYP5014 family and are predominant in CYP5015 and CYP5017 (Fig. 6). The amino acid pattern at the CXG motif of the CYP5017 family is to some extent matched with the CYP94 and CYP704 families41 where “Q” is dominant at the second position in all these P450 families. However, differences were found at the seventh and ninth position amino acids among the three P450 families CYP5017, CYP94 and CYP704. Comparison of CXG motif amino acid patterns for CYP5014 and CYP5015 with published P450 families CXG motif amino acid patterns41 suggested that these families have unique amino acid patterns. This strongly supports the hypothesis previously proposed41 that the amino acid pattern at these motifs is unique for a P450 family. Overall, amino acid patterns at the EXXR and CXG motifs of the three oomycete P450 families CYP5014, CYP5015 and CYP5017 are unique and these amino acid patterns (Fig. 6) can be considered characteristics of these P450 families.
Novel P450 fused proteins in oomycetes. P450s fused to redox partners and also to different pro-teins are well documented in the literature53,54. Two different types of P450 fused proteins were reported in lower eukaryotes. These two different types were: (i) P450 fused to CPR at the C-terminal end, which is well-known as P450foxy (CYP505 family)55 and (ii) P450 fused to heme peroxidase/dioxygenase at the N-terminal end (CYP6001 family)46.
Analysis of P450s in oomycetes revealed the presence of P450 fused proteins. The new P450 fam-ily CYP5619 with six members found in S. declina is fused to heme peroxidase/dioxygenase protein. However, the combination of fusion is different compared to the reported combination of P450 fused proteins in lower eukaryotes53,54. In oomycetes, the heme peroxidase/dioxygenase protein is fused at the C-terminal end to P450 (Fig. 7). This combination, i.e. N-terminal P450 domain fused to heme peroxidase/dioxygenase at its C-terminal, is a novel combination and not reported in the literature53,54. To confirm the novelty of this P450 fused protein, we performed comprehensive genome data mining to identify fused P450s, particularly heme peroxidase/dioxygenase protein fused to P450 in the pub-licly available lower eukaryote genomes45. A total number of 61 P450 fused proteins were identified (Fig. 7 and Table S10). The identified P450 fused proteins were grouped under five different P450 families namely CYP6001-CYP6005. Interestingly, the CYP6005 family is found only in Basidiomycota, whereas Ascomycota showed four different P450 fused families, CYP6001-CYP6004 (Fig. 7 and Table S10). The identified P450 fused proteins were subjected to heme peroxidase/dioxygenase and P450 domain analysis. As shown in Fig. 7, all the P450 fused proteins (CYP6001-CYP6005 family) identified in fungi showed an N-terminal heme peroxidase/dioxygenase domain and a P450 domain at the C-terminal end. This clearly confirms that the combination identified in CYP5619 family members is novel. Considering the nature of P450 fused protein, it can be concluded that CYP5619 family members are possibly involved in the oxidation of fatty acids, like CYP6001A146. However, experimental analysis is needed to unravel the difference between the two different domains’ combinations.
Functional analysis of oomycete P450s. All the oomycete P450s (except CYP51) were orphans, as functional data on oomycete P450s have not been reported. However, based on homology to character-ized P450 proteins possible functional role(s) for oomycete P450s can be predicted. The CYP51 family identified in Saprolegniales plays a key role in synthesis of membrane sterols32,33. A recent study showed that CYP51 in these organisms can serve as a novel drug target32,33. Based on functional analysis of CYP6001A1 of A. nidulans46 it is tempting to speculate that CYP5619 family members play a role in fatty acid hydroxylation. Based on homology to fatty acid hydroxylases CYP5014-CYP5017, family members may play a role in fatty acid metabolism7. The above predictions were based on homology data, as men-tioned in this article (for CYP51 and CYP5169) and one published prediction (for CYP5014-CYP5017)7. Future study will involve unravelling the P450s’ role, if any, in successful adaption to the parasitic and saprophytic lifestyle of oomycetes.
In conclusion, oomycetes are very important organisms in terms of their hard-wired parasitism lead-ing to the loss of billions of dollars in agriculture and aquaculture. Analysis of P450s in these organisms provided insights into the evolutionary pattern of P450s. Genome-wide analysis of P450s revealed the presence of moderate number of P450s in these organisms. Despite presence of a large number of new P450 families and subfamilies, P450 family blooming resulted in a low P450 diversity in oomycetes. CYP51 and novel P450 fusion proteins with different combination of heme peroxidase/dioxygenase and P450 domain were common between oomycetes and with lower eukaryote fungi. The speciation and adaption to diverse ecological niches or lifestyle of oomycetes and fungi resulted in generation of distinct P450 families in both groups. Furthermore, at order level, oomycetes showed distinct P450 families and subfamilies. This confirms that the host influence is a major factor in shaping the oomycetes genomic content and thus also reflected in terms of P450s. Presence of unique combination of amino acid patterns at EXXR and CXG motifs in oomycete P450 families strongly supported previously proposed hypothesis
© Central University of Technology, Free State
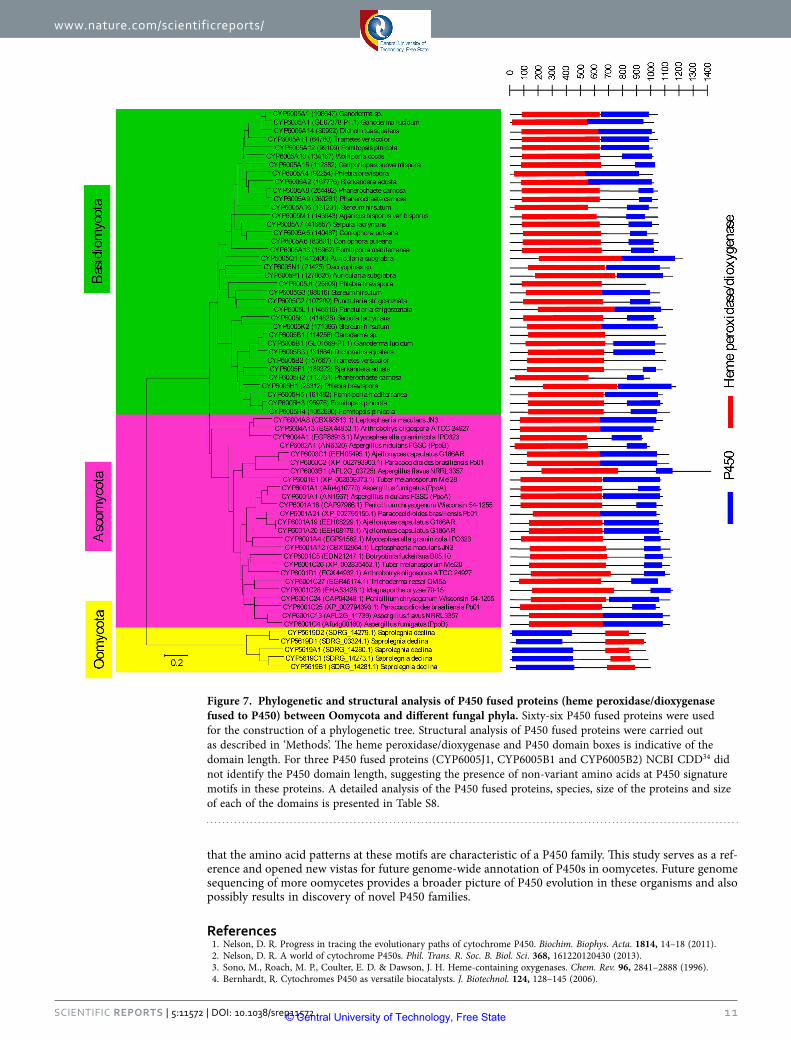
www.nature.com/scientificreports/
1 1Scientific RepoRts | 5:11572 | DOi: 10.1038/srep11572
that the amino acid patterns at these motifs are characteristic of a P450 family. This study serves as a ref-erence and opened new vistas for future genome-wide annotation of P450s in oomycetes. Future genome sequencing of more oomycetes provides a broader picture of P450 evolution in these organisms and also possibly results in discovery of novel P450 families.
References1. Nelson, D. R. Progress in tracing the evolutionary paths of cytochrome P450. Biochim. Biophys. Acta. 1814, 14–18 (2011).2. Nelson, D. R. A world of cytochrome P450s. Phil. Trans. R. Soc. B. Biol. Sci. 368, 161220120430 (2013).3. Sono, M., Roach, M. P., Coulter, E. D. & Dawson, J. H. Heme-containing oxygenases. Chem. Rev. 96, 2841–2888 (1996).4. Bernhardt, R. Cytochromes P450 as versatile biocatalysts. J. Biotechnol. 124, 128–145 (2006).
Figure 7. Phylogenetic and structural analysis of P450 fused proteins (heme peroxidase/dioxygenase fused to P450) between Oomycota and different fungal phyla. Sixty-six P450 fused proteins were used for the construction of a phylogenetic tree. Structural analysis of P450 fused proteins were carried out as described in ‘Methods’. The heme peroxidase/dioxygenase and P450 domain boxes is indicative of the domain length. For three P450 fused proteins (CYP6005J1, CYP6005B1 and CYP6005B2) NCBI CDD34 did not identify the P450 domain length, suggesting the presence of non-variant amino acids at P450 signature motifs in these proteins. A detailed analysis of the P450 fused proteins, species, size of the proteins and size of each of the domains is presented in Table S8.
© Central University of Technology, Free State
www.nature.com/scientificreports/
1 2Scientific RepoRts | 5:11572 | DOi: 10.1038/srep11572
5. Kelly, S. L. & Kelly, D. E. Microbial cytochrome P450: Biodiversity and biotechnology, where do cytochrome P450 come from, what do they do and what can they do for us? Phil. Trans. R. Soc. B. Biol. Sci. 368, 161220120430 (2013).
6. Deng, J., Carbone, I. & Dean, R. A. The evolutionary history of cytochrome P450 genes in four filamentous Ascomycetes. BMC Evol. Biol. 7, 30 (2007).
7. Moktali, V. et al. Systematic and searchable classification of cytochrome P450 proteins encoded by fungal and oomycete genomes. BMC Genomics. 13, 525 (2012).
8. Chen, W. et al. Fungal cytochrome P450 monooxygenases: Their distribution, structure, functions, family expansion, and evolutionary origin. Genome Biol. Evol. 6, 1620–34 (2014).
9. Kgosiemang, I. K. R., Mashele, S. S. & Syed, K. Comparative genomics and evolutionary analysis of cytochrome P450 monooxygenases in fungal subphylum saccharomycotina. J. Pure Appl. Microbiol. 8, 291–302 (2014).
10. Syed, K., Nelson, D. R., Riley, R. & Yadav, J. S. Genome-wide annotation and comparative genomics of cytochrome P450 monooxygenases (P450s) in the Polyporale species Bjerkandera adusta, Ganoderma sp. and Phlebia brevispora. Mycologia 105, 1445–1455 (2013).
11. Syed, K. et al. Genome-wide identification, annotation and characterization of novel thermostable cytochrome P450 monooxygenases from the thermophilic biomass-degrading fungi Thielavia terrestris and Myceliophthora thermophila. Genes Genom. 36, 321–333 (2014).
12. Syed, K., Doddapaneni, H., Subramanian, V., Lam, Y. W. & Yadav, J. S. Genome-to-function characterization of novel fungal P450 monooxygenases oxidizing polycyclic aromatic hydrocarbons (PAHs). Biochem. Biophys. Res. Commun. 399, 492–497 (2010).
13. Hirosue, S. et al. Insight into functional diversity of cytochrome P450 in the white-rot basidiomycete Phanerochaete chrysosporium: Involvement of versatile monooxygenase. Biochem. Biophys. Res. Commun. 407, 118–23 (2011).
14. Ide, M., Ichinose, H. & Wariishi, H. Molecular identification and functional characterization of cytochrome P450 monooxygenases from the brown-rot basidiomycete Postia placenta. Arch. Microbiol. 194, 243–53 (2012).
15. Syed, K., Porollo, A., Lam, Y. W., Grimmett, P. E. & Yadav, J. S. CYP63A2, a catalytically versatile fungal P450 monooxygenase capable of oxidizing higher-molecular-weight polycyclic aromatic hydrocarbons, alkylphenols, and alkanes. Appl. Environ. Microbiol. 79, 2692–7020 (2013).
16. Syed, K., Shale, K., Pagadala, N. S. & Tuszynski, J. Systematic identification and evolutionary analysis of catalytically versatile cytochrome P450 monooxygenase families enriched in model basidiomycete fungi. PLoS ONE 9(1), e86683 (2014).
17. Syed, K., Porollo, A., Miller, D. & Yadav, J. S. Rational engineering of the fungal P450 monooxygenase CYP5136A3 to improve its oxidizing activity toward polycyclic aromatic hydrocarbons. Protein Eng. Des. Sel. 26, 553–557 (2013).
18. Yoshida, Y. Cytochrome P450 of fungi: Primary target for azole antifungal agents. Cur. Top. Med. Mycol. 2, 388–418 (1988).19. Jawallapersand, P. et al. Cytochrome P450 monooxygenase CYP53 family in fungi: Comparative structural and evolutionary
analysis and its role as a common alternative anti-fungal drug target. PLoS ONE 9(9), e107209 (2014).20. Kamoun, S. Molecular genetics of pathogenic oomycetes. Eukaryot. Cell 2, 191–199 (2003).21. Lamour, K. & Kamoun, S. Oomycete genetics and genomics: Diversity, interactions, and research tools. John Wiley & Sons, Inc.,
Hoboken, New Jersey, USA (2009).22. Beakes, G. W., Clocking, S. & Sekimoto, S. The evolutionary phylogeny of oomycete “fungi”. Protoplasma 249, 3–19 (2012).23. Phillips, A. J., Anderson, V. L., Robertson, E. J., Secombes, C. J. & van West, P. New insights into animal pathogenic oomycetes.
Trends Microbiol. 16, 13–9 (2008).24. Soanes, D. M., Richards, T. A. & Talbot, N. J. Insights from sequencing fungal and oomycete genomes: What can we learn about
plant disease and the evolution of pathogenicity? Plant Cell 19, 3318–3326 (2007).25. Tyler, B. M. et al. Phythophthora genome sequencing uncovers evolutionary origins and mechanisms of pathogenesis. Science
313, 1261–1266 (2006).26. Haas, B. J. et al. Genome sequence and analysis of the Irish potato famine pathogen Phytophthora infestans. Nature 461, 393–8
(2009).27. Lévesque, C. A. et al. Genome sequence of the necrotrophic plant pathogen Pythium ultimum reveals original pathogenicity
mechanisms and effector repertoire. Genome Biol. 11, R73 (2010).28. Baxter, L. et al. Signatures of adaptation to obligate biotrophy in the Hyaloperonospora arabidopsidis genome. Science 330, 1549–
51 (2010).29. Lamour, K. H., Stam, R., Jupe, J. & Huitema, E. The oomycete broad-host-range pathogen Phytophthora capsici. Mol. Plant.
Pathol. 13, 329–37 (2012).30. Adhikari, B. N., Hamilton, J. P. & Zerillo, M. M. Comparative genomics reveals insight into virulence strategies of plant
pathogenic oomycetes. PLoS ONE 8(10), e75072 (2013).31. Jiang, R. H. Y. et al. Distinctive expansion of potential virulence genes in the genome of the oomycete fish pathogen Saprolegnia
parasitica. PLOS Genet. 9, e1003272 (2013).32. Madoui, M. A., Bertrand-Michel, J., Gaulin, E. & Dumas, B. Sterol metabolism in the oomycete Aphanomyces euteiches, a legume
root pathogen. New Phytol. 183, 291–300 (2009).33. Warrilow, A. G. et al. Clotrimazole as a potent agent for treating the oomycete fish pathogen Saprolegnia parasitica through
inhibition of sterol 14α-demethylase (CYP51). Appl. Environ. Microbiol. 80, 6154–66 (2014).34. Marchler-Bauer, A. et al. CDD: A conserved domain database for the functional annotation of proteins. Nucleic Acids Res. 39,
D225–9 (2011).35. Nelson, D. R. The cytochrome P450 homepage. Human Genomics 4, 59–65 (2009).36. Eddy, S. R. Accelerated profile HMM searches. PLoS Comp. Biol. 7, e1002195 (2011).37. Finn, R. D. et al. The Pfam protein families database. Nucleic Acids Res. 42, D222–D230 (2014).38. Price, M. N., Dehal, P. S. & Arkin, A. P. FastTree: Computing large minimum evolution trees with profiles instead of a distance
matrix. Mol. Biol. Evol. 26, 1641–1650 (2009).39. Letunic, I. & Bork, P. Interactive Tree of Life (iTOL): an online tool for phylogenetic tree display and annotation. Bioinformatics
23, 127–128 (2007).40. Larkin, M. A. et al. Clustal W and Clutal X version 2.0. Bioinformatics 23, 2947–2948 (2007).41. Syed, K. & Mashele, S. S. Comparative analysis of P450 signature motifs EXXR and CXG in the large and diverse kingdom of
fungi: Identification of evolutionarily conserved amino acid patterns characteristic of P450 family. PLoS ONE 9(4), e95616 (2014).
42. Tamura, K. et al. MEGA5: Molecular evolutionary genetics analysis using maximum likelihood, evolutionary distance, and maximum parsimony methods. Mol. Biol. Evol. 28, 2731–2739 (2011).
43. Schneider, T. D. & Stephens, R. M. Sequence logos: A new way to display consensus sequences. Nucleic Acids Res. 18, 6097–6100 (1990).
44. Crooks, G. E., Hon, G., Chandonia, J. M. & Brenner, S. E. WebLogo: A sequence logo generator. Genome Research 14, 1188–1190 (2004).
45. Grigoriev, I. V. et al. MycoCosm portal: Gearing up for 1000 fungal genomes. Nucleic Acids Res. 42, D699–704 (2014).
© Central University of Technology, Free State
www.nature.com/scientificreports/
13Scientific RepoRts | 5:11572 | DOi: 10.1038/srep11572
46. Brodhun, F., Göbel, C., Hornung, E. & Feussner, I. Identification of PpoA from Aspergillus nidulans as a fusion protein of a fatty acid heme dioxygenase/peroxidase and a cytochrome P450. J. Biol. Chem. 284, 11792–11805 (2009).
47. Rzhetsky, A. & Nei, M. A simple method for estimating and testing minimum evolution trees. Mol. Biol. Evol. 9, 945–967 (1992).48. Feyereisen, R. Arthropod CYPomes illustrate the tempo and mode in P450 evolution. Biochim. Biophys. Acta. 1814, 19–28
(2011).49. Nelson, D. R. Metazoan cytochrome P450 evolution. Comp. Biochem. Physiol. C Pharmacol. Toxicol. Endocrinol. 121, 15–22
(1998).50. Sezutsu, H., Le Goff, G. & Feyereisen, R. Origins of P450 diversity. Phil. Trans. R. Soc. B. Biol. Sci. 368, 20120428 (2013).51. Gotoh, O. Substrate recognition sites in cytochrome P450 family 2 (CYP2) proteins inferred from comparative analyses of amino
acid and coding nucleotide sequences. J. Biol. Chem. 267, 83–90 (1992).52. Sirim, D., Widmann, M., Wagner, F. & Pleiss, J. Prediction and analysis of the modular structure of cytochrome P450
monooxygenases. BMC Struct. Biol. 10, 34 (2010).53. Guengerich, F. P. & Munro, A. W. Unusual cytochrome p450 enzymes and reactions. J. Biol. Chem. 288, 17065–73 (2013).54. Lamb, D. C. & Waterman, M. R. Unusual properties of the cytochrome P450 superfamily. Phil. Trans. R. Soc. Lond. B. Biol. Sci.
368, 20120434 (2013).55. Kitazume, T., Takaya, N., Nakayama, N. & Shoun, H. Fusarium oxysporum fatty-acid subterminal hydroxylase (CYP505) is a
membrane bound eukaryotic counterpart of Bacillus megaterium cytochrome P450BM3. J. Biol. Chem. 275, 39734–39740 (2000).
AcknowledgementsK.S. and S.S.M. express their sincere gratitude to the Central University of Technology (CUT), Bloemfontein, Free State, South Africa for a grant from the University Research and Innovation Fund and Emerging Researcher Award (to K.S.). K.S. and S.S.M. thank the Department of Higher Education and Training (DHET), South Africa for a research grant. S.S.M. also thanks the National Research Foundation (NRF), South Africa for the research grant. K.S. thanks Dr. C. Robin Buell, Department of Plant Biology, Michigan State University, Michigan, USA for allowing the use of Pythium species genome sequencing data. The authors also want to extend their thanks to Ms Barbara Bradley, Pretoria, South Africa for English language editing.
Author ContributionsK.S. and S.S.M. conceived and designed the experiments, M.M.S., N.J., D.R.N., W.C., J.-H.Y., M.P., I.K.R.K., L.Q., N.T.M., R.M., S.C.R., S.S.M. and K.S. performed the experiments, analysed the data, contributed reagents/materials/analysis tools and were involved in writing the manuscript. All authors reviewed the manuscript.
Additional InformationSupplementary information accompanies this paper at http://www.nature.com/srepCompeting financial interests: The authors declare no competing financial interests.How to cite this article: Sello, M. M. et al. Diversity and Evolution of Cytochrome P450 Monooxygenases in Oomycetes. Sci. Rep. 5, 11572; doi: 10.1038/srep11572 (2015).
This work is licensed under a Creative Commons Attribution 4.0 International License. The images or other third party material in this article are included in the article’s Creative Com-
mons license, unless indicated otherwise in the credit line; if the material is not included under the Creative Commons license, users will need to obtain permission from the license holder to reproduce the material. To view a copy of this license, visit http://creativecommons.org/licenses/by/4.0/
© Central University of Technology, Free State