Embed Size (px)
Citation preview
Comparative genomics of four Pseudomonas species
Lars Juhl Jensen��� ��� �
, Marie Skovgaard�, Thomas Sicheritz-Ponten
��� �, Niclas Tue
Hansen�, Helle Johansson
�, Merete Kjær Jørgensen
�, Kristoffer Kiil
�, Peter F. Hallin
�and David Ussery
��
Center for Biological Sequence AnalysisBioCentrum-DTUBuilding 208The Technical University of DenmarkDK-2800 Lyngby, Denmark
�Structural and Computational Biology Unit
European Molecular Biology LaboratoryMeyerhofstrasse 1D-69117 Heidelberg, Germany
�Max-Delbruck-Centre fur Molecular Medicine
Robert-Rossle-Strasse 10D-13092 Berlin, Germany
�Department of Medicinal Chemistry
Division of Pharmacognosy BMCHusargatan 3Uppsala, Sweden
1
1 Introduction
The genus Pseudomonas is one of the most diverse bacterial genera, containing over 60validly described species, isolated from sources ranging from plants to contaminated soils andwater to human clinical samples. They are obligate aerobic chemoorganotrophs capable ofliving on a wide range of aliphatic and aromatic carbon compounds. Not surprisingly, the genusPseudomonas is also phylogenetically rather heterogenous, containing several subgroups (3).
The genome sequence of bacteria from four different Pseudomonas species has recentlybeen determined. Each of these species represent a major subcluster of the authentic Pseu-domonas species. P. aeruginosa is a ubiquitous environmental bacterium that is one of the topthree causes of opportunistic human infections, and was the first species sequenced (30). Pseu-domonas putida is a versatile saprophytic organism that has attracted considerable attentiondue to its potential for biotechnological applications (23). The genomes of P. aeruginosa andP. putida contain many similar genes, but exhibit different codon usage (36). Pseudomonassyringae pathovar tomato DC3000 is an organism that is phytopathogenic for tomato and Ara-bidopsis thaliana (6). Finally, Pseudomonas fluorescens is a plant growth-promoting rhizobac-terium, and the sequence of P. fluorescens SBW25 has been finished and is available from theSanger Center web page 1, although at the time of writing this genome sequence has not beenpublished.
The goal of this study is to compare some of the properties of the genome of these organ-isms. First, the genomes will be compared at the DNA sequence level. Then gene conservationwill be examined, followed by an analysis of sigma 70 factors. Finally, the proteomes will becompared in terms of differences in protein function, based on a keyword analysis. At all lev-els examined - that is, the DNA sequence, genes encoded, and protein function, Pseudomonassyringae appears to stand out amongst the four Pseudomonas species.
2 A global view of the Pseudomonas genomes
Pseudonomad genomes typically have sizes between 6 and 7 Mbp (see Table 1); whencompared to the more than one hundred sequenced bacterial genomes, only a handful of themare larger than the Pseudomonas genomes (e.g. , the Bradyrhizobium japonicum genome of 9.1Mbp)2. P. aeruginosa was the largest bacterial genome at that time it was sequenced, althoughnow the genome appears closer to be typical size for an environmental bacteria. Among thePseudomonas genomes sequenced to date, the P. aeruginosa genome has the lowest AT-content(33%), whilst the other three strains have 38–42% AT (see Table 1). All four of the Pseu-domonas genomes contain around 5450 (+/- 100) genes, and between 4 and 7 rRNA operons(see Table 1).
The fraction of repeated sequences, as shown in Figure 1 A, is simple yet important mea-sure of a genome’s properties. Global direct and global inverted repeats were calculated asdescribed elsewhere (14), and the fraction of the genome with 80% or more identity to se-quences elsewhere in the genome is shown in Figure 1 A. Global repeats include duplicatedregions of the chromosome, such as multiple rRNA clusters; the average level of global repeatsin bacterial genomes is around 4%. Of the four genomes, only P. syringae differs significantlyin global repeats from the average of 150 sequenced genomes (solid black bars in Figure 1).The larger amount of global repeats in P. syringae are in part reflective of the larger amount oftransposable elements in this genome (6).
1http://www.sanger.ac.uk/Projects/P_fluorescens/2A current listing of sequenced genomes can be found at the GenomeAtlas web resource http://www.cbs.
dtu.dk/services/GenomeAtlas/
2
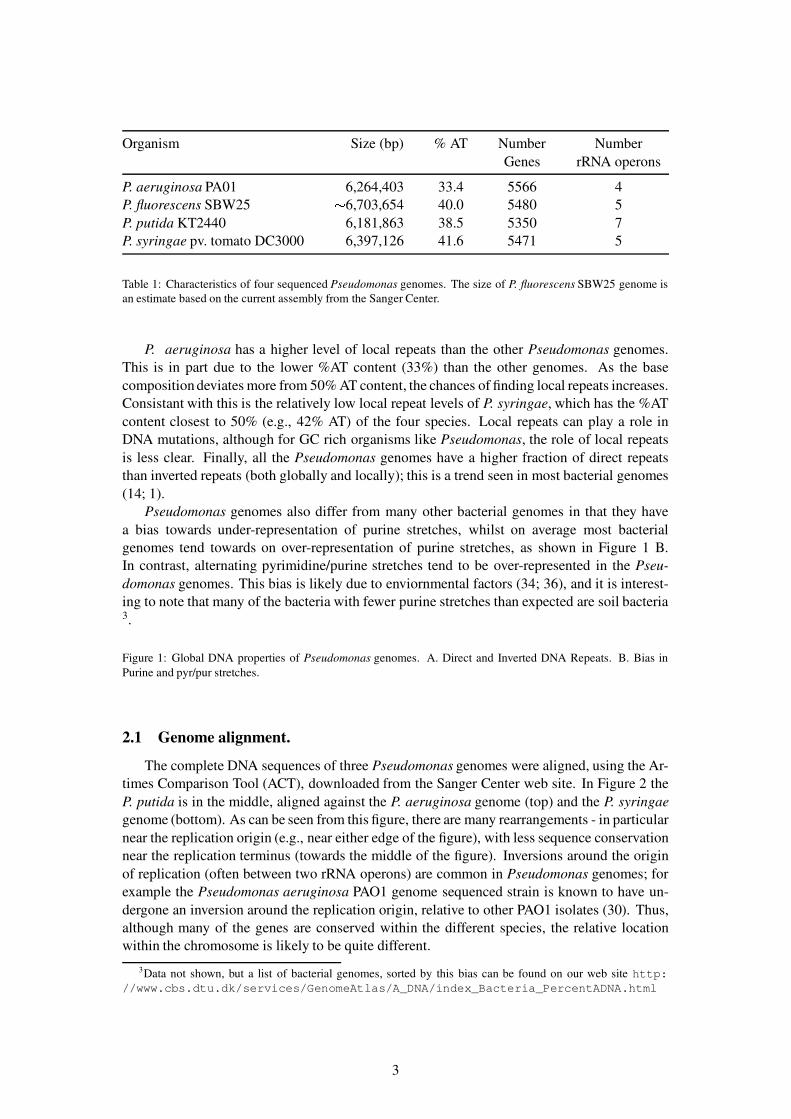
Organism Size (bp) % AT Number NumberGenes rRNA operons
P. aeruginosa PA01 6,264,403 33.4 5566 4P. fluorescens SBW25 � 6,703,654 40.0 5480 5P. putida KT2440 6,181,863 38.5 5350 7P. syringae pv. tomato DC3000 6,397,126 41.6 5471 5
Table 1: Characteristics of four sequenced Pseudomonas genomes. The size of P. fluorescens SBW25 genome isan estimate based on the current assembly from the Sanger Center.
P. aeruginosa has a higher level of local repeats than the other Pseudomonas genomes.This is in part due to the lower %AT content (33%) than the other genomes. As the basecomposition deviates more from 50% AT content, the chances of finding local repeats increases.Consistant with this is the relatively low local repeat levels of P. syringae, which has the %ATcontent closest to 50% (e.g., 42% AT) of the four species. Local repeats can play a role inDNA mutations, although for GC rich organisms like Pseudomonas, the role of local repeatsis less clear. Finally, all the Pseudomonas genomes have a higher fraction of direct repeatsthan inverted repeats (both globally and locally); this is a trend seen in most bacterial genomes(14; 1).
Pseudomonas genomes also differ from many other bacterial genomes in that they havea bias towards under-representation of purine stretches, whilst on average most bacterialgenomes tend towards on over-representation of purine stretches, as shown in Figure 1 B.In contrast, alternating pyrimidine/purine stretches tend to be over-represented in the Pseu-domonas genomes. This bias is likely due to enviornmental factors (34; 36), and it is interest-ing to note that many of the bacteria with fewer purine stretches than expected are soil bacteria3.
Figure 1: Global DNA properties of Pseudomonas genomes. A. Direct and Inverted DNA Repeats. B. Bias inPurine and pyr/pur stretches.
2.1 Genome alignment.
The complete DNA sequences of three Pseudomonas genomes were aligned, using the Ar-times Comparison Tool (ACT), downloaded from the Sanger Center web site. In Figure 2 theP. putida is in the middle, aligned against the P. aeruginosa genome (top) and the P. syringaegenome (bottom). As can be seen from this figure, there are many rearrangements - in particularnear the replication origin (e.g., near either edge of the figure), with less sequence conservationnear the replication terminus (towards the middle of the figure). Inversions around the originof replication (often between two rRNA operons) are common in Pseudomonas genomes; forexample the Pseudomonas aeruginosa PAO1 genome sequenced strain is known to have un-dergone an inversion around the replication origin, relative to other PAO1 isolates (30). Thus,although many of the genes are conserved within the different species, the relative locationwithin the chromosome is likely to be quite different.
3Data not shown, but a list of bacterial genomes, sorted by this bias can be found on our web site http://www.cbs.dtu.dk/services/GenomeAtlas/A_DNA/index_Bacteria_PercentADNA.html
3
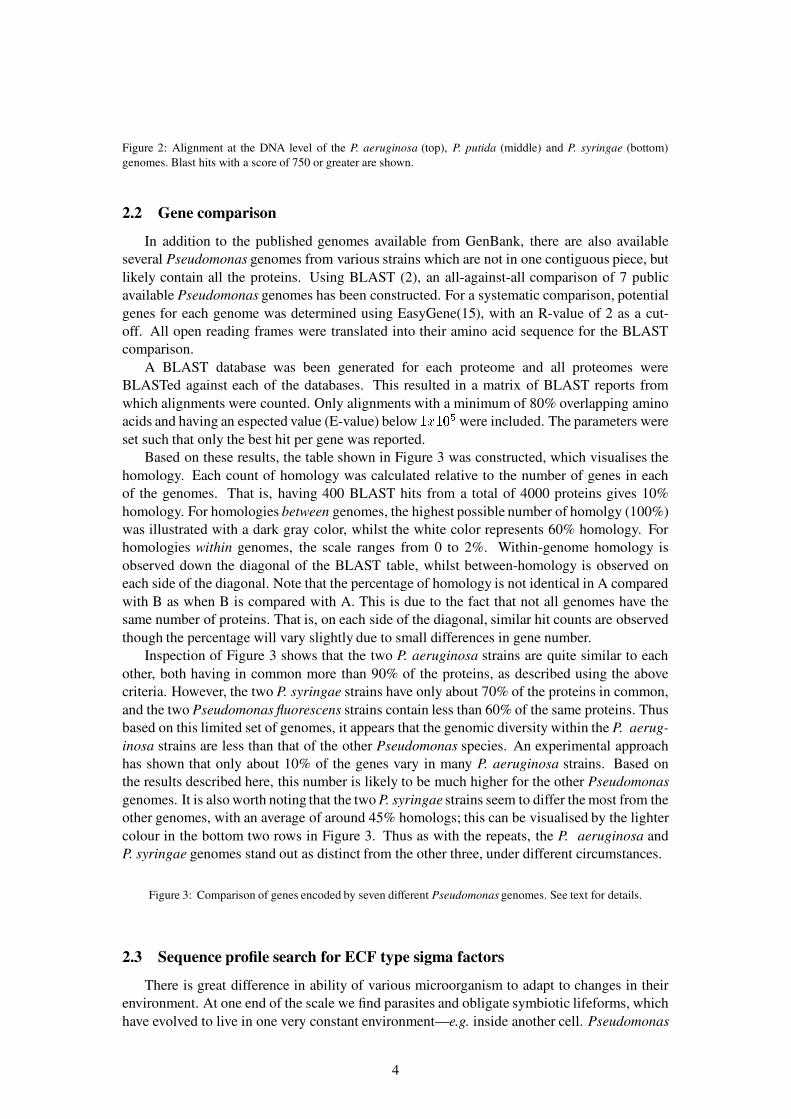
Figure 2: Alignment at the DNA level of the P. aeruginosa (top), P. putida (middle) and P. syringae (bottom)genomes. Blast hits with a score of 750 or greater are shown.
2.2 Gene comparison
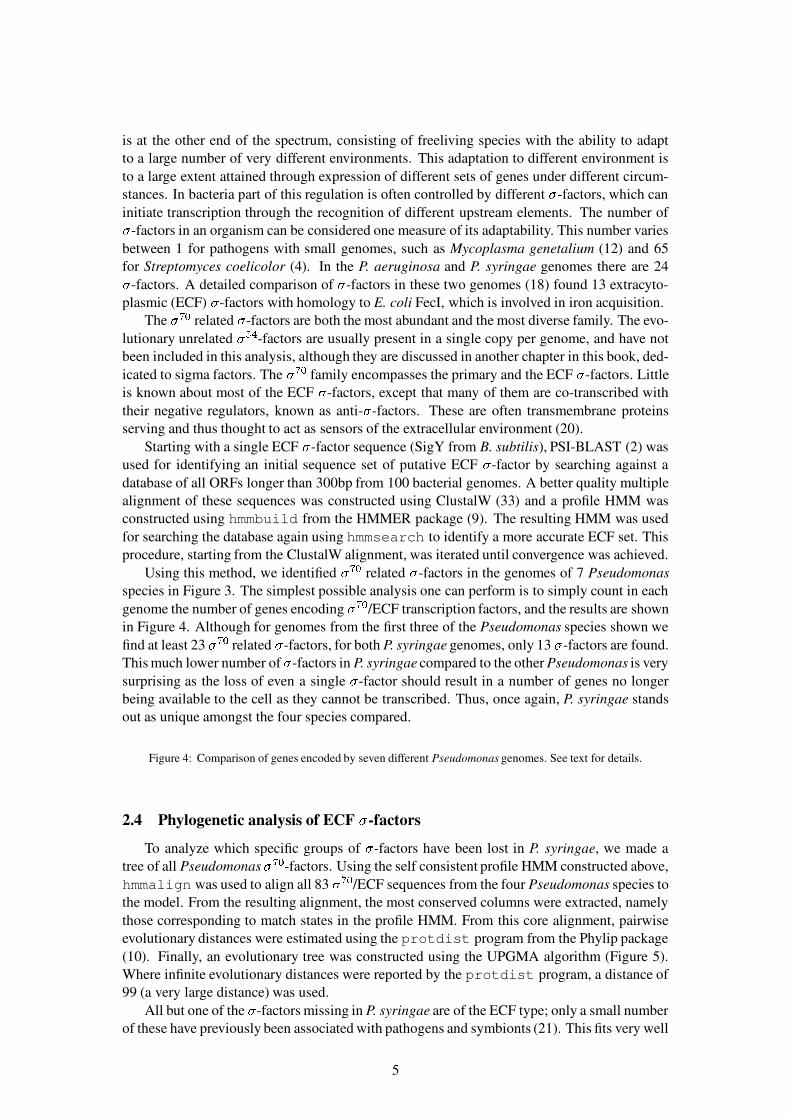
In addition to the published genomes available from GenBank, there are also availableseveral Pseudomonas genomes from various strains which are not in one contiguous piece, butlikely contain all the proteins. Using BLAST (2), an all-against-all comparison of 7 publicavailable Pseudomonas genomes has been constructed. For a systematic comparison, potentialgenes for each genome was determined using EasyGene(15), with an R-value of 2 as a cut-off. All open reading frames were translated into their amino acid sequence for the BLASTcomparison.
A BLAST database was been generated for each proteome and all proteomes wereBLASTed against each of the databases. This resulted in a matrix of BLAST reports fromwhich alignments were counted. Only alignments with a minimum of 80% overlapping aminoacids and having an espected value (E-value) below
��� ��were included. The parameters were
set such that only the best hit per gene was reported.Based on these results, the table shown in Figure 3 was constructed, which visualises the
homology. Each count of homology was calculated relative to the number of genes in eachof the genomes. That is, having 400 BLAST hits from a total of 4000 proteins gives 10%homology. For homologies between genomes, the highest possible number of homolgy (100%)was illustrated with a dark gray color, whilst the white color represents 60% homology. Forhomologies within genomes, the scale ranges from 0 to 2%. Within-genome homology isobserved down the diagonal of the BLAST table, whilst between-homology is observed oneach side of the diagonal. Note that the percentage of homology is not identical in A comparedwith B as when B is compared with A. This is due to the fact that not all genomes have thesame number of proteins. That is, on each side of the diagonal, similar hit counts are observedthough the percentage will vary slightly due to small differences in gene number.
Inspection of Figure 3 shows that the two P. aeruginosa strains are quite similar to eachother, both having in common more than 90% of the proteins, as described using the abovecriteria. However, the two P. syringae strains have only about 70% of the proteins in common,and the two Pseudomonas fluorescens strains contain less than 60% of the same proteins. Thusbased on this limited set of genomes, it appears that the genomic diversity within the P. aerug-inosa strains are less than that of the other Pseudomonas species. An experimental approachhas shown that only about 10% of the genes vary in many P. aeruginosa strains. Based onthe results described here, this number is likely to be much higher for the other Pseudomonasgenomes. It is also worth noting that the two P. syringae strains seem to differ the most from theother genomes, with an average of around 45% homologs; this can be visualised by the lightercolour in the bottom two rows in Figure 3. Thus as with the repeats, the P. aeruginosa andP. syringae genomes stand out as distinct from the other three, under different circumstances.
Figure 3: Comparison of genes encoded by seven different Pseudomonas genomes. See text for details.
2.3 Sequence profile search for ECF type sigma factors
There is great difference in ability of various microorganism to adapt to changes in theirenvironment. At one end of the scale we find parasites and obligate symbiotic lifeforms, whichhave evolved to live in one very constant environment—e.g. inside another cell. Pseudomonas
4
is at the other end of the spectrum, consisting of freeliving species with the ability to adaptto a large number of very different environments. This adaptation to different environment isto a large extent attained through expression of different sets of genes under different circum-stances. In bacteria part of this regulation is often controlled by different � -factors, which caninitiate transcription through the recognition of different upstream elements. The number of� -factors in an organism can be considered one measure of its adaptability. This number variesbetween 1 for pathogens with small genomes, such as Mycoplasma genetalium (12) and 65for Streptomyces coelicolor (4). In the P. aeruginosa and P. syringae genomes there are 24� -factors. A detailed comparison of � -factors in these two genomes (18) found 13 extracyto-plasmic (ECF) � -factors with homology to E. coli FecI, which is involved in iron acquisition.
The ����� related � -factors are both the most abundant and the most diverse family. The evo-lutionary unrelated ����� -factors are usually present in a single copy per genome, and have notbeen included in this analysis, although they are discussed in another chapter in this book, ded-icated to sigma factors. The � ��� family encompasses the primary and the ECF � -factors. Littleis known about most of the ECF � -factors, except that many of them are co-transcribed withtheir negative regulators, known as anti- � -factors. These are often transmembrane proteinsserving and thus thought to act as sensors of the extracellular environment (20).
Starting with a single ECF � -factor sequence (SigY from B. subtilis), PSI-BLAST (2) wasused for identifying an initial sequence set of putative ECF � -factor by searching against adatabase of all ORFs longer than 300bp from 100 bacterial genomes. A better quality multiplealignment of these sequences was constructed using ClustalW (33) and a profile HMM wasconstructed using hmmbuild from the HMMER package (9). The resulting HMM was usedfor searching the database again using hmmsearch to identify a more accurate ECF set. Thisprocedure, starting from the ClustalW alignment, was iterated until convergence was achieved.
Using this method, we identified � ��� related � -factors in the genomes of 7 Pseudomonasspecies in Figure 3. The simplest possible analysis one can perform is to simply count in eachgenome the number of genes encoding � ��� /ECF transcription factors, and the results are shownin Figure 4. Although for genomes from the first three of the Pseudomonas species shown wefind at least 23 � ��� related � -factors, for both P. syringae genomes, only 13 � -factors are found.This much lower number of � -factors in P. syringae compared to the other Pseudomonas is verysurprising as the loss of even a single � -factor should result in a number of genes no longerbeing available to the cell as they cannot be transcribed. Thus, once again, P. syringae standsout as unique amongst the four species compared.
Figure 4: Comparison of genes encoded by seven different Pseudomonas genomes. See text for details.
2.4 Phylogenetic analysis of ECF � -factors
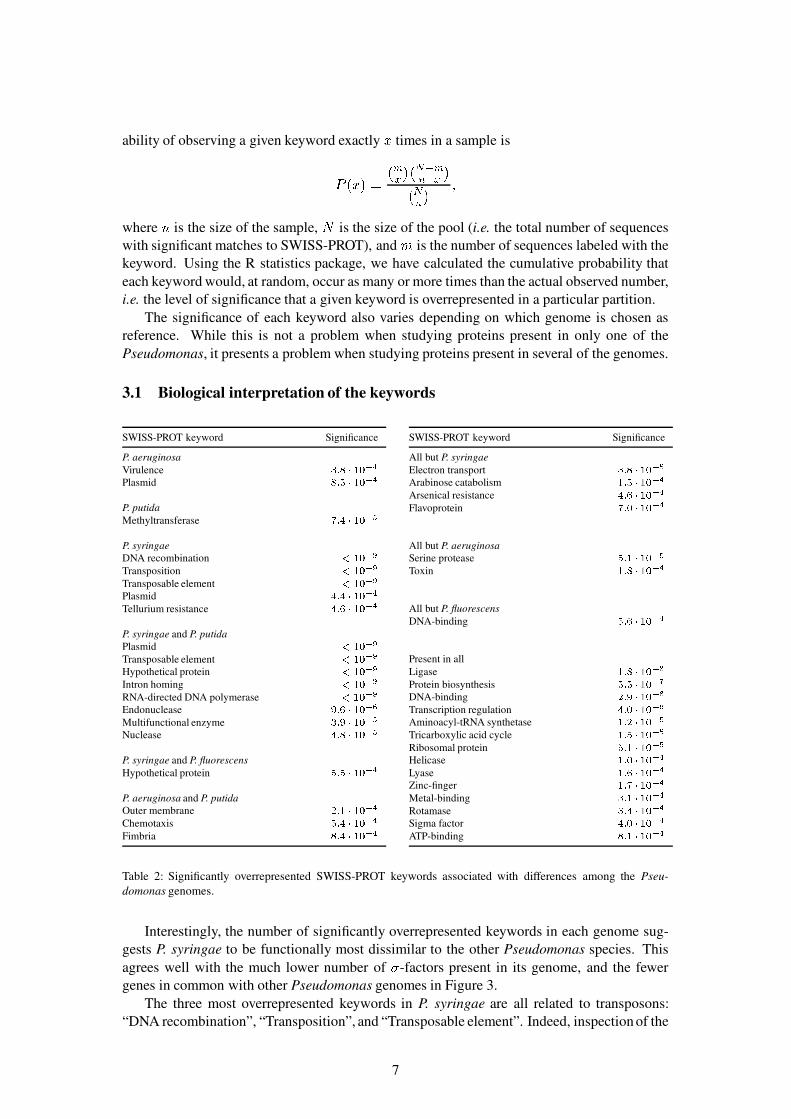
To analyze which specific groups of � -factors have been lost in P. syringae, we made atree of all Pseudomonas ����� -factors. Using the self consistent profile HMM constructed above,hmmalign was used to align all 83 � ��� /ECF sequences from the four Pseudomonas species tothe model. From the resulting alignment, the most conserved columns were extracted, namelythose corresponding to match states in the profile HMM. From this core alignment, pairwiseevolutionary distances were estimated using the protdist program from the Phylip package(10). Finally, an evolutionary tree was constructed using the UPGMA algorithm (Figure 5).Where infinite evolutionary distances were reported by the protdist program, a distance of99 (a very large distance) was used.
All but one of the � -factors missing in P. syringae are of the ECF type; only a small numberof these have previously been associated with pathogens and symbionts (21). This fits very well
5
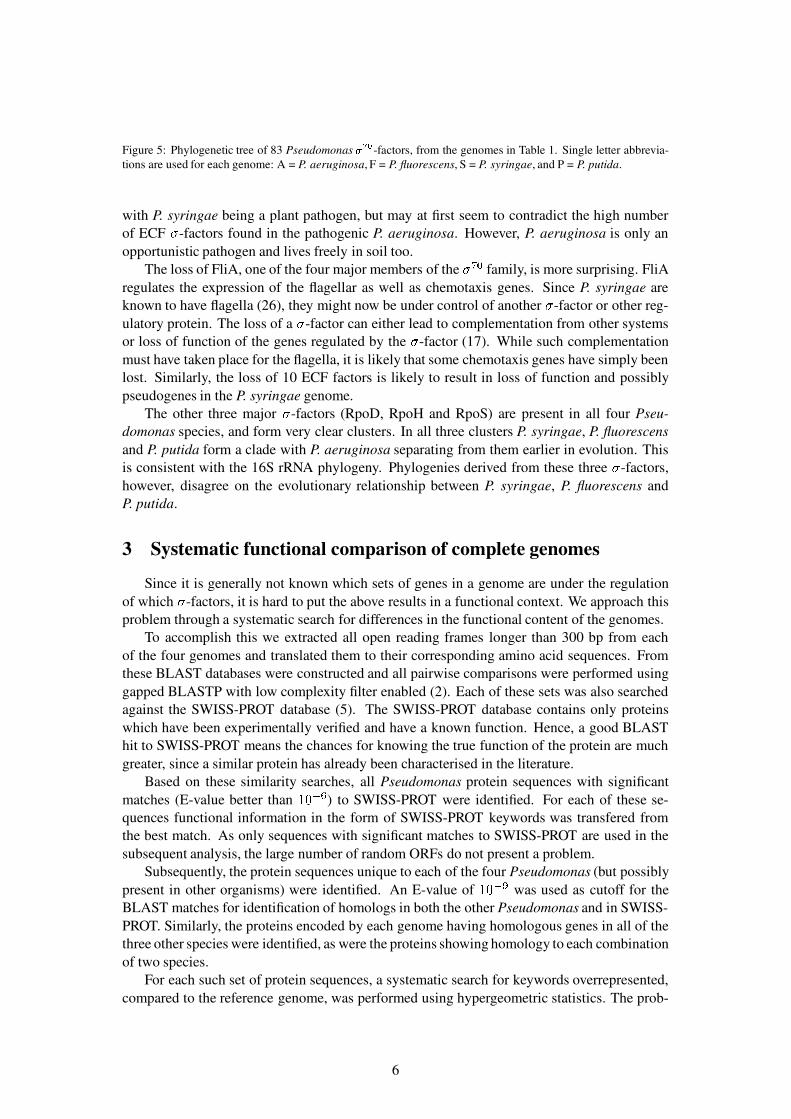
Figure 5: Phylogenetic tree of 83 Pseudomonas ����� -factors, from the genomes in Table 1. Single letter abbrevia-tions are used for each genome: A = P. aeruginosa, F = P. fluorescens, S = P. syringae, and P = P. putida.
with P. syringae being a plant pathogen, but may at first seem to contradict the high numberof ECF � -factors found in the pathogenic P. aeruginosa. However, P. aeruginosa is only anopportunistic pathogen and lives freely in soil too.
The loss of FliA, one of the four major members of the �� �! family, is more surprising. FliAregulates the expression of the flagellar as well as chemotaxis genes. Since P. syringae areknown to have flagella (26), they might now be under control of another � -factor or other reg-ulatory protein. The loss of a � -factor can either lead to complementation from other systemsor loss of function of the genes regulated by the � -factor (17). While such complementationmust have taken place for the flagella, it is likely that some chemotaxis genes have simply beenlost. Similarly, the loss of 10 ECF factors is likely to result in loss of function and possiblypseudogenes in the P. syringae genome.
The other three major � -factors (RpoD, RpoH and RpoS) are present in all four Pseu-domonas species, and form very clear clusters. In all three clusters P. syringae, P. fluorescensand P. putida form a clade with P. aeruginosa separating from them earlier in evolution. Thisis consistent with the 16S rRNA phylogeny. Phylogenies derived from these three � -factors,however, disagree on the evolutionary relationship between P. syringae, P. fluorescens andP. putida.
3 Systematic functional comparison of complete genomes
Since it is generally not known which sets of genes in a genome are under the regulationof which � -factors, it is hard to put the above results in a functional context. We approach thisproblem through a systematic search for differences in the functional content of the genomes.
To accomplish this we extracted all open reading frames longer than 300 bp from eachof the four genomes and translated them to their corresponding amino acid sequences. Fromthese BLAST databases were constructed and all pairwise comparisons were performed usinggapped BLASTP with low complexity filter enabled (2). Each of these sets was also searchedagainst the SWISS-PROT database (5). The SWISS-PROT database contains only proteinswhich have been experimentally verified and have a known function. Hence, a good BLASThit to SWISS-PROT means the chances for knowing the true function of the protein are muchgreater, since a similar protein has already been characterised in the literature.
Based on these similarity searches, all Pseudomonas protein sequences with significantmatches (E-value better than "�#%$'& ) to SWISS-PROT were identified. For each of these se-quences functional information in the form of SWISS-PROT keywords was transfered fromthe best match. As only sequences with significant matches to SWISS-PROT are used in thesubsequent analysis, the large number of random ORFs do not present a problem.
Subsequently, the protein sequences unique to each of the four Pseudomonas (but possiblypresent in other organisms) were identified. An E-value of "�#($%) was used as cutoff for theBLAST matches for identification of homologs in both the other Pseudomonas and in SWISS-PROT. Similarly, the proteins encoded by each genome having homologous genes in all of thethree other species were identified, as were the proteins showing homology to each combinationof two species.
For each such set of protein sequences, a systematic search for keywords overrepresented,compared to the reference genome, was performed using hypergeometric statistics. The prob-
6
ability of observing a given keyword exactly * times in a sample is
+-, */.10243 57682:9<;%3= ; 5162 9 = 6 >
where ? is the size of the sample, @ is the size of the pool (i.e. the total number of sequenceswith significant matches to SWISS-PROT), and A is the number of sequences labeled with thekeyword. Using the R statistics package, we have calculated the cumulative probability thateach keyword would, at random, occur as many or more times than the actual observed number,i.e. the level of significance that a given keyword is overrepresented in a particular partition.
The significance of each keyword also varies depending on which genome is chosen asreference. While this is not a problem when studying proteins present in only one of thePseudomonas, it presents a problem when studying proteins present in several of the genomes.
3.1 Biological interpretation of the keywords
SWISS-PROT keyword Significance
P. aeruginosaVirulence BDC EGF�HJILKNMPlasmid EDC O/F�HJI KNMP. putidaMethyltransferase P�C QGF�HJILKNRP. syringaeDNA recombination STHJI KNUTransposition STHJI KNUTransposable element STHJI KNUPlasmid QDC QGF�HJILKNMTellurium resistance QDC VGF�HJILKNMP. syringae and P. putidaPlasmid STHJI KNUTransposable element STHJILKNUHypothetical protein STHJI KNUIntron homing STHJILKNURNA-directed DNA polymerase SWHXILKNUEndonuclease YDC VGF�HJI KNZMultifunctional enzyme BDC YGF�HJI KNRNuclease QDC EGF�HJI KNRP. syringae and P. fluorescensHypothetical protein O�C O/F�HJILKNMP. aeruginosa and P. putidaOuter membrane [�C\H%F�HJI KNMChemotaxis O�C QGF�HJILKNMFimbria EDC QGF�HJILKNM
SWISS-PROT keyword Significance
All but P. syringaeElectron transport BDC EGF�HJILKNRArabinose catabolism H�C O/F�HJI KNMArsenical resistance QDC VGF�HJILKNMFlavoprotein P]C IGF^HXIDKNMAll but P. aeruginosaSerine protease O�C\H%F�HJI KNRToxin H�C EGF^HXI KNMAll but P. fluorescensDNA-binding O�C VGF�HJILKNMPresent in allLigase H�C EGF^HXIDKN_Protein biosynthesis O]C O/F^HXIDKN`DNA-binding [�C YGF�HJI KNZTranscription regulation QDC IGF�HJI KNZAminoacyl-tRNA synthetase H�C [/F�HJI KNRTricarboxylic acid cycle H�C O/F�HJILKNRRibosomal protein O�C\H%F�HJILKNRHelicase H�C IGF^HXIDKNMLyase H�C VGF^HXIDKNMZinc-finger H�C P/F�HJI KNMMetal-binding BLC\H%F^HXIDKNMRotamase BLC QGF^HXIDKNMSigma factor QDC IGF�HJILKNMATP-binding EDC\H%F�HJILKNM
Table 2: Significantly overrepresented SWISS-PROT keywords associated with differences among the Pseu-domonas genomes.
Interestingly, the number of significantly overrepresented keywords in each genome sug-gests P. syringae to be functionally most dissimilar to the other Pseudomonas species. Thisagrees well with the much lower number of a -factors present in its genome, and the fewergenes in common with other Pseudomonas genomes in Figure 3.
The three most overrepresented keywords in P. syringae are all related to transposons:“DNA recombination”, “Transposition”, and “Transposable element”. Indeed, inspection of the
7
P. syringae genome reveals the presence of 13 different families of transposons. The keyword“Plasmid”, which may appear non-intuitive for chromosomal genes, could indicate that a largenumber of the genes only found in P. syringae may have been incorporated from plasmids.
The final keyword significantly overrepresented among P. syringae specific genes, “Tellu-rite resistance”, makes biological sense too, as tellurium resistance has indeed been reportedfor P. syringae (8). The toxicity of tellurite is largely due to it being oxidative. The resis-tance mechanism involves reduction of the oxidative tellurite to a less harmful compound andsubsequent extrusion (32).
In P. aeruginosa, the keyword “Virulence” and “Plasmid” are found to be overrepresentedamong genes only found in this genome. The presence of virulence related proteins shouldnot come as a surprise, as P. aeruginosa is known to be an opportunistic pathogen. As wasbriefly mentioned for P. syringae, the presence of proteins typically found on plasmids is alsonot surprising. In fact, plasmid transfer may very be the mechanism by which P. aeruginosaobtained its virulence genes as such genes are often found on plasmids.
Only one SWISS-PROT keyword, “Methyltransferase”, displayed significant overrepre-sentation in the set of proteins only found in P. putida. This keyword is closely related to onefound to be overrepresented among proteins shared by P. putida and P. aeruginosa—namely“Chemotaxis”. The chemotaxis mechanism allows bacteria to move in an advantageous way bymeasuring the gradients of repellants or attractants. At the molecular level chemotaxis involvesa number of sensory proteins, methyl accepting chemotaxis proteins (MCP), that measure theconcentrations of attractants and repellants over time. MCP bind attractants or repellants, ei-ther directly or indirectly, through interactions with periplasmic binding proteins. MCP can bemethylated and de-methylated by methyltransferases, to alter their activity.
A large number of keywords are associated with proteins common to all four Pseudomonas.The vast majority of these would also be expected to be conserved to other species too asthey stem from essential processes like transcription, translation, and central pathways of themetabolism (e.g. “Tricarboxylic acid cycle”). “Ligase” being the most significant of the key-words can be explained by the involvement of ligases in transcription as well as translation.
The keyword “sigma factor” is one of the more interesting. According to this test the b -factors are very well conserved in the Pseudomonas. Despite P. syringae lacking many of theb -factors found in other Pseudomonas, b -factors are still overrepresented among the proteinsconserved in all four Pseudomonas.
Among the proteins unique to/absent from each of the four Pseudomonas, it is clear thatP. syringae has both the most significant and largest number of significantly overrepresentedkeywords. The functionality encoded by the P. syringae genome differs from the other Pseu-domonas—a finding consistent with the study of b -factors possibly indicating loss of functionin the P. syringae genome, as well as the BLAST results in Figure 3.
4 Genome comparison atlases
Knowing that functional differences exist among the Pseudomonas, it is interesting to ex-amine if these functions are localized within particular regions unique to the strain. Regionsthat are found in only in or more of the genomes can be detected in a genome comparison atlas.
4.1 Atlas visualization
Methods such as the “atlas visualization” have previously proven very useful for gainingan overview of local variations in many different genomic features (14; 25; 29). We havepreviously used Genome Atlases to compare the P. aeruginosa and P. syringae genomes (36).Atlases will be used here for comparing genomic features of the four Pseudomonas species, as
8
well as for correlating their differences to DNA properties and the functional characterizationsobtained from the keyword analysis.
The matches between the 3 published Pseudomonas genomes were found by aligning allannotated protein coding genes against each other; all open reading frames longer than 300 bpwere translated and used for P. fluorescens. The BLAST matches are visualized as the outerthree circles in Figures 6, 7, and 8, representing each of the organisms against which BLASTsearches were performed and a fourth circle representing matches against the SWISS-PROTdatabase (5). For every protein the negative logarithm of the E-value of the most significantmatch was calculated (imposing a maximum score of 15 for highly significant matches). Thesevalues were mapped to the chromosomal location of the corresponding genes. The color scalewas reversed so that only lack of hits appear in the circle. This allows us to detect clusters ofproteins that are found in only a subset of the analyzed organisms. On each atlas we also showthe localization of the most significant keyword (or set of keywords) for the specie in question.These keywords were inferred from BLAST matches to SWISS-PROT and regions were colorcoded according to their density of genes having the keyword(s).
In addition to these sequence similarity based circles, a circle showing the local AT-contentis included since it contains local contextual DNA information along the genome. It is visual-ized using a double sided color scheme where regions of with unusually high or low AT-contentare highlighted in red and cyan, respectively. The AT-content is closely correlated to manyDNA structural properties (25), but is also of interest because foreign DNA acquired throughlateral gene transfer often has a different AT-content (13). A second circle shows the positionpreference (one of the structural parameters least correlated to AT-content) which is a measureof anisotropic flexibility and regions of low position preference are generally correlated withmore highly expressed genes (27; 24).
The AT-content only contains part of the information that can be encoded by the local basecomposition. The rest can be represented by a class of parameters called skews, which haveproven very useful for locating the origin and terminus of replication in bacteria (16).
The skews are independent of the AT-content and instead represent preferences for havingG’s over C’s (the GC-skew) or A’s over T’s (the AT-skew) on one of the two DNA strands. Boththe absolute and relative strength of these skews vary greatly between organisms, as does theorientation of the AT-skew compared to the GC-skew. In the case of Pseudomonas, the skewsare strong and anti-correlated; they can therefore favorably be combined into a single skew, theketo skew, defined as c4dfehgjilkfinmWo�pDq (19; 14).
4.2 P. aeruginosa
Figure 6: Genome comparison atlas of P. aeruginosa PA01. Each of the concentric circles represent genomicfeatures as described in the figure legend on the right, with the outermost circle corresponding to the top-mostfeature in the legend, and the innermost circle corresponding to the bottom-most feature in the legend. Dark bandsin the outer four circles represent the location of genes which are not conserved in other Pseudomonas genomes orin SWISS-PROT (blue circle, fourth lane in the atlas). The inner three circles contain DNA structural properties, asdescribed in the “Atlas Visualisation” section of the text.
Figure 6 shows a Genome Comparison atlas for P. aeruginosa. The outermost four cir-cles map BLAST hits (or actually the absence thereof) to genes encoded by the P. aeruginosagenome. Since so many of the genes are in common for the different genomes, the places wheregenes are NOT conserved are shaded dark. For example, there are two prophages present inP. aeruginosa (between 0.5 M and 1.0 M bp, labelled in Figure 6), which are not found in theother genomes (dark bands in the four outermost circles - note that the first prophage does have
9
a match (hence no dark band) in the P. syringae genome). The inner three circles contain DNAstructural properties, as described above.
P. aeruginosa separated from the other Pseudomonas species earlier in the course of evolu-tion and has since then aquired functions which allow it to be a oppotunistic pathogen. In spiteof this, the majority of the genes in P. aeruginosa have homologs in the other Pseudomonasgenomes, as can be seen from the relatively few dark lines (representing poor or not matches)in the outer circles. For genes in P. aeruginosa but not in the other Pseudomonas genomes,two SWISS-PROT keywords were found to be significantly overrepresented; “plasmid” and“virulence”. Matches to SWISS-PROT and the other Pseudomonas, as well as the position asgenes related to the keyword “virulence” can be seen in Figure 6. The keyword “plasmid” isnot plotted as it is associated with a large number of different functionalities and is thus foundthroughout the genome.
Unlike the other Pseudomonas species in this study, P. aeruginosa is known to be apathogen infecting humans, it should therefore be possible to see regions of genes that areunique to P. aeruginosa and have the keyword “virulence”. The area marked Type III secre-tion is a good example of that. The type III secretion system is known to be a determinantof the virulence of P. aeruginosa (37; 11). The Hrp type III secretion system that is found inP. syringae and P. fluorescens is capable of eliciting a hypersensitive response in plant cells(7). The similarity between the Hrp secretion system and the type III secretion system seen inP. aeruginosa is, however, only weak as they serve different functions.
Two prophages are also labeled on the atlas. One, prophage Pf1, is only found in P. aerug-inosa, and a putative bacteriophage marked 100kb upstream appears to have a homolog inP. syringae but not in the two other Pseudomonas. The two labeled prophage regions have veryhigh AT-content compared to the rest of the genome as is the case for a region at 4.7Mb. Thisregion was—because of the difference in AT-content—suggested to be a candidate of horizontalgene transfer (30). The very low value of position preference also seen in this region indicatesthat the region is likely to contain highly expressed genes. The corresponding proteins matchsequences in SWISS-PROT and the region as such is conserved among Pseudomonas. Theregion is an ancient cluster of genes encoding several ribosomal proteins, subunits of the RNApolymerase, and SecY (31). In P. syringae and P. putida the cluster is located at approximately0.5 Mb, indicating that the cluster was relocated as part of the proposed chromosomal inversionaround the origin (30).
4.3 P. putida
Figure 7: Genome comparison atlas P. putida KT2440. The circles are as described in Figure 6.
In P. putida one keyword was found to be significantly overrepresented: “Methyltrans-ferase”. Unlike the virulence genes in P. aeruginosa, these genes are not found to form clusterswithin the genome of P. putida. A number of other regions found only in P. putida are seenin Figure 7. However, as most of these acquired regions contain genes that are not found inSWISS-PROT either, one can only speculate what their functions are. In a few cases where thefunctionality of some of the genes is known, they have been found to increase the metabolicproficiency of P. putida (35; 23).
Some of the regions that have matches to SWISS-PROT correspond to prophages; thesewere also found to be connected to viral proteins by the phylome analysis. The T7 prophagestands out in particular by also having low position preference and inverted keto skew comparedto its surroundings. Incidentally, the only other region with strong skew inversion present in theP. putida genome also has very low position preference. It corresponds to a gene encoding a
10
putative 8682 aa surface adhesion protein, making it the largest of the annotated protein codinggenes in P. putida.
Many of the inserted regions in P. putida (but not the prophages) have a very high AT-content compared to the genome average. This, together with the number of insertions, indi-cates that P. putida is highly suspectible to gene transfer (35). The region labeled Thymidylateinsertion is an example of one such region; it is a 60kb element inserted in the thymidylate ki-nase gene. While most of the genes in this region are of unknown function, four adjacent geneshave by homology been associated with arsenic/arsenite resistance. In contrast to P. aerugi-nosa, P. putida is known to be resistant to both arsenite and arsenate (22).
4.4 P. syringae
Figure 8: Genome comparison atlas of P. syringae pv. tomato DC3000.
While P. putida is known to be resistant to arsenic containing compounds, the keyword“tellurium resistance” was found to be overrepresented among P. syringae specific genes. Thegenes with this keyword are localized as one gene cluster, which is labeled in Figure 8.
From the large number of significantly overrepresented keywords found for P. syringae, itis clear that it is very different from the other Pseudomonas. The most significant keywordswere “DNA recombination”, “transposable element” and “transposition”, which are closelyrelated and thus shown together as one circle (black circle in Figure 8).
In addition to the genes corresponding to these keywords, a number of genes exist thatare found neither in other Pseudomonas genomes nor in SWISS-PROT. Similar to what wasobserved in P. putida, these genes are clustered within the genome, although the number ofclusters is larger in P. syringae. Once again, one can only speculate about function of thesegenes.
Two such unknown regions of approximately 100kb each are found near the origin andterminus of replication. This pattern is neither seen in P. putida nor in P. aeruginosa. Thepositioning of unknown genes near the origin is surprising as this region often contains highlyexpressed household genes. It is thus intriguing that the region has low position preference(indicating the possibility of highly expressed genes), although it should be noted that this isthe case for many other inserted regions as well.
Next to the terminus is located a cluster of genes that are present in P. putida too but not inthe two other Pseudomonas genomes. A number of genes in this region further have similarityto SWISS-PROT sequences from the nitrogen fixating soil bacterium Rhizobium sp. strainNGR234. However, the function of these is not known, explaining why this group of geneswas not discovered in the keyword analysis. Given that Rhizobium lives in symbiosis withplants while P. syringae is a plant pathogen, we suggest that this region is a likely candidate oflateral gene transfer. This is supported by the high AT-content of the region compared to thegenome average as well as by the region being flanked by transposons
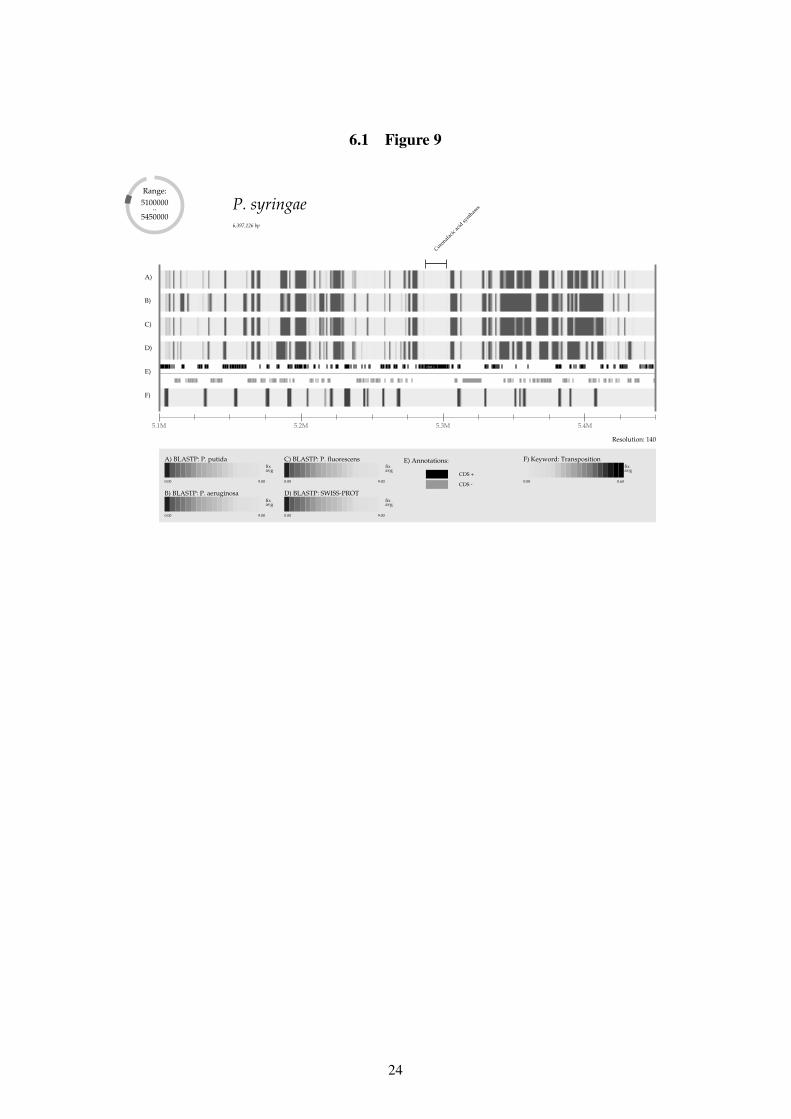
Figure 9: Zoom of a region with many transposable elements and genes unique to P. syringae.
Although transposable elements are dispersed throughout the genome, they appear to beespecially frequent within the otherwise uncharacterized regions. This is in particular true forthe region shown in Figure 9 (this region is labeled Zoom in Figure 8). From the zoom it is ob-vious that the subregions of unknown genes are flanked by genes associated with transposition.The region does not only contain genes of unknown function—genes involved in the synthesis
11
of the polyketide coronafacic acid are also located in the region. Futhermore phylome analysissuggests a possible source for these genes as they are most closely related to actinobacterialgenes. Another observation made from phylome analysis was the relatively high number ofP. syringae proteins predicted to be of eukaryotic origin, which is possibly due to lateral genetransfer from the host organism.
5 Conclusions
We have compared the genomes of four different Pseudomonas species, using several dif-ferent approaches, and find that, depending on the features examined, in some ways P. aerug-inosa stands out as unique amongst the four, but in many other ways, in particular in genomevariation, P. syringae is significantly different from the other three. It is the fundamental idea ofcomparative genomics to use the entire genomes as the basis for comparison—however supris-ingly few methods have been developed for actually doing it. We present a new approach:a systematic statistical search for differences between the gene functions present in a set ofgenomes. This allows us to, without prior knowledge, obtain hints about biological propertiesunique to each organism.
When it comes to gaining an overview of complete genomes, it is difficult to overestimatethe importance of good visualization techniques. They enable scientists to discover relations inthe data that would otherwise go unnoticed. In the present chapter we have used such a method,the atlas visulization, to both compare the four Pseudomonas genomes to each other and relatetheir differences to DNA structural properties as well as gene functions.
Despite strong phylogenetic support for P. aeruginosa being evolutionary separated fromthe other three Pseudomonas, it is clearly P. syringae that stands out when one performs thecomparison at the genomic level. This suggests that the genome of P. syringae must haveundergone large changes within a relatively short timespan as part of adapting to a symbi-otic/parasitic lifestyle. Many such changes in the P. syringae genome are revealed by our anal-ysis, include the loss of many genes and uptake of others, which is likely to be mediated by thelarge number of transposons dispersed throughout its genome. The same methods, when ap-plied to the P. aeruginosa genome, highlighted a number of features related to its pathogenicity,in particular the type III secretory system.
6 Acknowledgements
This work was supported by grants from the Danish National Research Foundation and theDanish Natural Science Research Council. Lars Juhl Jensen is funded by the Bundesminis-terium fur Forschung und Bildung, BMBF-01-GG-9817. Marie Skovgaard is funded by EUCell Factory Project, Screen, QLK3-CT-2000-00649. Thomas Sicheritz-Ponten is funded byKnut and Alice Wallenberg’s Foundation.
Preliminary sequence data for the Pseudomonas fluorescens strain PfO1 was obtainedfrom the Joint Genomes Initiative web page (http://spider.jgi-psf.org/JGI_microbial/html/pseudomonas/pseudo_homepage.html).
References
[1] Achaz, G., Rocha, E. P., Netter, P. and Coissac, E., 2002, Origin and fate of repeats inbacteria. Nucl. Acids Res., 30:2987–2994.
12
[2] Altschul, S. F., Madden, T. L., Schaffer, A. A., Zhang, J., Zhang, Z., Miller, W. andLipman, D. J., 1997, Gapped BLAST and PSI-BLAST: A new generation of proteindatabase search programs. Nucl. Acids Res., 25:3389–3402.
[3] Anzai, Y., Kim, H., Park, J., Wakabayashi, H. and Oyaizu, H., 2000, Phylogenetic affili-ation of the pseudomonads based on 16S rRNA sequence. Int. J. Sys. Evolut. Microbiol.,50:1563–1589.
[4] Bentley, S. D., Chater, K. F., Cerdeno-Tarraga, A.-M., Challis, G. L., Thomson, N. R.,James, K. D., Harris, D. E., Quali, A., Kieser, H., Harper, D., Bateman, A., Brown, S.,Chandra, G., Chen, C. W., Collins, M., Cronin, A., Fraser, A., Goble, A., Hidalgo, J.,Hornsby, T., Howarth, S., Huang, C.-H., Kieser, T., Larke, L., Murphy, L., Oliver, K.,O’Neil, S., Rabbinowitsch, E., Rajandream, M.-A., Rutherford, K., Rutter, S., Seeger, K.,Saunder, D., Sharp, S., Squares, R., Squares, S., Taylor, K., Warren, T., Wietzorrek, A.,Woodward, K., Barrell, B. G., Parkhill, K. and Hopwood, D. A., 2002, Complete genomesequence of the model actinomycete Streptomyces coelicolor A3(2). Nature, 417:141–147.
[5] Boeckmann, B., Bairoch, A., Apweiler, R., Blatter, M. C., Estreicher, A., Gasteiger, E.,Martin, M. J., Michoud, K., O’Donovan, C., Phan, I., Pilbout, S. and Schneider, M., 2003,The SWISS-PROT protein knowledgebase and its supplement TrEMBL in 2003. Nucl.Acids Res., 31:365–370.
[6] Buell, C., Joardar, V., Lindeberg, M., Selengut, J., Paulsen, I., Gwinn, M., Dodson, R.,Deboy, A., R.T.and Durkin, Kolonay, J., Madupu, R., Daugherty, S., Brinkac, L., Beanan,M., Haft, D., Nelson, W., Davidsen, T., Zafar, N., Zhou, L., Liu, J., Yuan, Q., Khouri, H.,Fedorova, N., Tran, B., Russell, D., Berry, K., Utterback, T., Van Aken, S., Feldblyum,T., D’Ascenzo, M., Deng, W., Ramos, A., Alfano, J., Cartinhouri, S., Chatterjee, A.,Delaney, T., Lazarowitz, S., Martin, G., Schneideri, D., Tang, X., Bender, C., White, O.,Fraser, C. and Collmer, A., 2003, The complete genome sequence of the arabidopsis andtomato pathogen Pseudomonas syringae pv. tomatodc3000. Proc. Natl. Acad. Sci. USA,100:10181–10186.
[7] Collmer, A., Badel, J. L., Charkowski, A. O., Deng, W. L., Fouts, D. E., Ramos, A. R.,Rehm, A. H., Anderson, D. M., Schneewind, O., van Dijk, K. and Alfano, J. R., 2000,Pseudomonas syringae Hrp type III secretion system and effector proteins. Proc NatlAcad Sci U.S.A., 97:8770–8777.
[8] Cournoyer, B., Watanabe, S. and Vivian, A., 1998, A tellurite-resistance genetic deter-minant from phytopathogenic Pseudomonads encodes a thiopurine methyltransferase:evidence of a widely-conserved family of methyltransferases. Biochim. Biophys. Acta,1397:161–168.
[9] Eddy, S. R., 1998, Profile hidden markov models. Bioinformatics, 14:755–763.
[10] Felsenstein, J., 1989, Phylip—phylogeny inference package (version 3.2). Cladistics,5:164–166.
[11] Francis, M. S., Wolf-Watz, H. and Forsberg, A., 2002, Regulation of type III secretionsystems. Curr. Opin. Microbiol., 5:166–172.
[12] Fraser, C. M., Gocayne, J. D., White, O., Adams, M. D., Clayton, R. A., Fleishmann,R. D., Bult, C. J., Kerlavage, A. R., Sutton, G., Kelley, J. M., Fritchman, J. L., Weidman,J. F., Small, K. V., Sandusky, M., Fuhrmann, J., Nguyen, D., Utterback, T. R., Saudek,
13
D. M., Phillips, C. A., Merrick, J. M., Tomb, J. F., Dougherty, B. A., Bott, K. F., Hu, P. C.,Lucier, T. S., Petersen, S. N., Smith, H. O., Hutchison, C. A. and Venter, J. C., 1995, Theminimal gene complement of Mycoplasma genitalium. Science, 270:397–403.
[13] Friis, C., Jensen, L. J. and Ussery, D. W., 2000, Visualization of pathogenicity regions inbacteria. Genetica, 108:47–51.
[14] Jensen, L. J., Friis, C. and Ussery, D. W., 1999, Three views of microbial genomes. Res.Microbiol., 150:773–777.
[15] Larsen, T. and Krogh, A., 2003, Easygene - a prokaryotic gene finder that ranks ORFs bystatistical significance. BMC Bioinformatics, 4:21.
[16] Lobry, J. R., 1996, Asymmetric substitution patterns in the two DNA strands of bacteria.Mol. Biol. Evol., 13:660–665.
[17] Madan Babu, M., 2003, Did the loss of sigma factors initiate pseudogene accumulationin M. leprae? Trends Microbiol., 11:59–61.
[18] Martinez-Bueno, M., Tobes, R., Rey, M. and Ramos, J., 2002, Detection of multiple extra-cytoplasmic function (ecf) sigma factors in the genome of Pseudomonas putida KT2440and their counterparts in Pseudomonas aeruginosa PAO1. Environ. Microbiol., 4:842–855.
[19] McLean, M. J., Wolfe, K. H. and Devine, K. M., 1998, Base composition skews, replica-tion orientation, and gene orientation in 12 prokaryote genomes. J. Mol. Evol., 47:691–696.
[20] Missiakas, D. and Raina, S., 1998, The extracytoplasmic function sigma factors: role andregulation. Mol. Microbiol., 28:1059–1066.
[21] Mittenhuber, G., 2002, An inventory of genes encoding RNA polymerase sigma factors in31 completely sequenced eubacterial genomes. J. Mol. Microbiol. Biotechnol., 4:77–91.
[22] Mynbaeva, B. N., Okorokov, L. A., Abdrashitova, S. A. and Ilialetdinov, A. N., 1984,Phosphate and glucose accumulation by Pseudomonas cultures in relation to their arsenicresistance. Mikrobiologiia, 53:822–825.
[23] Nelson, K. E., Weinel, C., Paulsen, I. T., Dodson, R. J., Hilbert, H., Martins dos Santos,V. A., Fouts, D. E., Gill, S. R., Pop, M., Holmes, M., Brinkac, L., Beanan, M., DeBoy,R. T., Daugherty, S., Kolonay, J., Madupu, R., Nelson, W., White, O., Peterson, J., Khouri,H., Hance, I., Chris Lee, P., Holtzapple, E., Scanlan, D., Tran, K., Moazzez, A., Utter-back, T., Rizzo, M., Lee, K., Kosack, D., Moestl, D., Wedler, H., Lauber, J., Stjepandic,D., Hoheisel, J., Straetz, M., Heim, S., Kiewitz, C., Eisen, J., Timmis, K. N., Dusterhoft,A., Tummler, B. and Fraser, C. M., 2002, Complete genome sequence and comparativeanalysis of the metabolically versatile Pseudomonas putida KT2440. Environ. Microbiol.,4:799–808.
[24] Pedersen, A. G., Baldi, P., Chauvin, Y. and Brunak, S., 1998, DNA structure in humanRNA polymerase II promoters. J. Mol. Biol., 281:663–673.
[25] Pedersen, A. G., Jensen, L. J., Stærfeldt, H. H., Brunak, S. and Ussery, D. W., 2000, ADNA structural atlas of E. coli. J. Mol. Biol., 299:907–930.
14
[26] Roine, E., Wei, W., Yuan, J., Nurmiaho-Lassila, E. L., Kalkkinen, N., Romantschuk, M.and He, S. Y., 1997, Hrp pilus: an hrp-dependent bacterial surface appendage produced byPseudomonas syringae pv. tomato DC3000. Proc Natl Acad Sci U.S.A., 94:3459–3464.
[27] Satchwell, S. C., Drew, H. R. and Travers, A. A., 1986, Sequence periodicities in chickennucleosome core DNA. J. Mol. Biol., 191:659–675.
[28] Sicheritz-Ponten, T. and Andersson, S. G., 2001, A phylogenomic approach to microbialevolution. Nucl. Acids Res., 29:545–552.
[29] Skovgaard, M., Jensen, L. J., Friis, C., Stærfeldt, H.-H., Worning, P., Brunak, S. andUssery, D., 2002, The atlas visualisation of genome-wide information. In B. Wren andN. Dorrell (eds.), Methods in Microbiology, volume 33, pp. 49–63. Academic Press, Lon-don, UK.
[30] Stover, C. K., Pham, X. Q., Erwin, A. L., Mizoguchi, S. D., Warrener, P., Hickey, M. J.,Brinkman, F. S., Hufnagle, W. O., Kowalik, D. J., Lagrou, M., Garber, R. L., Goltry,L., Tolentino, E., Westbrock-Wadman, S., Yuan, Y., Brody, L. L., Coulter, S. N., Fol-ger, K. R., Kas, A., Larbig, K., Lim, R., Smith, K., Spencer, D., Wong, G. K., Wu, Z.and Paulsen, I. T., 2000, The complete genome of Pseudomonas aeruginosa PAO1, anopportunistic pathogen. Nature, 406:959–964.
[31] Sugita, M., Sugishita, H., Fujishiro, T., Tsuboi, M., Sugita, C., Endo, T. and Sug-iura, M., 1997, Organization of a large gene cluster encoding ribosomal proteins in thecyanobacterium Synechococcus sp. strain PCC 6301: comparison of gene clusters amongcyanobacteria, eubacteria and chloroplast genomes. Gene, 195:73–79.
[32] Taylor, D. E., 1999, Bacterial tellurite resistance. Trends in Microbiology, 7:111–115.
[33] Thompson, J. D., Higgins, D. G. and Gibson, T. J., 1994, CLUSTAL W: improvingthe sensitivity of progressive multiple sequence alignment through sequence weighting,positions-specific gap penalties and weight matrix choice. Nucl. Acids Res., 22:4673–4680.
[34] Ussery, D. W., Soumpasis, D. M., Brunak, S., Stærfeldt, H. H., Worning, P. and Krogh, A.,2002, Bias of purine stretches in sequenced genomes. Computers in Chemistry, 26:531–541.
[35] Weinel, C., Nelson, K. E. and Tummler, B., 2002, Global features of the Pseudomonasputida KT2440 genome sequence. Environ. Microbiol., 4:809–818.
[36] Weinel, C., Ussery, D., Ohlsson, H., Ponten, T., Kiewitz, C. and Tummler, B., 2002, Com-parative genomics of Pseudomonas aeruginosa PAO1 and KT2440: Orthologs, codonusage, repetitive extragenic palindromic elements, and oligonucleotide motif signatures.Genome Letters, 1:175–187.
[37] Yahr, T. L., Goranson, J. and Frank, D. W., 1996, Exoenzyme S of Pseudomonas aerugi-nosa is secreted by a type III pathway. Mol. Microbiol., 22:991–1003.
15
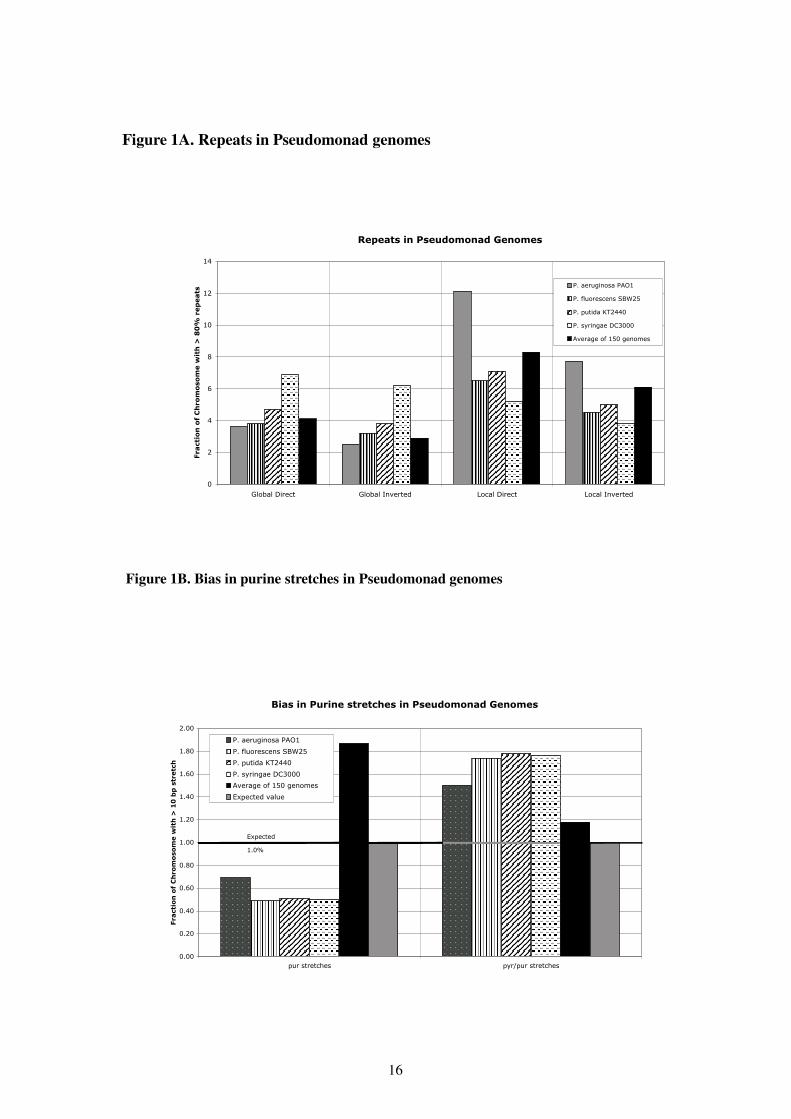
Figure 1A. Repeats in Pseudomonad genomes
Repeats in Pseudomonad Genomes
0
2
4
6
8
10
12
14
Global Direct Global Inverted Local Direct Local Inverted
Fraction of Chromosome with > 80% repeats P. aeruginosa PAO1
P. fluorescens SBW25P. putida KT2440P. syringae DC3000Average of 150 genomes
Figure 1B. Bias in purine stretches in Pseudomonad genomes
Bias in Purine stretches in Pseudomonad Genomes
0.00
0.20
0.40
0.60
0.80
1.00
1.20
1.40
1.60
1.80
2.00
pur stretches pyr/pur stretches
Fraction of Chromosome with > 10 bp stretch
P. aeruginosa PAO1P. fluorescens SBW25P. putida KT2440P. syringae DC3000Average of 150 genomesExpected value
Expected1.0%
16
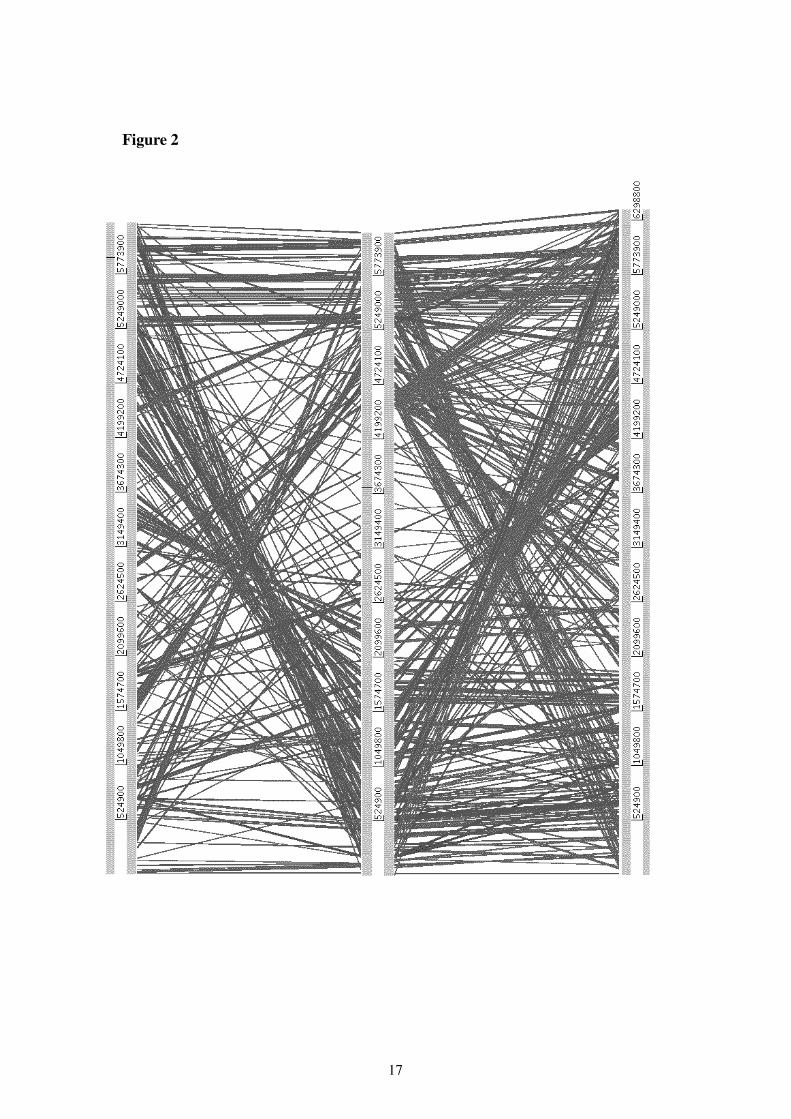
Figure 2
17
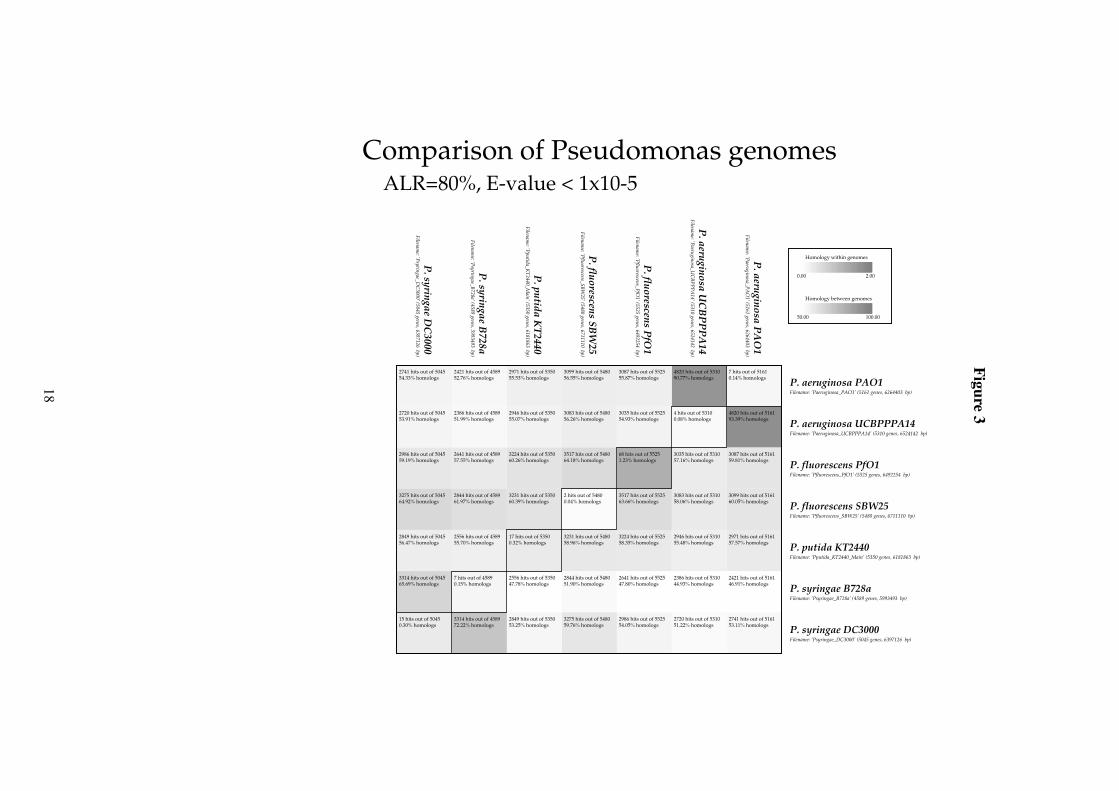
Figure3
Comparison of Pseudomonas genomesALR=80%, E-value < 1x10⁻⁵
P. aeruginosa P
AO
1Filenam
e: ’Paeruginosa_PAO
1’ (5161 genes, 6264403 bp)
P. aeruginosa U
CB
PP
PA
14Filenam
e: ’Paeruginosa_UC
BPPPA14’ (5310 genes, 6524142 bp)
P. fluorescens P
fO1
Filename: ’Pfluorescens_PfO
1’ (5525 genes, 6492254 bp)
P. fluorescens SB
W25
Filename: ’Pfluorescens_SBW
25’ (5480 genes, 6711110 bp)
P. putida K
T2440Filenam
e: ’Pputida_KT2440_M
ain’ (5350 genes, 6181863 bp)
P. syringae B
728aFilenam
e: ’Psyringae_B728a’ (4589 genes, 5993493 bp)
P. syringae D
C3000
Filename: ’Psyringae_D
C3000’ (5045 genes, 6397126 bp)
P. aeruginosa PAO1Filename: ’Paeruginosa_PAO1’ (5161 genes, 6264403 bp)
P. aeruginosa UCBPPPA14Filename: ’Paeruginosa_UCBPPPA14’ (5310 genes, 6524142 bp)
P. fluorescens PfO1Filename: ’Pfluorescens_PfO1’ (5525 genes, 6492254 bp)
P. fluorescens SBW25Filename: ’Pfluorescens_SBW25’ (5480 genes, 6711110 bp)
P. putida KT2440Filename: ’Pputida_KT2440_Main’ (5350 genes, 6181863 bp)
P. syringae B728aFilename: ’Psyringae_B728a’ (4589 genes, 5993493 bp)
P. syringae DC3000Filename: ’Psyringae_DC3000’ (5045 genes, 6397126 bp)
7 hits out of 51610.14% homologs
4820 hits out of 516193.39% homologs
3087 hits out of 516159.81% homologs
3099 hits out of 516160.05% homologs
2971 hits out of 516157.57% homologs
2421 hits out of 516146.91% homologs
2741 hits out of 516153.11% homologs
4820 hits out of 531090.77% homologs
4 hits out of 53100.08% homologs
3035 hits out of 531057.16% homologs
3083 hits out of 531058.06% homologs
2946 hits out of 531055.48% homologs
2386 hits out of 531044.93% homologs
2720 hits out of 531051.22% homologs
3087 hits out of 552555.87% homologs
3035 hits out of 552554.93% homologs
68 hits out of 55251.23% homologs
3517 hits out of 552563.66% homologs
3224 hits out of 552558.35% homologs
2641 hits out of 552547.80% homologs
2986 hits out of 552554.05% homologs
3099 hits out of 548056.55% homologs
3083 hits out of 548056.26% homologs
3517 hits out of 548064.18% homologs
2 hits out of 54800.04% homologs
3231 hits out of 548058.96% homologs
2844 hits out of 548051.90% homologs
3275 hits out of 548059.76% homologs
2971 hits out of 535055.53% homologs
2946 hits out of 535055.07% homologs
3224 hits out of 535060.26% homologs
3231 hits out of 535060.39% homologs
17 hits out of 53500.32% homologs
2556 hits out of 535047.78% homologs
2849 hits out of 535053.25% homologs
2421 hits out of 458952.76% homologs
2386 hits out of 458951.99% homologs
2641 hits out of 458957.55% homologs
2844 hits out of 458961.97% homologs
2556 hits out of 458955.70% homologs
7 hits out of 45890.15% homologs
3314 hits out of 458972.22% homologs
2741 hits out of 504554.33% homologs
2720 hits out of 504553.91% homologs
2986 hits out of 504559.19% homologs
3275 hits out of 504564.92% homologs
2849 hits out of 504556.47% homologs
3314 hits out of 504565.69% homologs
15 hits out of 50450.30% homologs
Homology within genomes
0.00 2.00
Homology between genomes
50.00 100.00
18
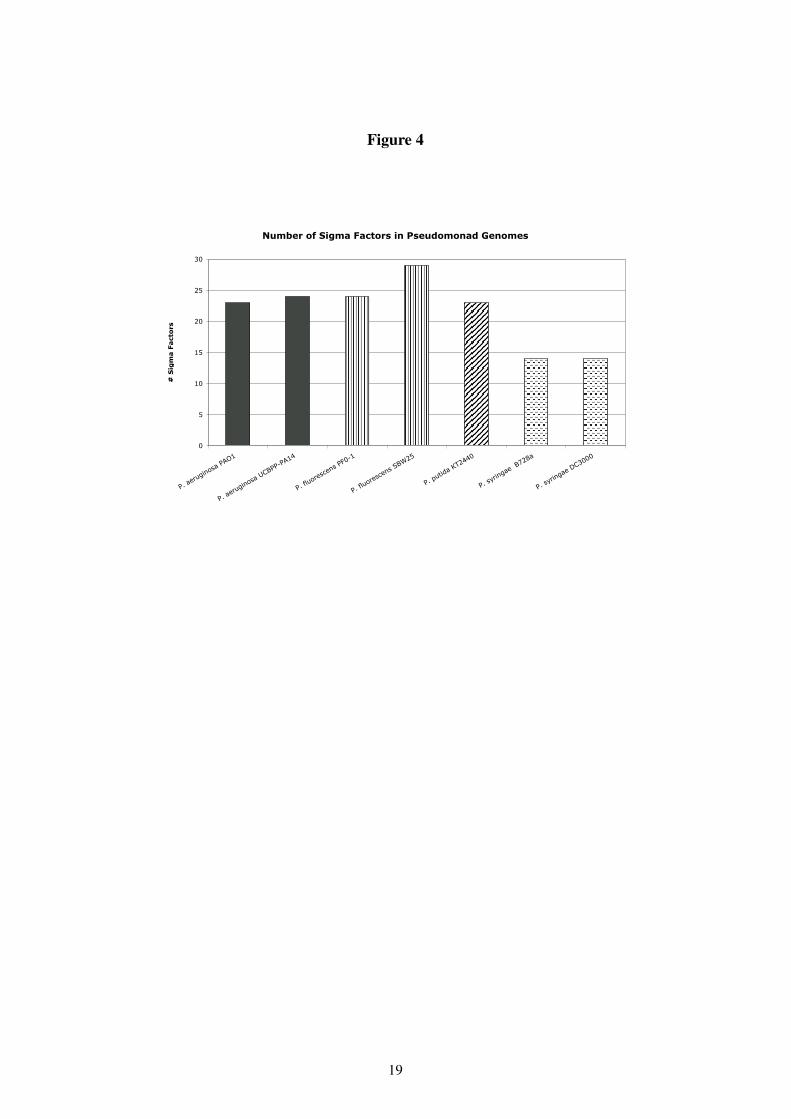
Figure 4
Number of Sigma Factors in Pseudomonad Genomes
0
5
10
15
20
25
30
P. aeruginosa PAO1
P. aeruginosa UCBPP-PA14
P. fluorescens PF0-1
P. fluorescens SBW25
P. putida KT2440
P. syringae B728a
P. syringae DC3000
# Sigma Factors
19
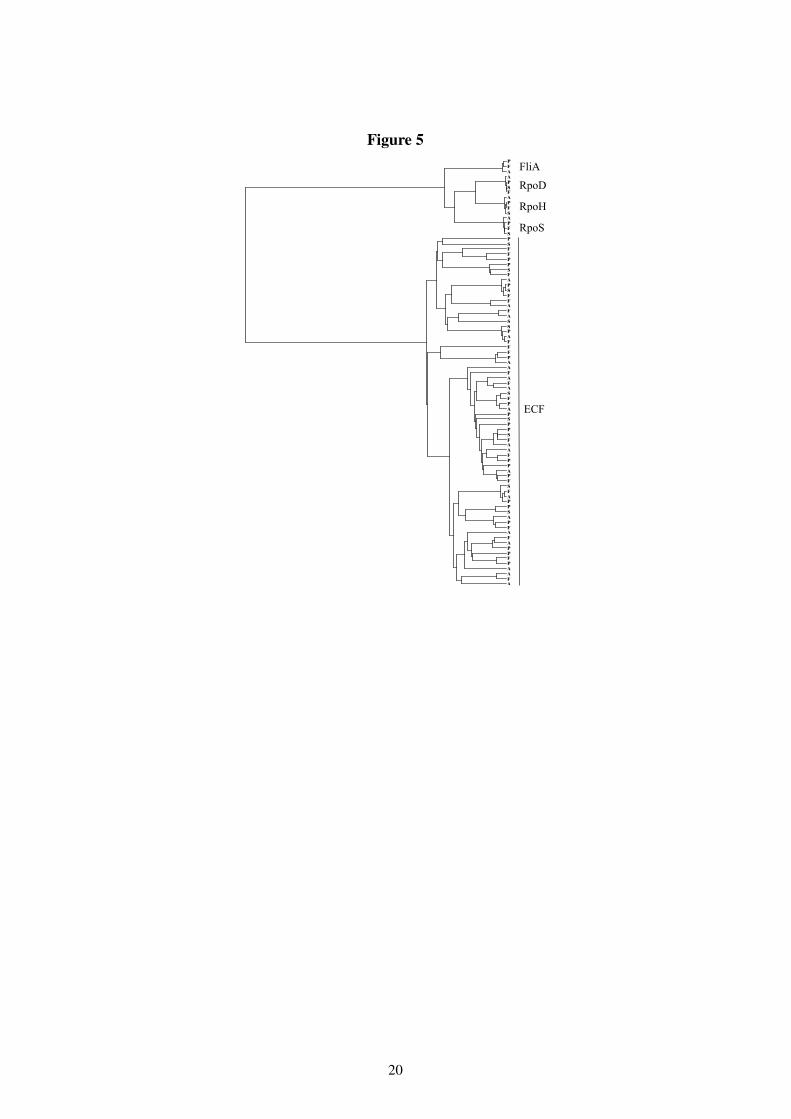
Figure 5
20
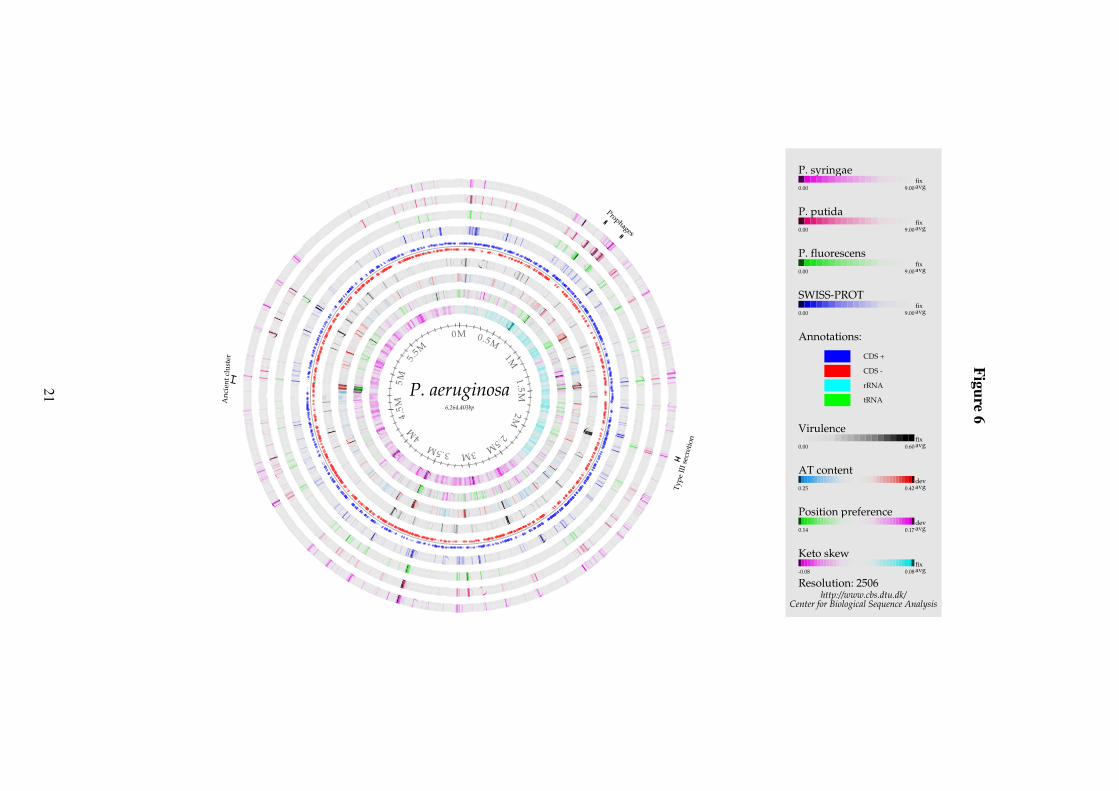
Figure6
ProphagesA
ncie
nt c
lust
er
Type
III s
ecre
tion
0M 0 .5M
1M1.5M
2M2.5M
3M3.5M4M
4.5M
5M5 .
5M
Center for Biological Sequence Analysishttp://www.cbs.dtu.dk/
P. syringaefixavg0.00 9.00
P. putidafixavg0.00 9.00
P. fluorescensfixavg0.00 9.00
SWISS-PROTfixavg0.00 9.00
Annotations:
CDS +
CDS -
rRNA
tRNA
Virulencefixavg0.00 0.60
AT contentdevavg0.25 0.42
Position preferencedevavg0.14 0.17
Keto skewfixavg-0.08 0.08
Resolution: 2506
P. aeruginosa6,264,403bp
21
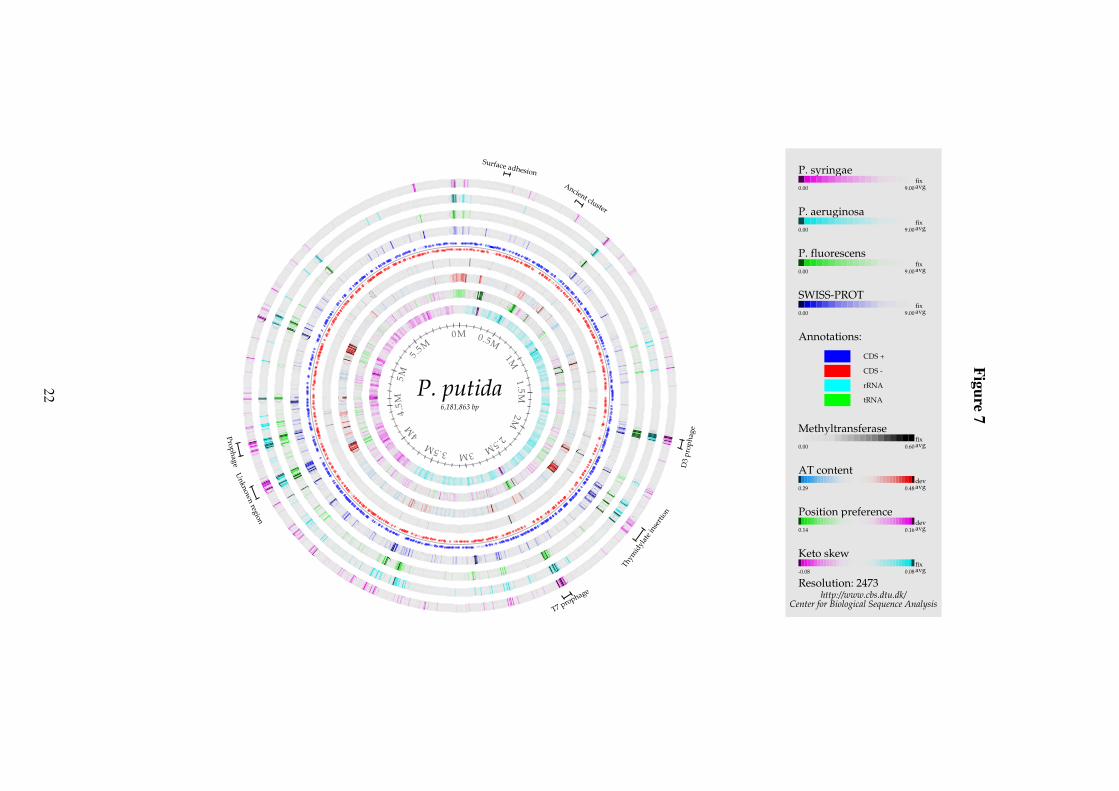
Figure7
Surface adhesion
Ancient cluster
D3
prop
hage
Thym
idyl
ate i
nser
tion
T7 prophage
Unknow
n region
Prophage
0M 0 .5M
1M1.5M
2M2.5M
3M3.5M
4M4.
5M5M
5 .5M
Center for Biological Sequence Analysishttp://www.cbs.dtu.dk/
P. syringaefixavg0.00 9.00
P. aeruginosafixavg0.00 9.00
P. fluorescensfixavg0.00 9.00
SWISS-PROTfixavg0.00 9.00
Annotations:
CDS +
CDS -
rRNA
tRNA
Methyltransferasefixavg0.00 0.60
AT contentdevavg0.29 0.48
Position preferencedevavg0.14 0.16
Keto skewfixavg-0.08 0.08
Resolution: 2473
P. putida6,181,863 bp
22
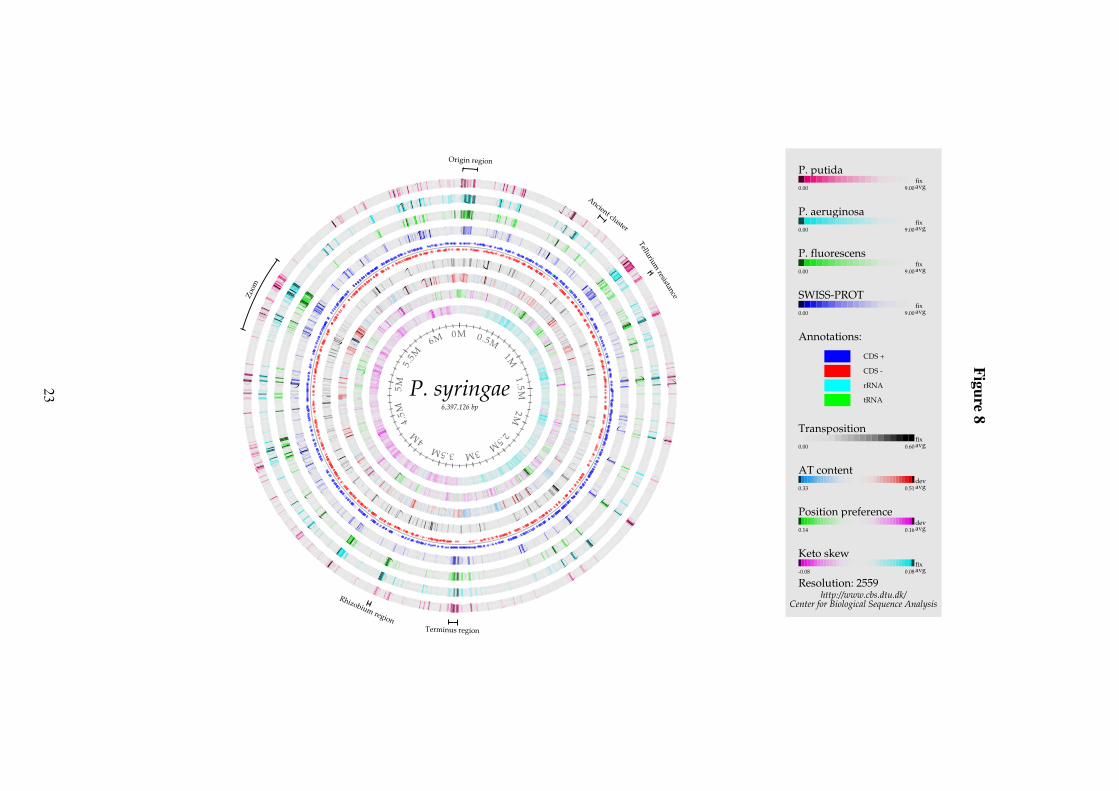
Figure8
Origin region
Ancient cluster
Tellurium resistance
Terminus region
Rhizobium region
Zoom
0M 0 .5M
1M1.5M
2M2.5M
3M3.5M4M
4.5M
5M5 .
5M
6M
Center for Biological Sequence Analysishttp://www.cbs.dtu.dk/
P. putidafixavg0.00 9.00
P. aeruginosafixavg0.00 9.00
P. fluorescensfixavg0.00 9.00
SWISS-PROTfixavg0.00 9.00
Annotations:
CDS +
CDS -
rRNA
tRNA
Transpositionfixavg0.00 0.60
AT contentdevavg0.33 0.51
Position preferencedevavg0.14 0.16
Keto skewfixavg-0.08 0.08
Resolution: 2559
P. syringae6,397,126 bp
23
6.1 Figure 9
F)
cfa6 >
E)
D)
C)
B)
A)
Coronafa
cic ac
id sy
nthas
es
5.1M 5.2M 5.3M 5.4M
Center for Biological Sequence Analysishttp://www.cbs.dtu.dk/
A) BLASTP: P. putidafixavg
0.00 9.00
B) BLASTP: P. aeruginosafixavg
0.00 9.00
C) BLASTP: P. fluorescensfixavg
0.00 9.00
D) BLASTP: SWISS-PROTfixavg
0.00 9.00
E) Annotations:
CDS +
CDS -
F) Keyword: Transpositionfixavg
0.00 0.60
Resolution: 140
Range:5100000
..5450000
P. syringae6,397,126 bp
24