Embed Size (px)
Citation preview
Comparing Data Characteristics and Results of anOnline Factorial Survey between a Population-Based anda Crowdsource-Recruited SampleJill D. Weinberga,b, Jeremy Freesea, David McElhattanaa) Northwestern University; b) American Bar Foundation
Abstract: Compared to older kinds of sample surveys, online platforms provide a fast and low-cost platform for factorialsurveys, as well as a more demographically diverse alternative to student samples. Two distinct strategies have emergedfor recruitment: using panels based on population-based samples versus recruiting people actively seeking to completeonline tasks for money. The latter is much cheaper but prompts various concerns about data quality and generalizability.We compare results of three vignette experiments conducted using the leading online panel that uses a population-basedparadigm (Knowledge Networks, now GfK) and the leading platform for crowdsource recruitment (Amazon MechanicalTurk). Our data show that, while demographic differences exist, most notably in age, the actual results of our experimentsare very similar, especially once these demographic differences have been taken into account. Indicators of data qualitywere actually slightly better among the crowdsource subjects. Although more evidence is plainly needed, our resultssupport the accumulating evidence for the promise of crowdsource recruitment for online experiments, including factorialsurveys.
Keywords: factorial survey; Amazon Mechanical Turk; crowdsource, vignette experiment; online experiment; knowledgenetworksEditor(s): Jesper Sørensen, Delia Baldassarri; Received: April 23, 2014; Accepted: May 22, 2014; Published: August 4, 2014
Citation: Weinberg, Jill D., Jeremy Freese, and David McElhattan 2014. “Comparing Data Characteristics and Results of an Online Factorial Surveybetween a Population-Based and a Crowdsource-Recruited Sample.” Sociological Science 1: 292-310. DOI: 10.15195/v1.a19
Copyright: c© 2014 Weinberg, Freese, and McElhattan. This open-access article has been published and distributed under a Creative CommonsAttribution License, which allows unrestricted use, distribution and reproduction, in any form, as long as the original author and source have beencredited.cb
Factorial surveys, a method devised by PeterRossi, are an effective tool to study attitudes,
opinions, and normative judgments because theycombine the internal validity that random assign-ment affords to experiments with the externalvalidity that population sampling affords (e.g.,Rossi 1979; Rossi and Berk, 1982; Rossi and Nock1992; Mutz 2011). For many years, factoral sur-veys on larger, more diverse populations wereunderutilized because they were time-consumingand expensive to field. Online survey platformshave been a boon in this respect. Even thoughonline survey platforms based on population sam-pling have very low cumulative response rates,comparisons to stronger benchmarks have so farbeen promising (Baker et al. 2010). Yet evenwhile online panels are much cheaper and permitmore flexible access to population-based samples
than telephone or face-to-face surveys, the costis still high enough to limit their use.
More recently, a different approach to onlineexperiments has arisen in which subjects are re-cruited from “crowdsource” labor sites where indi-viduals seek to complete small tasks in exchangefor compensation. Anyone with Internet accesscan sign up, and, in practice, these platformsprovide a much more diverse sample in termsof self-reported demographic characteristics thantraditional undergraduate subject pools. Prevail-ing wage rates on these sites are so low as to makethem far cheaper than population-based onlinesurveys—indeed, often even cheaper than experi-ments using undergraduates (Horton, Rand, andZeckhauser 2011).
Crowdsource platforms provide new challengesto the conventional rationale for population-based
sociological science | www.sociologicalscience.com 292 August 2014 | Volume 1
Weinberg, Freese, and McElhattan Comparing Data Characteristics
experiments. A diverse sample is not the sameas a representative sample, especially from theperspective of the typical focus of survey researchon estimating population parameters. For thatmatter, a convenience sample that represents apopulation in terms of observed characteristicsmay be nonrepresentative in other ways that com-promise the generalizability of experimental re-sults. Among other concerns, considering howcheaply crowdsource platform participants willwork, there is reason to wonder whether they are“weird” subjects who act atypically in experiments.Initial results in this respect have been auspicious(Berinsky, Huber, and Lenz 2012; Horton, Rand,and Zeckhauser 2011; Mullinix, Druckman, andFreese n.d.), but the research involves stimulithat are shorter and tasks that focus much lesson interpretation than is characteristic of manysociology experiments.
In this study, we compare results from threevignette-style factorial surveys conducted in par-allel, using leading population-based and crowd-source survey platforms. The population-basedexperiments were conducted using the web panelrecruited by Knowledge Networks (hereafter KN;the company is now known as GfK Custom re-search).1 The crowdsource-based experimentswere conducted using Amazon Mechanical Turk(hereafter MT), the dominant crowdsource siteand platform analyzed in previous studies (e.g.,Berinsky, Huber, and Lenz 2010; Buhrmester,Kwang, and Gosling 2011; Chandler, Mueller,and Paolacci 2014; Iperiotis 2010; Shapiro, Chan-dler and Mueller 2013; Mullinix, Druckman, andFreese n.d.).
If crowdsource platforms yield little differencein demographic representation and data qual-ity from population-based Internet panel exper-iments, the justification for the additional ex-pense of population-based Internet panels for fac-torial surveys is weakened. If differences existbut are accounted for by demographic differencesbetween the samples, then the justification forpopulation-based Internet panels for factorial sur-veys may also be considered weaker because thesedifferences could in principle be accounted for byreweighting. The strongest case for the extra ex-
1We refer to it as KN here both because it is accuratein terms of our time of fielding and because, despite thebrand change, KN still seems more widely recognized asthe name of the platform.
pense of population-based Internet panels wouldbe either if the data quality is superior to that ofa crowdsource sample or if there are divergent re-sults that cannot be accounted for by observablevariables.
We consider four questions. First, do the twosamples differ in terms of basic sociodemographiccharacteristics? Second, do they differ in termsof data quality? Third, do they differ in termsof the outcome variables from the experiments,and, if so, can any differences be accounted forby socioeconomic differences in the samples? Fi-nally, do the actual findings from the experimentsdiffer between the two samples, and, if there aredifferences, can these be explained by differencesin observed characteristics? Our findings over-all are quite congenial to crowdsource samplingfor experimental research, although, of course, abroader evidence base is needed before strongerconclusions can be drawn.
Background
The unique leverage of random assignment to testcausal hypotheses is broadly appreciated (e.g.,Shadish, Cook, and Campbell 2002). Neverthe-less, experiments are often considered hopelesslyartificial compared to actual situations of behav-ior and choice (e.g., Webster and Sell 2007:51).Behavioral science experiments also often rely en-tirely upon undergraduate subjects (Sears 1986).The rhetorical disadvantage of findings based ex-clusively on responses from college students inpresenting results to non-experimentalist audi-ences is considerable, especially regarding theissues relevant to social policy for which sociolo-gists often turn to experimentation.
Population-based survey experiments combinethe strong internal validity of random assign-ment with the external validity afforded fromthe greater population representativeness thatsurveys can attain (e.g., Mutz 2011). For soci-ologists, vignette studies have been particularlyappealing because they allow responses to con-crete, if hypothetical, cases while having the samestandardization advantages as surveys (e.g., Rossiand Nock 1982). Vignette experiments presentrespondents with a short scenario in which cer-tain aspects vary randomly. For example, in one
sociological science | www.sociologicalscience.com 293 August 2014 | Volume 1
Weinberg, Freese, and McElhattan Comparing Data Characteristics
of our studies, we present respondents a scenarioof sexualized behavior in the workplace and askquestions concerning whether the scenario con-stitutes sexual harassment. Different vignettesvary randomly both the gender of the perpetra-tor and the victim. While not field experiments,vignettes compare favorably in terms of realismto standard survey items, and, to the extent thepurpose of the study is less obvious, reduce po-tential problems from social desirability biases(Sniderman and Piazza 2002).
Vignette-based studies have been particularlyhelped by the rise of online surveys, because vi-gnettes are a poor fit for telephone surveys, unlesskept extremely short. Meanwhile, printed vi-gnettes, whether used in person or via mail, canintroduce issues with tracking randomizations;they also often use only a limited number of allthe vignettes that would be possible if conditionswere assigned independently, which can intro-duce confounding across conditions (Atzmüllerand Steiner 2010). Conducting vignette exper-iments online does amplify the potential prob-lem of respondents possibly not reading vignettescarefully enough. Among other techniques, re-searchers routinely embed “comprehension checks”in surveys that directly test respondents aboutthe content of material they previously read or“catch trials” that ask questions for which theanswer given by an attentive reader is differentfrom what might be provided by someone whois skimming (Downs et al. 2010; Paolacci et al.2010).
Vignette studies can be conducted an orderof magnitude more cheaply using a population-based Internet survey platform than through amajor face-to-face survey like the General SocialSurvey (GSS). Researchers also receive data farmore quickly, going from items to data in a mat-ter of weeks, as opposed to the two or more yearsbetween developing questions and receiving datafrom GSS. In turn, crowdsource recruitment re-duces costs by yet another order of magnitude,and one receives data in days (or hours) insteadof weeks. However, while the resulting subjectsare more diverse than a study of undergraduates,the crowdsource platform makes no pretense ofoffering researchers a representative sample.
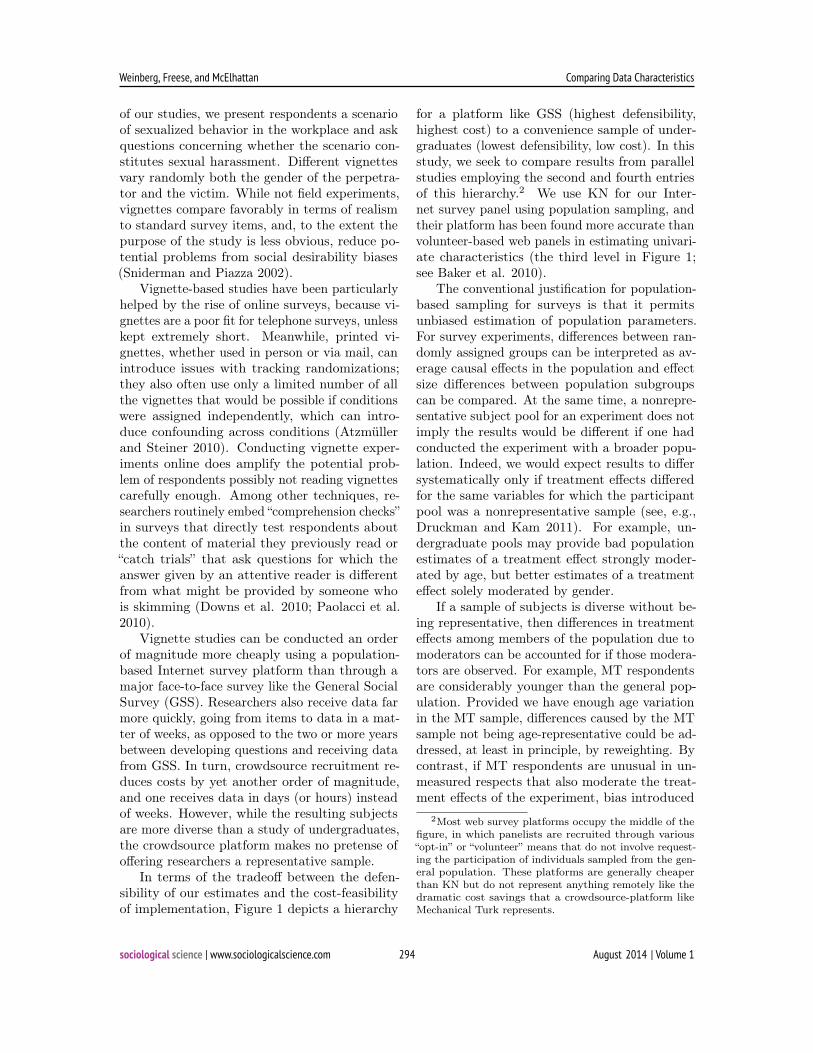
In terms of the tradeoff between the defen-sibility of our estimates and the cost-feasibilityof implementation, Figure 1 depicts a hierarchy
for a platform like GSS (highest defensibility,highest cost) to a convenience sample of under-graduates (lowest defensibility, low cost). In thisstudy, we seek to compare results from parallelstudies employing the second and fourth entriesof this hierarchy.2 We use KN for our Inter-net survey panel using population sampling, andtheir platform has been found more accurate thanvolunteer-based web panels in estimating univari-ate characteristics (the third level in Figure 1;see Baker et al. 2010).
The conventional justification for population-based sampling for surveys is that it permitsunbiased estimation of population parameters.For survey experiments, differences between ran-domly assigned groups can be interpreted as av-erage causal effects in the population and effectsize differences between population subgroupscan be compared. At the same time, a nonrepre-sentative subject pool for an experiment does notimply the results would be different if one hadconducted the experiment with a broader popu-lation. Indeed, we would expect results to differsystematically only if treatment effects differedfor the same variables for which the participantpool was a nonrepresentative sample (see, e.g.,Druckman and Kam 2011). For example, un-dergraduate pools may provide bad populationestimates of a treatment effect strongly moder-ated by age, but better estimates of a treatmenteffect solely moderated by gender.
If a sample of subjects is diverse without be-ing representative, then differences in treatmenteffects among members of the population due tomoderators can be accounted for if those modera-tors are observed. For example, MT respondentsare considerably younger than the general pop-ulation. Provided we have enough age variationin the MT sample, differences caused by the MTsample not being age-representative could be ad-dressed, at least in principle, by reweighting. Bycontrast, if MT respondents are unusual in un-measured respects that also moderate the treat-ment effects of the experiment, bias introduced
2Most web survey platforms occupy the middle of thefigure, in which panelists are recruited through various“opt-in” or “volunteer” means that do not involve request-ing the participation of individuals sampled from the gen-eral population. These platforms are generally cheaperthan KN but do not represent anything remotely like thedramatic cost savings that a crowdsource-platform likeMechanical Turk represents.
sociological science | www.sociologicalscience.com 294 August 2014 | Volume 1
Weinberg, Freese, and McElhattan Comparing Data CharacteristicsFigure 1. Hierarchy for Survey Platform by Cost and Generalizability
Figure 1: Hierarchy for Survey Platform by Cost and Generalizability
in population estimates cannot be addressed byreweighting.
The key question is whether our data providereason to suppose that differences between MTresults and KN results are large enough to justifythe extra expense of the KN sample. We do notaddress the separate but important question ofhow accurately KN results themselves estimatetrue population parameters, about which we wishthere were more evidence (see Baker et al. 2010).Using KN as the basis of comparison reflects thepragmatic reality of the budget possibilities formost factorial survey projects; this should notbe mistaken for any claim that KN represents a“gold standard.”
Regarding MT, Berinsky, Huber, and Lenz(2012) have conducted the most comprehensiveexamination of the comparative properties of MTdata to date and report that “the [MT] sampledoes not perfectly match the demographic andattitudinal characteristics of the U.S. population,but does not present a wildly distorted view ofthe U.S. population either” (for similar asser-tions, see Buhrmester, Kwang, and Gosling 2011;Chandler, Mueller, and Paolacci 2014; Ipeirotis2010; Mason and Suri 2012; Paolacci, Chandler,and Ipeirotis 2010). Specifically, they find theirMT sample is more female and better educatedthan the US population. MT respondents alsoreport lower incomes and are less likely to be
black, married, or homeowners. The most pro-nounced demographic difference is in terms ofage, with MT respondents being younger. On at-titudinal measures, the MT sample leans towardDemocratic Party affiliation and is more politi-cally interested than respondents in a nationallyrepresentative sample.
MT samples have been shown to vary basedon the complexity of the task (Kazai, Kamps, andMilic-Frayling 2012), the time of day the samplingoccurred (Komarov, Reinecke, and Gajos 2013)and on whether or not workers mention the taskon discussion boards (Chandler, Mueller, andPaolacci 2014). Some evidence suggests that therepresentation of men among the MT pool may beincreasing (Mullinix, Druckman, and Freese n.d.).Researchers can use screening questions to quota-sample MT subjects (Chandler, Mueller, andPaolacci 2014), but asking screening questionsitself requires paying participants, so this willsubstantially increase data collection costs. Re-searchers can also advertise for workers that fulfillspecific characteristics (e.g,. politically conser-vative Christians), but abundant concerns havebeen raised that many workers may lie in orderto earn money by participating.
For the simple item-wording and framing ex-periments they consider, Berinsky, Huber, andLenz (2012) found similar results comparing MTto nationally representative samples. These ex-
sociological science | www.sociologicalscience.com 295 August 2014 | Volume 1
Weinberg, Freese, and McElhattan Comparing Data Characteristics
periments involved simpler stimuli and, for themost part, very robust effects. While encour-aging, this leaves open the question of whetherrandomized vignette studies would yield a sim-ilarly promising comparison. Compared to thestudies in Berinsky, Huber, and Lenz (2012), vi-gnette experiments demand more engaged read-ing, focus on more complex interpretations ofstimuli, and also involve multiple independentconditions manipulated within a single vignette.For that matter, sociologists are often motivatedto use vignette experiments and other factorialsurveys specifically because of hypotheses aboutmoderators, for which we might expect the im-plications of nonrepresentative sampling to bestrongest. In broad terms, then, the publishedbase of comparisons between MT and other sam-ples is encouraging but largely excludes the sortof experiments in which nonrepresentative sam-ples cause sociologists and other social policyresearchers particular concern.
Several threats to validity in crowdsource ex-periments merit discussion. First, while issuesof respondent identity can be raised for any on-line study (Reips 2000), MT investigators areexplicitly prohibited (by Amazon) from obtain-ing identifying information of subjects (Berinsky,Huber, and Lenz 2012; Horton, Rand, and Zeck-hauser 2011; Mason and Suri 2012). Differentindividuals can share the same account, completedifferent sections of a survey, work together ontasks, or provide false demographic information.Although Amazon provides no check on whatMT workers report to researchers, MT workers’self-reported demographics are, for the most part,consistent across studies (Mason and Suri 2012),with 81 to 98 percent agreement on a range ofcharacteristics (Rand 2012).
Second, existing work has evaluated data qual-ity, which includes comprehension and dropoutrates (Berinsky, Huber, and Lenz 2012; Buhr-mester, et al. 2011; Paolacci et al. 2010; Reips2000). Payments to MT workers must be ap-proved by requesters, and workers can be ex-cluded from jobs if contractors give them lowscores. Paolacci et al. (2010) tested comprehen-sion across participants in MT, a traditional labsetting, and an online forum. They found nosignificant differences in attentiveness among thethree settings although Turkers scored the bestwith respect to catch trials.
Third, one might worry about possible sub-ject interaction about the experiment, which haslong been a concern in undergraduate experi-ments that involve deception (Horton, Rand, andZeckhauser 2011). Online discussion boards al-low MT workers to discuss the content of tasks,but actual mentions of experimental treatmentsare relatively infrequent, and researchers can eas-ily monitor the forums (Mason and Suri 2012;Reips 2000). Chandler (2011) finds that only28 percent of workers follow forums and blogsabout MT, and 13 percent of users reported see-ing the content of experiments discussed in thesesettings. Given this evidence and the relativelynon-provocative character of vignettes, we do notview this as a likely source of concern for ourstudy but note that researchers have suggestedways this possibility may be further addressed(Chandler, Mueller, and Paolacci 2014).
Finally, MT participants need to be approach-ed as de facto “professional respondents.” MTsamples contain many individuals who have donehundreds of other MT studies (Chandler, Muellerand Paolacci 2014). Studies that use standard-ized knowledge questions or provide performancetasks with a learning curve should not be con-ducted with the premise of naive subjects. Vi-gnette studies are potentially a good fit for MTin this respect, as they do not involve deception,knowledge questions, or any specific presupposi-tion that subjects have not participated in manysurveys before. Even so, the notion of “profes-sional respondents” may raise concerns about howunusual the people who select into these studiesare and how this may affect generalizability ofresults. With KN, even though relatively few ofthe sampled persons agree to participate in thepanel, assenting to a personalized request maystill be a far less selective behavior than seekingout opportunities to do surveys online for money.
DataData come from three vignette experiments aboutemployment discrimination fielded as one instru-ment on both KN and MT. By agreement withKN, we were able to use their platform to admin-ister the survey to subjects recruited via MT. Inother words, the screen presentation and otherinterface aspects of the study were exactly the
sociological science | www.sociologicalscience.com 296 August 2014 | Volume 1
Weinberg, Freese, and McElhattan Comparing Data Characteristics
same across the two panels, so such differencescannot account for any observed differences inresults between the two recruited populations.
The experiments are all between-subjects,mixed-factorial designs intended to examine howordinary people define employment discrimina-tion.3 They concerned race discrimination, sexualharassment, and reasonable accommodation. Weare writing separate substantive papers on eachof the experiments, in which we describe the hy-potheses in more detail and give more elaborateconsideration of the results. For the purposesof this article, we focus on comparing the paral-lel fieldings of the instrument on KN and MT,and we describe the experiments only briefly andonly when germane to the specific purpose of thisstudy. We do note, however, that part of the mo-tivation of the experiments is that these vignetteshave also been fielded on a sample of state andfederal trial judges. Thus, the question of tryingto estimate accurately the average treatment ef-fect for the population in these experiments is ofparticular interest for our purposes because doingso will provide the baseline for our comparisonto the estimated treatment effect for our judgesample.
In the race discrimination experiment, we de-scribe a situation in which an employee asks for apay raise and is denied, but an employee with sim-ilar qualifications and of different race receivesa raise. We varied the employees’ races, theworkplace environment, employee tenure, andemployee performance. In the sexual harassmentexperiment, we describe an employee who has anencounter with another employee and the allegedvictim quits shortly afterwards. We vary thegender of the perpetrator and victim, the orga-nizational status of the perpetrator, the conductin question, and company policies about sexualharassment. Finally, in the reasonable accommo-dation experiment, we describe a full-time, female
3In total, respondents received eight vignettes present-ing various workplace disputes. The vignettes featureddifferent company descriptions to avoid learning and ex-haustion effects (Auspurg, Hinz and Liebig 2009). Vi-gnettes for the three experiments were interspersed sothat consecutive vignettes were parts of different exper-iments. Within each vignette, vignette conditions wereassigned fully independently of one another, so that allpossible vignettes had an equal probability of administra-tion. Assignments to each condition were also balancedwithin persons, to maximize the diversity of conditionspresented across vignettes to each respondent.
employee who seeks a workplace accommodationand is denied. We vary the job of the employee,employee identity, and the cost of the accommo-dation request. After each vignette, respondentswere asked several related questions about the sce-nario, which we describe briefly later. Table A1in the online supplement presents a more detaileddescription of the experimental conditions.
Platform SelectionWe selected market leaders among Internet-basedplatforms that use population-based or crowd-source recruitment samples: Knowledge Networks(KN) and Amazon Mechanical Turk (MT), respec-tively. KN has been central among Internet-basedplatforms and was the first to use a population-based approach. Virtually all of the Internet-based examples in Mutz’s (2011) Population-Based Survey Experiments use KN data. MT hasemerged as the dominant crowdsource recruit-ment platform for researchers. It is cost effectiveand fielding data is extremely fast—taking a fewhours to recruit more than 1000 respondents.
Population-Based Sample(Knowledge Networks, nowGfK Custom Research)KN, now GfK, maintains a panel of 40,000 U.S.households for its surveys. KN has switchedfrom using random-digit dialing for recruitmentto address-based methods for better handlingcell phoneonly households. The panel at thetime of our study comprised individuals recruitedthrough both frames. KN provides sampled re-spondents who do not have a computer or Inter-net access at the time of recruitment in whichcase KN provided these as part of their participa-tion. KN estimates that their sampling methodsprovide 97 percent coverage, meaning that 97percent of the intended population falls withinthe contact methods of recruitment.
From this panel, KN draws a subsample basedon a client’s specifications for a particular study.Responses to one’s study are then combined withinformation from a core profile completed by pan-elists earlier, along with items from other previ-ously administered profile surveys that can beadded for a surcharge. About 16 percent of those
sociological science | www.sociologicalscience.com 297 August 2014 | Volume 1
Weinberg, Freese, and McElhattan Comparing Data Characteristics
originally sampled by KN panel were successfullyrecruited to the panel, and of those, 64.0 per-cent had completed the core demographic datanecessary to be eligible for our study.
For our study, KN selected 4,990 people fromits panel. All were non-institutionalized U.S. cit-izens over the age of 18. Selected individualsreceive an e-mail notifying them of a new surveyavailable for them to take, including a link to thesurvey questionnaire. After three days, a seconde-mail reminder is sent out to all nonrespondents.While the field period for KN studies varies, ourswas five days.
In our factorial survey, 2,665 members were“screened”—that is, of those sampled, 58.3 percentclicked on the link to proceed with the survey.After reading the informed consent prompt, 2,222members consented to participate. Ultimately,we received 2,087 completed interviews from theweb-enabled panel, implying a 93.9 percent com-pletion rate for those who started the survey, anda 54.7 percent completion rate for those asked toparticipate.
While none of the aforementioned rates areunusual for contemporary survey research of thistype, the combination (.160 x .640 x .583 x .939)indicates a cumulative response rate of 5.6 per-cent. This figure is not at all low by contempo-rary polling standards but certainly is for peoplewhose reference point might be the General SocialSurvey or American National Election Studies.4Again, KN has had positive descriptive results at-tributed to its use of population sampling (Bakeret al. 2010), and KN sampling has a more plau-sible case for better representing the populationthan MT, if estimates differ. Nevertheless, assaid earlier, one should not confuse this advan-tage with KN results being a gold standard ofpopulation description. Also, within sociology,many studies using KN present only the com-pletion rate (e.g., Phelan, Link, and Feldman2013; Regnerus 2012); readers should be aware
4Low response rates are the way of the world in con-temporary survey research for work that can be done byindividual investigators. Even large-scale, highresponseplatforms are experiencing a steadily declining responserate (e.g., the ANES 2012 response rate was 49 percent).If a high response rate such as GSS’ is the only credibleway to field surveys, few researchers would have the bud-get to do credible research and even more studies wouldbe disallowed from being “good”
that this figure is not a response rate in anypopulation-based sense.
For most investigators wanting to conducttheir own factorial surveys, KN likely representsthe upper tier of available funding. Adding fac-torial surveys of comparable length to those re-ported here to a flagship national study wouldrequire considerably more investment, if it werelogistically possible at all. Overall pricing of a KNstudy is based on sample size, number of profilevariables, time to complete the survey, and pro-gramming complexity. Our survey took about 15minutes to complete, and KN pricing included aninitial pretest of 25 respondents and the additionof two more profile variables to their standarddata delivery. The total cost was roughly $50,000.
Crowdsource sample(Mechanical Turk)Amazon.com (2014) reports 500,000 MT workeraccounts. In 2011, we advertised the survey onAmazon as taking about one hour and paid re-spondents $3 for participation. This sum is actu-ally relatively high by MT standards; the medianhourly wage for MT tasks has been estimated at$1.38 (Horton and Chilton 2010; also Paolacciet al. 2010). We restricted the survey to MTworkers classified as 18 or older and living in theUnited States. We also excluded individuals withapproval ratings below 95 percent on previoustasks (which MT calls Human Intelligence Tasksor HITs). We posted our HIT to be available forseven days or until we reached our desired numberof respondents to complete the task. We obtainedour desired number of respondents in less thanfour days. We recruited 1,349 participants.
We called the HIT “Assessing Workplace Dis-putes” and described the task as completing anonline survey. While the description was vague,we provided keywords to describe the HIT aswebsite, survey, and workplace disputes. Whenworkers opened our HIT, we instructed them toclick on the survey URL link, which directed themto the same platform used for the KN study. Wealso instructed workers that, at the end of thesurvey, they would receive a code. To be paid,they had to enter this code on the MT webpage.
Amazon MT collects a 10 percent commissionon top of the amount the requester pays subjectsto complete the HIT. Overall, we paid $4,500,
sociological science | www.sociologicalscience.com 298 August 2014 | Volume 1
Weinberg, Freese, and McElhattan Comparing Data Characteristics
roughly 10 percent of the cost to run the samesurvey using KN.
Results
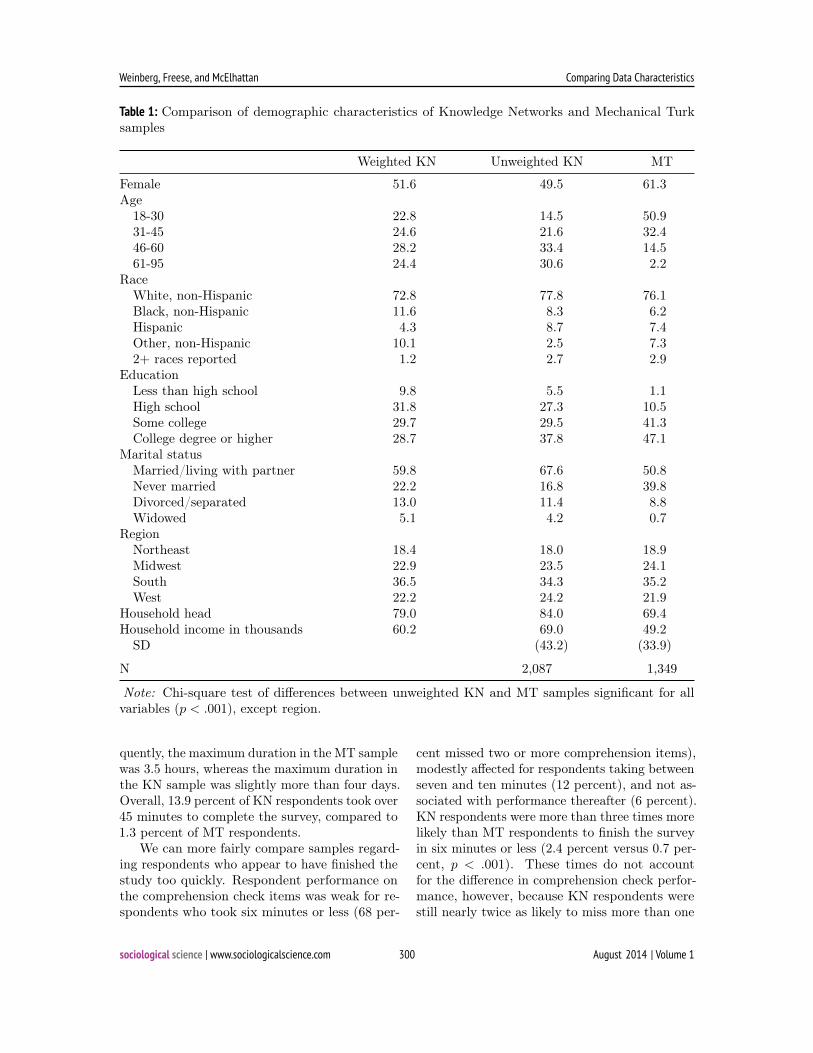
Demographic characteristics ofparticipantsTable 1 shows demographic characteristics of par-ticipants in each population. Both weighted andunweighted descriptive statistics for KN are pre-sented. KN weights include post-stratificationadjustments based on the Current PopulationSurvey for the corresponding period. Includedamong the variables used for this weighting aregender, age, race/ethnicity, education, and region,so the weighted KN numbers for these variablespresumably directly reflect population distribu-tions.5
Overall, our MT and unweighted KN sam-ples differ significantly from one another on allvariables except for region. Consistent with priorfindings, our MT respondents were younger, moreeducated, and more likely to be female than theirKN counterparts. Only 16.7 percent of MT re-spondents were over 45 years old, compared to64.0 percent of the KN sample. As can be seenby looking at the weighted MT results (based onthe Current Population Survey), the differencesin age distribution between the MT and the un-weighted KN samples reflect both an overrepre-sentation of younger people in the MT sampleand an overrepresentation of older adults in theKN sample. Overrepresentation of older adults inpopulation-based surveys is historically common(Tuckel and O’Neill 1995).
Regarding other characteristics, two thirds ofthe KN sample had at least some college (29.5percent some college; 37.8 percent college degreeor higher), whereas nearly 90 percent of MT par-ticipants had at least some (41.3 percent somecollege; 47.1 percent college degree or higher).More than three in five MT respondents werefemale. MT respondents were more likely to havenever been married (and were not cohabiting), adifference that persists even when the youngerage of MT respondents is taken into account.
5Note that unweighted characteristics of the KN sampledo not necessarily reflect characteristics of the KN panelbecause KN does do some stratified sampling of its panel.
The KN sample is fairly similar to our MTsample in terms of self-reported race/ethnicity.The major difference between the samples is thatMT had nearly three times as many respondentswho identified as “other, non-Hispanic” (2.5 per-cent in KN versus 7.3 percent in MT). This se-lection presumably reflects a larger number of re-spondents of East or South Asian descent amongMT respondents (Mason and Suri 2012).6 Be-cause of the greater representation of “other” re-spondents in the MT sample, KN had more whitenon-Hispanic (77.8 percent versus 76.1 percent),black non-Hispanic (8.3 percent versus 6.2 per-cent), and Hispanic respondents (8.7 percent ver-sus 7.4 percent).
Data qualityOur experiment provided various ways of deter-mining whether respondents provided “quality”data in terms of the care with which they engagedwith the stimulus materials and items. Several ofthese measures provided reason to suppose thatproblem responses were more common amongKN respondents than among MT respondents
First, after having answered questions abouta vignette, subjects were given comprehensioncheck items that asked about non-manipulation-related content of the vignette. An example ofsuch a question would be asking about the typeof business conducted by the company describedin the vignette. All respondents received sevensuch questions, and we defined problem cases asthose in which respondents missed more than oneof the manipulation check items. Nearly twiceas many KN respondents as MT respondentswere problem cases by this criterion (9 percentversus 5.0 percent, p < .001). This differenceis partly, but not entirely, accounted for by thehigher education and higher proportion of femalesamong MT respondents (p < .001, after controls).
Second, we examined differences in the timerespondents took to complete the surveys. Thecomparability of samples here is limited becauseKN respondents were able to start and finish theinstrument in different sessions, potentially daysapart, whereas MT respondents timed out if theydid not complete the survey promptly. Conse-
6Although we restricted our experiment to respondentsin the United States, Amazon MT compensates workersin either U.S. dollars or Indian rupees.
sociological science | www.sociologicalscience.com 299 August 2014 | Volume 1
Weinberg, Freese, and McElhattan Comparing Data Characteristics
Table 1: Comparison of demographic characteristics of Knowledge Networks and Mechanical Turksamples
Weighted KN Unweighted KN MT
Female 51.6 49.5 61.3Age18-30 22.8 14.5 50.931-45 24.6 21.6 32.446-60 28.2 33.4 14.561-95 24.4 30.6 2.2
RaceWhite, non-Hispanic 72.8 77.8 76.1Black, non-Hispanic 11.6 8.3 6.2Hispanic 4.3 8.7 7.4Other, non-Hispanic 10.1 2.5 7.32+ races reported 1.2 2.7 2.9
EducationLess than high school 9.8 5.5 1.1High school 31.8 27.3 10.5Some college 29.7 29.5 41.3College degree or higher 28.7 37.8 47.1
Marital statusMarried/living with partner 59.8 67.6 50.8Never married 22.2 16.8 39.8Divorced/separated 13.0 11.4 8.8Widowed 5.1 4.2 0.7
RegionNortheast 18.4 18.0 18.9Midwest 22.9 23.5 24.1South 36.5 34.3 35.2West 22.2 24.2 21.9
Household head 79.0 84.0 69.4Household income in thousands 60.2 69.0 49.2SD (43.2) (33.9)
N 2,087 1,349
Note: Chi-square test of differences between unweighted KN and MT samples significant for allvariables (p < .001), except region.
quently, the maximum duration in the MT samplewas 3.5 hours, whereas the maximum duration inthe KN sample was slightly more than four days.Overall, 13.9 percent of KN respondents took over45 minutes to complete the survey, compared to1.3 percent of MT respondents.
We can more fairly compare samples regard-ing respondents who appear to have finished thestudy too quickly. Respondent performance onthe comprehension check items was weak for re-spondents who took six minutes or less (68 per-
cent missed two or more comprehension items),modestly affected for respondents taking betweenseven and ten minutes (12 percent), and not as-sociated with performance thereafter (6 percent).KN respondents were more than three times morelikely than MT respondents to finish the surveyin six minutes or less (2.4 percent versus 0.7 per-cent, p < .001). These times do not accountfor the difference in comprehension check perfor-mance, however, because KN respondents werestill nearly twice as likely to miss more than one
sociological science | www.sociologicalscience.com 300 August 2014 | Volume 1
Weinberg, Freese, and McElhattan Comparing Data Characteristics
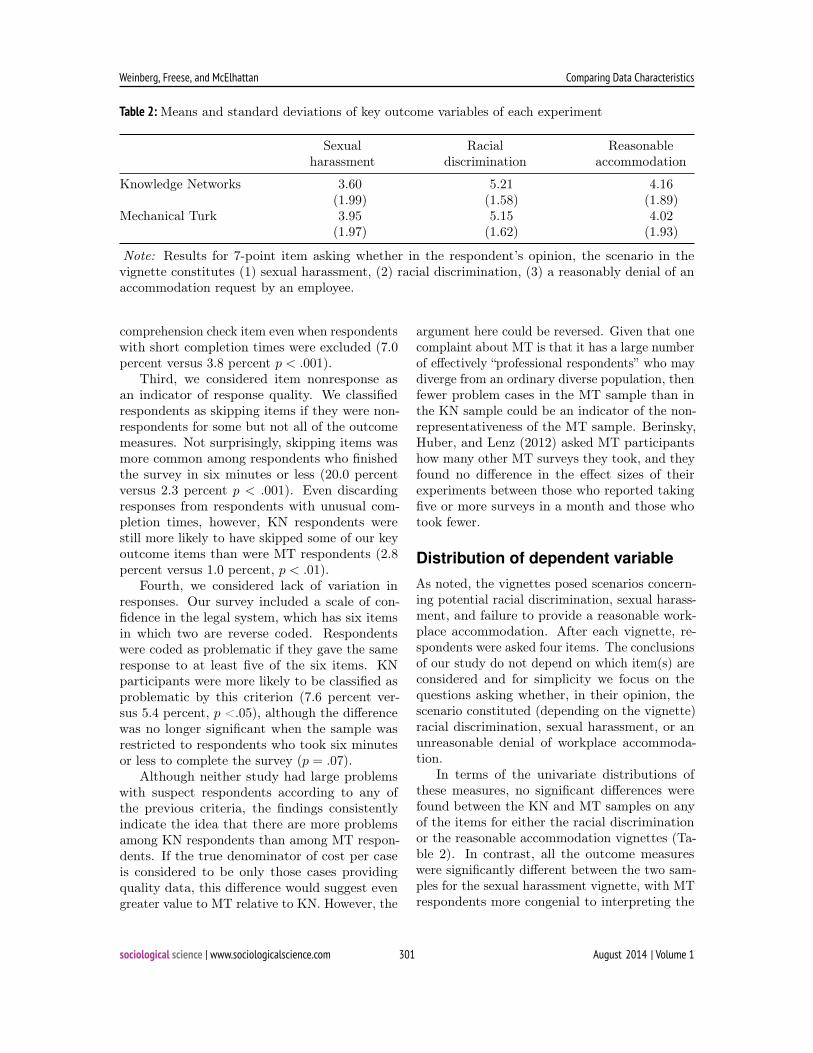
Table 2:Means and standard deviations of key outcome variables of each experiment
Sexual Racial Reasonableharassment discrimination accommodation
Knowledge Networks 3.60 5.21 4.16(1.99) (1.58) (1.89)
Mechanical Turk 3.95 5.15 4.02(1.97) (1.62) (1.93)
Note: Results for 7-point item asking whether in the respondent’s opinion, the scenario in thevignette constitutes (1) sexual harassment, (2) racial discrimination, (3) a reasonably denial of anaccommodation request by an employee.
comprehension check item even when respondentswith short completion times were excluded (7.0percent versus 3.8 percent p < .001).
Third, we considered item nonresponse asan indicator of response quality. We classifiedrespondents as skipping items if they were non-respondents for some but not all of the outcomemeasures. Not surprisingly, skipping items wasmore common among respondents who finishedthe survey in six minutes or less (20.0 percentversus 2.3 percent p < .001). Even discardingresponses from respondents with unusual com-pletion times, however, KN respondents werestill more likely to have skipped some of our keyoutcome items than were MT respondents (2.8percent versus 1.0 percent, p < .01).
Fourth, we considered lack of variation inresponses. Our survey included a scale of con-fidence in the legal system, which has six itemsin which two are reverse coded. Respondentswere coded as problematic if they gave the sameresponse to at least five of the six items. KNparticipants were more likely to be classified asproblematic by this criterion (7.6 percent ver-sus 5.4 percent, p <.05), although the differencewas no longer significant when the sample wasrestricted to respondents who took six minutesor less to complete the survey (p = .07).
Although neither study had large problemswith suspect respondents according to any ofthe previous criteria, the findings consistentlyindicate the idea that there are more problemsamong KN respondents than among MT respon-dents. If the true denominator of cost per caseis considered to be only those cases providingquality data, this difference would suggest evengreater value to MT relative to KN. However, the
argument here could be reversed. Given that onecomplaint about MT is that it has a large numberof effectively “professional respondents” who maydiverge from an ordinary diverse population, thenfewer problem cases in the MT sample than inthe KN sample could be an indicator of the non-representativeness of the MT sample. Berinsky,Huber, and Lenz (2012) asked MT participantshow many other MT surveys they took, and theyfound no difference in the effect sizes of theirexperiments between those who reported takingfive or more surveys in a month and those whotook fewer.
Distribution of dependent variableAs noted, the vignettes posed scenarios concern-ing potential racial discrimination, sexual harass-ment, and failure to provide a reasonable work-place accommodation. After each vignette, re-spondents were asked four items. The conclusionsof our study do not depend on which item(s) areconsidered and for simplicity we focus on thequestions asking whether, in their opinion, thescenario constituted (depending on the vignette)racial discrimination, sexual harassment, or anunreasonable denial of workplace accommoda-tion.
In terms of the univariate distributions ofthese measures, no significant differences werefound between the KN and MT samples on anyof the items for either the racial discriminationor the reasonable accommodation vignettes (Ta-ble 2). In contrast, all the outcome measureswere significantly different between the two sam-ples for the sexual harassment vignette, with MTrespondents more congenial to interpreting the
sociological science | www.sociologicalscience.com 301 August 2014 | Volume 1
Weinberg, Freese, and McElhattan Comparing Data Characteristics
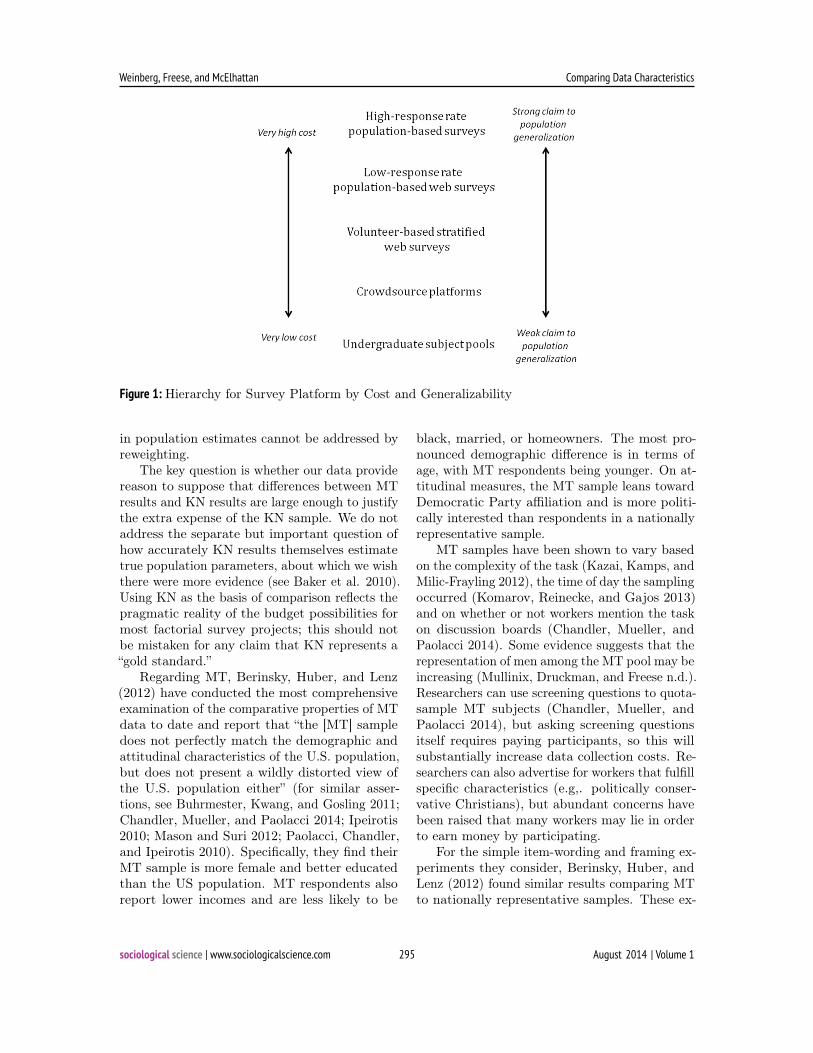
Figure 2. Differences between MT and KN respondents in responses to sexual harassment
vignette, both overall and by age.
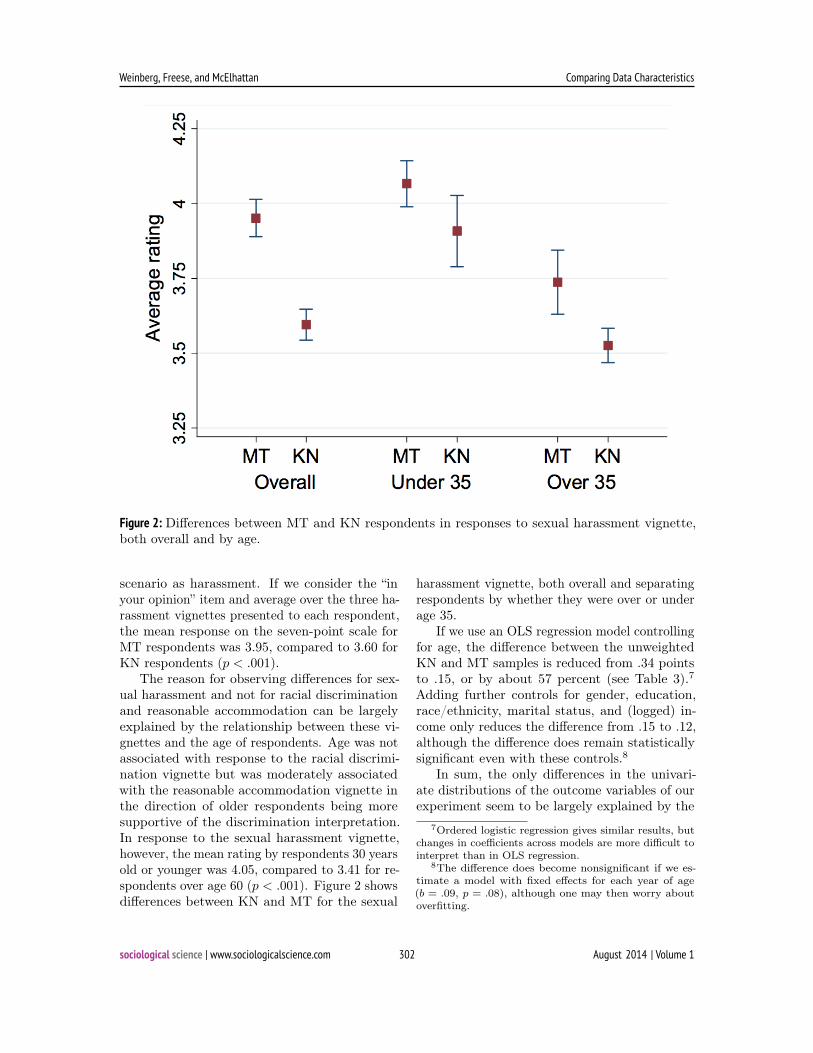
Figure 2: Differences between MT and KN respondents in responses to sexual harassment vignette,both overall and by age.
scenario as harassment. If we consider the “inyour opinion” item and average over the three ha-rassment vignettes presented to each respondent,the mean response on the seven-point scale forMT respondents was 3.95, compared to 3.60 forKN respondents (p < .001).
The reason for observing differences for sex-ual harassment and not for racial discriminationand reasonable accommodation can be largelyexplained by the relationship between these vi-gnettes and the age of respondents. Age was notassociated with response to the racial discrimi-nation vignette but was moderately associatedwith the reasonable accommodation vignette inthe direction of older respondents being moresupportive of the discrimination interpretation.In response to the sexual harassment vignette,however, the mean rating by respondents 30 yearsold or younger was 4.05, compared to 3.41 for re-spondents over age 60 (p < .001). Figure 2 showsdifferences between KN and MT for the sexual
harassment vignette, both overall and separatingrespondents by whether they were over or underage 35.
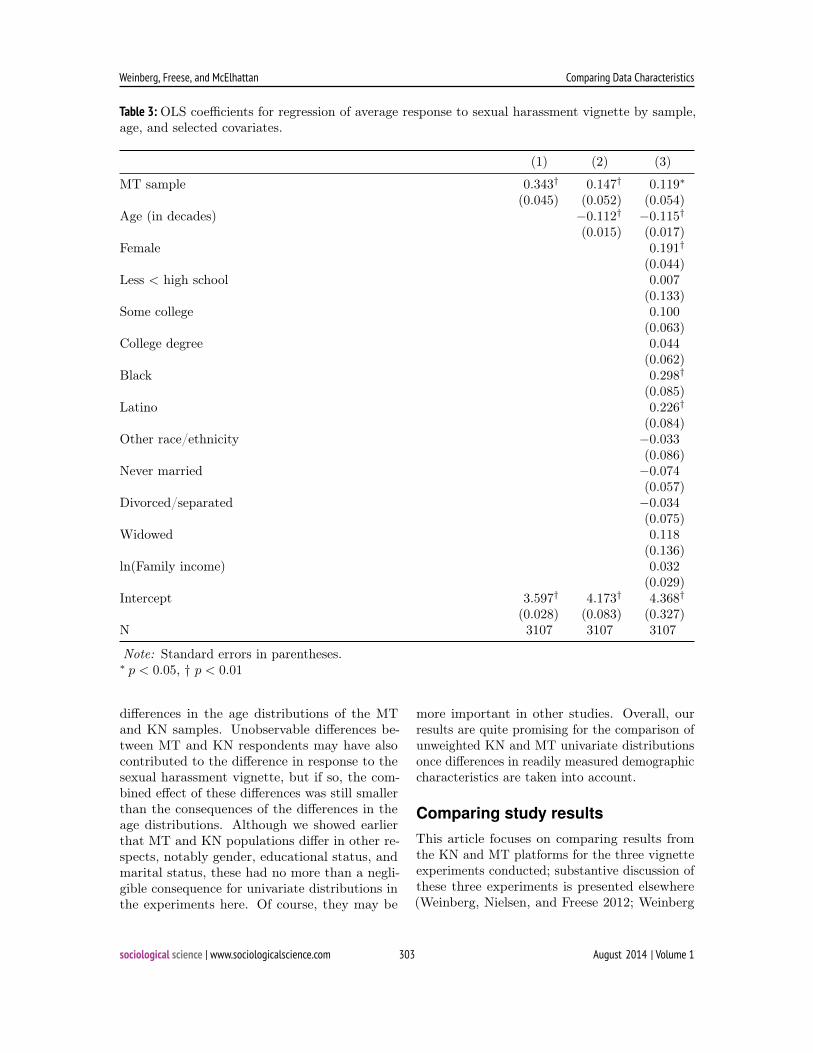
If we use an OLS regression model controllingfor age, the difference between the unweightedKN and MT samples is reduced from .34 pointsto .15, or by about 57 percent (see Table 3).7Adding further controls for gender, education,race/ethnicity, marital status, and (logged) in-come only reduces the difference from .15 to .12,although the difference does remain statisticallysignificant even with these controls.8
In sum, the only differences in the univari-ate distributions of the outcome variables of ourexperiment seem to be largely explained by the
7Ordered logistic regression gives similar results, butchanges in coefficients across models are more difficult tointerpret than in OLS regression.
8The difference does become nonsignificant if we es-timate a model with fixed effects for each year of age(b = .09, p = .08), although one may then worry aboutoverfitting.
sociological science | www.sociologicalscience.com 302 August 2014 | Volume 1
Weinberg, Freese, and McElhattan Comparing Data Characteristics
Table 3: OLS coefficients for regression of average response to sexual harassment vignette by sample,age, and selected covariates.
(1) (2) (3)
MT sample 0.343† 0.147† 0.119∗
(0.045) (0.052) (0.054)Age (in decades) −0.112† −0.115†
(0.015) (0.017)Female 0.191†
(0.044)Less < high school 0.007
(0.133)Some college 0.100
(0.063)College degree 0.044
(0.062)Black 0.298†
(0.085)Latino 0.226†
(0.084)Other race/ethnicity −0.033
(0.086)Never married −0.074
(0.057)Divorced/separated −0.034
(0.075)Widowed 0.118
(0.136)ln(Family income) 0.032
(0.029)Intercept 3.597† 4.173† 4.368†
(0.028) (0.083) (0.327)N 3107 3107 3107
Note: Standard errors in parentheses.∗ p < 0.05, † p < 0.01
differences in the age distributions of the MTand KN samples. Unobservable differences be-tween MT and KN respondents may have alsocontributed to the difference in response to thesexual harassment vignette, but if so, the com-bined effect of these differences was still smallerthan the consequences of the differences in theage distributions. Although we showed earlierthat MT and KN populations differ in other re-spects, notably gender, educational status, andmarital status, these had no more than a negli-gible consequence for univariate distributions inthe experiments here. Of course, they may be
more important in other studies. Overall, ourresults are quite promising for the comparison ofunweighted KN and MT univariate distributionsonce differences in readily measured demographiccharacteristics are taken into account.
Comparing study resultsThis article focuses on comparing results fromthe KN and MT platforms for the three vignetteexperiments conducted; substantive discussion ofthese three experiments is presented elsewhere(Weinberg, Nielsen, and Freese 2012; Weinberg
sociological science | www.sociologicalscience.com 303 August 2014 | Volume 1
Weinberg, Freese, and McElhattan Comparing Data Characteristics
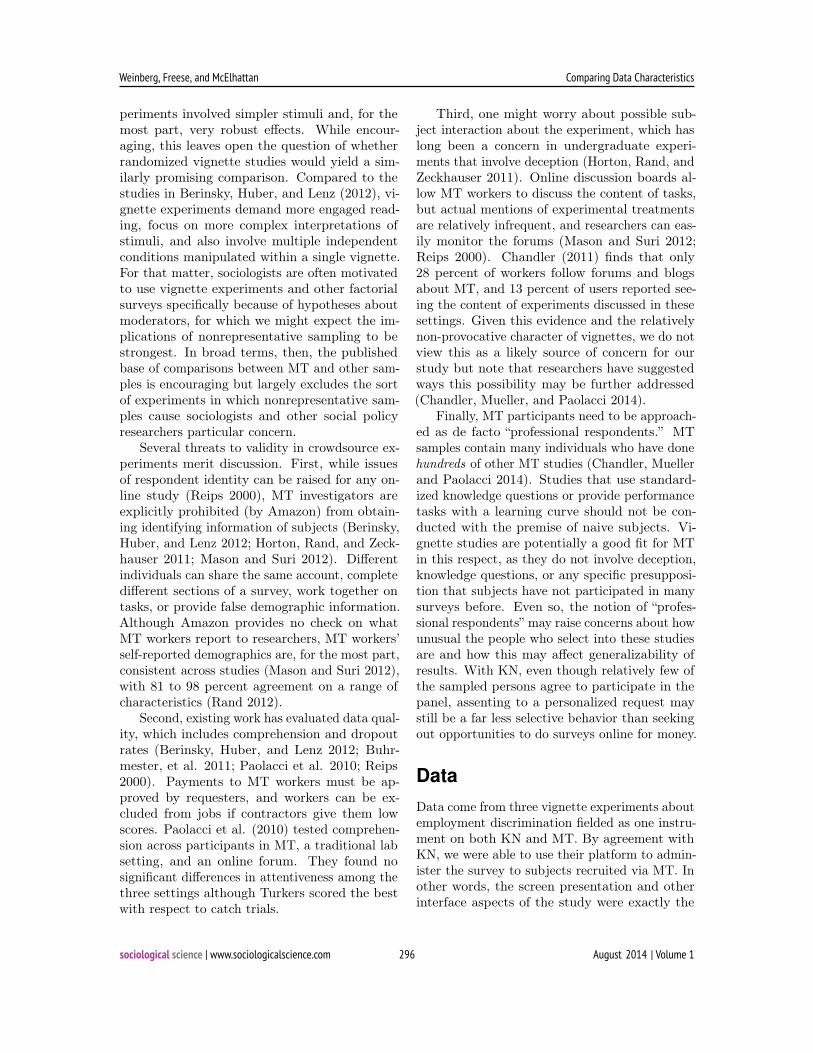
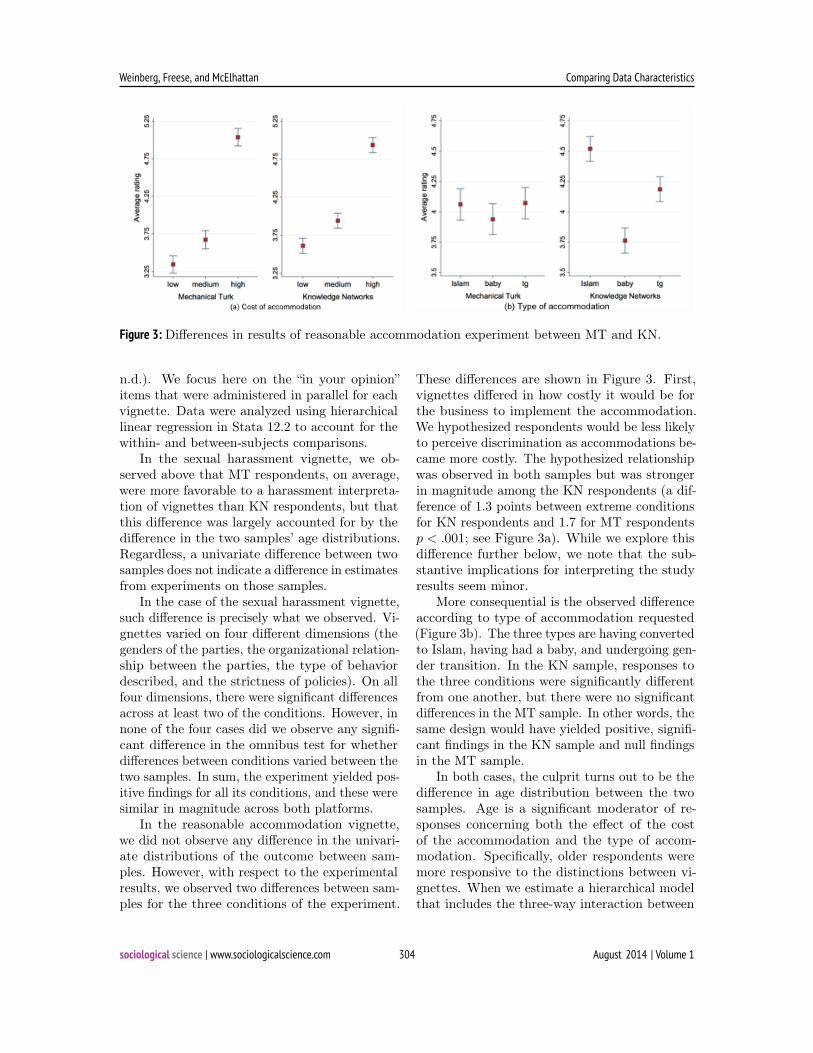
Figure 3: Differences in results of reasonable accommodation experiment between MT and KN.
n.d.). We focus here on the “in your opinion”items that were administered in parallel for eachvignette. Data were analyzed using hierarchicallinear regression in Stata 12.2 to account for thewithin- and between-subjects comparisons.
In the sexual harassment vignette, we ob-served above that MT respondents, on average,were more favorable to a harassment interpreta-tion of vignettes than KN respondents, but thatthis difference was largely accounted for by thedifference in the two samples’ age distributions.Regardless, a univariate difference between twosamples does not indicate a difference in estimatesfrom experiments on those samples.
In the case of the sexual harassment vignette,such difference is precisely what we observed. Vi-gnettes varied on four different dimensions (thegenders of the parties, the organizational relation-ship between the parties, the type of behaviordescribed, and the strictness of policies). On allfour dimensions, there were significant differencesacross at least two of the conditions. However, innone of the four cases did we observe any signifi-cant difference in the omnibus test for whetherdifferences between conditions varied between thetwo samples. In sum, the experiment yielded pos-itive findings for all its conditions, and these weresimilar in magnitude across both platforms.
In the reasonable accommodation vignette,we did not observe any difference in the univari-ate distributions of the outcome between sam-ples. However, with respect to the experimentalresults, we observed two differences between sam-ples for the three conditions of the experiment.
These differences are shown in Figure 3. First,vignettes differed in how costly it would be forthe business to implement the accommodation.We hypothesized respondents would be less likelyto perceive discrimination as accommodations be-came more costly. The hypothesized relationshipwas observed in both samples but was strongerin magnitude among the KN respondents (a dif-ference of 1.3 points between extreme conditionsfor KN respondents and 1.7 for MT respondentsp < .001; see Figure 3a). While we explore thisdifference further below, we note that the sub-stantive implications for interpreting the studyresults seem minor.
More consequential is the observed differenceaccording to type of accommodation requested(Figure 3b). The three types are having convertedto Islam, having had a baby, and undergoing gen-der transition. In the KN sample, responses tothe three conditions were significantly differentfrom one another, but there were no significantdifferences in the MT sample. In other words, thesame design would have yielded positive, signifi-cant findings in the KN sample and null findingsin the MT sample.
In both cases, the culprit turns out to be thedifference in age distribution between the twosamples. Age is a significant moderator of re-sponses concerning both the effect of the costof the accommodation and the type of accom-modation. Specifically, older respondents weremore responsive to the distinctions between vi-gnettes. When we estimate a hierarchical modelthat includes the three-way interaction between
sociological science | www.sociologicalscience.com 304 August 2014 | Volume 1
Weinberg, Freese, and McElhattan Comparing Data Characteristics
Table 4: Hierarchical random-effects OLS models of the interaction of experimental conditions bysample type and age for reasonable accommodation vignette experiment.
Type of accom-Cost condition modation condition
(1) (2) (3) (4)
MT sample −0.267† −0.271 −0.458† 0.008(0.078) (0.253) (0.084) (0.274)
Low cost condition 0.333† 0.365(0.067) (0.226)
High cost condition 1.327† 1.962†
(0.068) (0.230)MT × Low −0.003 0.252
(0.106) (0.339)MT × High 0.366† 0.130
(0.105) (0.341)Age × Low −0.007
(0.042)Age × High −0.124†
(0.043)Baby condition −0.757† 0.295
(0.073) (0.244)Transgender condition −0.333† 0.712†
(0.073) (0.248)MT × Baby 0.635† −0.148
(0.114) (0.370)MT × Trans 0.344† −0.309
(0.115) (0.372)Age × Baby −0.205†
(0.045)Age × Trans −0.203†
(0.046)Age (in decades) 0.113† 0.206†
(0.032) (0.033)Age × MT 0.059 −0.030
(0.061) (0.068)Age × MT × Low −0.075
(0.083)Age × MT × High 0.007
(0.083)Age × MT × Baby 0.126
(0.091)Age × MT × Trans 0.086
(0.091)Intercept 3.609† 3.030† 4.519† 3.461†
(0.050) (0.171) (0.053) (0.179)N 6292 6290 6292 6290
Note: Standard errors in parentheses.∗ p < 0.05 † p < 0.01
sociological science | www.sociologicalscience.com 305 August 2014 | Volume 1
Weinberg, Freese, and McElhattan Comparing Data Characteristics
age, platform, and experimental conditions, theinteractions between age and experimental con-ditions are significant, and neither the two-wayinteractions within platform nor any of the three-way interactions are significant (Table 4). Thatis, there are no remaining significant differencesin responses between the KN and MT platformsonce age is accounted for, and the magnitude ofthe moderating effect of age is not significantlydifferent between KN and MT.
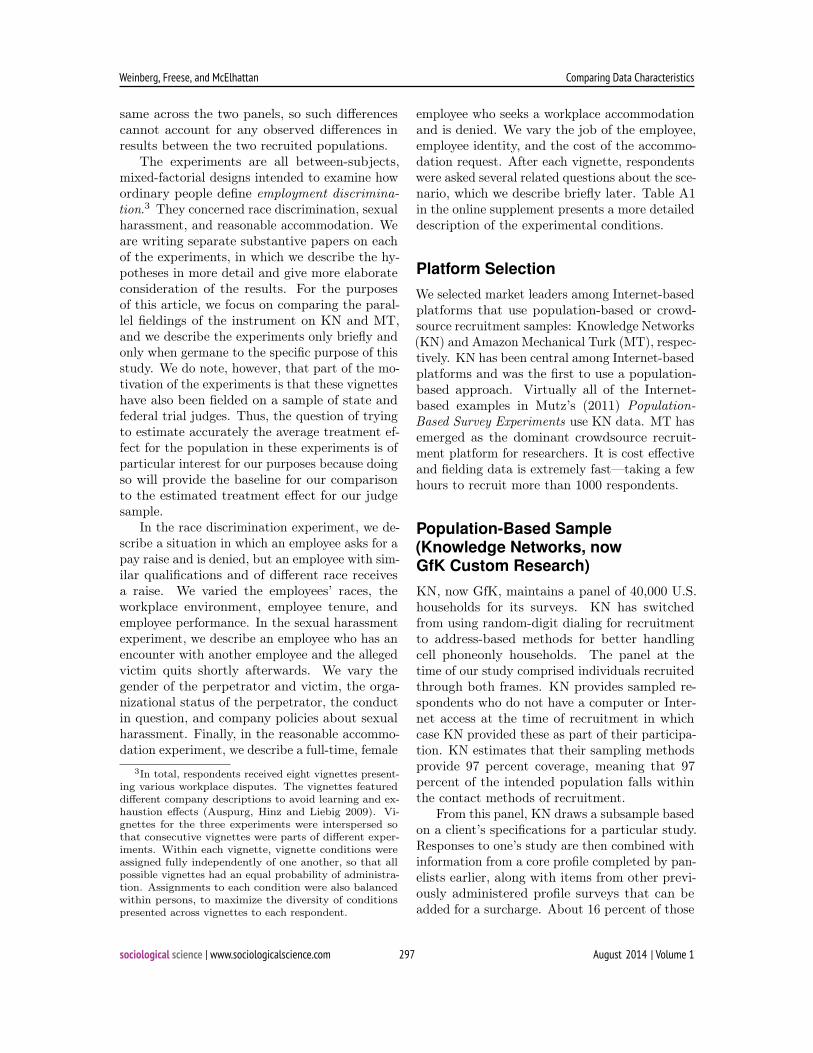
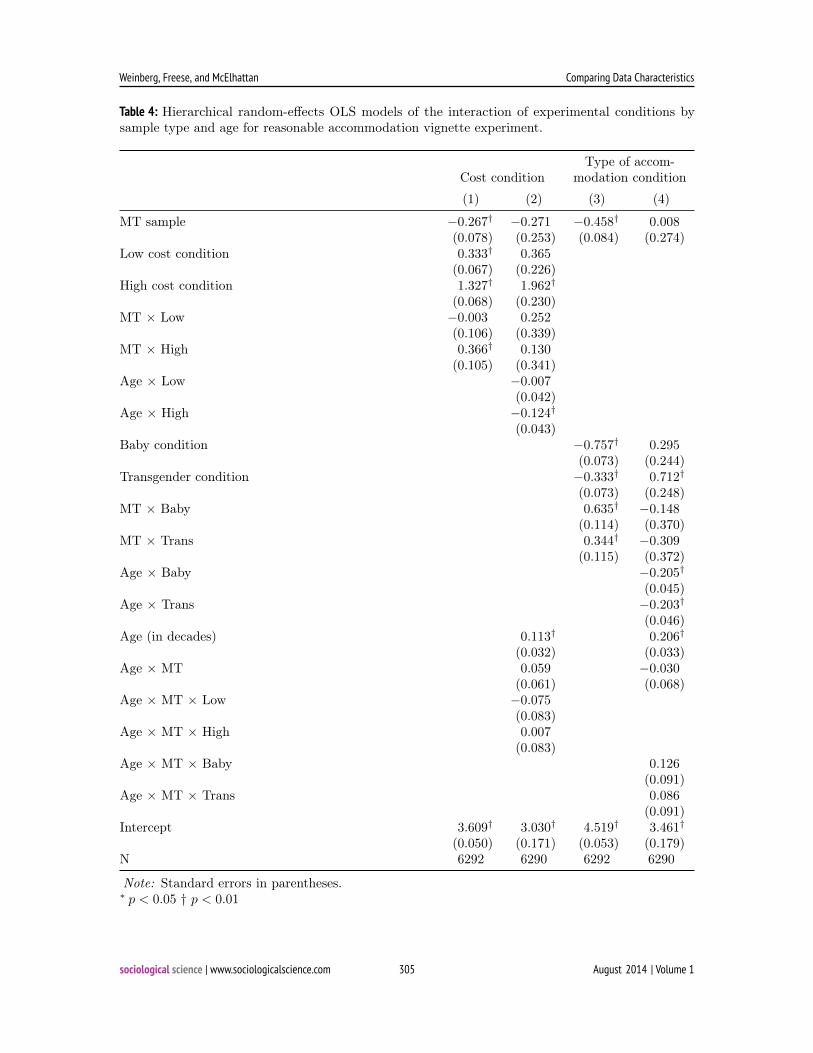
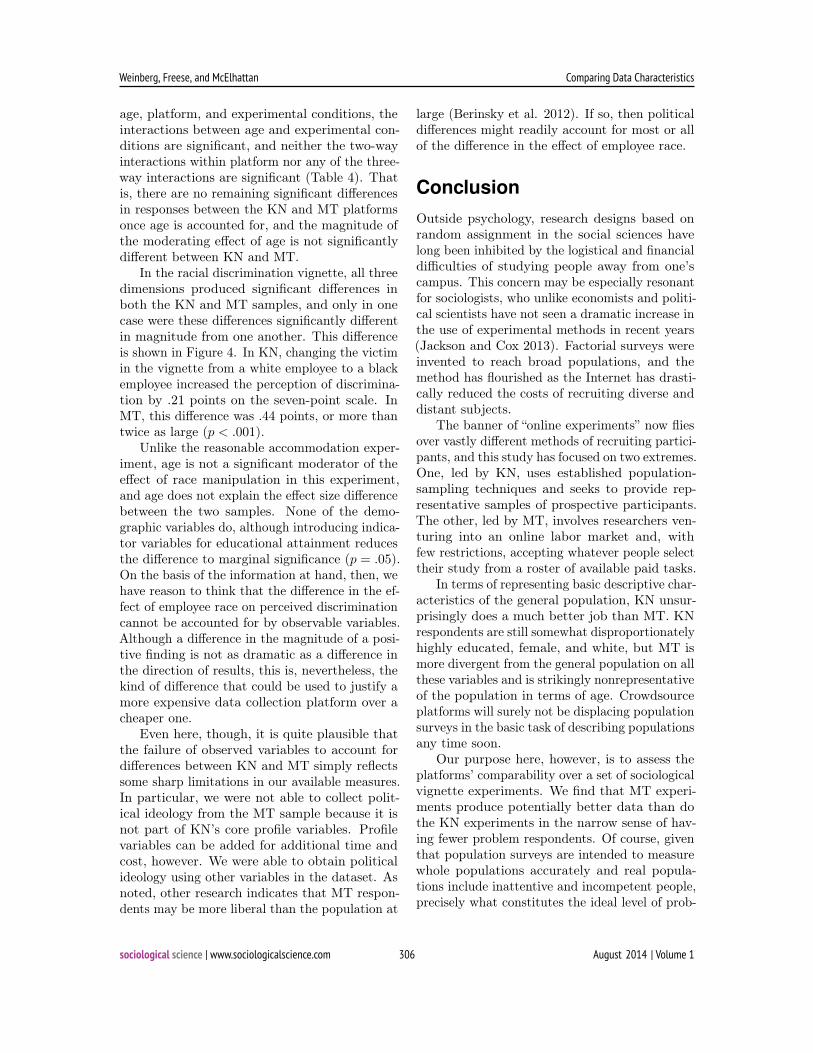
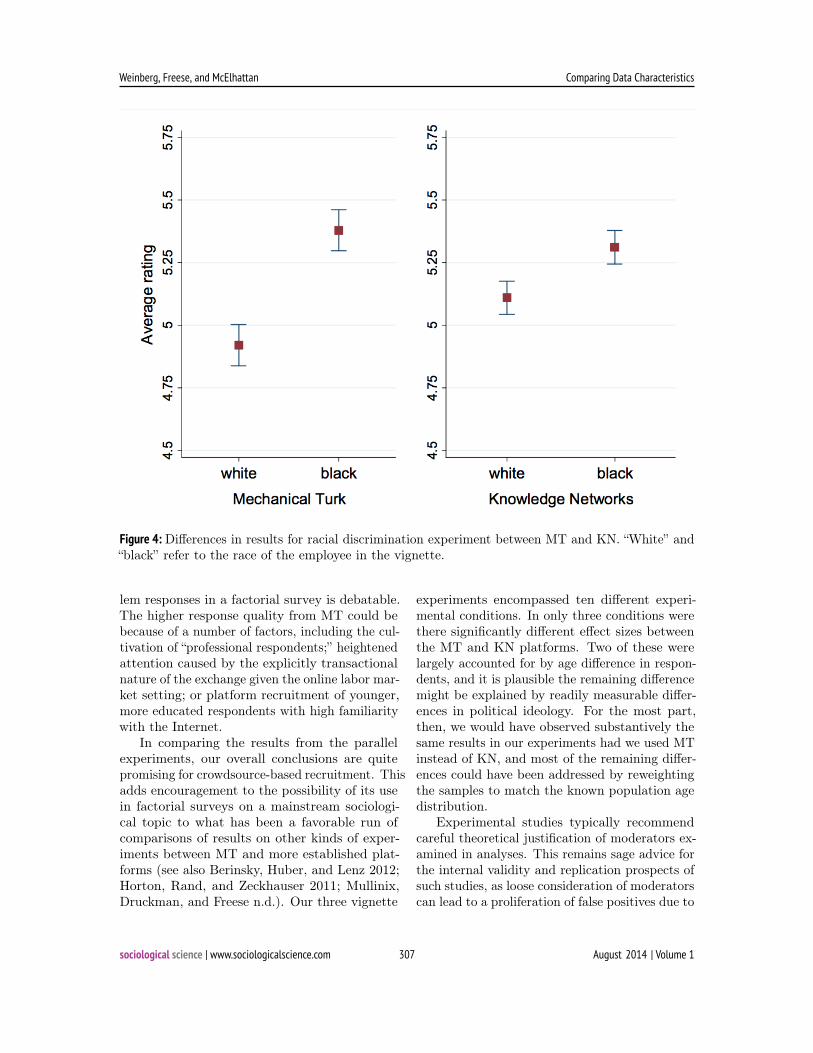
In the racial discrimination vignette, all threedimensions produced significant differences inboth the KN and MT samples, and only in onecase were these differences significantly differentin magnitude from one another. This differenceis shown in Figure 4. In KN, changing the victimin the vignette from a white employee to a blackemployee increased the perception of discrimina-tion by .21 points on the seven-point scale. InMT, this difference was .44 points, or more thantwice as large (p < .001).
Unlike the reasonable accommodation exper-iment, age is not a significant moderator of theeffect of race manipulation in this experiment,and age does not explain the effect size differencebetween the two samples. None of the demo-graphic variables do, although introducing indica-tor variables for educational attainment reducesthe difference to marginal significance (p = .05).On the basis of the information at hand, then, wehave reason to think that the difference in the ef-fect of employee race on perceived discriminationcannot be accounted for by observable variables.Although a difference in the magnitude of a posi-tive finding is not as dramatic as a difference inthe direction of results, this is, nevertheless, thekind of difference that could be used to justify amore expensive data collection platform over acheaper one.
Even here, though, it is quite plausible thatthe failure of observed variables to account fordifferences between KN and MT simply reflectssome sharp limitations in our available measures.In particular, we were not able to collect polit-ical ideology from the MT sample because it isnot part of KN’s core profile variables. Profilevariables can be added for additional time andcost, however. We were able to obtain politicalideology using other variables in the dataset. Asnoted, other research indicates that MT respon-dents may be more liberal than the population at
large (Berinsky et al. 2012). If so, then politicaldifferences might readily account for most or allof the difference in the effect of employee race.
ConclusionOutside psychology, research designs based onrandom assignment in the social sciences havelong been inhibited by the logistical and financialdifficulties of studying people away from one’scampus. This concern may be especially resonantfor sociologists, who unlike economists and politi-cal scientists have not seen a dramatic increase inthe use of experimental methods in recent years(Jackson and Cox 2013). Factorial surveys wereinvented to reach broad populations, and themethod has flourished as the Internet has drasti-cally reduced the costs of recruiting diverse anddistant subjects.
The banner of “online experiments” now fliesover vastly different methods of recruiting partici-pants, and this study has focused on two extremes.One, led by KN, uses established population-sampling techniques and seeks to provide rep-resentative samples of prospective participants.The other, led by MT, involves researchers ven-turing into an online labor market and, withfew restrictions, accepting whatever people selecttheir study from a roster of available paid tasks.
In terms of representing basic descriptive char-acteristics of the general population, KN unsur-prisingly does a much better job than MT. KNrespondents are still somewhat disproportionatelyhighly educated, female, and white, but MT ismore divergent from the general population on allthese variables and is strikingly nonrepresentativeof the population in terms of age. Crowdsourceplatforms will surely not be displacing populationsurveys in the basic task of describing populationsany time soon.
Our purpose here, however, is to assess theplatforms’ comparability over a set of sociologicalvignette experiments. We find that MT experi-ments produce potentially better data than dothe KN experiments in the narrow sense of hav-ing fewer problem respondents. Of course, giventhat population surveys are intended to measurewhole populations accurately and real popula-tions include inattentive and incompetent people,precisely what constitutes the ideal level of prob-
sociological science | www.sociologicalscience.com 306 August 2014 | Volume 1
Weinberg, Freese, and McElhattan Comparing Data Characteristics
Figure 4. Differences in results for racial discrimination experiment between MT and KN.
Race of employee in vignette
Figure 4: Differences in results for racial discrimination experiment between MT and KN. “White” and“black” refer to the race of the employee in the vignette.
lem responses in a factorial survey is debatable.The higher response quality from MT could bebecause of a number of factors, including the cul-tivation of “professional respondents;” heightenedattention caused by the explicitly transactionalnature of the exchange given the online labor mar-ket setting; or platform recruitment of younger,more educated respondents with high familiaritywith the Internet.
In comparing the results from the parallelexperiments, our overall conclusions are quitepromising for crowdsource-based recruitment. Thisadds encouragement to the possibility of its usein factorial surveys on a mainstream sociologi-cal topic to what has been a favorable run ofcomparisons of results on other kinds of exper-iments between MT and more established plat-forms (see also Berinsky, Huber, and Lenz 2012;Horton, Rand, and Zeckhauser 2011; Mullinix,Druckman, and Freese n.d.). Our three vignette
experiments encompassed ten different experi-mental conditions. In only three conditions werethere significantly different effect sizes betweenthe MT and KN platforms. Two of these werelargely accounted for by age difference in respon-dents, and it is plausible the remaining differencemight be explained by readily measurable differ-ences in political ideology. For the most part,then, we would have observed substantively thesame results in our experiments had we used MTinstead of KN, and most of the remaining differ-ences could have been addressed by reweightingthe samples to match the known population agedistribution.
Experimental studies typically recommendcareful theoretical justification of moderators ex-amined in analyses. This remains sage advice forthe internal validity and replication prospects ofsuch studies, as loose consideration of moderatorscan lead to a proliferation of false positives due to
sociological science | www.sociologicalscience.com 307 August 2014 | Volume 1
Weinberg, Freese, and McElhattan Comparing Data Characteristics
underdocumented multiple testing. Nevertheless,when considering the possible generalizability offindings in a diverse but nonrepresentative samplelike those produced by MT, it seems advisable toencourage testing of moderation on broad charac-teristics known to diverge markedly between thesample and population, even when not explicitlytheorized in advance. Respondent age, politicalorientation, and gender appear to be the mostobvious suspects in this regard for MT.
In sum, our results further substantiate theoptimism for using crowdsource platforms to con-duct factorial surveys, even for studies motivatedby interest in estimating average treatment ef-fects for the US population. Of course, cautionis warranted, and more comparisons need to bemade across more substantive topics and moretypes of experiments, as well as a broader rangeof platforms. However, our results suggest partic-ipants recruited through MT are not so unusualthat their behavior noticeably diverges from thatof KN respondents, especially once differences inbasic measurable characteristics are taken intoaccount. Of course, similarities in results betweenMT and KN could mean that both groups areunusual relative to the population at large, agloomy prospect that remains possible given thelow response rates for online surveys in general.Work comparing these platforms to samples withhigh response rates needs to be done, but this ishindered not just by the much greater expense ofthe latter but also by differences in the modes bywhich most such surveys are presently conducted.
A separate possibility is that, regardless ofwhat evidence ultimately indicates about the com-parability of results between crowdsource-basedsamples and other samples, problems with therecruitment method’s face validity may provean insuperable rhetorical disadvantage for facto-rial surveys directed at social policy, not unlikehow policy-minded experiments based entirely onundergraduates are currently received by someaudiences. The terrain of population researchis changing quickly, but we expect that bothpopulation- and crowdsource-based methods ofrecruitment have long futures ahead. The chal-lenge for researchers is to determine the most costeffective and valid ways of combining evidencefrom both.
ReferencesAlexander, Cheryl S. and Henry Jay Becker. 1978.
“The Use of Vignettes in Survey Research.”Public Opinion Quarterly 42(1):93-104. http://dx.doi.org/10.1086/268432
Amazon Mechanical Turk. 2014. “Service Sum-mary.” Seattle, Washington. RetrievedApril 20, 2014 https://requester.mturk.com/tour.
Atzmüller, Christiane; Steiner, Peter M. 2010.“Experimental Vignette Studies in Survey Re-search.” European Journal of Research Meth-ods for the Behavioral and Social Sciences6(3):128-38. http://dx.doi.org/10.1027/1614-2241/a000014
Auspurg, Katrin, Thomas Hinz, and StefanLiebig. 2009. “Complexity, Learning Effects,and the Plausibility of Vignettes in FactorialSurveys.” Paper presented at the AmericanSociological Association Annual Meeting, Au-gust 7-11, San Francisco, California.
Baker, Reg, Stephen J. Blumberg, J.MichaelBrick, Mick P. Couper, Melanie Courtright,J. Michael Dennis, Don Dillman, Martin R.Frankel, Philip Garland, Robert M. Grovers,Courtney Kennedy, Jon Krosnick, and PaulJ. Lavrakas. 2010. “Research Synthesis:AAPOR Report on Online Panels.” Pub-lic Opinion Quarterly 74(4):711-81. http://dx.doi.org/10.1093/poq/nfq048
Berinsky, Adam J., Gregory A. Huber andGabriel S. Lenz. 2012. “Evaluating OnlineLabor Markets for Experimental Research:Amazon.com’s Mechanical Turk.” PoliticalAnalysis 20(3): 351-68. http://dx.doi.org/10.1093/pan/mpr057
Buhrmester, Michael, Tracey Kwang, and SamuelD. Gosling. 2011. “Amazon’s MechanicalTurk: A New Source of Inexpensive, Yet High-Quality, Data?” Perspectives on PsychologicalScience 6(1): 3-5. http://dx.doi.org/10.1177/1745691610393980
Chandler, Jesse, Pam Mueller, and Gabriele Pao-lacci. 2014. “ Nonnaïveté Among AmazonMechanical Turk Workers: Consequences andSolutions For Behavioral Researchers.” Behav-ior Research Methods 46(1):112-30. http://dx.doi.org/10.3758/s13428-013-0365-7
sociological science | www.sociologicalscience.com 308 August 2014 | Volume 1
Weinberg, Freese, and McElhattan Comparing Data Characteristics
Downs, Julie S., Mandy B. Holbrook, SteveSheng, and Lorrie Faith Cranor. 2010.“Are Your Participants Gaming the System?Screening Mechanical Turk Workers.” In Pro-ceedings of the 28th International Conferenceon Human Factors in Computing Systems(2399-2402). New York: ACM.
Druckman, James D. and Cindy D. Kam. 2011.“Students as Experimental Participants: ADefense for the ‘Narrow Data Base.” ’ Pp. 41-57 in Cambridge Handbook of ExperimentalPolitical Science, edited by James D. Druck-man, Donald P. Green, James H. Kuklinskiand Arthur Lupia. New York: CambridgeUniversity Press.
Gätcher, Simon. 2010. “(Dis)advantages of Stu-dent Subjects: What is Your Research Ques-tion.” Behavior and Brain Sciences 33(2-3): 92-93. http://dx.doi.org/10.1017/S0140525X10000099
Goodman, Joseph K., Cynthia E. Cryder, andAmar Cheema. 2012. “Data Collection in aFlat World: The Strengths and Weaknessesof Mechanical Turk Samples.” Journal ofBehavioral Decision Making.
Gosling, Samuel D., Simine Vazie, Sanjay Sri-vastava, and Oliver P. John. 2004. “ShouldWe Trust Web-Based Studies?” AmericanPsychologist 59(2): 93-104. http://dx.doi.org/10.1037/0003-066X.59.2.93
Horton, John J. and Lydia B. Chilton. 2010.“The Labor Economics of Paid Crowdsourc-ing.” Proceedings of the 11th ACM Conferenceon Electronic Commerce 2010. Retrieved July18, 2014 from http://ssrn.com/abstract$=$1596874.
Horton, John J., David G. Rand and RichardJ. Zeckhauser. 2011. “The Online Lab-oratory: Conducting Experiments in aReal Labor Market.” Experimental Eco-nomics 14(3):399-425. http://dx.doi.org/10.1007/s10683-011-9273-9
Ipeirotis, Panos. 2010. “Demographics of Me-chanical Turk. (CeDER Working Paper-10-01). New York University. RetrievedJuly 18, 2014 from http://hdl.handle.net/2451/29585.
Jackson, Michelle and D. R. Cox. 2013. “ThePrinciples of Experimental Design and Their
Application to Sociology.” Annual Review ofSociology 39: 27-49. http://dx.doi.org/10.1146/annurev-soc-071811-145443
Kazai, Gabriella, Jaap Kamps, and Natasa Milic-Frayling. 2012. “Worker Types and Personal-ity Traits of Crowdsourcing Relevance Labels”in Proceedings of 20th International Confer-ence on Information and Knowledge Manage-ment (CIKM). ACM: New York.
Komarov, Steven, Katharina Reinecke, andKrzysztof Z. Gajos. 2013 “Crowdsourcing Per-formance Evaluations of User Interfaces” inProceedings of the SIGCHI Conference on Hu-man Factors in Computing Systems. ACM:New York.
Lynch Jr., John G. 1982. “On the External Valid-ity of Experiments in Consumer Research.”Journal of Consumer Research 9(3):225-39.http://dx.doi.org/10.1086/208919
Mason, Winter and Siddarth Suri. 2012. “Con-ducting Behavioral Research on Amazon’s Me-chanical Turk.” Behavior Research Methods44(1): 1-23. http://dx.doi.org/10.3758/s13428-011-0124-6
Mullinix, Kevin J., James N. Druckman, andJeremy Freese. “When Convenience SamplesYield Generalizable Estimates in Social Sci-ence Experiments.” Unpublished manuscript.
Mutz, Diana C. 2011. Population-Based Sur-vey Experiments. Princeton, NJ: PrincetonUniversity Press.
Nelson, Thomas E., Rosalee A. Clawson, andZoe M. Oxley. 1997. “Media Framing of aCivil Liberties Conflict and Its Effects on Tol-erance.” American Political Science Review91(3):567-83. http://dx.doi.org/10.2307/2952075
Paolacci, Gabriele, Jesse Chandler, and PanosIpeirotis. 2010. “Running Experiments onAmazon Mechanical Turk.” Judgment andDecision Making 5(5) 411-19.
Peterson, Robert A. 2001. “On the Use of Col-lege Students in Social Science Research: In-sights From a Second Order Meta-Analysis.”Journal of Consumer Research 28 (3): 450-61.http://dx.doi.org/10.1086/323732
Phelan, Jo C., Bruce G. Link, and Naumi M.Feldman. 2013. “The Genomic Revolution
sociological science | www.sociologicalscience.com 309 August 2014 | Volume 1
Weinberg, Freese, and McElhattan Comparing Data Characteristics
and Beliefs about Essential Racial Differ-ences: A Backdoor to Eugenics?” Ameri-can Sociological Review 78(2): 167-91. http://dx.doi.org/10.1177/0003122413476034
Rand, David G. 2012. “The Promise of Mechan-ical Turk: How Online Labor Markets CanHelp Theorists Run Behavioral Experiments.”Journal of Theoretical Biology 299(21): 172-79. http://dx.doi.org/10.1016/j.jtbi.2011.03.004
Regnerus, Mark. 2012. “How different are theadult children of parents who have same-sexrelationships? Findings from the New Fam-ily Structures Study.” Social Science Re-search. 41(4): 752-70. http://dx.doi.org/10.1016/j.ssresearch.2012.03.009
Reips, Ulf-Dietrich. 2002. “Standards forInternet-Based Experimenting.” Experimen-tal Psychology 49(4): 243-256.
—-. 2000. “The Web Experiment Method: Ad-vantages, Disadvantages, and Solutions.” Psy-chological Experiments on the Internet. Ed.Birnbaum, Michael H. San Diego: AcademicPress. 89-118.
Rossi, Peter H. and Steven L. Nock. eds. 1982.Measuring Social Judgments: The FactorialSurvey Approach. Beverly Hills, CA: SAGEPublications.
Sears, David O. 1986. “College Sophomores inthe Laboratory: Influences of a Narrow DataBase on Social Psychology’s View of HumanNature.” Journal of Personality and SocialPsychology 51(3): 515–30. http://dx.doi.org/10.1037/0022-3514.51.3.515
Shadish, William R., Thomas D. Cook, and Don-ald T. Campbell. 2002. Experimental andQuasi-Experimental Designs for GeneralizedCausal Inference. Boston: Houghton Mifflin.
Shapiro, Danielle N., Jesse Chandler, and PamA. Mueller. 2013. “Using Mechanical Turk toStudy Clinical Populations.” Clinical Psycho-logical Science 1(2):213-20. http://dx.doi.org/10.1177/2167702612469015
Sniderman, Paul M. and Thomas Piazza. 2002.Black Pride and Black Prejudice. Princeton,NJ: Princeton University Press.
Tuckel, Peter and Harry O’Neill. 1995. “A Profileof Telephone Answering Machine Ownersand Screeners” Proceedings of the Section on
Survey Research Methods of the American Sta-tistical Association. Retrieved July 18, 2014from http://www.amstat.org/sections/srms/proceedings/papers/1995_201.pdf.
Webster, Murray and Jane Sell. 2007. LaboratoryExperiments in the Social Sciences. London:Academic Press.
Weinberg, Jill D. n.d. “Identity and Social Ac-ceptability: Public Perceptions of ReasonableAccommodation.” Manuscript in Progress (onfile with author).
Weinberg, Jill D., Laura Beth Nielsen, andJeremy Freese 2012. “Rub My Shoulders ButDon’t Send Me Emails: Public Perceptionsof Sexual Harassment.” Paper presented atAnnual Meeting of the Law and Society Asso-ciation, June 5-8, 2012, Honolulu, HI.
Zelditch Jr, Morris. 1969. “Can You Really Studyan Army in the Laboratory.” Pp. 528-39 inA Sociological Reader on Complex Organiza-tions Edited by Amitai Etzioni. Austin, Texas:Holt, Rinehart, and Winston.
Acknowledgements: This research was funded bythe American Bar Foundation. The authorswould like to thank participants of the AppliedQuantitative Methods Work at NorthwesternUniversity who provided wonderful feedbackand encouragement. Direct correspondence toJill D. Weinberg, Northwestern University De-partment of Sociology, 1810 Chicago Avenue,Evanston, Illinois, 60208.
Jill D. Weinberg: Northwestern University; Ameri-can Bar Foundation. E-mail: [email protected].
Jeremy Freese: Northwestern University. E-mail:[email protected].
David McElhattan: Northwestern University. E-mail: [email protected].
sociological science | www.sociologicalscience.com 310 August 2014 | Volume 1