Embed Size (px)
Citation preview
University of Arkansas, FayettevilleScholarWorks@UARK
Theses and Dissertations
5-2015
Comparing Layer Types for the Use of MEPDGfor FDR DesignSadie SmithUniversity of Arkansas, Fayetteville
Follow this and additional works at: http://scholarworks.uark.edu/etd
Part of the Civil Engineering Commons
This Thesis is brought to you for free and open access by ScholarWorks@UARK. It has been accepted for inclusion in Theses and Dissertations by anauthorized administrator of ScholarWorks@UARK. For more information, please contact [email protected], [email protected].
Recommended CitationSmith, Sadie, "Comparing Layer Types for the Use of MEPDG for FDR Design" (2015). Theses and Dissertations. 1130.http://scholarworks.uark.edu/etd/1130

Comparing Layer Types for the Use of MEPDG for FDR Design

Comparing Layer Types for the Use of MEPDG for FDR Design
A thesis submitted in partial fulfillment of the requirements for the degree of
Master of Science in Civil Engineering
by
Sadie Smith University of Arkansas
Bachelor of Science in Civil Engineering, 2013
May 2015 University of Arkansas
This thesis is approved for recommendation to the Graduate Council. _________________________________ Dr. Andrew Braham Thesis Director _________________________________ _________________________________ Dr. Kevin Hall Dr. Michelle Bernhardt Committee Member Committee Member
ABSTRACT
While Full Depth Reclamation (FDR) has many potential cost and environmental benefits,
especially over the lifetime of the pavement, it is necessary to be able to ensure that the recycled
pavement will perform adequately. One way in which this can be accomplished is understanding
how to best complete the structural design of FDR pavements. Because FDR is a combination of
several different layers of material pulverized, mixed, stabilized and re-compacted, it does not fit
neatly into any of these predetermined types of materials considered by the Mechanistic
Empirical Design Guide (MEPDG). Current practice is to treat FDR as an unbound granular
base layer, but this does not account for the added stability of the selected stabilization
technique. However, previous research has shown that FDR may be more accurately
characterized as a less-aged asphalt concrete. Until a new layer type is developed that considers
the unique properties of these recycled, stabilized base courses, it is essential to understand how
to use existing structural design tools to model FDR in a way that best captures its structural
benefits. In this research, three different FDR mixtures, two of which were made from Arkansas
highway materials, were designed and tested to obtain all necessary material properties required
as inputs for the MEPDG to consider this material as both asphalt concrete (AC) and unbound
granular material (UGM). Using traffic information from the two Arkansas highways and
Arkansas climate data, two different MEPDG models were created for each mixture, one
characterizing the FDR layer as an asphalt concrete and the other as an unbound granular
material. A stronger correlation was found to exist between temperature and modulus, rather
than stress state and modulus. All distress predictions by the MEPDG were higher for the FDR
as UGM except AC rutting for one mixture and bottom-up fatigue cracking. Overall,
considering FDR as AC seemed to more accurately account for the structural benefits of FDR.

ACKNOWLEDGEMENTS
The past two years spent getting my M.S. at the University of Arkansas have been incredibly
rewarding, and I know that that is in large part due to the people that have been involved in my
life.
I’d firstly like to thank Dr. Andrew Braham, who has served as my advisor for both my
undergraduate honors thesis and my masters degree program. Dr. Braham has been quick to
offer technical guidance throughout my research endeavors but has also invested in me as a
person and professional as well. I am so grateful for the time and investment he has made in me
and for the opportunities he has worked to make sure that I’ve had. Working with Dr. Braham
has also given me the opportunity to work with an incredible group of people, both
undergraduates and fellow graduate students. I’d like to thank Chase Henrichs and Shu Yang,
who have been graduate students with me and who have spent long hours at the lab trying to
troubleshoot equipment, analyze data, just share ideas with me. I’d also like to thank Erica
Yeung, Cory Bramlett, Leslie Parker, Marius Kabera, Chris Siebenmorgen, and Slater Smith,
who have been so helpful in this work. Along these lines, I’d also like to thank Dr. Kevin Hall
and Dr. Michelle Bernhardt for their guidance during my research and for serving on my
committee. The insight and perspective they have provided has been invaluable, and I am so
grateful for their time.
Finally, I’d like to thank my family and friends, who have been a constant support
system, outside of my support at school. Specifically, I’d like to thank my mom, my dad and my
siblings, Tanner, Slater, Jackson, and Addie. I’d also like to thank my roommates and best
friends, Rachel, Hannah, Alex, and Diana. These people are always on my team, and for that I
am so grateful.

TABLE OF CONTENTS INTRODUCTION...........................................................................................................................1
Full Depth Reclamation...................................................................................................................1
Structural Design.............................................................................................................................2
Mechanistic Empirical Design Guide..............................................................................................3
LABORATORY PLAN...................................................................................................................5
Materials..........................................................................................................................................5
Laboratory Tests............................................................................................................................11
Sample Fabrication........................................................................................................................11
Asphalt Concrete Characterization Tests.......................................................................................14
Unbound Granular Material Characterization Tests......................................................................15
MEPDG Models............................................................................................................................16
RESULTS AND DISCUSSION....................................................................................................18
Material Characterization...............................................................................................................18
Asphalt Concrete Characterization................................................................................................18
Unbound Granular Material Characterization...............................................................................22
Comparing Material Types............................................................................................................25
MEPDG Results.............................................................................................................................27
CONCLUSIONS...........................................................................................................................31
FUTURE RESEARCH..................................................................................................................32
REFERENCES..............................................................................................................................34

1
INTRODUCTION
As America’s infrastructure ages and is faced with an increasing population and heavier traffic
demands, the condition of the country’s roadways are deteriorating. Unfortunately, the funds
available are insufficient to return these pavements to the desired level of performance (ASCE,
2013). Therefore, there is a need for an increased understanding of maintenance and
rehabilitation techniques that can restore the long-term condition of a pavement in a cost-
effective and environmentally friendly manner. One such technique that holds promise of
providing this type of solution is Full Depth Reclamation (FDR).
Full Depth Reclamation
FDR is a pavement rehabilitation technique in which all of the asphalt pavement section, as well
as a predetermined amount of underlying base material, are treated, pulverized, mixed and
compacted to produce a thicker, stabilized base course (ARRA, 2001). FDR is typically
performed to a depth of 4 to 12 inches. There are several major advantages to this technique. It
completely eliminates and corrects pavement distresses extending below the surface layer, unlike
many other maintenance techniques, and can actually increase the structural capacity of the
pavement (Stroup-Gardiner, 2012). Additionally, the use of in-situ material can result in about
30 to 50 percent cost savings and cut down on greenhouse gas emissions by about 50 percent as
well. In-place recycling procedures, such as FDR, are also much quicker than a full
reconstruction project would be (Bowers, 2015).
Unfortunately, there are some hindrances to the implementation of FDR as well. Because
the entire pavement section is incorporated, a single layer of subgrade soil, base aggregate, and
asphalt concrete materials is created. Asphalt concrete is typically used for the upper layers in a

2
flexible pavement structure because it is a much stiffer material due to the stability added by the
asphalt binder. Granular bases and subgrade soils make up the lower layers of a flexible
pavement structure. While they are not bound with a stabilizing additive, once compacted to the
desired density, these materials can provide adequate load transfer to prevent pavement failure.
FDR falls somewhere in between these two types of materials because, while it is treated with
some type of stabilizing additive, it is not quite as stiff as asphalt concrete, but not as weak as
unstabilized material. This composite layer is much more difficult to characterize because
distinctly different material properties are typically used for performance prediction and design
of each of these types of materials. Therefore, there is uncertainty regarding which laboratory
tests and procedures are most necessary and most appropriate for this new, recycled base layer
created through the FDR process. An immediate problem with these questions is the issue of the
structural design of these recycled and rehabilitated pavements.
Structural Design
The structural design of pavements involves determining the thickness of the layer or layers that
make up the pavement structure. The method historically used for design in the United States is
an empirical method developed by the American Association of State Highway and
Transportation Officials (AASHTO). This design guide, known as the 1993 AASHTO Design
Guide, was developed based upon a series of road tests conducted in the late 1950’s in Ottawa,
Illinois. For flexible pavements, several inputs are used to generate a single structural number
that quantifies the necessary structural capacity of the pavement as a whole. Then, structural
layer coefficients (SLC) specific to the materials used are used to determine the thickness
required for each layer to achieve this structural number.

3
This guide has gone through several iterations since its initial publication, but there are
significant limitations to this method of design based primarily on observed performance of a
small scope of materials, climate conditions, construction practices, and traffic applications
(Timm et al., 2014). One instance of these limitations is the lack of consideration of recycled
base materials, like FDR. From literature, there is a large variation in SLC’s used and accepted
for FDR materials, ranging from 0.27 to 0.41. These values, along with the stabilizing additive
used in that particular mixture are displayed in Table 1. This variance illustrates the difficulty of
selecting one standardized SLC for a composite material such as FDR, and consequently, the
difficulty of designing FDR in a way that adequately captures its structural contribution to a
pavement. However, at this point, according to responses Stroup-Gardiner received from
contractors and state agencies about preferred method of structural design for FDR, using an
AASHTO structural coefficient is most frequently used (2011).
TABLE 1. FDR SLC’s From Literature Research Stabilizing Additive SLC
Butalia et al., 2011
Lime + Fly Ash 0.37 Cement + Emulsion 0.27 Cement 0.41 Lime Kiln Dust + Emulsion 0.26 Lime Kiln Dust + Fly Ash 0.36
Mallick et al., 2002 Emulsion 0.24 Cement 0.28 Emulsion + Lime 0.37
Marquis et al., 2003 Foam + Cement 0.26 Thomas & May, 2007 Emulsion 0.25
Mechanistic Empirical Design Guide
The Mechanistic-Empirical Design Guide (MEPDG) was developed as an improvement from the
previous 1993 AASHTO Design Guide. The MEPDG allows for more accurate performance
prediction and material characterization by requiring specific material properties, climate data,
4
and expanded traffic data as inputs. While this method of structural design has made
considerable improvements from the 1993 AASHTO Design Guide, there is still much more
work to be done.
Research has indicated that the MEPDG does not currently consider the unique properties
of the composite layer created by FDR using asphalt stabilization (Thomas and May, 2007).
May identified several limitations of the MEPDG regarding the design of new and innovative
asphalt bound mixtures like FDR, including the need for more flexibility in data entry for low
temperature cracking, allowance for entry of thinner wearing courses as may be used with FDR,
and the use of different fatigue models for each asphalt concrete layer. The current practice is to
treat asphalt stabilized FDR as an unbound granular base layer, specifically as in place recycled
asphalt pavement (RAP), but this does not account for the strength added by stabilizing the
reclaimed material. Additionally, the current default resilient modulus associated with this
unbound characterization is far too low (May, 2008). The MEPDG software does provide the
option of a stabilized base course, however, the stabilization methods are only those used in
chemical or cement stabilization for FDR. Therefore, FDR materials stabilized using either
asphalt emulsion or asphalt foam are not directly considered. Another study found that there is a
significant impact on the performance predictions when treating FDR as either an unbound layer
or as an asphalt concrete layer (You et al., 2012). In terms of rutting and fatigue cracking,
treating the FDR as an asphalt concrete layer yielded the best performance predictions.
However, the question arises as to whether or not this is accurately predicting the performance of
FDR. The asphalt concrete rutting equation and fatigue cracking model used by the MEPDG
may not apply to FDR, but the unbound granular material models may underestimate the
contribution of FDR. Until a new layer type is developed to fully consider the unique properties

5
of asphalt stabilized FDR, it is necessary to understand the effects of characterizing the
composite FDR layer with the existing layer types, either asphalt concrete or unbound granular
materials, and how these material property inputs affect performance prediction.
LABORATORY PLAN
The effectiveness of the existing MEPDG material characterization was evaluated for the design
of FDR pavements by comparing the effects of considering asphalt emulsion stabilized FDR as
an asphalt concrete material or as an unbound granular material. FDR incorporates both of these
types of materials by pulverizing and mixing the entire pavement structure and then stabilizing it
with the selected additive, creating a composite material. Within the MEPDG, different material
properties are used to characterize asphalt concrete than those used for unbound granular
materials. Both sets of properties were obtained for three different FDR mixtures stabilized with
asphalt emulsion. Two different MEPDG models were then created for each FDR mixture in
order to evaluate the effects of characterizing asphalt emulsion stabilized FDR as an asphalt
concrete material versus characterizing it as an unbound granular base.
Materials
Three different FDR mixtures were designed and tested in this research. The North Carolina
Department of Transportation’s (NCDOT) mix design procedure for asphalt emulsion stabilized
FDR was followed in this research. This mix design was selected because it is one of the few
public FDR asphalt emulsion mix designs available in the United states, has been historically
followed at the University of Arkansas, and is consistent with procedures found in literature (Hill
and Braham, 2016; Thomas and May, 2007). In order to accurately model an FDR mixture as

6
would be seen in the field, RAP, base course aggregate, and subgrade soil were combined in the
appropriate ratios based upon an assumed reclamation depth of 8-inches. The first mixture was
created using 50% Recycle B RAP and 50% Arkansas Class 7 aggregate base course from
Sharps Quarry in Springdale, Arkansas. The remaining mixtures were created from field
materials taken from two state highways in Central Arkansas. Highway 5 consisted of 75% RAP
and 25% subgrade material, while Highway 36 was comprised of 62.5% RAP and 37.5%
subgrade. Information regarding the age of these highways or the maintenance history was not
available; however, it is important to consider that both of these things could significantly affect
material properties and performance of these materials when combined into the FDR mixtures.
The targeted gradation for all of these mixtures was to be within the ideal range specified by the
Asphalt Academy for asphalt emulsion stabilized mixtures (2009). Unfortunately, after
processing the materials sampled from Highway 5 and Highway 36, they were found to fall
slightly above this range. It was decided that this initial gradation should be kept rather than
altering it to fit within the ideal range as this was believed to simulate the field gradation. Figure
1 displays the combined gradations for each mixture, along with this recommended minimum
and maximum.

7
FIGURE 1. FDR Mixture Gradation Prior to selecting the optimum asphalt emulsion content (OEC), several material
properties were determined for the unbound mixtures. These properties, along with the test
methods followed, are displayed in Table 2. According to the mix design, moisture-density
relationships were determined using ASTM D1557 Method C, which gave the optimum moisture
content (OMC) and the maximum dry density (MDD). The sand equivalency (SE) was also
required by the mix design, along with the average annual rainfall, to determine what percentage
of the OMC should be added when fabricating emulsion stabilized samples. The Atterberg
Limits were determined as required inputs for the MEPDG and to allow for further material
characterization and comparison of the mixtures. The Attergberg Limits, which were found
according to ASTM D4318, include the Liquid Limit, Plastic Limit, and Plasticity Index and are
used to classify soils and distinguish the boundaries of the consistency states of plastic soils. The
Liquid Limit was found by spreading a portion of each unstabilized mixture in a brass cup,
0
10
20
30
40
50
60
70
80
90
100
0.0 0.5 1.0 1.5 2.0 2.5 3.0 3.5 4.0 4.5
Cumulative Percent Passing, %
Sieve Size (mm^0.45)
Highway 5
Highway 36
Maximum Recommended
Sharp's Quarry Mix
Minimum Recommended

8
dividing it in two using a grooving tool, and then counting the number of drops of this cup it
takes until the specimen flowed together. The liquid limit is then the moisture content at which
this happens. The Plastic Limit is determined by taking the specimen at the water content of the
liquid limit and rolling it into 1/8-inch diameter threads and continuing this process until those
threads crumble. The Plastic Limit is the water content at the point of crumbling. Plasticity
Index is then the difference between the Liquid Limit and the Plastic Limit.
TABLE 2. Unbound Mixture Properties
Property Test Method Sharp's Quarry Mix Highway 5 Highway 36
Plasticity Index ASTM D4318 Non-plastic 12 12 Liquid Limit Non-plastic 28 27
OMC (%) ASTM D1557 5.0 5.5 4.75 MDD (pcf) 121 132 130
% Passing No. 200 Sieve ASTM D6913 6.85 6 9 Sand Equivalent ASTM D2419 90 22 21
The Asphalt emulsion used was provided by Ergon, Inc. This is a cationic medium set
emulsion, referred to as CIR-EE, made using a base binder of PG 64-22. The residue for this
asphalt emulsion was obtained according to AASHTO PP72, and this emulsion was 63% asphalt
binder. The asphalt emulsion was poured into an aluminum tray and placed in an oven at 140°F
for six hours. At the end of that six hours, the remaining asphalt binder was weighed to
determine the final emulsion residue. A Dynamic Shear Rheometer (DSR) was used to
determine the rheological properties of the emulsion residue (AASHTO T315). The 25-mm
parallel plate geometry on the DSR was used for this testing configuration, which is displayed in
Figure 2.

9
FIGURE 2. Determination of Rheological Properties of Asphalt Emulsion using DSR (Photo taken by S. Smith)
These properties, including the dynamic shear modulus (G*) and the phase angle (δ),
were found over a range of temperatures at a strain rate of 12% and are displayed in Table 3.
According to Table 1 of ASTM D6373, the rheological properties of PG 64-22 binders should be
tested at 147.2°F using a DSR. Minimum values of the parameter G*/sin(δ) are specified for all
original and rolling thin film oven (RTFO) aged binders. For the original PG 64-22 binder, the
G*/sin(δ) value should be above 1.0 kPa, and for the RTFO aged binder, this value should be
above 2.2 kPa. The procedure for obtaining the asphalt emulsion residue simulates RTFO aging,
so the G*/sin(δ) value at 147.2°F for this emulsion residue should be greater than 2.2 kPa.
Although the emulsion residue was not tested at exactly 147.2°F, the G*/sin(δ) value at 145°F is
2.18 kPa. Therefore, the value of this parameter falls slightly below the recommended minimum
for the emulsion residue.
10
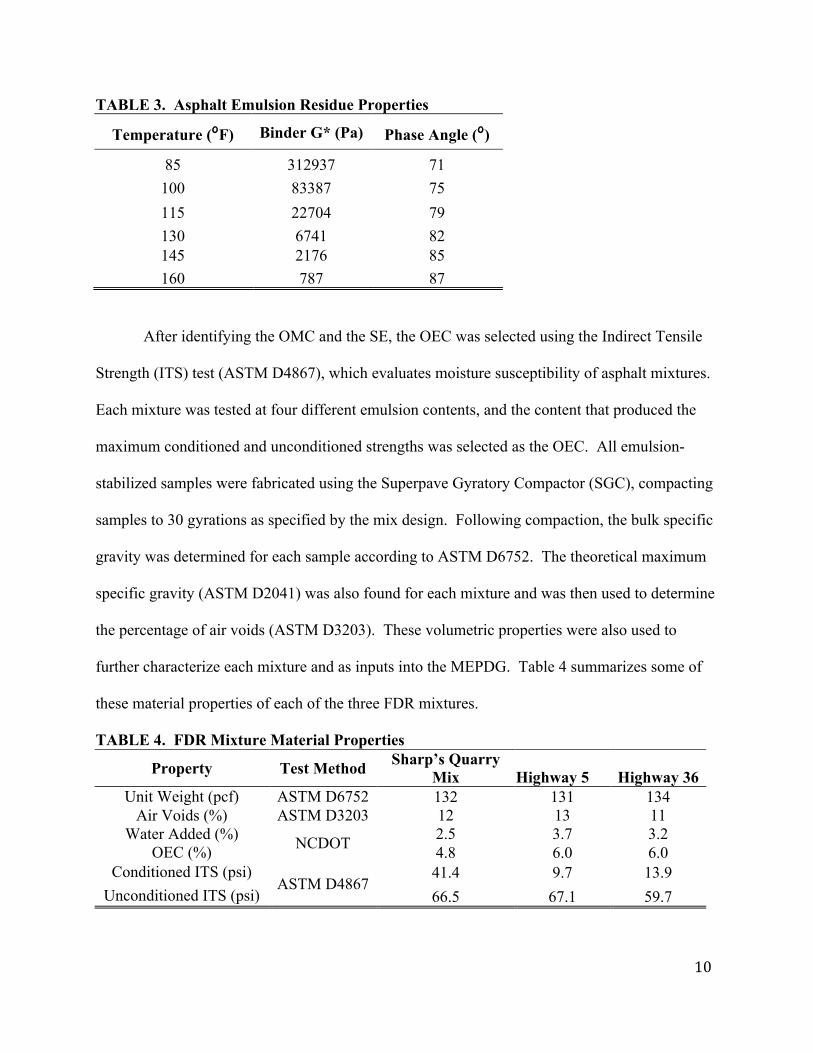
TABLE 3. Asphalt Emulsion Residue Properties
Temperature (⁰F) Binder G* (Pa) Phase Angle (⁰) 85 312937 71 100 83387 75 115 22704 79 130 6741 82 145 2176 85 160 787 87
After identifying the OMC and the SE, the OEC was selected using the Indirect Tensile
Strength (ITS) test (ASTM D4867), which evaluates moisture susceptibility of asphalt mixtures.
Each mixture was tested at four different emulsion contents, and the content that produced the
maximum conditioned and unconditioned strengths was selected as the OEC. All emulsion-
stabilized samples were fabricated using the Superpave Gyratory Compactor (SGC), compacting
samples to 30 gyrations as specified by the mix design. Following compaction, the bulk specific
gravity was determined for each sample according to ASTM D6752. The theoretical maximum
specific gravity (ASTM D2041) was also found for each mixture and was then used to determine
the percentage of air voids (ASTM D3203). These volumetric properties were also used to
further characterize each mixture and as inputs into the MEPDG. Table 4 summarizes some of
these material properties of each of the three FDR mixtures.
TABLE 4. FDR Mixture Material Properties
Property Test Method Sharp’s Quarry Mix Highway 5 Highway 36
Unit Weight (pcf) ASTM D6752 132 131 134 Air Voids (%) ASTM D3203 12 13 11
Water Added (%) NCDOT 2.5 3.7 3.2 OEC (%) 4.8 6.0 6.0
Conditioned ITS (psi) ASTM D4867
41.4 9.7 13.9 Unconditioned ITS (psi) 66.5 67.1 59.7

11
Laboratory Tests
The MEPDG uses different material properties to characterize asphalt concrete than it does for
unbound granular materials. For asphalt concrete (AC), the structural characterization is done
primarily with the dynamic modulus (E*). Asphalt binder properties including the complex shear
modulus (G*) and the phase angle (δ) are required for rutting predictions. Additionally, low
temperature cracking is predicted using the indirect tensile strength at 14°F and the creep
compliance at a series of loading times and temperatures. Unbound granular materials (UGM),
however, are characterized primarily by the resilient modulus (Mr). In order to create MEPDG
models using the highest, most site-specific level of inputs, laboratory tests were completed to
determine all of these material properties. Three replicates were used for every test in order to
ensure representative and statistically reliable values were collected. Table 5 summarizes the
tests completed in this research, as well as the layer type that required this input and the
specification followed.
TABLE 5. Material Characterization Testing Summary FDR as AC
Asphalt Mixture
Dynamic Modulus AASHTO TP-62 Dynamic Modulus (IDT) Kim et al., 2004 Creep Compliance AASHTO T322 IDT Strength
Asphalt Binder Complex Shear Modulus AASHTO T315 Phase Angle
FDR as UGM Resilient Modulus AASHTO T307
Sample Fabrication
One of the difficulties with completing asphalt concrete laboratory tests on FDR materials is
fabricating samples and cutting, coring, or compacting them to the required dimensions.
Because these mixtures are not as stable as asphalt concrete and have larger aggregate, even after

12
curing, they are often damaged or destroyed in the cutting process. Therefore, FDR samples
were frozen prior to cutting to make the material stiffer and help ensure a smoother cut surface.
According to research completed by Robinette and Williams, there is no statistical difference
between dynamic modulus values for specimens compacted to the testing dimensions and
specimen cut/cored to these dimensions (2006). Therefore, rather than coring these mixtures,
samples were compacted in a 4-inch diameter SGC mold for both the uniaxial dynamic modulus
test and the resilient modulus test. Figure 3 shows examples of samples of each FDR mixture
used for resilient modulus testing and testing in the indirect tension configuration after being
compacted and cut to the designated sample size.
FIGURE 3. Samples Fabricated for Laboratory Testing (Photo taken by S. Smith)
Some uncertainty arises with compacting samples to a particular height, however,
because the NCDOT mix design for FDR as well as other mix designs reviewed recommend a
13
fixed 30 gyrations rather than a target percentage of air voids (NCDOT; Thomas & May, 2007).
This is another aspect of the characterization of FDR that gives rise to the question of whether
procedures typical for soils should be followed or those typical of asphalt concrete. When
compacting soils, or unbound granular materials, proctor compaction is used, which prescribes a
fixed number of blows of the hammer over a specific number of layers. Whereas, in the
compaction of asphalt concrete, a target percentage of air voids is set and the number of
gyrations is changed to reach that density. When compacting FDR samples of different heights
for this research, the same 30 gyrations were used for all samples in order to consistently follow
the mix design recommendations. Although, these taller samples had a higher percentage of air
voids than the shorter samples, as would be expected. Further research should explore the
influence of air voids in FDR mixtures and what the target of compaction should be, whether that
be a fix number of gyrations or a target percentage of air voids.
Another challenge experienced in this research regarding sample fabrication was the
limited amount of field material available from Highway 5 and Highway 36. Because these
materials were sampled from sections of these highways, it was necessary to be conservative
with the materials available. One way in which this was accomplished was by performing the
dynamic modulus test on samples in the indirect tension (IDT) configuration as developed by
Kim et al., rather than the typical uniaxial configuration. This research presented a modified
procedure for completing dynamic modulus using the IDT method, and when compared to the
original uniaxial method, the dynamic modulus master curves were found to be in good
agreement (Kim et al., 2004). Using this configuration allowed for the same samples to be used
to find creep compliance, dynamic modulus, and indirect tensile strength. This method of using

14
a testing suite for limited field materials was validated by research completed by Wagoner et al.
(2006).
Asphalt Concrete Characterization Tests
Three different laboratory tests were completed on each of the FDR mixtures to obtain the
material properties necessary for asphalt concrete characterization in the MEPDG. These tests
included the dynamic modulus, the IDT creep compliance, and the IDT strength. As mentioned
previously, for the sake of material conservation, the dynamic modulus test was performed in the
IDT configuration as well. Therefore, all three tests could be performed on the same three
replicate samples, as both the dynamic modulus and creep compliance are non-destructive tests.
The dynamic modulus test was performed according to the procedure outlined by AASHTO TP-
62 with the modifications presented by Kim et al. (2004). This involved testing each sample at
six different frequencies (25, 10, 5, 1, 0.5, and 0.1 Hz) and five different temperatures (14, 40,
70, 100, and 130°F), beginning with the highest frequency and lowest temperature. A master
curve was then generated for each mixture, with 70°F as the reference temperature, plotting
dynamic modulus against reduced frequency. Because there was not a restriction on material for
the Sharp’s quarry mix, dynamic modulus was performed in both the uniaxial and IDT
configurations in order to confirm the findings from Kim et al., for this type of material. Creep
compliance and indirect tensile strength are used for low-temperature performance predictions
by the MEPDG. The creep compliance was performed at -4, 14 and 32°F, while the indirect
tensile strength was only measured at 14°F, as prescribed by AASHTO T322.

15
Unbound Granular Material Characterization Tests
The primary characterization for unbound materials is done with the resilient modulus. This test
was completed according to AASHTO T307 for base materials. The confining pressure was
applied using the house air pressure at the University of Arkansas Engineering Research Center
and the air pressure board shown in Figure 4(a). As previously discussed, material was limited
for the Arkansas highway mixtures; so 4-inch diameter samples were tested, rather than the
recommended 6-inch diameter samples. This sample size did not adhere to the minimum
diameter of five times the maximum particle size required by AASHTO T307, which would have
required a minimum sample diameter of 5-inches. However, there was not enough material
available from Highway 5 and Highway 36 to fabricate 6-inch diameter by 12-inch tall samples
to adhere to these requirements. Additionally, performing this test in a smaller triaxial cell did
not require the removal of the environmental chamber from the MTS loading frame used to
perform these tests; whereas, using the larger triaxial cell would have been impossible with the
environmental still in place. Figure 4(b) displays this testing configuration with the triaxial cell
placed inside the environmental chamber.
FIGURE 4. Resilient Modulus Testing Configuration (Photo taken by S. Smith)

16
MEPDG Models
In order to observe the effects of considering FDR as asphalt concrete versus considering it as an
unbound granular material on the performance of the pavement structure, two different MEPDG
models were created for each of the three FDR mixtures. The material properties that were
determined from laboratory tests were used in conjunction with some properties that were left as
default values, Arkansas climate data, and traffic data from each of the Arkansas highways
selected. The same structural design, with the exception of the FDR layer itself, was used for
each of these models. The surface layer was assumed to be a 1-inch asphalt concrete layer,
characterized by all of the default properties. A 1-inch layer was selected because this is the
minimum layer thickness allowed by the MEPDG software, and will allow for the FDR layer to
have the largest influence on the simulations. The subgrade material was selected as the default
A-2-6 soil given by the software because this was the type of subgrade soil collected for both
Highway 5 and Highway 36. And as mentioned previously, an 8-inch FDR layer was placed in
between this surface and subgrade. Figure 5 diagrams these structures as entered into the
MEPDG, for both FDR as asphalt concrete and FDR as an unbound granular material.
1" Asphalt Concrete
1" Asphalt Concrete
8" FDR as Asphalt Concrete
8" FDR as Unbound Granular Material
A-2-6 Subgrade Soil
A-2-6 Subgrade Soil
FIGURE 5. Diagram of FDR Structural Design

17
Some material properties were left as the default values given by the software due to
inability or impracticality of completing the laboratory tests necessary to determine these values.
These properties left as default values include the asphalt concrete thermal properties as well as
the coefficient of lateral earth pressure and the saturated hydraulic for the unbound granular
materials. Poisson’s ratio was also left as the default value of 0.35 due to difficulty in measuring
this value from the tests performed.
Traffic data was obtained for the sampled sections of each highway from the Arkansas
State Highway and Transportation Department (AHTD). The data collected was based on
necessary inputs for the MEPDG traffic predictions as well as availability of the information to
AHTD. Information regarding the number and types of trucks traveling along these sections of
highway was of particular interest, including the overall percent of trucks, the two-way annual
average daily truck traffic (AADTT), and the vehicle class distribution. Table 5 summarizes this
data for each of the two highways.
TABLE 5. Arkansas Highway 5 and Highway 36 Traffic data Traffic Data Highway 5 Highway 36 Two-Way AADTT 460 24 Number of Lanes 2 2 % Trucks in Design Lane 50 50 % Trucks in Design Direction 80 80 Growth Rate (%) 0.0 1.6 Overall % Trucks 10 5
Vehicle Class Distribution (% of Trucks) Class 4 5.26 26.09 Class 5 11.58 32.61 Class 6 16.84 6.52 Class 7 4.21 2.17 Class 8 11.58 8.70 Class 9 47.37 23.91 Class 10 3.16 0.00 Class 11 0.00 0.00 Class 12 0.00 0.00 Class 13 0.00 0.00 Class 14 0.00 0.00
18
An educational version of AASHTO’s Pavement ME software was used, so the climate
files available for performance predictions were limited. Therefore, Fayetteville, Arkansas was
selected in order to closely simulate the climate in which the FDR sections would be constructed
in Arkansas.
RESULTS AND DISCUSSION
The objective of this research was to evaluate the effectiveness of the existing MEPDG software
for the design of asphalt stabilized FDR by comparing the effects of considering this type of
FDR as an asphalt concrete material versus considering it as an unbound granular material. This
was completed by obtaining all material properties necessary for both types of characterization
and then creating the MEPDG models for both layer types and each FDR mixture.
Material Characterization
Asphalt Concrete Characterization
The characterization of FDR as an asphalt concrete material included the dynamic modulus,
creep compliance, IDT strength, and rheological properties of the asphalt emulsion residue. The
dynamic modulus test was performed on all three mixtures in the IDT configuration and in the
traditional uniaxial configuration for the Sharp’s Quarry Mix. The master curves created for
each of these tests are displayed in figure 6. Because asphalt concrete is a viscoelastic material,
the temperature of the material and the time or frequency of loading affects its stiffness. The
dynamic modulus evaluates the stiffness at a number of different temperatures and frequencies,
which can then be used to generate the master curve that predicts a mixture’s stiffness in any
temperature or under any frequency. From this graph, it is evident that Sharp’s Quarry Mix
19
completed in the uniaxial configuration yielded the highest E* values at higher frequencies.
There is a large gap in the stiffnesses of this mixture when performed in the two different
configurations. The exact reason for this could not be determined, however, it may be a function
of the geometry and FDR not performing as well in a tensile configuration as a typical asphalt
concrete mix. Another reason for this difference may be that FDR has a larger nominal
maximum aggregate size (NMAS), therefore, the smaller IDT samples may allow for more
influence from the specific aggregate sizes in each cut. It is also interesting to note that all of the
master curves seem to converge near 0.01 Hz and all nearly reach 0 as the reduced frequency
approaches 0. This result was not surprising because during testing, all three mixtures became
very difficult to handle at the warmest temperatures. Metal gauge points, which are glued onto
the samples, fell off very easily or were pulled off of the samples with the extensometers at the
warmest temperatures, which showed that the glue was stronger than the cohesion of the sample
itself. While all three mixes became noticeably softer at 130°F, the Sharp’s Quarry Mix samples
were the most difficult to test at this temperature. This was interesting given that this mixture
was also the stiffest at the colder temperatures.

20
FIGURE 6. Dynamic Modulus Master Curves
Low temperature characterization for the FDR mixtures was done using the creep
compliance and the IDT strength at 14°F. In general, the higher the creep compliance and IDT
strength, the greater resistance the mix has to thermal cracking (Apeagyei and Diefenderfer,
2011). Figure 7 shows the creep compliance values at six different loading times (2, 5, 10, 20,
50, and 100 seconds) as required by the MEPDG for inputs. The Sharp’s Quarry Mix had the
highest creep compliance values for all temperatures with the exception of a few loading times at
32°F, as shown in Figure 7(a). Highway 5, displayed in Figure 7(b), had similar creep
compliance values to the Sharp’s Quarry Mix for 32°F; however, at 14°F and -4°F, it drops
lower than those for the quarry mix. Highway 36 had the lowest creep compliance values
overall, which are displayed in Figure 7(c), but the values at -4°F were very similar to those of
Highway 5. During creep compliance testing, the question arose as to whether the viscoelastic
limits given in AASHTO T322 could be applied to FDR given that those are based upon asphalt
concrete materials. No cracks were found in these samples during or after testing and strains
were kept in the lower end of the allowable range. However, further research should be
0
200000
400000
600000
800000
1000000
1200000
0.000001 0.001 1 1000 1000000 1E+09
E* (psi)
Reduced Frequency (Hz)
Sharp's Quarry Mix-‐Uniaxial Sharp's Quarry Mix-‐IDT Highway 36-‐IDT Highway 5-‐IDT

21
completed to investigate whether this range is appropriate for FDR materials as well as asphalt
concrete materials.
a) Sharp’s Quarry Mix b) Highway 5
c) Highway 36
FIGURE 7. Creep Compliance by FDR Mixture: a) Sharp’s Quarry Mix; b) Highway; c) Highway 36
The IDT strength of each mixture at 14°F did not follow the same trend that the creep
compliance did. Although, the ranking of IDT strengths for the three mixtures is the same as that
of the stiffness as predicted by the dynamic modulus. Sharp’s Quarry Mix had the highest
results for all three tests; however, for dynamic modulus and IDT strength, Highway 36 had
0
1000
2000
3000
4000
5000
0 50 100 150
Creep Compliance (1/psi)
Loading Time (s)
32F
14F
-‐4F
0
1000
2000
3000
4000
5000
0 50 100 150 Creep Compliance (1/psi)
Loading Time (s)
32F
14F
-‐4F
0
1000
2000
3000
4000
5000
0 50 100 150
Creep Compliance (1/psi)
Loading Time (s)
32F
14F
-‐4F

22
higher stiffness and strength values than Highway 5. Whereas, for creep compliance, Highway 5
had higher values than Highway 36. Table 6 lists the strength values determined for each
mixture.
TABLE 6. IDT Strength at 14°F Sharp's Quarry Mix 201.2 psi Highway 5 125.5 psi Highway 36 163.6 psi
Unbound Granular Material Characterization
The resilient modulus serves as the primary strength and stiffness characterization for the
unbound granular materials. This property is obtained on base or subbase soils in a fifteen
different stress states to allow for the prediction of the stiffness of a soil material in any stress
state. Typically, unbound granular materials are assumed to be stress-dependent, or stress
hardening, materials. This means that as the stress state increases, the stiffness or modulus
increases as well (NCHRP, 2004). Figure 8 shows the relationship between bulk stress, which is
calculated by summing the confining stresses and the cyclic axial stress applied in each loading
sequence of the resilient modulus test, and the resilient modulus. As seen in figures 8(a) and
8(b), the resilient modulus values for the Sharp’s Quarry Mix and Highway 5, respectively, were
not as significantly affected by the increase in stress state as a typical unbound granular material.
23
a) Sharp’s Quarry Mix b) Highway 5
c) Highway 36
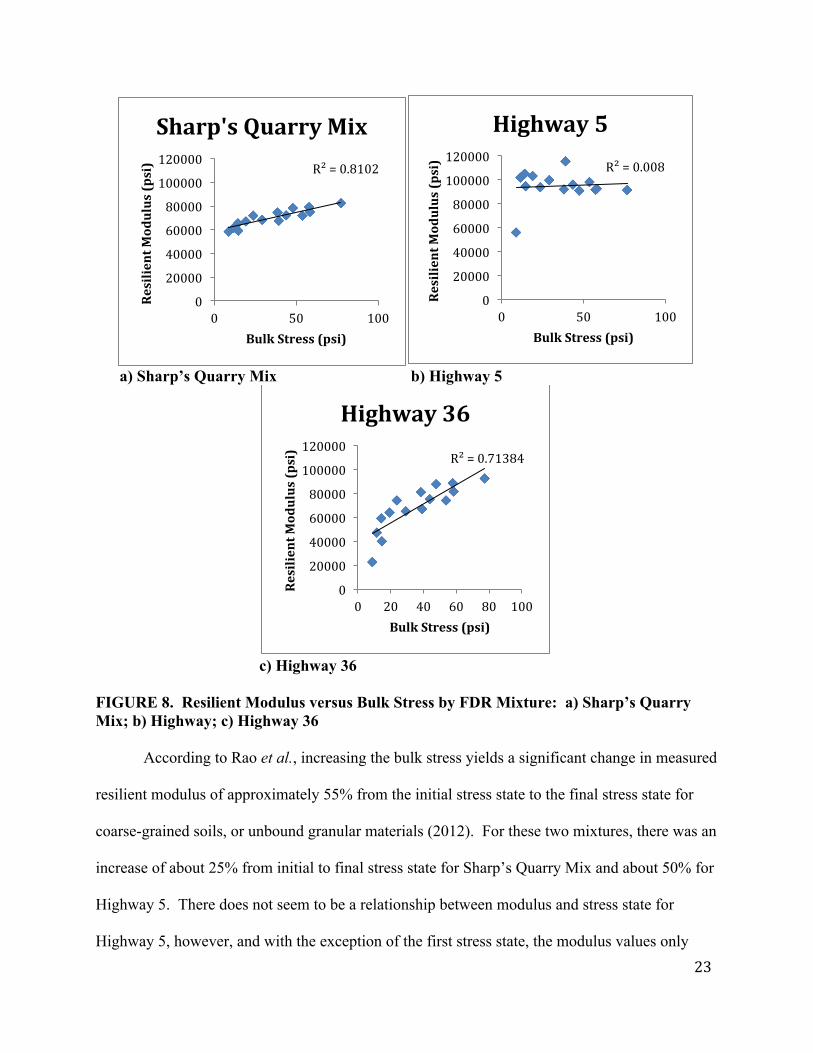
FIGURE 8. Resilient Modulus versus Bulk Stress by FDR Mixture: a) Sharp’s Quarry Mix; b) Highway; c) Highway 36
According to Rao et al., increasing the bulk stress yields a significant change in measured
resilient modulus of approximately 55% from the initial stress state to the final stress state for
coarse-grained soils, or unbound granular materials (2012). For these two mixtures, there was an
increase of about 25% from initial to final stress state for Sharp’s Quarry Mix and about 50% for
Highway 5. There does not seem to be a relationship between modulus and stress state for
Highway 5, however, and with the exception of the first stress state, the modulus values only
R² = 0.8102
0
20000
40000
60000
80000
100000
120000
0 50 100
Resilient Modulus (psi)
Bulk Stress (psi)
Sharp's Quarry Mix R² = 0.008
0
20000
40000
60000
80000
100000
120000
0 50 100
Resilient Modulus (psi)
Bulk Stress (psi)
Highway 5
R² = 0.71384
0
20000
40000
60000
80000
100000
120000
0 20 40 60 80 100
Resilient Modulus (psi)
Bulk Stress (psi)
Highway 36

24
change by about 20% through the various stress states. In Figure 8(c), Highway 36 shows a
stronger, positive correlation between modulus and stress state, similar to Sharp’s Quarry Mix.
Although, the moduli of this mixture are much more strongly influenced by bulk stress than the
other two FDR mixtures, as there is an increase in resilient modulus of about 76% from the
initial stress state to the final stress state, which is much more typical of unbound granular
materials.
Initially, the MEPDG used a generalized constitutive model to predict the stiffness in any
stress state after fitting it to the laboratory calculated resilient modulus values using a nonlinear
regression analysis. Three regression constants were then used as the level 1 input into the
MEPDG. However, the Pavement ME software, as was used in this research, does not allow for
this level of input. Because a level 1 analysis was not possible, an average resilient modulus
value was calculated for each mixture to be used as a representative annual value for a level 2
analysis. These representative annual values are summarized in Table 7. It’s interesting to note
that the relative stiffness when comparing the three mixtures does not match the trend seen in
dynamic modulus values for these mixtures. In the case of resilient modulus, Highway 5 had the
highest value, whereas, Sharp’s Quarry Mix had the highest dynamic modulus values, followed
by Highway 36 and then Highway 5.
TABLE 7. Average Annual Representative Resilient Modulus Values Sharp's Quarry Mix 70176 Highway 5 94876 Highway 36 68067
The modulus values of two of the FDR mixtures did not vary with stress state as would
typically occur for unbound granular materials; although, the modulus of Highway 36 behaved
much more like an unbound granular material. However, because all mixtures are stabilized with

25
asphalt emulsion, they are more resistant to moisture than an unbound material would be.
Unfortunately, without the level 1 analysis as an option, the MEPDG models for unbound
granular materials automatically vary the resilient modulus based upon stress state and moisture,
as determined by the traffic and climate data. Therefore, both Sharp’s Quarry Mix and
Highway 5 were forced to behave as unbound granular materials, which the resilient modulus
results proved to be incorrect. This may then yield inaccurate performance predictions by the
MEPDG because the modulus of the material is being incorrectly modeled. According to
NCHRP 1-47, asphalt concrete only rutting, total rutting, and top-down fatigue cracking are all
sensitive to the resilient modulus. Bottom-up fatigue cracking is very sensitive to the resilient
modulus, and thermal cracking is not sensitive to the resilient modulus (Schwartz et al., 2011).
So all but one of these distress predictions is significantly affected by the modulus, making
inaccurate modeling of the modulus for Sharp’s Quarry Mix and Highway 5 a significant
consideration when evaluating these results.
Comparing Material Types
As previously discussed, FDR is a unique material because during the recycling process, a
composite material is created that combines RAP, granular base material, and some of the
subgrade soil. Therefore, it is not exactly an asphalt concrete material, nor is it a completely
unbound granular material. So when considering the material characterization of this new type
of material, it is important to understand what most significantly affects the performance of each
of these types of materials and then determine where FDR may fit between the two. Asphalt
concrete is a viscoelastic material; therefore, temperature and the time or frequency at which a
load is applied most significantly affect the stiffness and strength. Soils or unbound granular

26
materials are non-linear materials, and the strength or stiffness of these materials is most
significantly influenced by stress state and moisture (NCHRP, 2004). The dynamic modulus and
resilient modulus evaluate the stiffness of asphalt concrete and unbound granular materials,
respectively, as it is affected by these most significantly influential factors. Distress predictions
by the MEPDG are equally sensitive to the two types of moduli in a pavement structure,
according to NCHRP 1-47 (Schwartz et al., 2011). In the case of FDR then, to select which
modulus value may be of more interest. Both the dynamic modulus and the resilient modulus are
a measure of stress divided by recoverable strain. In order to compare these modulus values to
evaluate whether the moduli of FDR is more significantly influenced by temperature or stress
state, the correlation between dynamic modulus at10 Hz and temperature were compared to the
correlation of the resilient modulus with bulk stress. While the modulus at all five temperatures
was considered, only the dynamic modulus values at 10 Hz were used because this frequency
most closely simulates the loading frequency of the resilient modulus test, and this helps isolate
the influences of temperature and stress state on modulus. These correlation values are
summarized in Table 8. Based upon these values, it is evident that there is a stronger correlation
between temperature and modulus than for bulk stress and modulus. This gives evidence to the
belief that FDR mixtures may be most accurately characterized as a less aged asphalt concrete
(You et al., 2012).
TABLE 8. Correlation Between Moduli and Temperature vs. Moduli and Bulk Stress Sharp's Quarry Mix Highway 5 Highway 36 Temperature -0.988 -0.984 -0.965 Bulk Stress 0.900 0.089 0.845

27
MEPDG Results
Once all of the necessary material properties were obtained, the MEPDG models were created
using the structural design, climate files, and traffic data mentioned in the previous section.
Because the Sharp’s Quarry Mix had no traffic of its own, this material was modeled under both
Highway 5 and Highway 36 traffic. This also allows for the evaluation of the influence of traffic
on one of the FDR mixtures. Because all of these models were created as a new flexible
pavement within the MEPDG, there were six different distresses as the performance criteria:
International Roughness Index (IRI), Total Rutting, Asphalt Concrete Rutting, Bottom-Up
Fatigue Cracking, Top-Down Fatigue Cracking, and Thermal Cracking. Table 9 summarizes all
of these distress predictions for each of the three mixtures and both layer types.
TABLE 9. Summary of MEPDG Distress Predictions FDR as AC
Distress SQM (5) SQM (36) HWY 5 HWY 36 IRI (in/mi) 138.3 125.01 148.36 125.69 Total Rutting (in) 0.4 0.2 0.52 0.22 AC Rutting (in) 0.11 0.03 0.2 0.04 Fatigue Cracks (BU) (%) 21.81 1.37 32.79 1.31 Fatigue Cracks (TD) (ft/mi) 205.8 170.49 730.34 174.7 Thermal Cracks (ft/mi) 18.19 18.19 18.19 18.19
FDR as UGM Distress SQM (5) SQM (36) HWY 5 HWY 36 IRI (in/mi) 143.99 132.94 164.12 163.85 Total Rutting (in) 0.65 0.39 1.15 1.11 AC Rutting (in) 0.03 0.01 0.49 0.13 Fatigue Cracks (BU) (%) 0.96 0.95 0.95 0.95 Fatigue Cracks (TD) (ft/mi) 644.84 199.03 1173.5 363.38 Thermal Cracks (ft/mi) 18.19 18.19 18.19 18.19
In order to compare the effects of considering these three FDR mixtures as an AC versus
as UGM, the final distress predictions from each MEPDG model were plotted against one
another as shown in Figure 9 through Figure 11. It is important to note that because the
materials in an FDR mixture will vary significantly depending on the in-situ materials and the

28
stabilization technique selected, these results may not be the same for all FDR mixtures. Rather,
it is interesting to observe the general trends and how material characterization affects the
performance predictions by the MEPDG. Overall, the distress predictions were higher when
FDR was considered to be an unbound granular material, with the exception of bottom-up
fatigue cracking and asphalt concrete only rutting for the Sharp’s Quarry Mix.
The IRI predictions were the most similar for all mixes and layer types. Figure 9 displays
this trend with all four data points located close to the line of equality. When considered as an
UGM, the two highway mixtures and the quarry mixture with both sets of traffic data had similar
IRI predictions. However, when FDR was considered as an AC layer, the IRI predictions were
more similar for the models with the same traffic data, rather than the same materials.
FIGURE 9. IRI Predictions for FDR as AC vs. FDR as UGM (in/mi)
Figure 10 (a) and 10 (b) compare the total rutting and asphalt concrete only rutting
predictions, respectively. By considering both the total rutting and the AC rutting, the amount of
rutting that occurs in the FDR layer and the subgrade can be isolated for the MEPDG models that
consider FDR as an UGM. For both AC rutting and total rutting, the Sharp’s Quarry mixture
predictions were close to the line of equality. It is interesting to note that the Sharp’s Quarry
0
50
100
150
200
0 50 100 150 200
FDR as UGM
FDR as AC
SQM (HWY 5) SQM (HWY 36) HWY 5 HWY 36

29
mixture AC only rutting predictions were higher for FDR as AC than they were for FDR as
UGM, which is one of the only distresses for which this occurs. Additionally, the FDR as UGM
models failed in total rutting for the two highway mixtures because the total rutting predictions
were higher than the limit of 0.75-inches. This prediction may not be accurate, however,
because considering FDR as an UGM does not account for the added stability of the asphalt
emulsion in the mix.
a) Total Rutting (in) b) AC Rutting (in) FIGURE 10. Rutting Predictions for FDR as AC vs. FDR as UGM: a) Total Rutting (in); b) AC Rutting (in) The two types of fatigue cracking evaluated by the MEPDG are bottom-up and top-down
fatigue cracking. Both occur due to a weakening of the asphalt concrete layer as it is subjected
to repeated loads over time. This creates tensile strains either in the top of the asphalt concrete
layer, for top-down cracking, or in the bottom of the asphalt concrete layer, for bottom-up fatigue
cracking, that lead to cracks in the material. Bottom-up fatigue cracking predictions were the
only ones that were consistently higher for all three mixtures when FDR was considered as AC.
This result was not expected as considering FDR as AC should yield a structure with more
tensile strength than considering FDR as UGM. In each of these models, the MEPDG is
0
0.4
0.8
1.2
1.6
0 0.4 0.8 1.2 1.6
FDR as UGM
FDR as AC
SQM (HWY 5) SQM (HWY 36) HWY 5 HWY 36
0
0.2
0.4
0.6
0 0.2 0.4 0.6
FDR as UGM
FDR as AC
SQM (HWY 5) SQM (HWY 36) HWY 5 HWY 36

30
evaluating a structure with 9-inches of asphalt concrete for FDR as AC against a structure with
only 1-inch of asphalt concrete for FDR as UGM. Therefore, the expected result would be that
there would be far more bottom-up fatigue cracking in the pavement structure with only 1-inch
of asphalt concrete. One reason for the higher bottom-up fatigue cracking predictions when
FDR was considered as AC is that the low tensile strength of the FDR mixtures allowed for more
cracks to start occurring at the bottom of this 8-inch FDR layer, which could then propagate up
to the surface course. Because fatigue cracking occurs due to repeated loads over time, it is
consistent to see such a significant difference in the distress predictions for the models with the
two different traffic volumes. Both Sharp’s Quarry Mix with Highway 5 traffic and the Highway
5 models considering FDR as AC had much higher percentages of bottom-up fatigue cracking
than the two models that used the lower, Highway 36 traffic data. Top-down fatigue cracking
had very similar values for FDR as AC except the Highway 5 mixture. In the case of top-down
cracking, traffic volume seemed to have a stronger influence on the distress predictions for FDR
as UGM.
a) Bottom Up Fatigue Cracking (%) b) Top Down Fatigue Cracking (ft/mi) FIGURE 10. Fatigue Cracking Predictions for FDR as AC vs. FDR as UGM: a) Bottom Up Fatigue Cracking (%); b) Top Down Fatigue Cracking (ft/mi)
0
5
10
15
20
25
30
35
0 5 10 15 20 25 30 35
FDR as UGM
FDR as AC
SQM (HWY 5) SQM (HWY 36) HWY 5 HWY 36
0
300
600
900
1200
1500
0 300 600 900 1200 1500
FDR as UGM
FDR as AC
SQM (HWY 5) SQM (HWY 36) HWY 5 HWY 36

31
As discussed previously, all MEPDG models for this research were run using the climate
data for Fayetteville, Arkansas. Thermal cracking predictions were the same for all three
mixtures, when considered as both AC and UGM, which was a value of 18.19 feet per mile.
Schwartz et al. found that thermal cracking predictions were not sensitive to traffic volume,
dynamic modulus, or resilient modulus. However, these predictions were sensitive to binder
stiffness, creep compliance, and tensile strength (Schwartz et al., 2011). Both creep compliance
and tensile strength varied significantly between mixtures, so it is interesting that thermal
cracking predictions remained the same for all. For further research, the effects of harsher
climates on thermal cracking should be evaluated for asphalt emulsion FDR mixtures.
CONCLUSIONS
While FDR has many potential benefits, there are some limitations due to lack of understanding
of material characterization and the structural design procedure. During the FDR process, a
composite material is created by combining RAP, granular base material, and some of the
subgrade soil. Therefore, it is absolutely essential that material characterization techniques, and
consequently, structural design procedures, are adapted and modified to allow for the
consideration of the unique capabilities this recycled, stabilized base course can provide within a
pavement structure. In this research, the structural design of asphalt emulsion FDR was
evaluated by considering this material as an asphalt concrete layer and as an unbound granular
material using the MEPDG software. These are some of the major conclusions:
32
• The modulus of asphalt emulsion FDR is more strongly correlated to temperature than
stress state; therefore, the dynamic modulus test may be of more interest to run on this
type of material than the resilient modulus test.
• All distress predictions were higher for FDR as UGM except for AC rutting in the
Sharp’s Quarry Mix and bottom-up fatigue cracking.
• Thermal cracking was the same for every model, regardless of material or layer type;
therefore, this distress is mostly affected by climate.
• Traffic volume seemed to influence all distresses more for FDR as AC than the mixture
properties, with the exception of thermal cracking and top-down fatigue cracking.
• Despite having the highest resilient modulus, all distress predictions for Highway 5 as
UGM were the largest. This is also interesting given the sensitivity of the MEPDG
performance predictions to resilient modulus.
• Overall, it is evident that considering asphalt emulsion FDR as AC versus considering
asphalt emulsion FDR as UGM significantly affects distress predictions by the MEPDG
for all distresses except thermal cracking.
FUTURE RESEARCH
Based upon the findings of this research, future research should include the following:
• Determine if the IDT configuration can be used for dynamic modulus testing on FDR
materials given the significant difference seen in these values for the Sharp’s Quarry Mix.
• Confirm that the viscoelastic range of asphalt concrete is the same for FDR or determine
what these limits actually are for FDR.

33
• Explore whether a fixed number of gyrations should be used for sample fabrication or if
there should be a target percentage of air voids.
• Explore the effects of the different layer types and methods of material characterization
on other FDR technologies, including asphalt foam, cement, and combinations of these.
Because a cement-stabilized base is already an option for material type within the
MEPDG, it would be interesting to see how the use of cement in FDR affects the results
found in this research.
34
REFERENCES AASTHO PP72-11, “Standard Practice for Recovering Residue from Emulsified Asphalt Using Low-Temperature Evaporative Techniques,” American Association of State and Highway Transportation Officials, 2013. AASTHO TP62-03, “Standard Method of Test for Determining Dynamic Modulus of Hot-Mix Asphalt Concrete Mixtures,” American Association of State and Highway Transportation Officials, 2005. AASTHO T307-99, “Standard Method for Determining the Resilient Modulus of Soils and Aggregate Materials,” American Association of State and Highway Transportation Officials, 2012. AASTHO T315-09, “Standard Method of Test for Determining the Rheological Properties of Asphalt Binder Using a Dynamic Shear Rheometer (DSR),” American Association of State and Highway Transportation Officials, 2009. AASTHO T322-07, “Standard Method of Test for Determining the Creep Compliance and Strength of Hot-Mix Asphalt (HMA) Using the Indirect Tensile Test Device,” American Association of State and Highway Transportation Officials, 2011. Apeagyei, A. and S. Diefenderfer. Asphalt Material Design Inputs for Use with the Mechanistic Empirical Design Guide. Report No. VCTIR 12-R6. Virginia Center for Transportation Innovation and Research, 2011. ASTM D1557-12, “Standard Test Methods for Laboratory Compaction Characteristics of Soil Using Modified Effort,” ASTM International, West Conshohocken, PA, 2012, www.astm.org. ASTM D2419-14, “Standard Test Method for Sand Equivalent Value of Soils and Fine Aggregate,” ASTM International, West Conshohocken, PA, 2014, www.astm.org. ASTM D3203-11, “Standard Test Method for Percent Air Voids in Compacted Dense and Open Bituminous Paving Mixtures,” ASTM International, West Conshohocken, PA, 2011, www.astm.org. ASTM D4318-10e1, “Standard Test Methods for Liquid Limit, Plastic Limit, and Plasticity Index of Soils,” ASTM International, West Conshohocken, PA, 2010, www.astm.org. ASTM D4867-09, “Standard Test Method for Effect of Moisture on Asphalt Concrete Paving Mixtures,” ASTM International, West Conshohocken, PA, 2014, www.astm.org. ASTM D6373-15, “Standard Specification for Performance Graded Asphalt Binder,” ASTM International, West Conshohocken, PA, 2015, www.astm.org.

35
ASTM D6752-11, “Standard Test Method for Bulk Specific Gravity and Density of Compacted Bituminous Mixtures Using Automatic Vacuum Sealing Method,” ASTM International, West Conshohocken, PA, 2011, www.astm.org. ASTM D6913-04(2009)e1, “Standard Test Methods for Particle-Size Distribution and Gradation of Soils Using Sieve Analysis,” ASTM International, West Conshohocken, PA, 2009, www.astm.org. Asphalt Recycling and Reclaiming Association. “Basic Asphalt Recycling Manual,” ARRA and the US Department of Transportation Federal Highway Administration, 2001. ASCE | 2013 Report Card for America's Infrastructure. Publication. American Society of Civil Engineers, 2013. Asphalt Academy. “Technical Guideline: Bitumen Stabilised Materials,” TG 2, Second Edition, 2009. Bowers, Benjamin F. “Agency Perspective on In-Place Recycling.” Proceedings of the AAPT-ISAP Forum of the Association of Asphalt Paving Technologists Annual Meeting, 2015. Butalia, T., Wolfe, W., and Kirch, J. “Structural Monitoring of Full-Scale Asphalt Pavements Reclaimed Using Class F Fly Ash.” Proceedings of World of Coal Ash (WOCA) Conference, 2011. Guide for Mechanistic-Empirical Design of New and Rehabilitated Pavement Structures. Report No. NCHRP 1-37A. National Cooperative Highway Research Program, 2004. Hill, R. and Braham, A. “Quantifying Timing of Return to Traffic for Asphalt Cement Based Full Depth Reclamation Mixtures in the Laboratory.” Accepted for publication in Journal of Testing and Evaluation, 2016. Kim, Y. Richard, Youngguk Seo, Mark King, and Mostafa Momen. “Dynamic Modulus Testing of Asphalt Concrete in Indirect Tension Mode.” Transportation Research Record 1891 (2004): 163-173. Mallick, Rajib, David Bonner, Richard Bradbury, Jamie Andrews, Prithvi Kandhal, and Edward Kearney. “Evaluation of Performance of Full-Depth Reclamation Mixes.” Transportation Research Record 1809.1 (2002): 199-208. Marquis, B., Peabody, D., Mallick, R., and Soucie, T. Determination of Structural Layer Coefficient for Roadway Recycling Using Foamed Asphalt. Maine Department of Transportation & Worcester Polytechnic Institute, 2003. May, Richard. “The Challenges to Innovation with the MEPDG-Case Study: Cold Recycled Mixtures.” Journal of the Association of Asphalt Paving Technologists 77 (2008): 985-1004.

36
NCDOT. “Asphalt Emulsion Full Depth Reclaiming and Stabilization,” North Carolina Department of Transportation, Standard Specifications, Section 612, 2012. Rao, C., L. Titus-Glover, B. Bhattacharya and M. I. Darter. User’s Guide: Estimation of Key PCC, Base, Subbase, and Pavement Engineering Properties from Routine Tests and Physical Characteristics. Report No. FHWA-HRT-12-031. Federal Highway Administration, 2012. Robinette, Christopher and Christopher Williams. The Effects of the Testing History and Preparation Method on Superpave Simple Performance Test. Proceedings of Technical Sessions of the Association of Asphalt Paving Technologists Annual Meeting, 2006. Schwartz, C. W., R. Li, S. H. Kim, H. Ceylan and K. Gopalakrishnan. Sensitivity Evaluation of MEPDG Performance Prediction. Report No. NCHRP 1-47. National Cooperative Highway Research Program, 2011. Stroup-Gardiner, Mary. Recycling and Reclamation of Asphalt Pavements Using In-Place Methods. NCHRP Synthesis 421. National Cooperative Highway Research Program, 2011. Stroup-Gardiner, Mary. “Selection Guidelines for In-Place Recycling Projects.” Transportation Research Record 2306 (2012): 3-10. Thomas, Todd W., May, Richard W. Mechanistic-Empirical Design Guide Modeling of Asphalt Emulsion Full Depth Reclamation Mixes. Transportation Research Board, 2007. Timm, D., M. Robbins, N. Tran and C. Rodenza. Recalibration Procedures for the Structural Asphalt Layer Coefficient in the 1993 AASHTO Pavement Design Guide. Report No. 14-03. National Center for Asphalt Technology, 2014. Wagoner, M., W. G. Buttlar, G. H. Paulino and P. Blankenship. “Laboratory Testing Suite for Characterization of Asphalt Concrete Mixtures obtained from Field Cores (With Discussion).” Journal of the Association of Asphalt Paving Technologists 75 (2006): 815-851. You, Zhanping, Yang, Xu, Yao, Hui, Goh, Shu Wei. Preliminary Study of Materials Effect of Cold In-Place and Full-Depth Reclamation Asphalt Concrete in Mechanistic-Empirical Pavement Design. ASCE, 2012.