Embed Size (px)
Citation preview
Comparing Live Missile Fire and Simulation
Rebecca Dickinson (Presenter)
Pamela Rambow (Presenter)
Douglas Peek
Science of Test Workshop
April 4 2017
Overview
2
Live missile fire testing is extremely limited due to test constraints and cost
– only 16 test events were executed.
Given the limited live test data, we can still perform a statistical analysis for
the M&S validation (Fisher’s Combined Test).
The M&S was used to supplement the live testing in the evaluation of the
weapon system.
Note: notional data is used in this briefing to illustrate the proof of concept
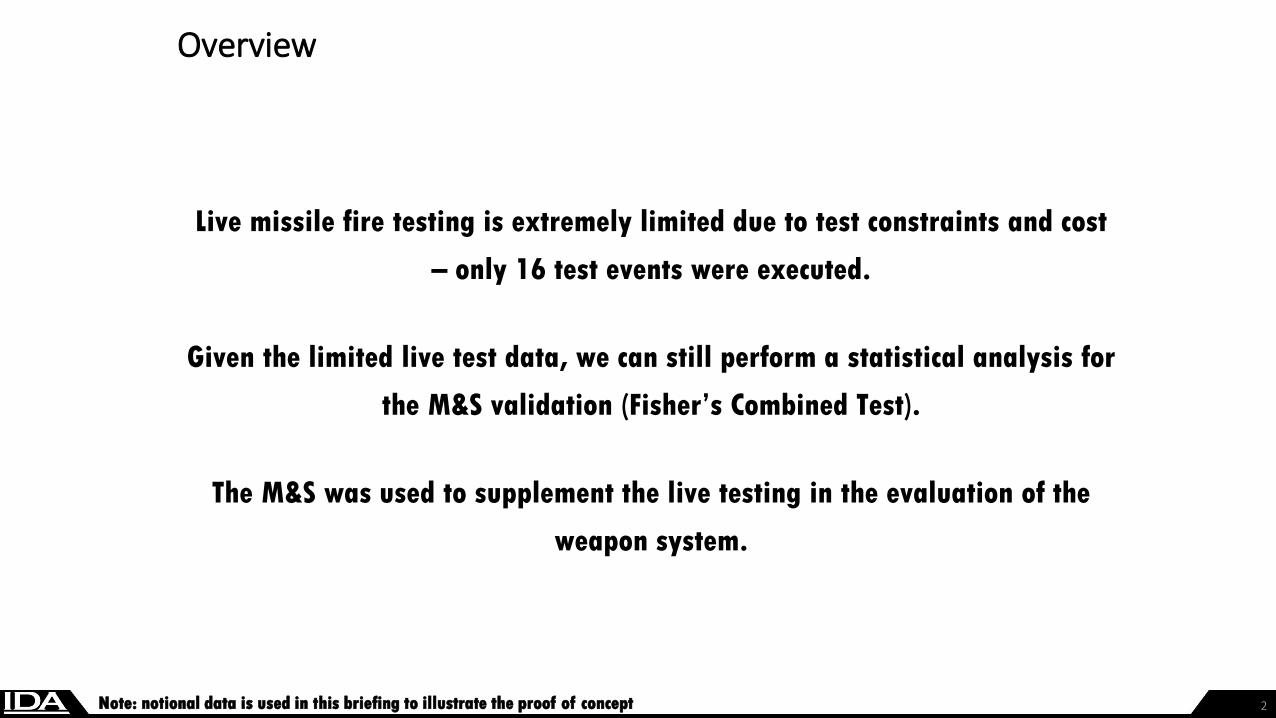
The Air Intercept Missile-9X (AIM-9X) is the principal U.S. short range air-to-air missile.
3
AIM-9X has an imaging infrared seeker with thrust vector propulsion and is
capable of high off-boresight engagements
Performance requirements for AIM-9X are expressed in terms of Probability of
Kill (PK), which is calculated with a six-degree-of-freedom (6DoF) simulation that
uses tactical code and simulated target and background environments.
The latest hardware version, Block II, with the latest software version, finished IOT&E
in 2015.
Only 16 Live Missile Fire Shots were executed.
A significant portion of the evaluation depended on M&S!
Images from AIM-9X seeker
4
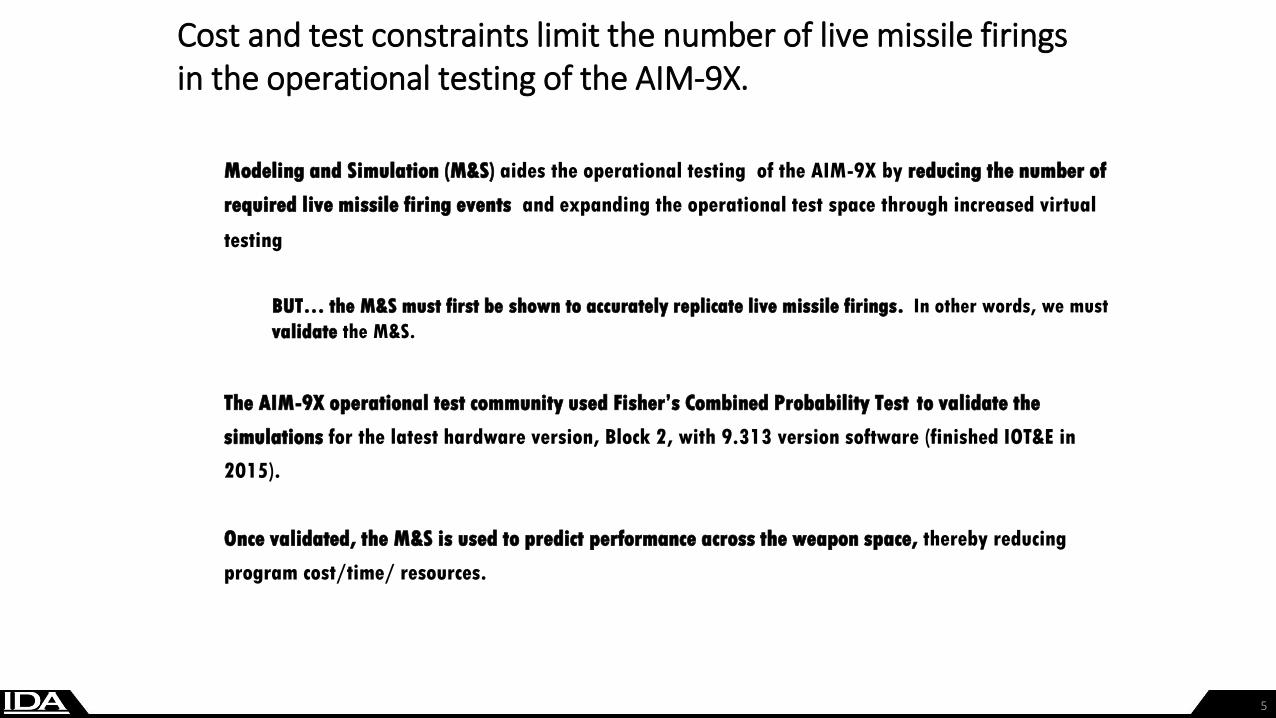
Cost and test constraints limit the number of live missile firings in the operational testing of the AIM-9X.
Modeling and Simulation (M&S) aides the operational testing of the AIM-9X by reducing the number of
required live missile firing events and expanding the operational test space through increased virtual
testing
BUT… the M&S must first be shown to accurately replicate live missile firings. In other words, we must
validate the M&S.
The AIM-9X operational test community used Fisher’s Combined Probability Test to validate the
simulations for the latest hardware version, Block 2, with 9.313 version software (finished IOT&E in
2015).
Once validated, the M&S is used to predict performance across the weapon space, thereby reducing
program cost/time/ resources.
5
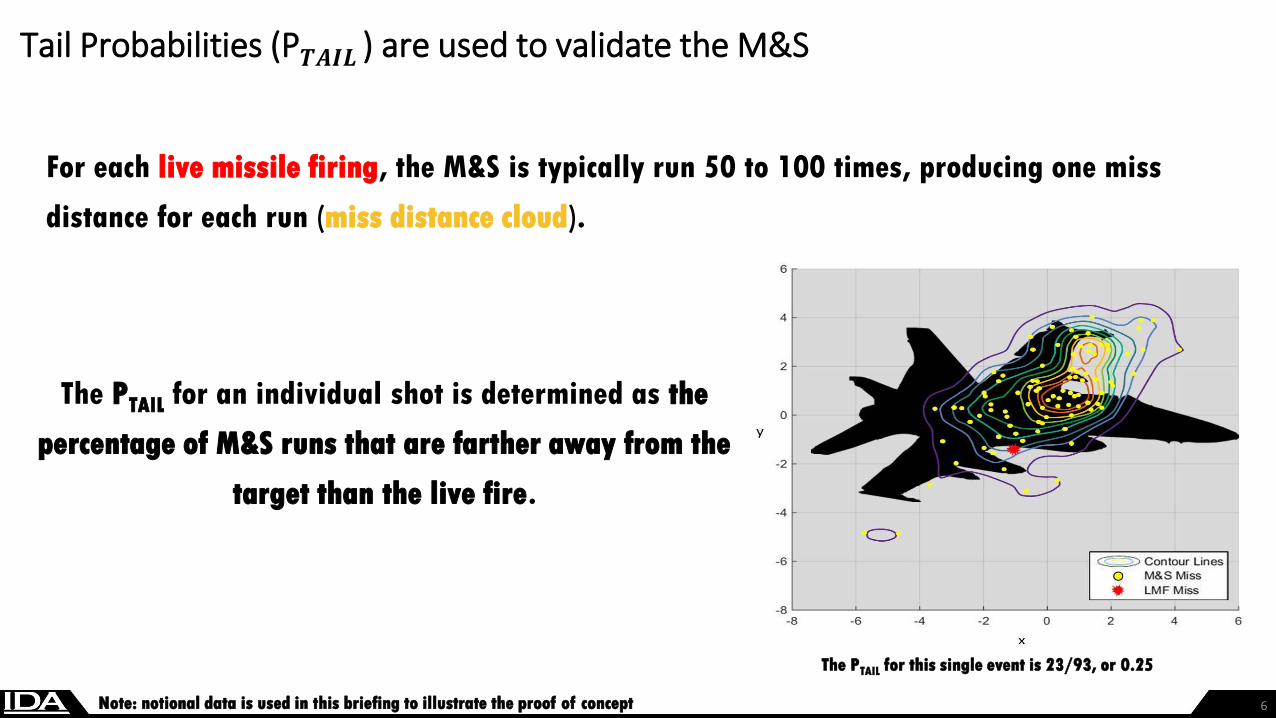
Tail Probabilities (P𝑻𝑨𝑰𝑳 ) are used to validate the M&S
6
For each live missile firing, the M&S is typically run 50 to 100 times, producing one miss
distance for each run (miss distance cloud).
The PTAIL for an individual shot is determined as the
percentage of M&S runs that are farther away from the
target than the live fire.
The PTAIL for this single event is 23/93, or 0.25
Note: notional data is used in this briefing to illustrate the proof of concept
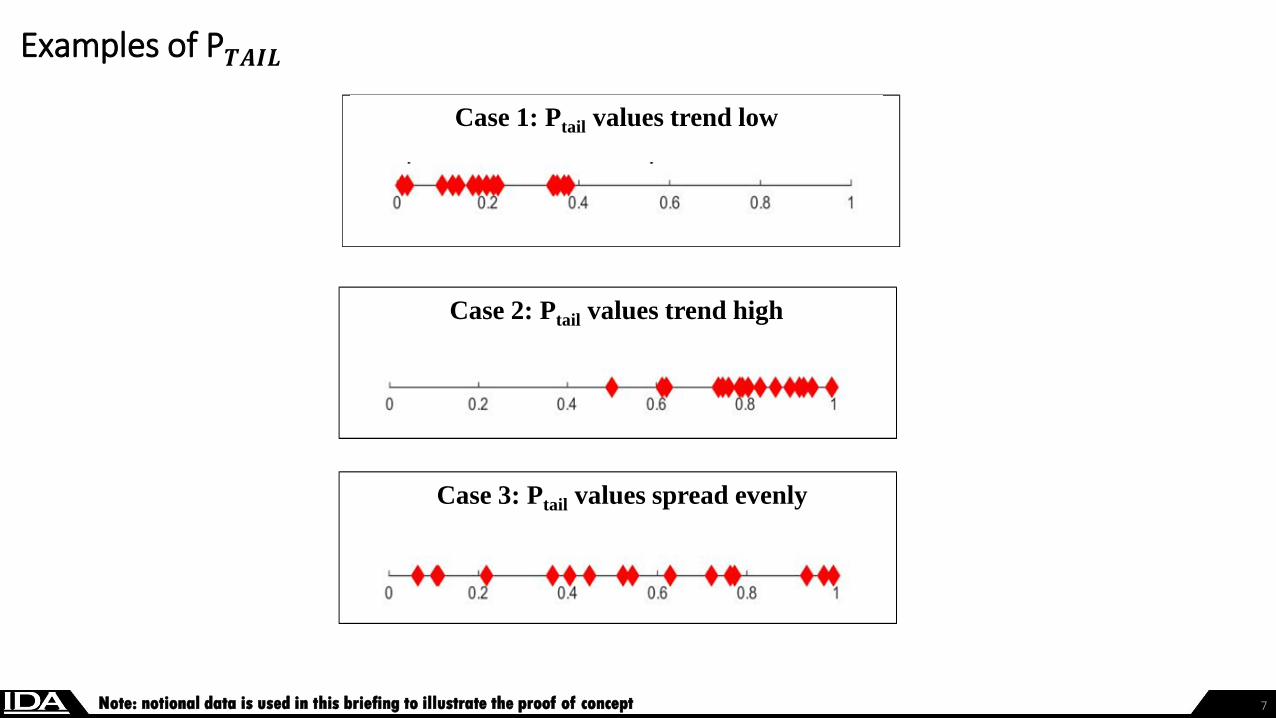
Examples of P𝑻𝑨𝑰𝑳
7Note: notional data is used in this briefing to illustrate the proof of concept
Case 1: Ptail values trend low
Case 3: Ptail values spread evenly
Case 2: Ptail values trend high
An Analysis of Analyses: Fisher’s Combined Probability Test
8
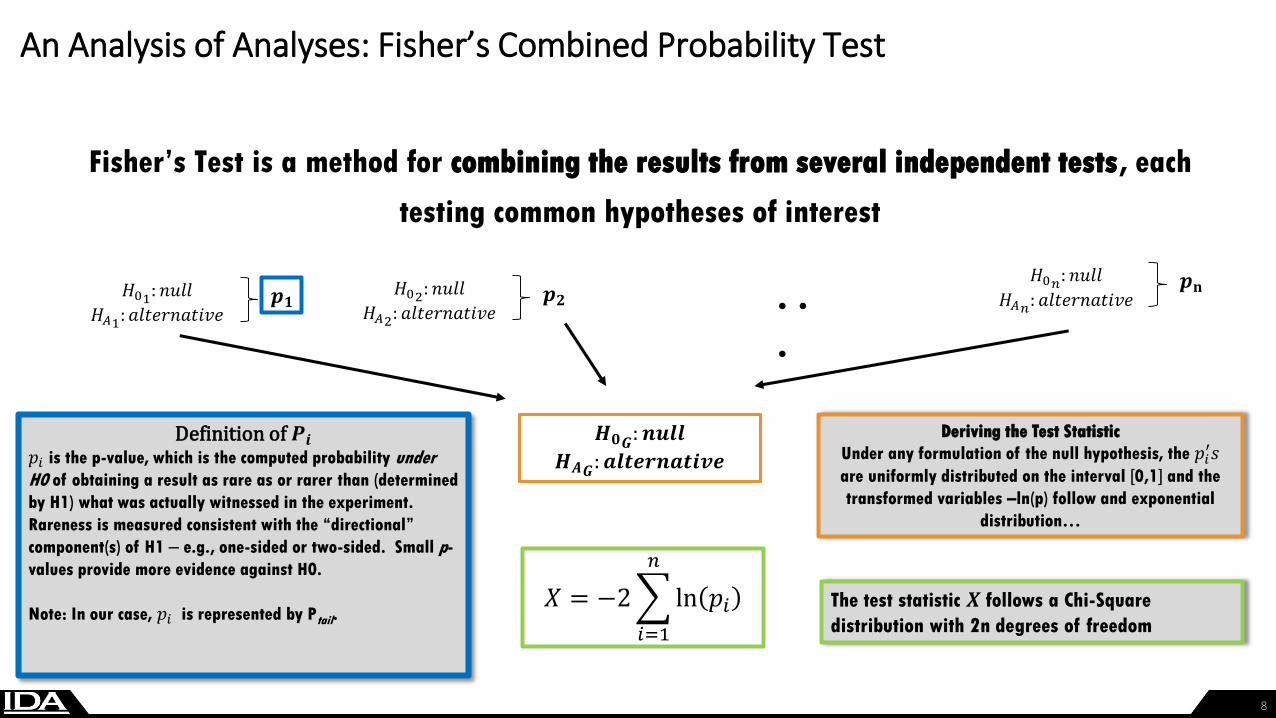
Fisher’s Test is a method for combining the results from several independent tests, each
testing common hypotheses of interest
𝑋 = −2
𝑖=1
𝑛
ln 𝑝𝑖
𝑯𝟎𝑮: 𝒏𝒖𝒍𝒍
𝑯𝑨𝑮: 𝒂𝒍𝒕𝒆𝒓𝒏𝒂𝒕𝒊𝒗𝒆
𝐻01: 𝑛𝑢𝑙𝑙
𝐻𝐴1: 𝑎𝑙𝑡𝑒𝑟𝑛𝑎𝑡𝑖𝑣𝑒𝒑𝟏
𝐻02: 𝑛𝑢𝑙𝑙
𝐻𝐴2: 𝑎𝑙𝑡𝑒𝑟𝑛𝑎𝑡𝑖𝑣𝑒𝒑𝟐
𝐻0𝑛: 𝑛𝑢𝑙𝑙
𝐻𝐴𝑛: 𝑎𝑙𝑡𝑒𝑟𝑛𝑎𝑡𝑖𝑣𝑒𝒑𝐧. .
.
Definition of 𝑷𝒊𝑝𝑖 is the p-value, which is the computed probability under
H0 of obtaining a result as rare as or rarer than (determined
by H1) what was actually witnessed in the experiment.
Rareness is measured consistent with the “directional”
component(s) of H1 ‒ e.g., one-sided or two-sided. Small p-
values provide more evidence against H0.
Note: In our case, 𝑝𝑖 is represented by Ptail.The test statistic 𝑿 follows a Chi-Square
distribution with 2n degrees of freedom
Deriving the Test Statistic
Under any formulation of the null hypothesis, the 𝑝𝑖′𝑠
are uniformly distributed on the interval [0,1] and the
transformed variables –ln(p) follow and exponential
distribution…
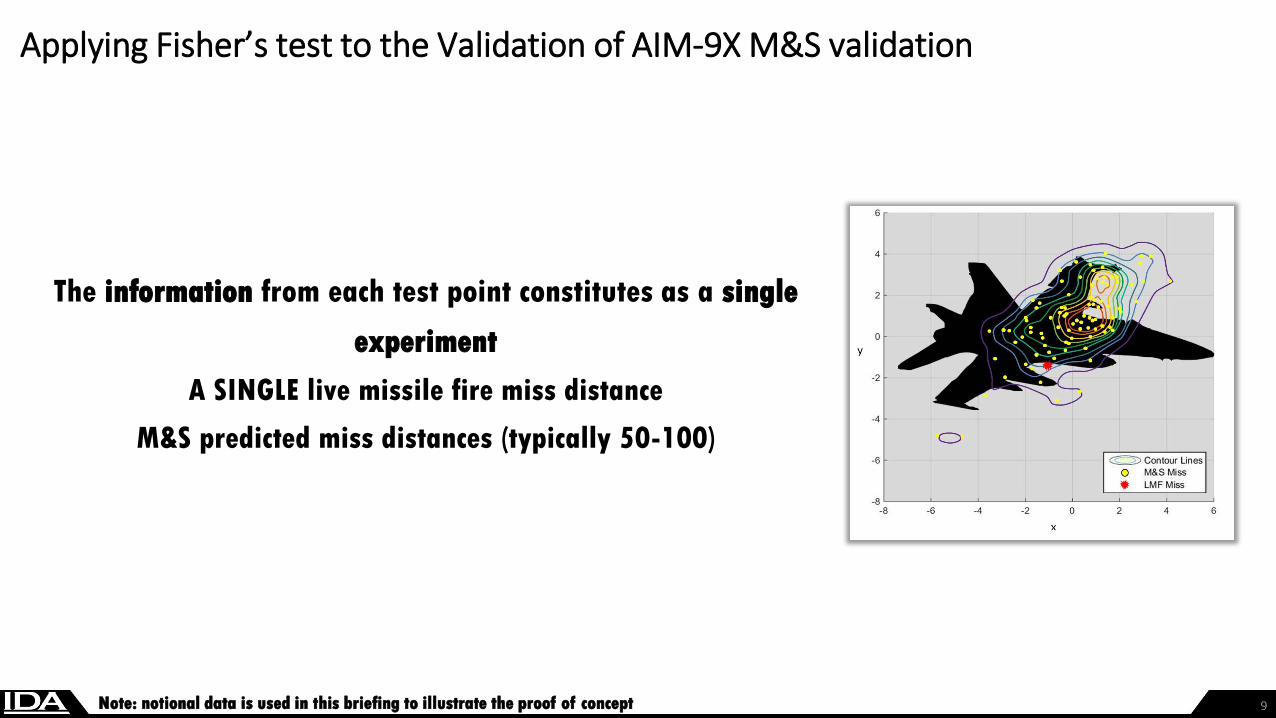
Applying Fisher’s test to the Validation of AIM-9X M&S validation
9
The information from each test point constitutes as a single
experiment
A SINGLE live missile fire miss distance
M&S predicted miss distances (typically 50-100)
Note: notional data is used in this briefing to illustrate the proof of concept
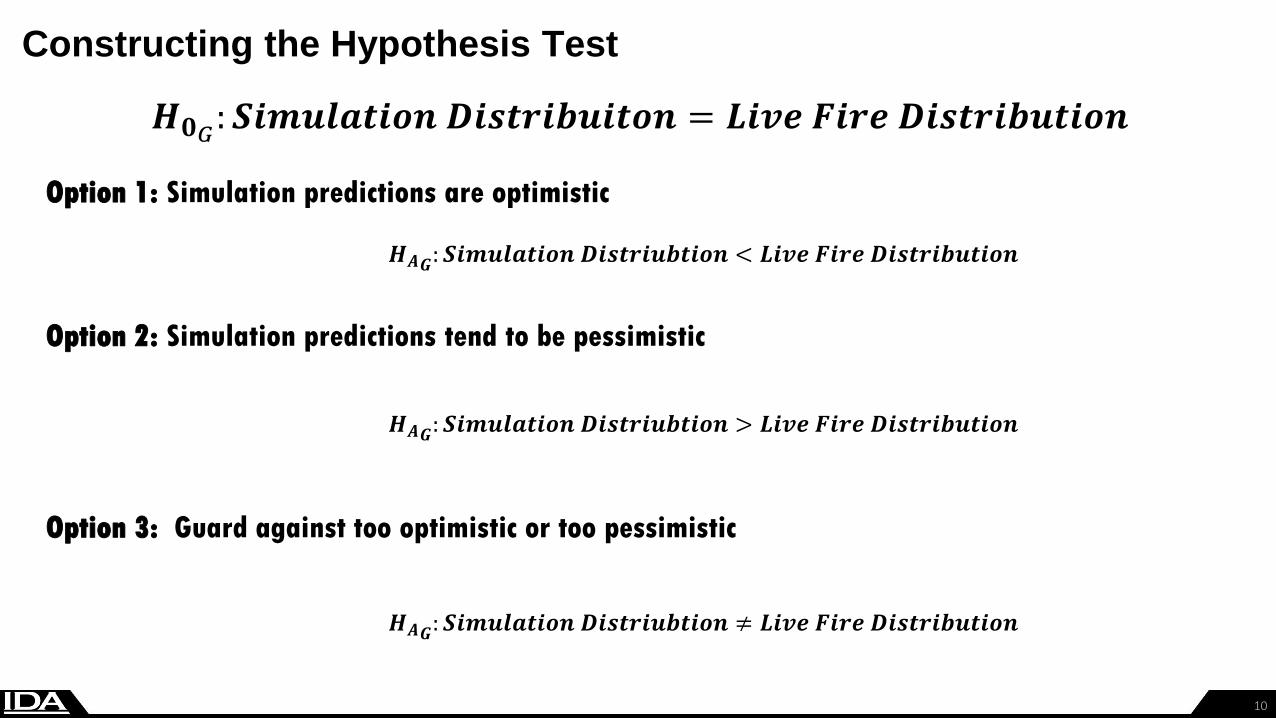
Constructing the Hypothesis Test
10
Option 1: Simulation predictions are optimistic
Option 2: Simulation predictions tend to be pessimistic
Option 3: Guard against too optimistic or too pessimistic
𝑯𝑨𝑮: 𝑺𝒊𝒎𝒖𝒍𝒂𝒕𝒊𝒐𝒏 𝑫𝒊𝒔𝒕𝒓𝒊𝒖𝒃𝒕𝒊𝒐𝒏 ≠ 𝑳𝒊𝒗𝒆 𝑭𝒊𝒓𝒆 𝑫𝒊𝒔𝒕𝒓𝒊𝒃𝒖𝒕𝒊𝒐𝒏
𝑯𝑨𝑮: 𝑺𝒊𝒎𝒖𝒍𝒂𝒕𝒊𝒐𝒏 𝑫𝒊𝒔𝒕𝒓𝒊𝒖𝒃𝒕𝒊𝒐𝒏 < 𝑳𝒊𝒗𝒆 𝑭𝒊𝒓𝒆 𝑫𝒊𝒔𝒕𝒓𝒊𝒃𝒖𝒕𝒊𝒐𝒏
𝑯𝑨𝑮: 𝑺𝒊𝒎𝒖𝒍𝒂𝒕𝒊𝒐𝒏 𝑫𝒊𝒔𝒕𝒓𝒊𝒖𝒃𝒕𝒊𝒐𝒏 > 𝑳𝒊𝒗𝒆 𝑭𝒊𝒓𝒆 𝑫𝒊𝒔𝒕𝒓𝒊𝒃𝒖𝒕𝒊𝒐𝒏
𝑯𝟎𝐺: 𝑺𝒊𝒎𝒖𝒍𝒂𝒕𝒊𝒐𝒏 𝑫𝒊𝒔𝒕𝒓𝒊𝒃𝒖𝒊𝒕𝒐𝒏 = 𝑳𝒊𝒗𝒆 𝑭𝒊𝒓𝒆 𝑫𝒊𝒔𝒕𝒓𝒊𝒃𝒖𝒕𝒊𝒐𝒏
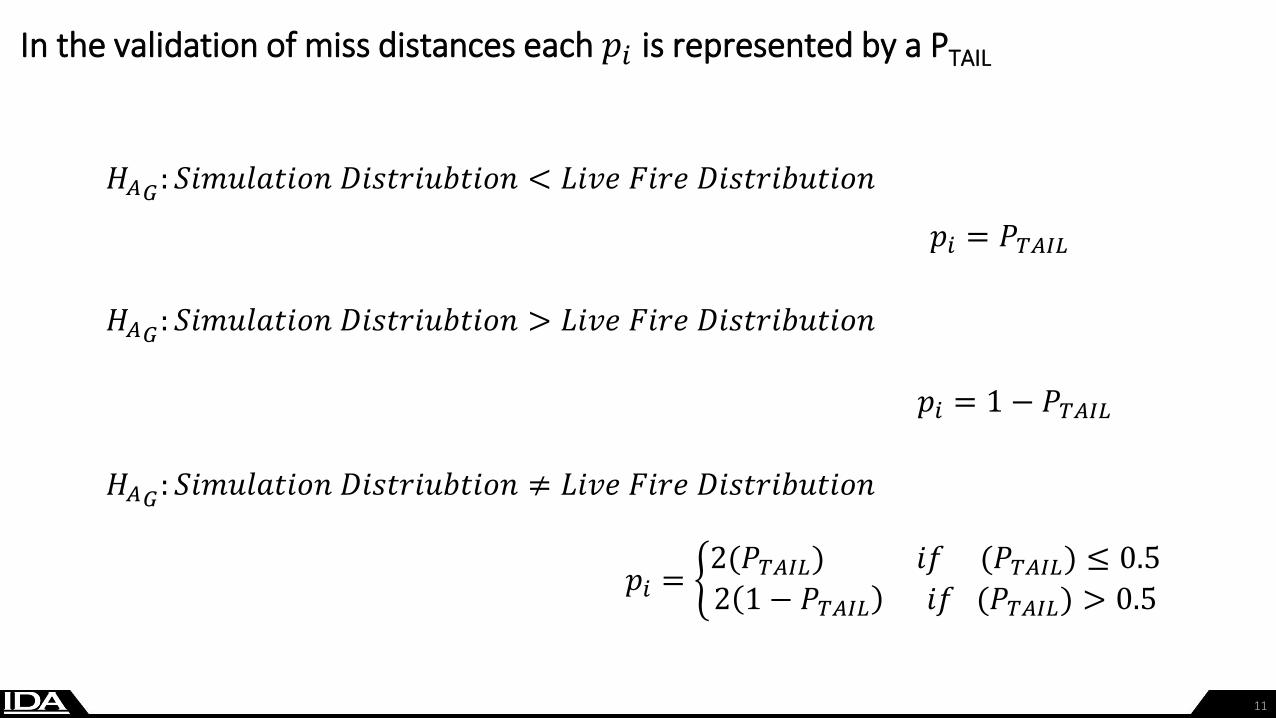
In the validation of miss distances each 𝑝𝑖 is represented by a PTAIL
11
𝑝𝑖 = 𝑃𝑇𝐴𝐼𝐿
𝑝𝑖 = 1 − 𝑃𝑇𝐴𝐼𝐿
𝐻𝐴𝐺: 𝑆𝑖𝑚𝑢𝑙𝑎𝑡𝑖𝑜𝑛 𝐷𝑖𝑠𝑡𝑟𝑖𝑢𝑏𝑡𝑖𝑜𝑛 ≠ 𝐿𝑖𝑣𝑒 𝐹𝑖𝑟𝑒 𝐷𝑖𝑠𝑡𝑟𝑖𝑏𝑢𝑡𝑖𝑜𝑛
𝐻𝐴𝐺: 𝑆𝑖𝑚𝑢𝑙𝑎𝑡𝑖𝑜𝑛 𝐷𝑖𝑠𝑡𝑟𝑖𝑢𝑏𝑡𝑖𝑜𝑛 < 𝐿𝑖𝑣𝑒 𝐹𝑖𝑟𝑒 𝐷𝑖𝑠𝑡𝑟𝑖𝑏𝑢𝑡𝑖𝑜𝑛
𝐻𝐴𝐺: 𝑆𝑖𝑚𝑢𝑙𝑎𝑡𝑖𝑜𝑛 𝐷𝑖𝑠𝑡𝑟𝑖𝑢𝑏𝑡𝑖𝑜𝑛 > 𝐿𝑖𝑣𝑒 𝐹𝑖𝑟𝑒 𝐷𝑖𝑠𝑡𝑟𝑖𝑏𝑢𝑡𝑖𝑜𝑛
𝑝𝑖 = 2(𝑃𝑇𝐴𝐼𝐿) 𝑖𝑓 (𝑃𝑇𝐴𝐼𝐿) ≤ 0.5
2 1 − 𝑃𝑇𝐴𝐼𝐿 𝑖𝑓 (𝑃𝑇𝐴𝐼𝐿) > 0.5
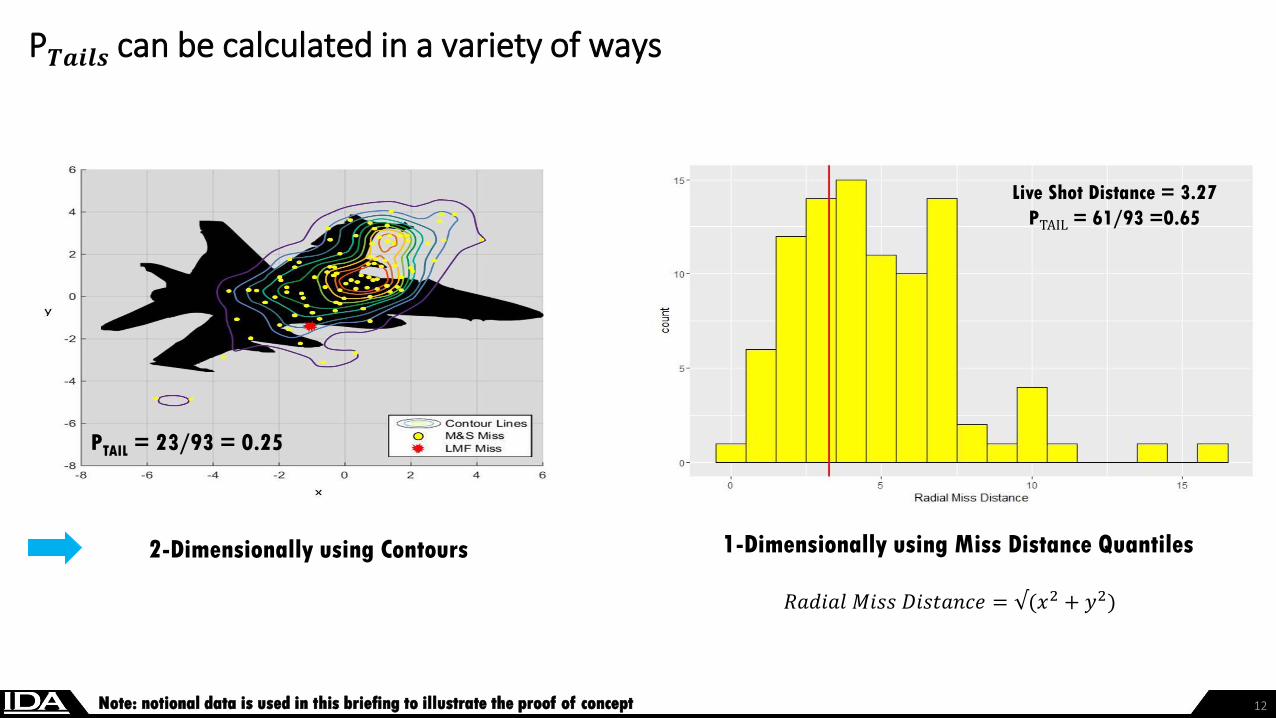
P𝑻𝒂𝒊𝒍𝒔 can be calculated in a variety of ways
12
Live Shot Distance = 3.27
PTAIL = 61/93 =0.65
1-Dimensionally using Miss Distance Quantiles2-Dimensionally using Contours
PTAIL = 23/93 = 0.25
𝑅𝑎𝑑𝑖𝑎𝑙 𝑀𝑖𝑠𝑠 𝐷𝑖𝑠𝑡𝑎𝑛𝑐𝑒 = √(𝑥2 + 𝑦2)
Note: notional data is used in this briefing to illustrate the proof of concept
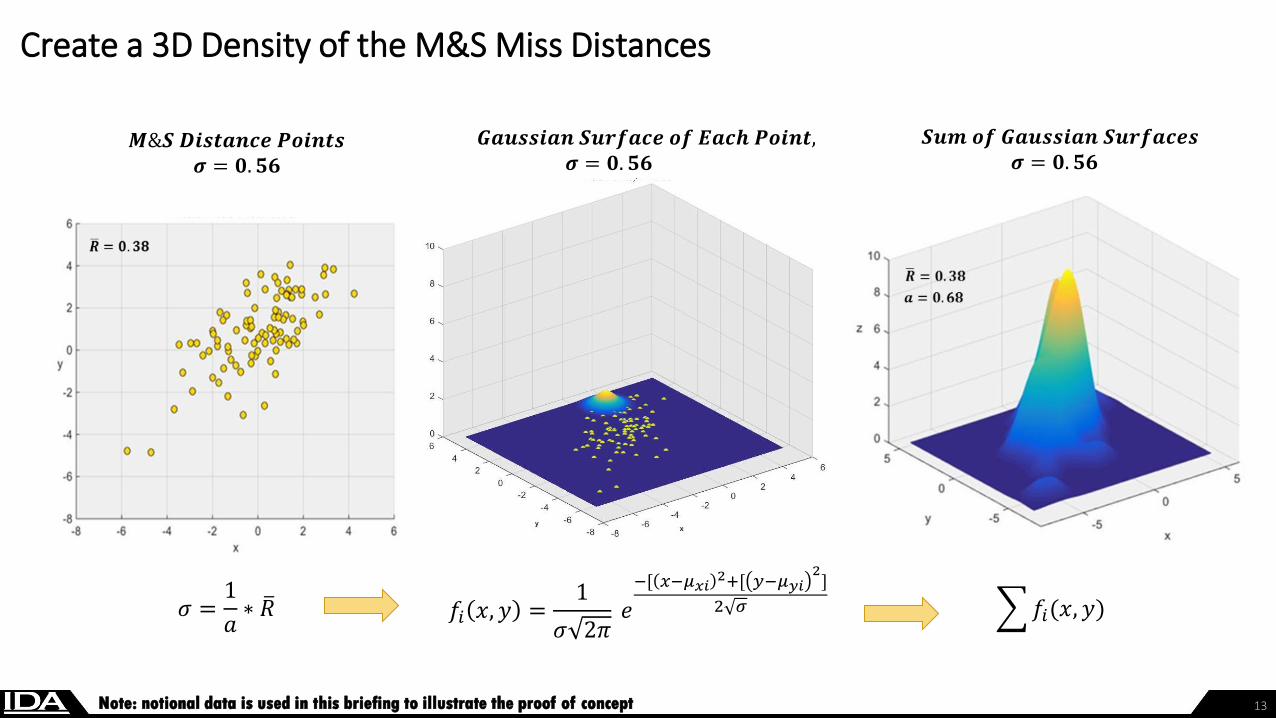
Create a 3D Density of the M&S Miss Distances
13
𝑓𝑖 𝑥, 𝑦 =1
𝜎 2𝜋𝑒
−[ 𝑥−𝜇𝑥𝑖2+[ 𝑦−𝜇𝑦𝑖
2]
2 𝜎𝜎 =1
𝑎∗ 𝑅 𝑓𝑖(𝑥, 𝑦)
𝑺𝒖𝒎 𝒐𝒇 𝑮𝒂𝒖𝒔𝒔𝒊𝒂𝒏 𝑺𝒖𝒓𝒇𝒂𝒄𝒆𝒔𝝈 = 𝟎. 𝟓𝟔
𝑮𝒂𝒖𝒔𝒔𝒊𝒂𝒏 𝑺𝒖𝒓𝒇𝒂𝒄𝒆 𝒐𝒇 𝑬𝒂𝒄𝒉 𝑷𝒐𝒊𝒏𝒕,𝝈 = 𝟎. 𝟓𝟔
𝑴&𝑺 𝑫𝒊𝒔𝒕𝒂𝒏𝒄𝒆 𝑷𝒐𝒊𝒏𝒕𝒔𝝈 = 𝟎. 𝟓𝟔
Note: notional data is used in this briefing to illustrate the proof of concept
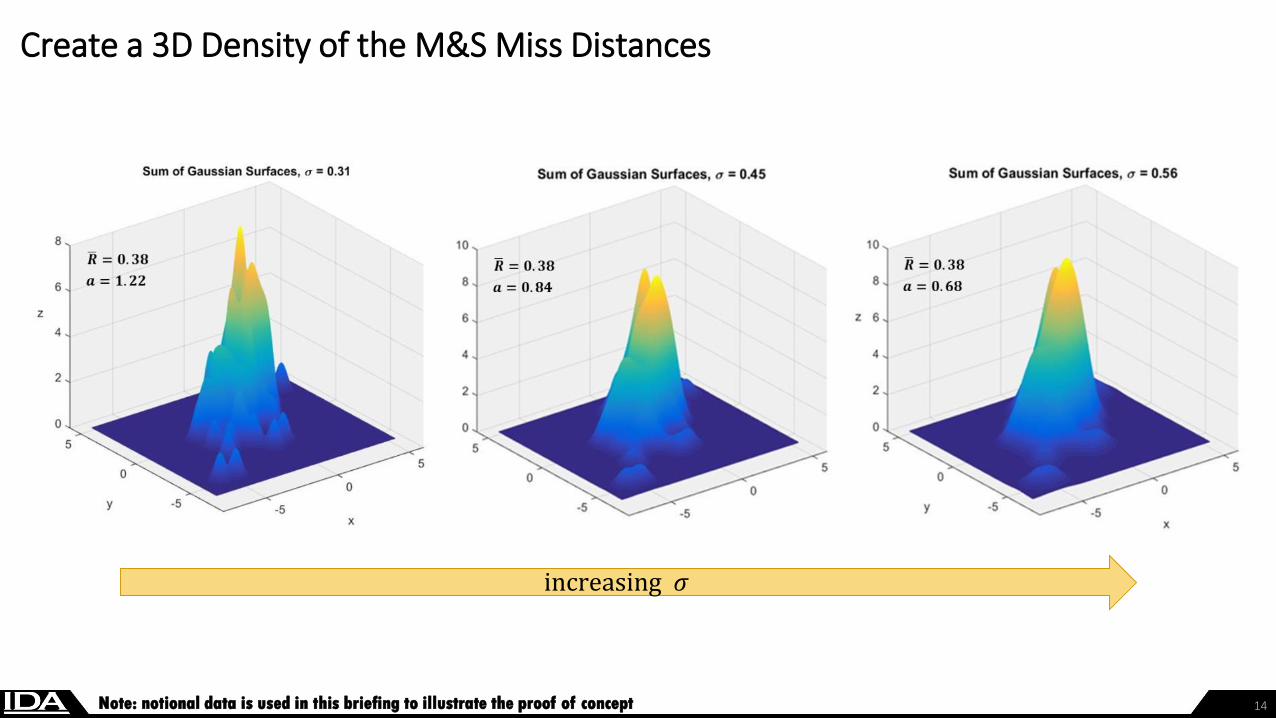
Create a 3D Density of the M&S Miss Distances
14
increasing 𝜎
Note: notional data is used in this briefing to illustrate the proof of concept
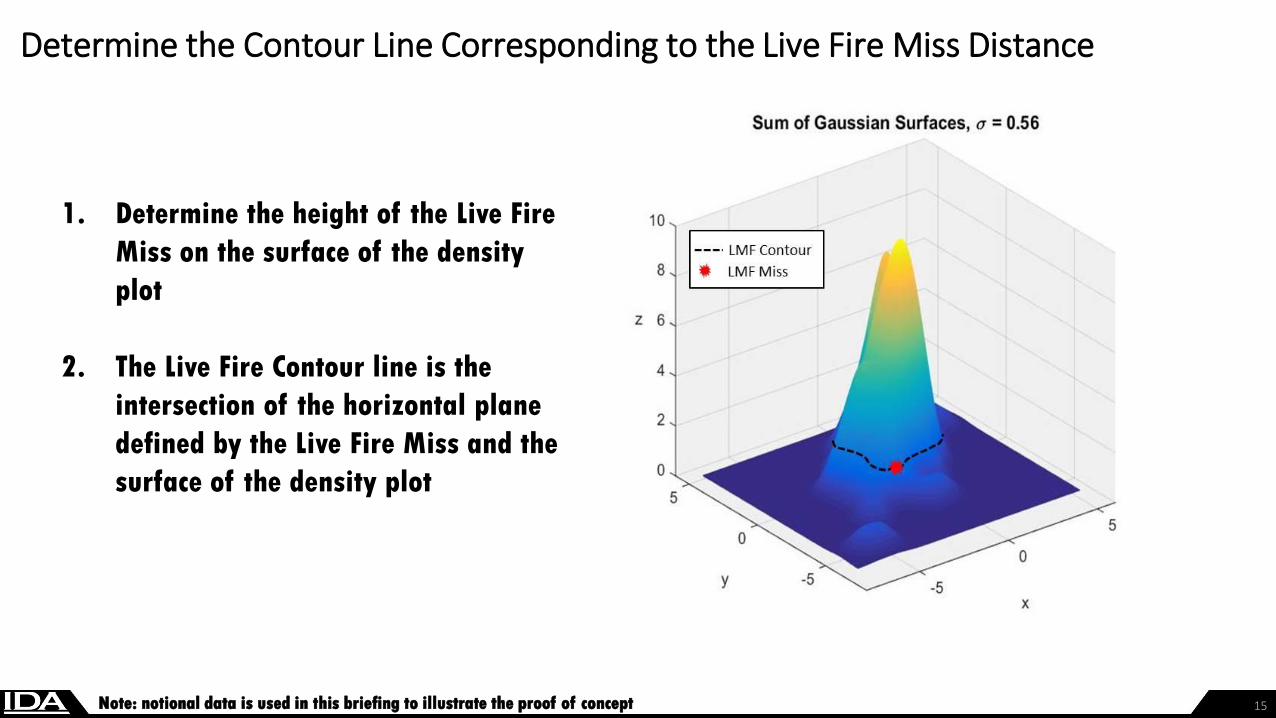
Determine the Contour Line Corresponding to the Live Fire Miss Distance
15
1. Determine the height of the Live Fire
Miss on the surface of the density
plot
2. The Live Fire Contour line is the
intersection of the horizontal plane
defined by the Live Fire Miss and the
surface of the density plot
Note: notional data is used in this briefing to illustrate the proof of concept
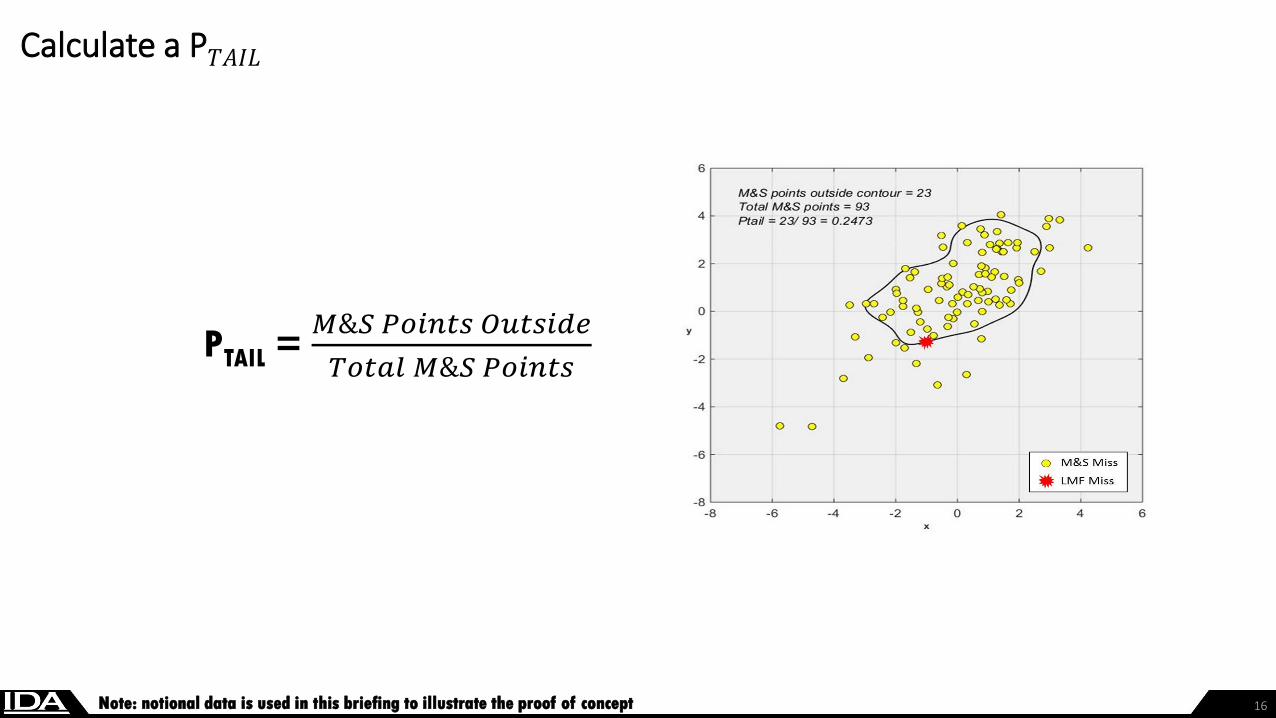
Calculate a P𝑇𝐴𝐼𝐿
16
PTAIL = 𝑀&𝑆 𝑃𝑜𝑖𝑛𝑡𝑠 𝑂𝑢𝑡𝑠𝑖𝑑𝑒
𝑇𝑜𝑡𝑎𝑙 𝑀&𝑆 𝑃𝑜𝑖𝑛𝑡𝑠
Note: notional data is used in this briefing to illustrate the proof of concept
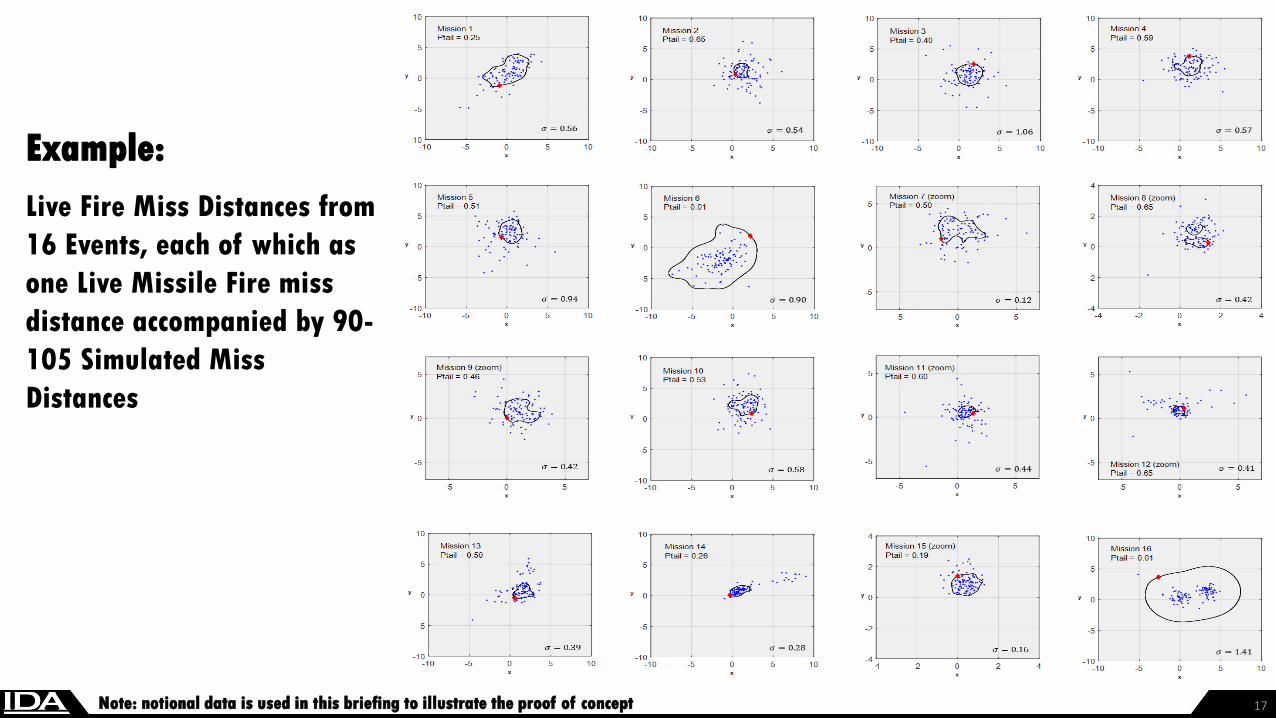
17
Live Fire Miss Distances from
16 Events, each of which as
one Live Missile Fire miss
distance accompanied by 90-
105 Simulated Miss
Distances
Example:
Note: notional data is used in this briefing to illustrate the proof of concept
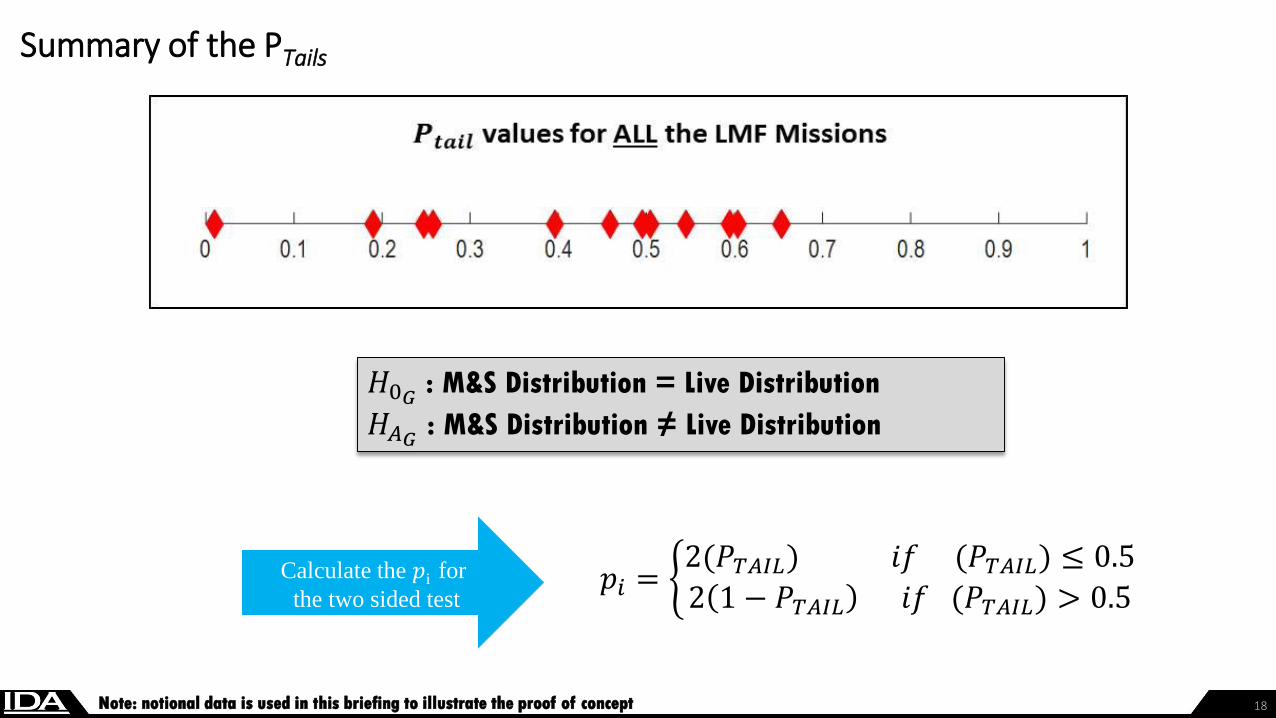
Summary of the PTails
18
𝑝𝑖 = 2(𝑃𝑇𝐴𝐼𝐿) 𝑖𝑓 (𝑃𝑇𝐴𝐼𝐿) ≤ 0.5
2 1 − 𝑃𝑇𝐴𝐼𝐿 𝑖𝑓 (𝑃𝑇𝐴𝐼𝐿) > 0.5Calculate the 𝑝i for
the two sided test
Note: notional data is used in this briefing to illustrate the proof of concept
𝐻0𝐺 : M&S Distribution = Live Distribution
𝐻𝐴𝐺: M&S Distribution ≠ Live Distribution
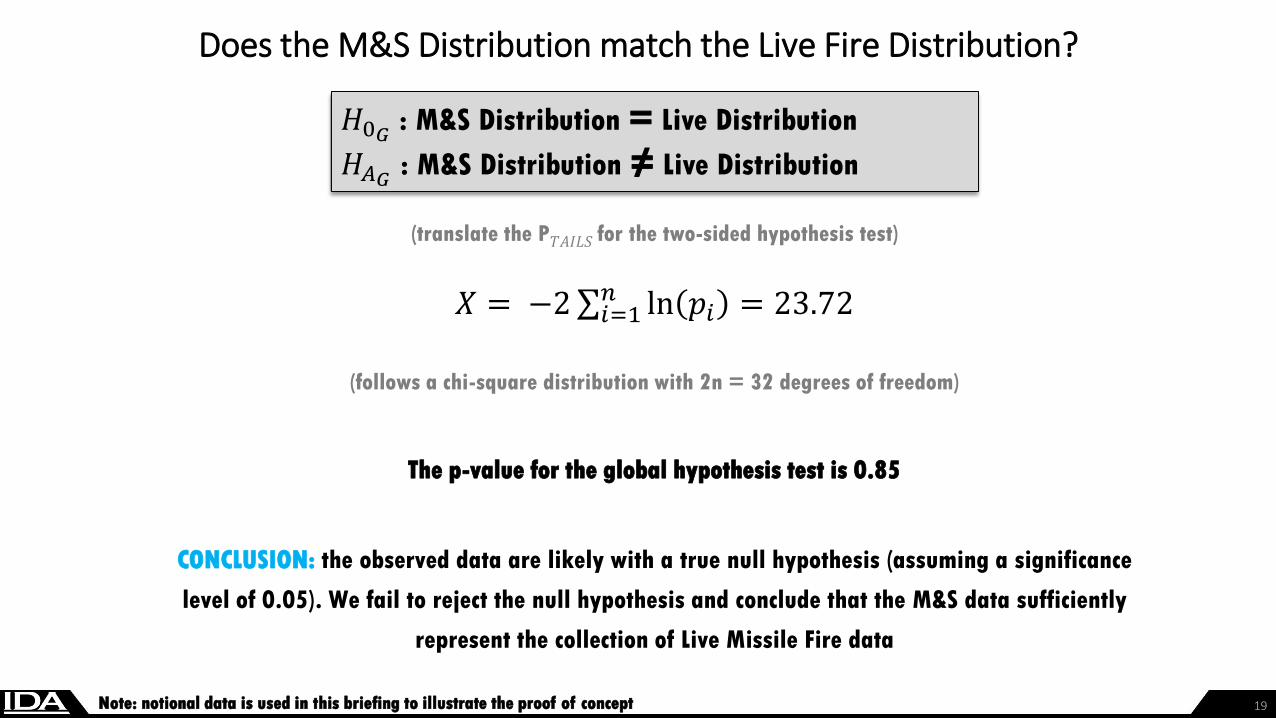
Does the M&S Distribution match the Live Fire Distribution?
19
(translate the P𝑇𝐴𝐼𝐿𝑆 for the two-sided hypothesis test)
𝑋 = −2 𝑖=1𝑛 ln 𝑝𝑖 = 23.72
(follows a chi-square distribution with 2n = 32 degrees of freedom)
The p-value for the global hypothesis test is 0.85
CONCLUSION: the observed data are likely with a true null hypothesis (assuming a significance
level of 0.05). We fail to reject the null hypothesis and conclude that the M&S data sufficiently
represent the collection of Live Missile Fire data
𝐻0𝐺 : M&S Distribution = Live Distribution
𝐻𝐴𝐺: M&S Distribution ≠ Live Distribution
Note: notional data is used in this briefing to illustrate the proof of concept
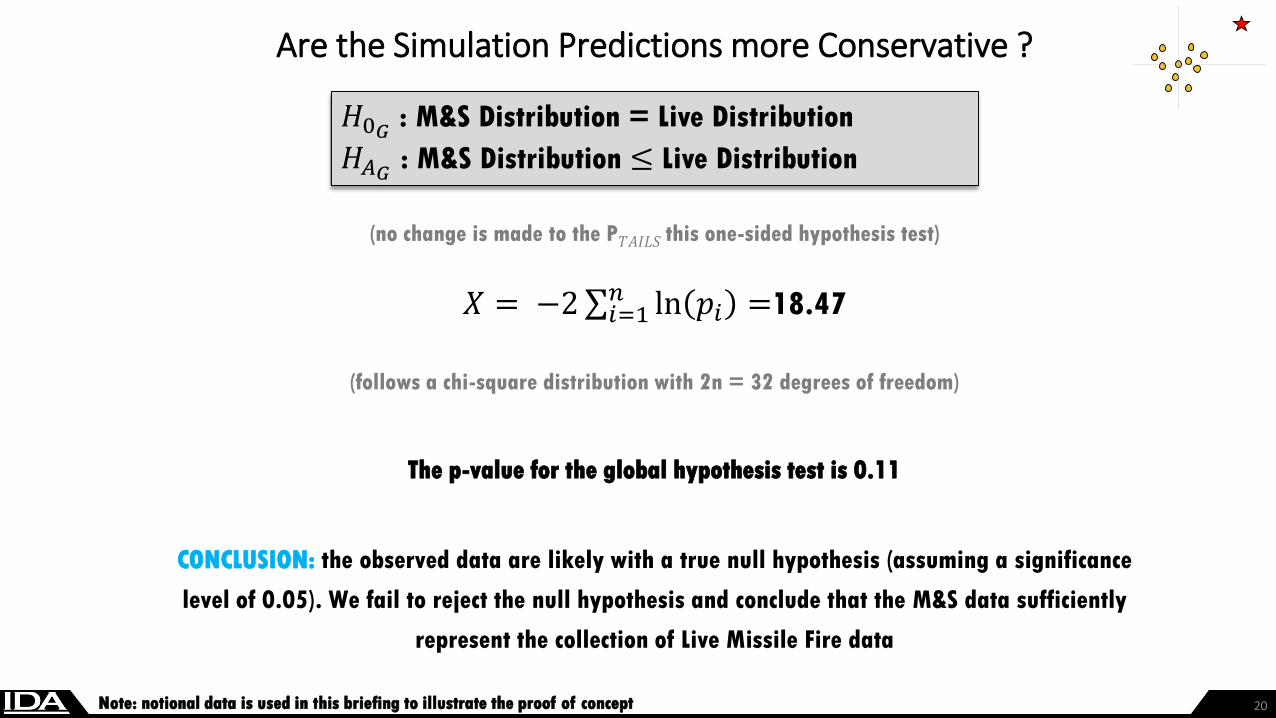
Are the Simulation Predictions more Conservative ?
20
(no change is made to the P𝑇𝐴𝐼𝐿𝑆 this one-sided hypothesis test)
𝑋 = −2 𝑖=1𝑛 ln 𝑝𝑖 =18.47
(follows a chi-square distribution with 2n = 32 degrees of freedom)
The p-value for the global hypothesis test is 0.11
CONCLUSION: the observed data are likely with a true null hypothesis (assuming a significance
level of 0.05). We fail to reject the null hypothesis and conclude that the M&S data sufficiently
represent the collection of Live Missile Fire data
𝐻0𝐺 : M&S Distribution = Live Distribution
𝐻𝐴𝐺: M&S Distribution ≤ Live Distribution
Note: notional data is used in this briefing to illustrate the proof of concept
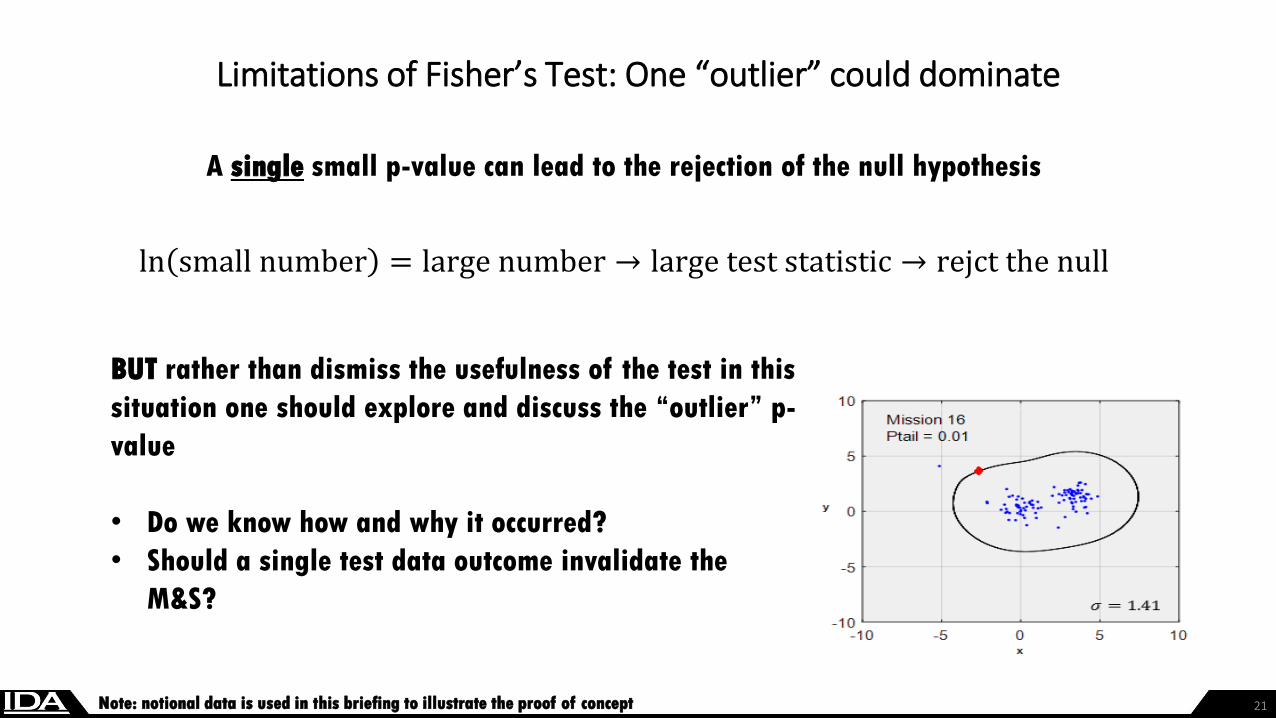
Limitations of Fisher’s Test: One “outlier” could dominate
21
A single small p-value can lead to the rejection of the null hypothesis
ln small number = large number → large test statistic → rejct the null
BUT rather than dismiss the usefulness of the test in this
situation one should explore and discuss the “outlier” p-
value
• Do we know how and why it occurred?
• Should a single test data outcome invalidate the
M&S?
Note: notional data is used in this briefing to illustrate the proof of concept
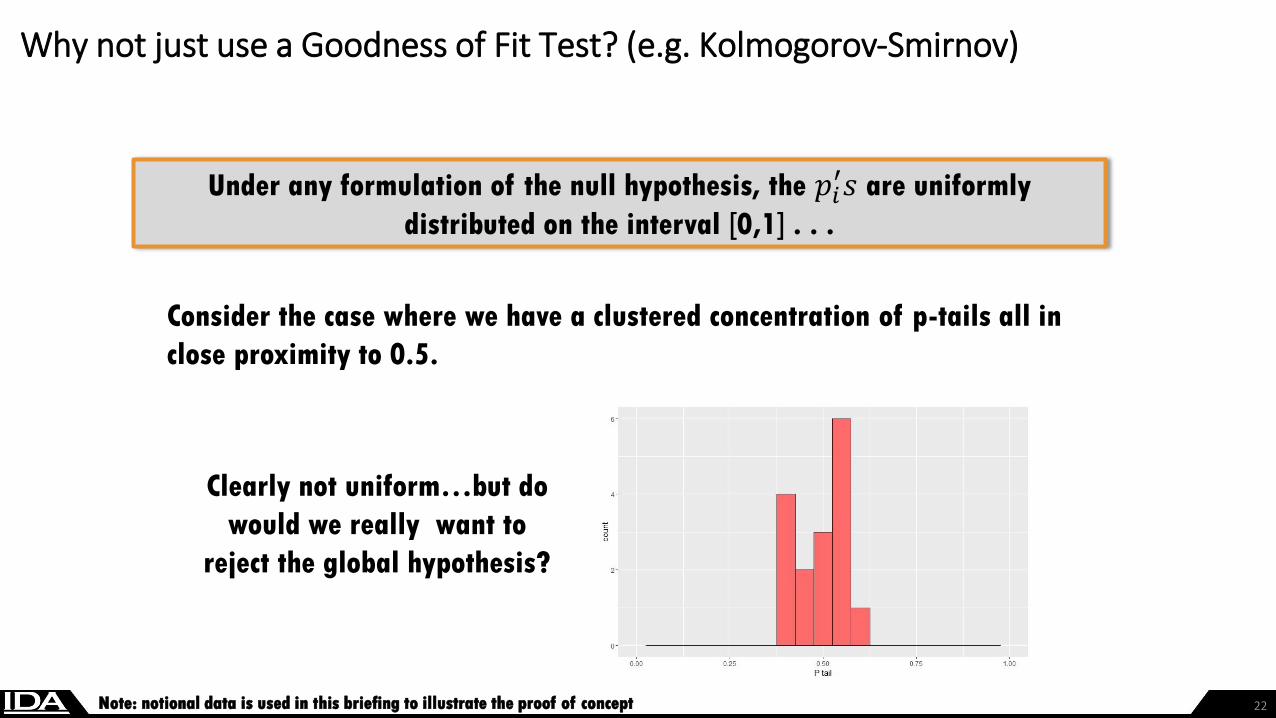
Why not just use a Goodness of Fit Test? (e.g. Kolmogorov-Smirnov)
22
Clearly not uniform…but do
would we really want to
reject the global hypothesis?
Consider the case where we have a clustered concentration of p-tails all in
close proximity to 0.5.
Under any formulation of the null hypothesis, the 𝑝𝑖′𝑠 are uniformly
distributed on the interval [0,1] . . .
Note: notional data is used in this briefing to illustrate the proof of concept
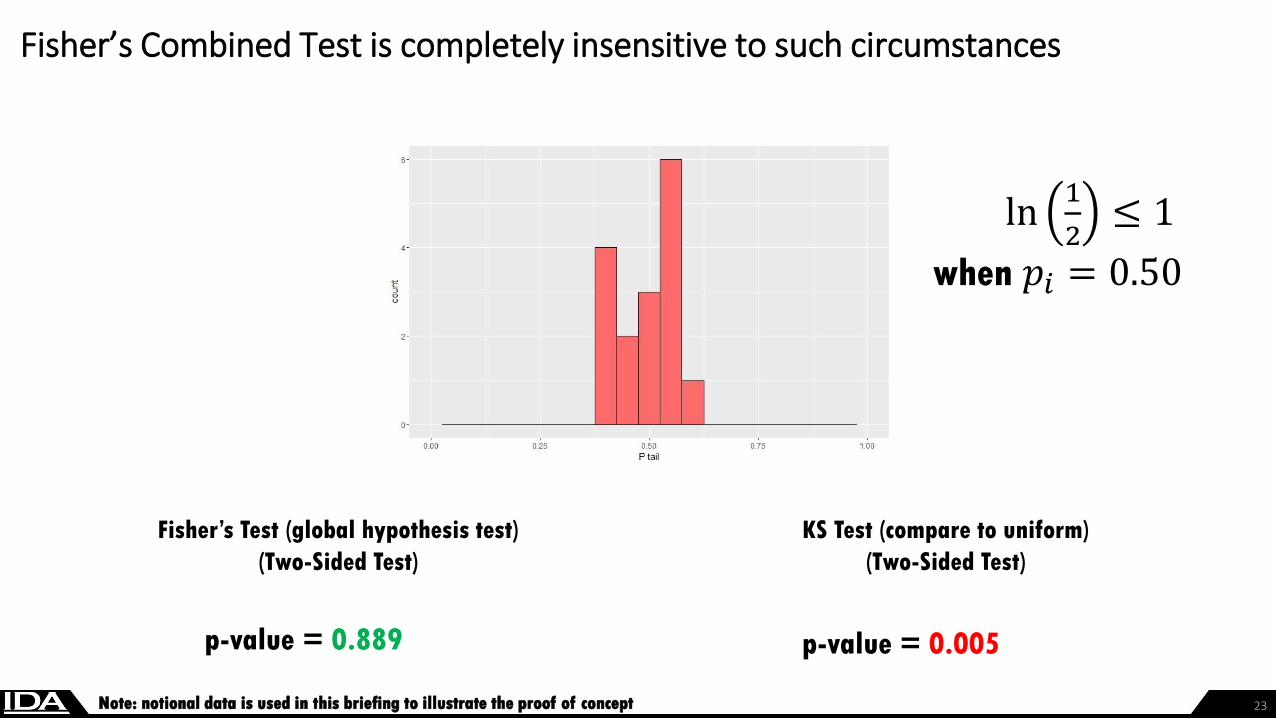
Fisher’s Combined Test is completely insensitive to such circumstances
23
Fisher’s Test (global hypothesis test)
(Two-Sided Test)
KS Test (compare to uniform)
(Two-Sided Test)
p-value = 0.889 p-value = 0.005
ln1
2≤ 1
when 𝑝𝑖 = 0.50
Note: notional data is used in this briefing to illustrate the proof of concept
Limitations of Fisher’s Test (cont.)
24
Construction of contours requires some level of judgement
We validated that miss distance could not be shown to be biased
However, getting from miss distance to Pk requires one more step, a warhead
lethality model, which is validated separately through another test program
Summary
25
Live missile fire testing is extremely limited due to test constraints and cost
Before M&S is used to further the understanding of the system, it must be validated.
Fisher’s Combined Test can be used as a tool to validate AIM-9X simulations