Embed Size (px)
Citation preview
Comparing seasonal forecast
downscaling methodologies for the
agriculture sector in South Eastern
South America
Paula Gonzalez1, Andrew Robertson1,Vincent Moron1,2
1. IRI, The Earth Institute, Columbia University, USA
2. Aix-Marseille Univ./ Institut Universitaire de France, France
MOTIVATIONS
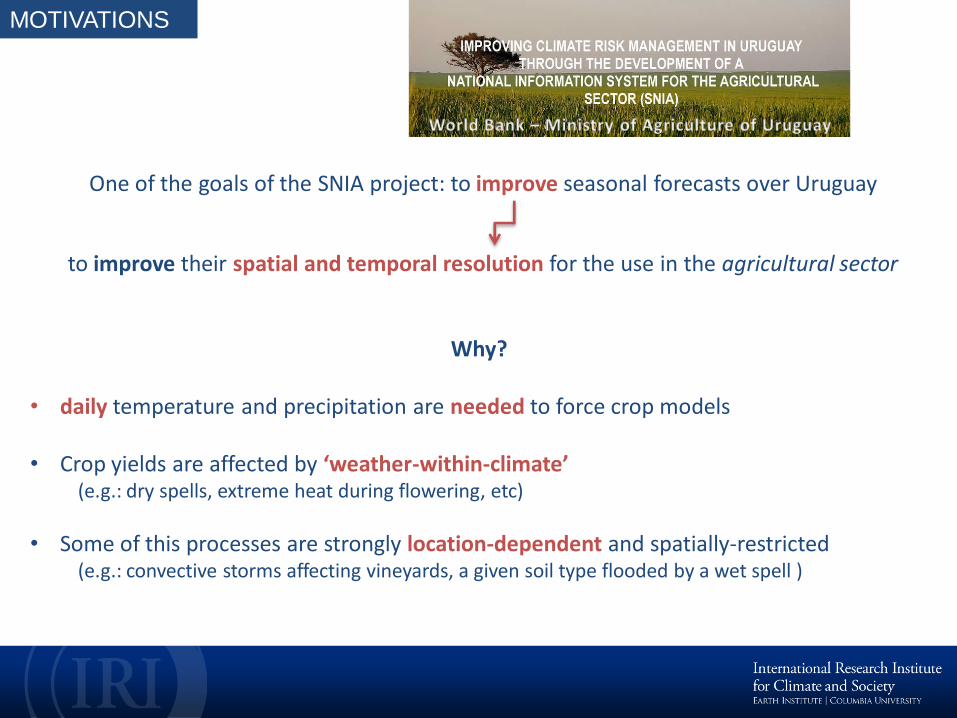
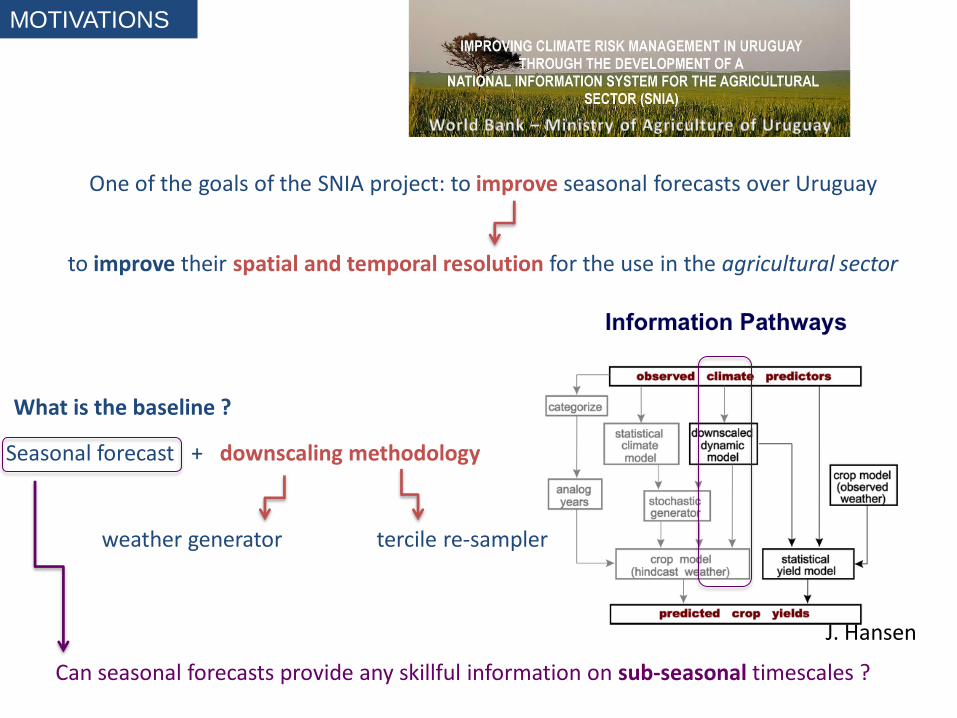
One of the goals of the SNIA project: to improve seasonal forecasts over Uruguay
to improve their spatial and temporal resolution for the use in the agricultural sector
Why? • daily temperature and precipitation are needed to force crop models
• Crop yields are affected by ‘weather-within-climate’ (e.g.: dry spells, extreme heat during flowering, etc)
• Some of this processes are strongly location-dependent and spatially-restricted (e.g.: convective storms affecting vineyards, a given soil type flooded by a wet spell )
MOTIVATIONS
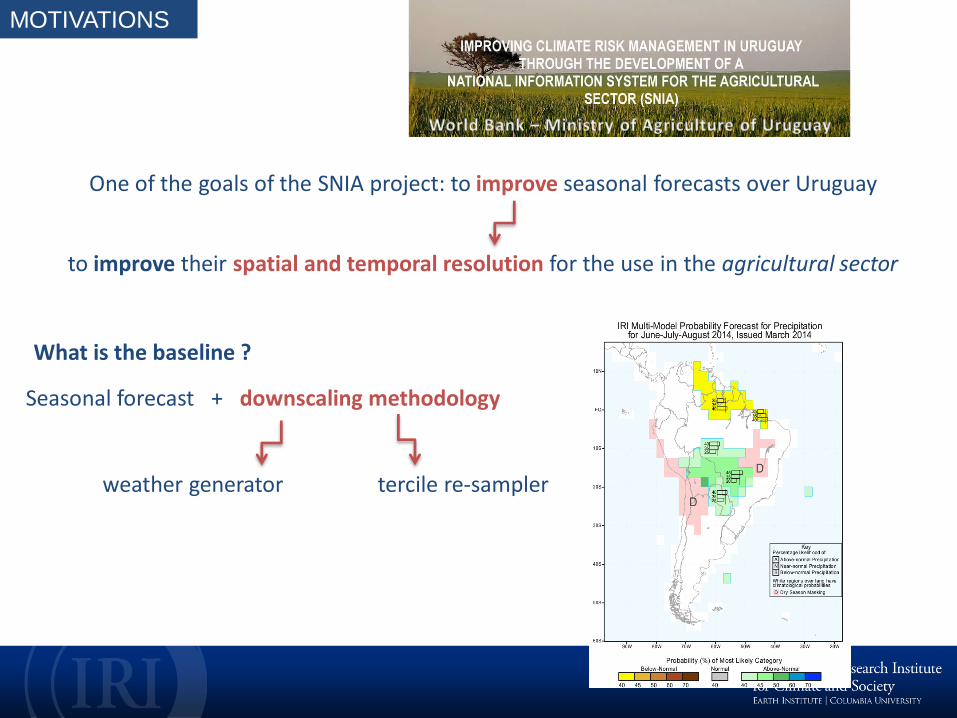
One of the goals of the SNIA project: to improve seasonal forecasts over Uruguay
to improve their spatial and temporal resolution for the use in the agricultural sector
Seasonal forecast + downscaling methodology weather generator tercile re-sampler
What is the baseline ?
MOTIVATIONS
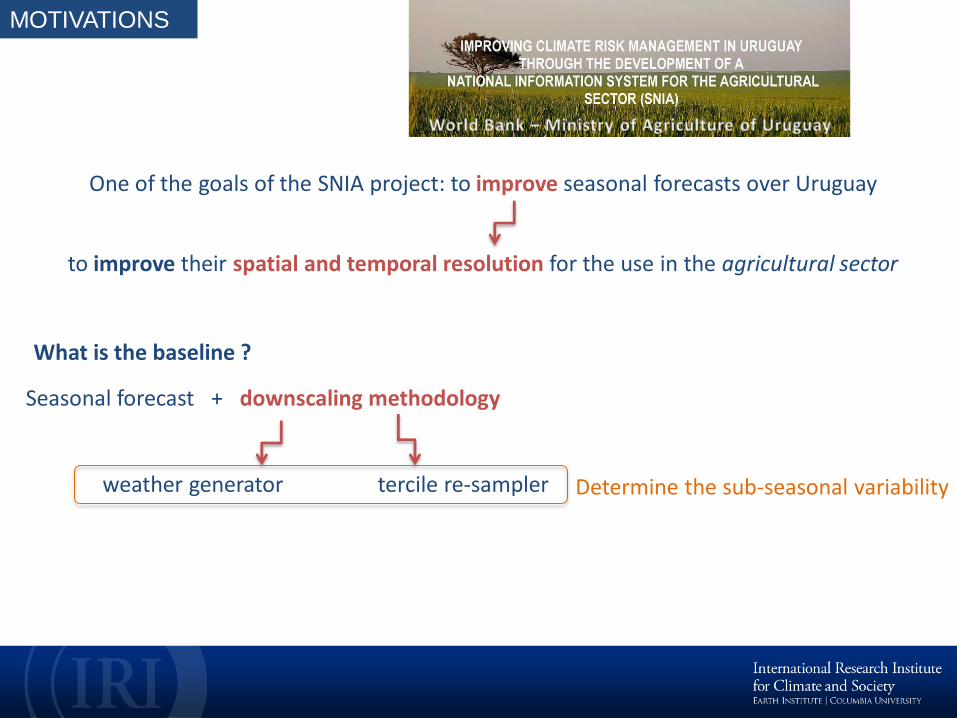
One of the goals of the SNIA project: to improve seasonal forecasts over Uruguay
to improve their spatial and temporal resolution for the use in the agricultural sector
Seasonal forecast + downscaling methodology weather generator tercile re-sampler
What is the baseline ?
Determine the sub-seasonal variability
MOTIVATIONS
One of the goals of the SNIA project: to improve seasonal forecasts over Uruguay
to improve their spatial and temporal resolution for the use in the agricultural sector
Seasonal forecast + downscaling methodology weather generator tercile re-sampler
What is the baseline ?
Can seasonal forecasts provide any skillful information on sub-seasonal timescales ?
J. Hansen
OBJECTIVES AND PREVIOUS RESULTS - RAINFALL
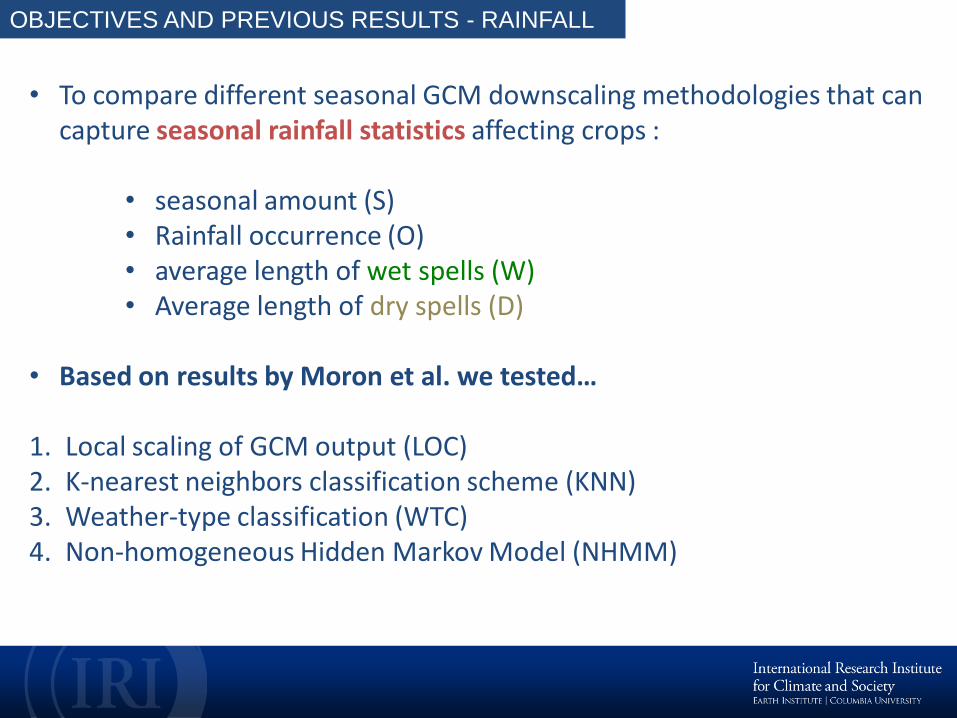
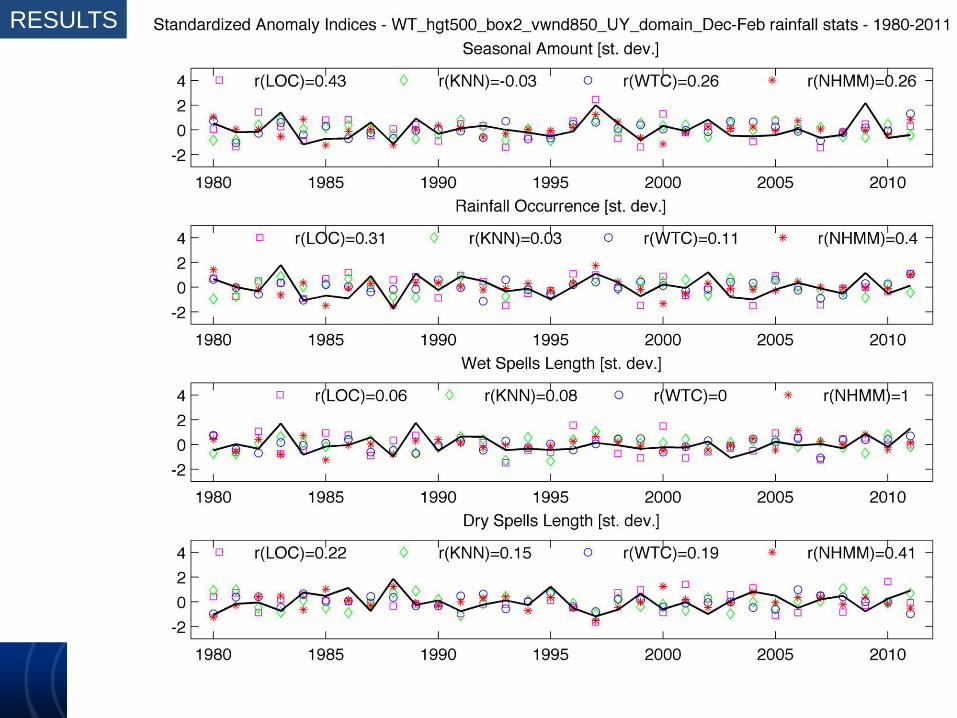
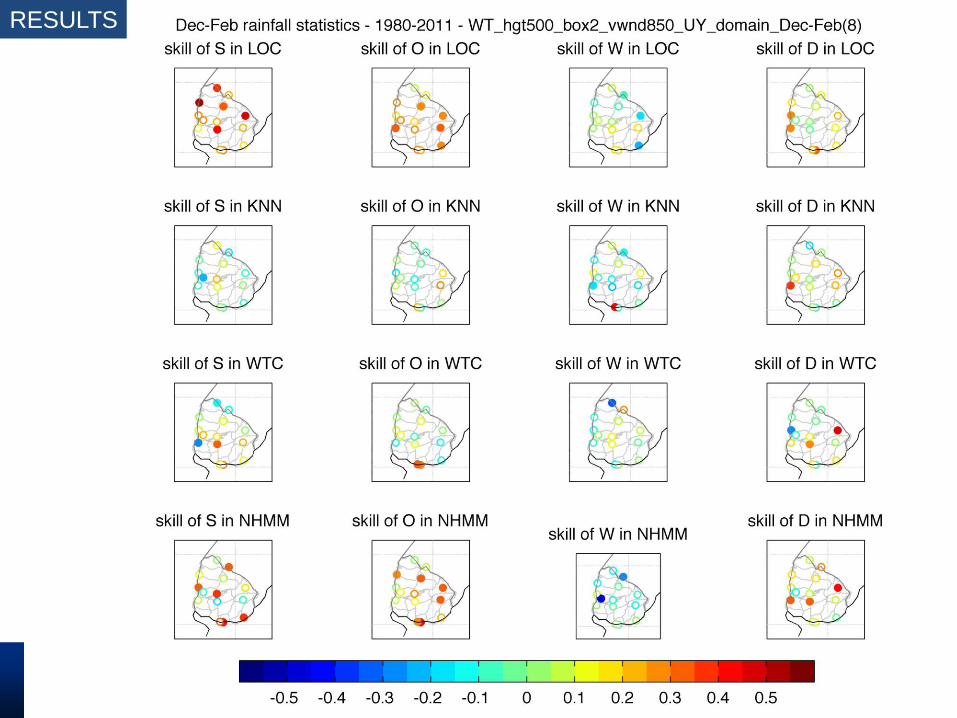
• To compare different seasonal GCM downscaling methodologies that can capture seasonal rainfall statistics affecting crops :
• seasonal amount (S) • Rainfall occurrence (O) • average length of wet spells (W) • Average length of dry spells (D)
• Based on results by Moron et al. we tested…
1. Local scaling of GCM output (LOC) 2. K-nearest neighbors classification scheme (KNN) 3. Weather-type classification (WTC) 4. Non-homogeneous Hidden Markov Model (NHMM)
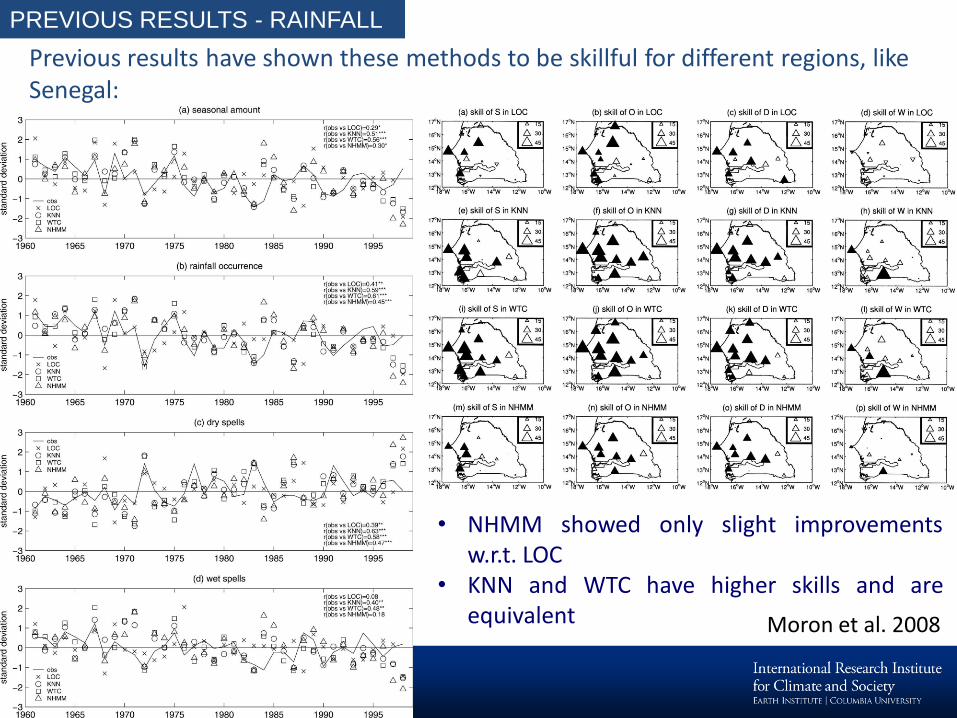
PREVIOUS RESULTS - RAINFALL
Moron et al. 2008
• NHMM showed only slight improvements w.r.t. LOC
• KNN and WTC have higher skills and are equivalent
Previous results have shown these methods to be skillful for different regions, like Senegal:
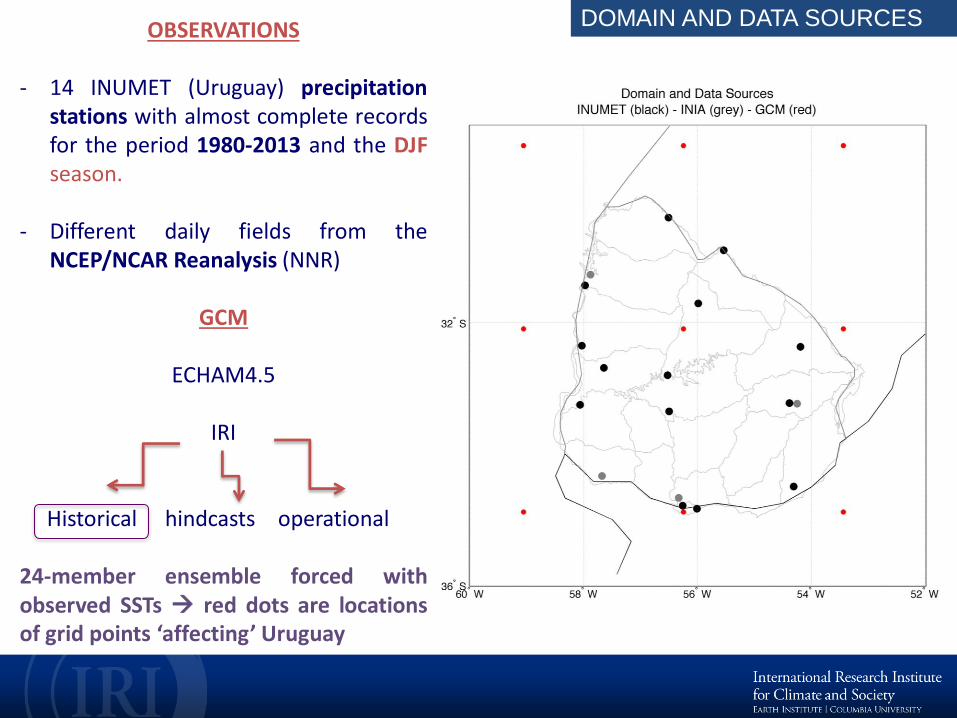
DOMAIN AND DATA SOURCES OBSERVATIONS
- 14 INUMET (Uruguay) precipitation stations with almost complete records for the period 1980-2013 and the DJF season.
- Different daily fields from the NCEP/NCAR Reanalysis (NNR)
GCM
ECHAM4.5
IRI Historical hindcasts operational 24-member ensemble forced with observed SSTs red dots are locations of grid points ‘affecting’ Uruguay
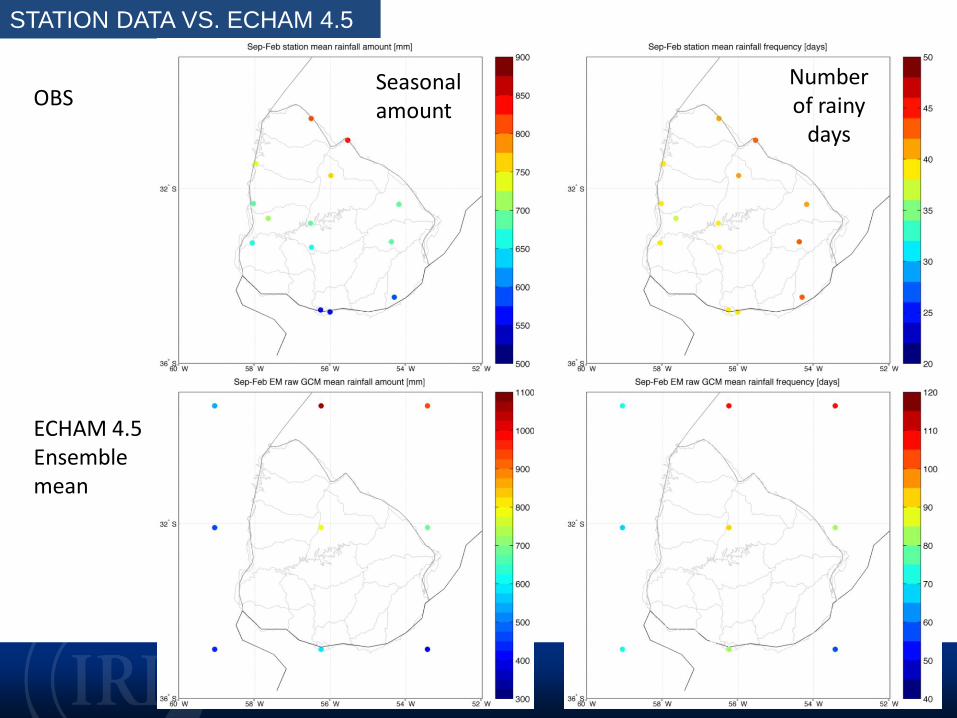
STATION DATA VS. ECHAM 4.5
Seasonal amount
Number of rainy
days
OBS
ECHAM 4.5 Ensemble mean
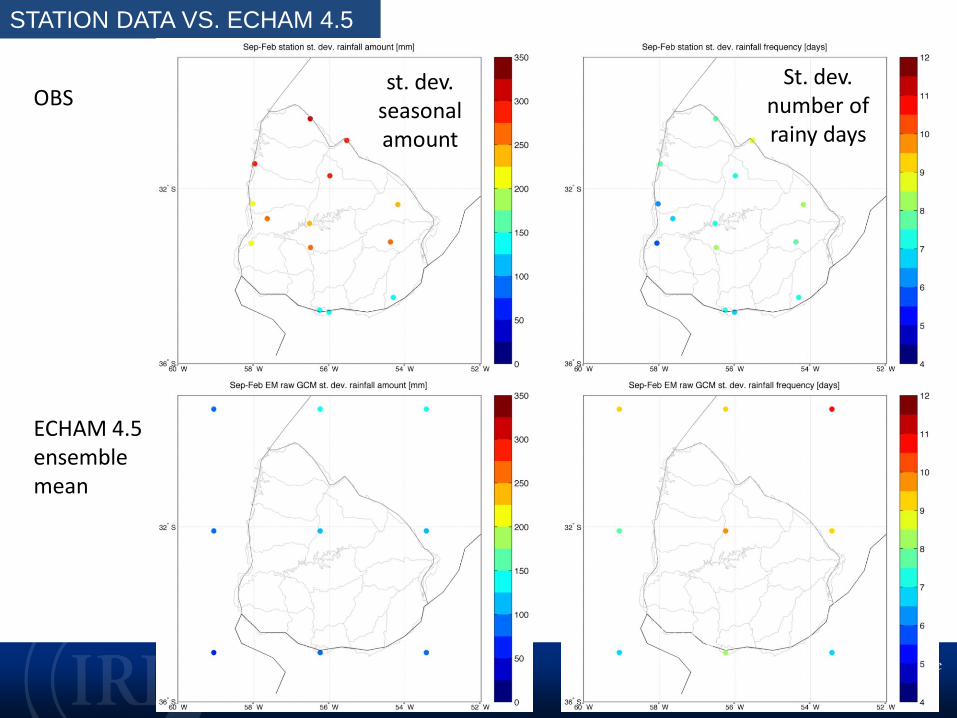
STATION DATA VS. ECHAM 4.5
St. dev. number of rainy days
OBS
ECHAM 4.5 ensemble mean
st. dev. seasonal amount
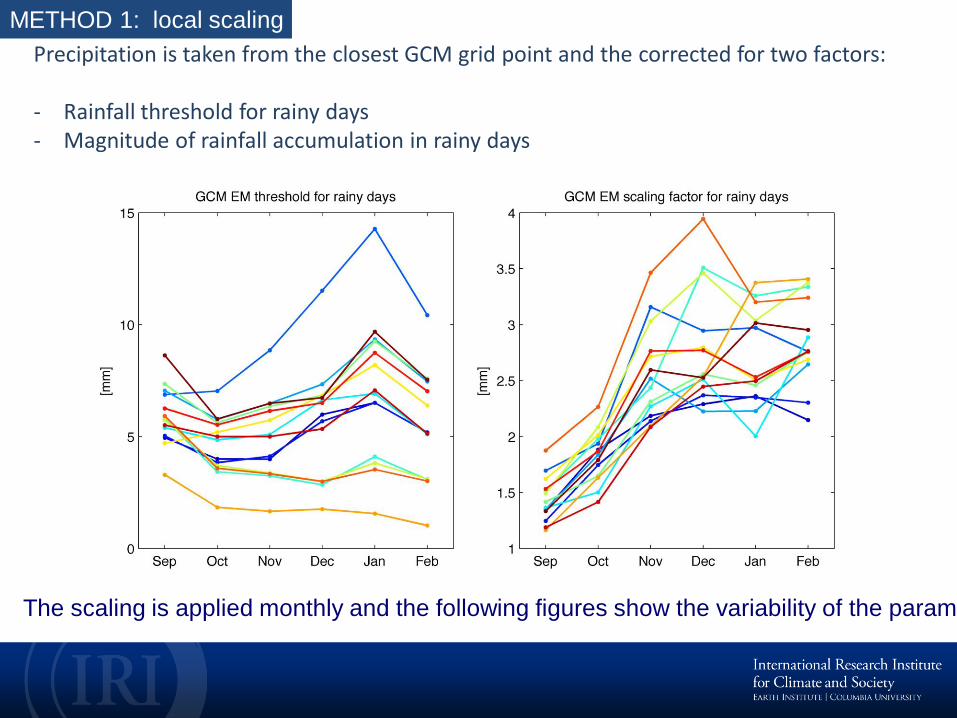
METHOD 1: local scaling
The scaling is applied monthly and the following figures show the variability of the parameters
Precipitation is taken from the closest GCM grid point and the corrected for two factors: - Rainfall threshold for rainy days - Magnitude of rainfall accumulation in rainy days
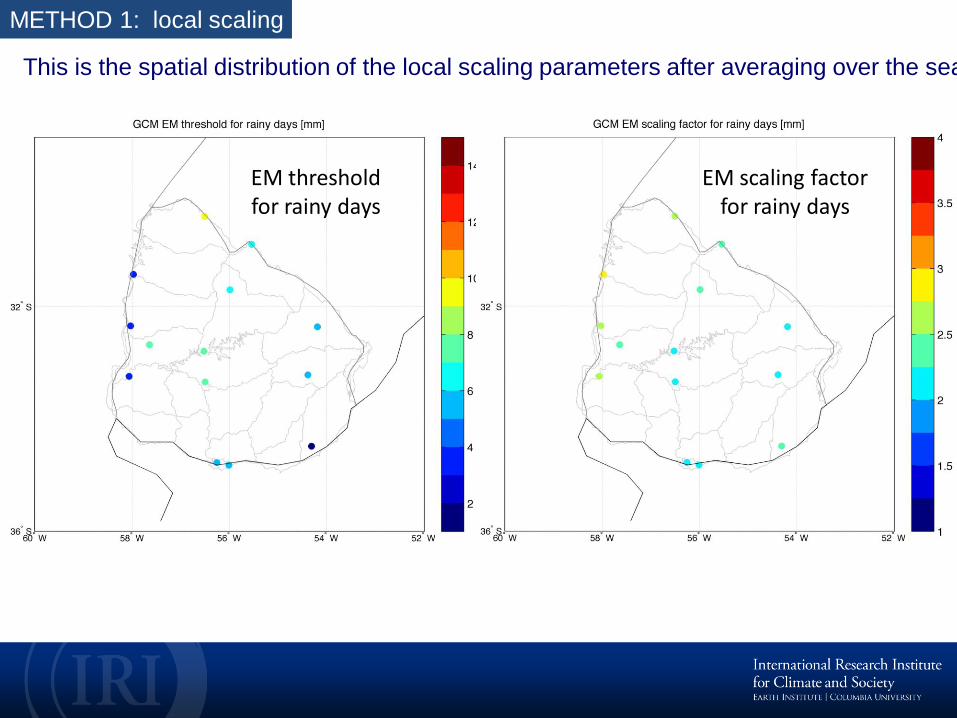
METHOD 1: local scaling
This is the spatial distribution of the local scaling parameters after averaging over the season
EM threshold for rainy days
EM scaling factor for rainy days
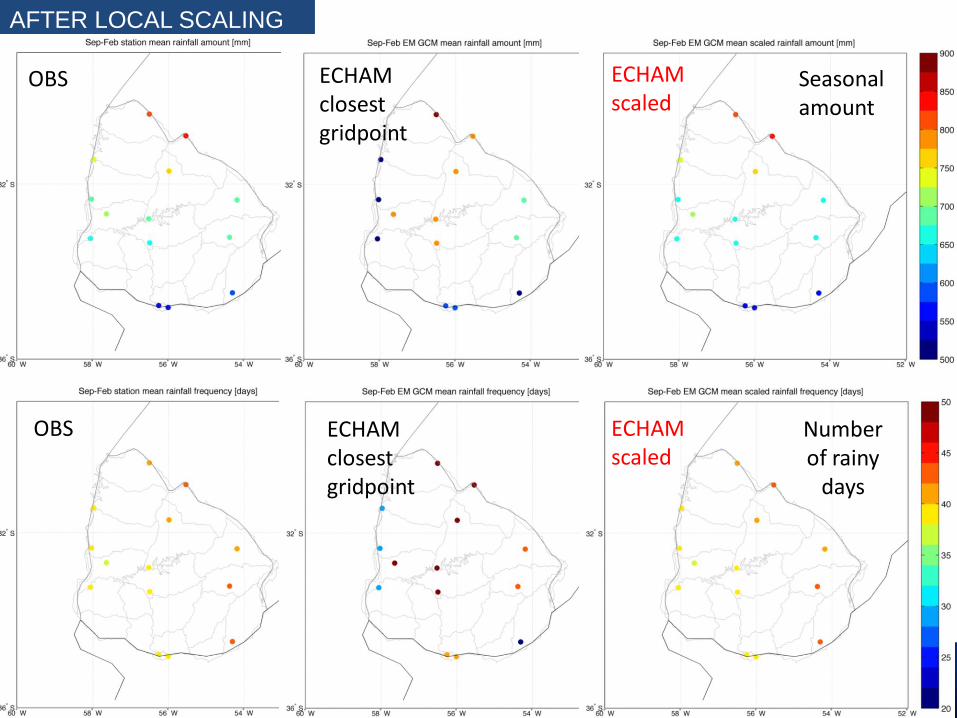
AFTER LOCAL SCALING
OBS
OBS
ECHAM closest gridpoint
Seasonal amount
Number of rainy
days
ECHAM closest gridpoint
ECHAM scaled
ECHAM scaled
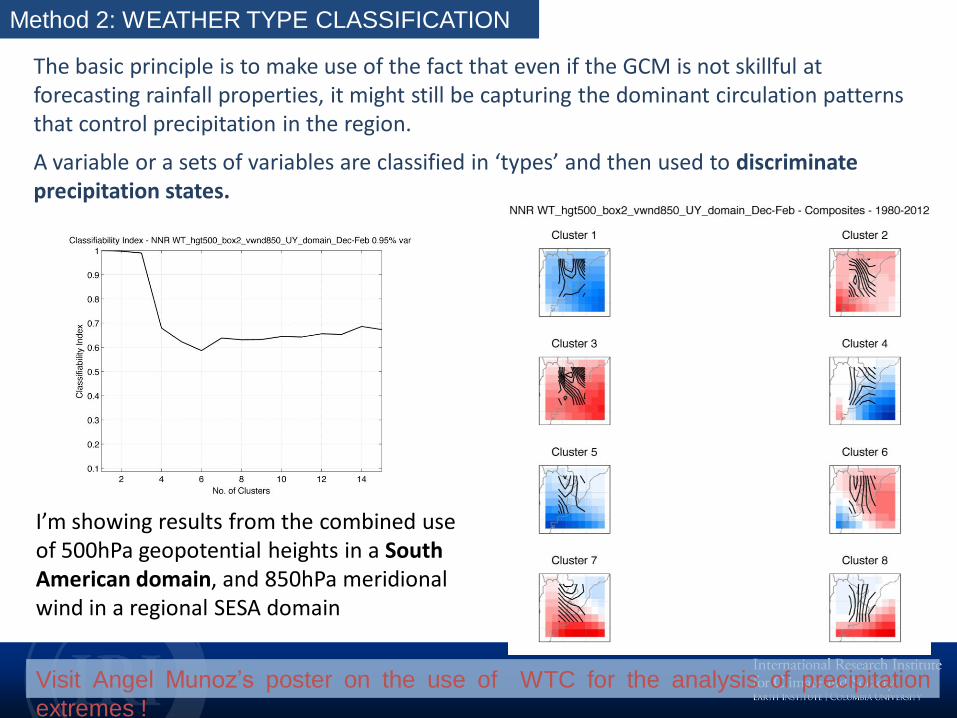
Method 2: WEATHER TYPE CLASSIFICATION
Visit Angel Munoz’s poster on the use of WTC for the analysis of precipitation
extremes !
The basic principle is to make use of the fact that even if the GCM is not skillful at forecasting rainfall properties, it might still be capturing the dominant circulation patterns that control precipitation in the region.
A variable or a sets of variables are classified in ‘types’ and then used to discriminate precipitation states.
I’m showing results from the combined use of 500hPa geopotential heights in a South American domain, and 850hPa meridional wind in a regional SESA domain
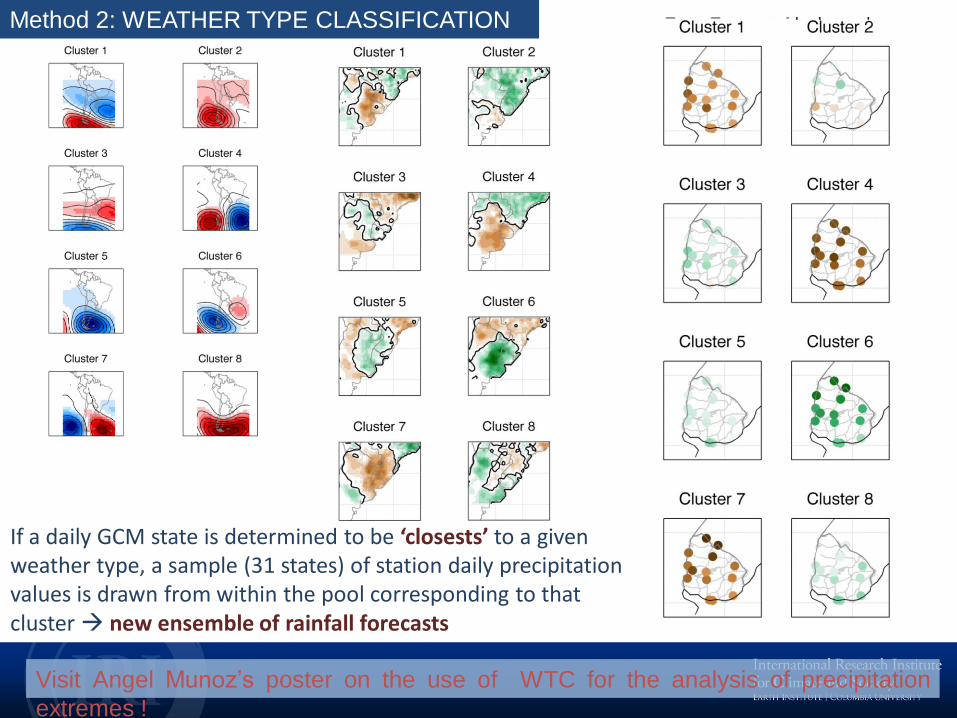
Method 2: WEATHER TYPE CLASSIFICATION
Visit Angel Munoz’s poster on the use of WTC for the analysis of precipitation
extremes !
If a daily GCM state is determined to be ‘closests’ to a given weather type, a sample (31 states) of station daily precipitation values is drawn from within the pool corresponding to that cluster new ensemble of rainfall forecasts
Method 3: K-NEAREST NEIGHBORS
The same combination of circulation ‘predictors’ is pre-filtered using a principal component analysis that retains 95% of the variance (20 daily PCs) NNR PCs The obtained reanalysis EOFs are projected onto each ensemble member of the GCM to obtain a set of ECHAM PCs Without going through the extra WTC step, each occurrence of a GCM daily predictor field is linked to a set of k-nearest neighbors (31) , within the pool of station precipitation states corresponding to the observed reanalysis states. new ensemble of rainfall forecasts
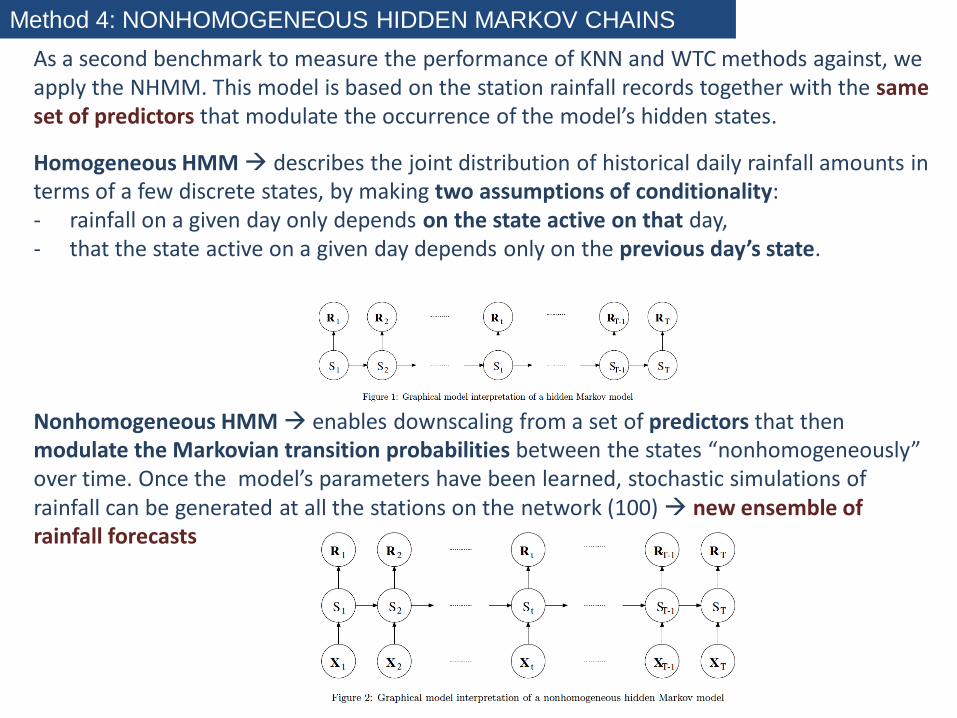
Method 4: NONHOMOGENEOUS HIDDEN MARKOV CHAINS As a second benchmark to measure the performance of KNN and WTC methods against, we apply the NHMM. This model is based on the station rainfall records together with the same set of predictors that modulate the occurrence of the model’s hidden states.
Homogeneous HMM describes the joint distribution of historical daily rainfall amounts in terms of a few discrete states, by making two assumptions of conditionality: - rainfall on a given day only depends on the state active on that day, - that the state active on a given day depends only on the previous day’s state. Nonhomogeneous HMM enables downscaling from a set of predictors that then modulate the Markovian transition probabilities between the states “nonhomogeneously” over time. Once the model’s parameters have been learned, stochastic simulations of rainfall can be generated at all the stations on the network (100) new ensemble of rainfall forecasts
RESULTS
RESULTS
WHAT NEXT ???
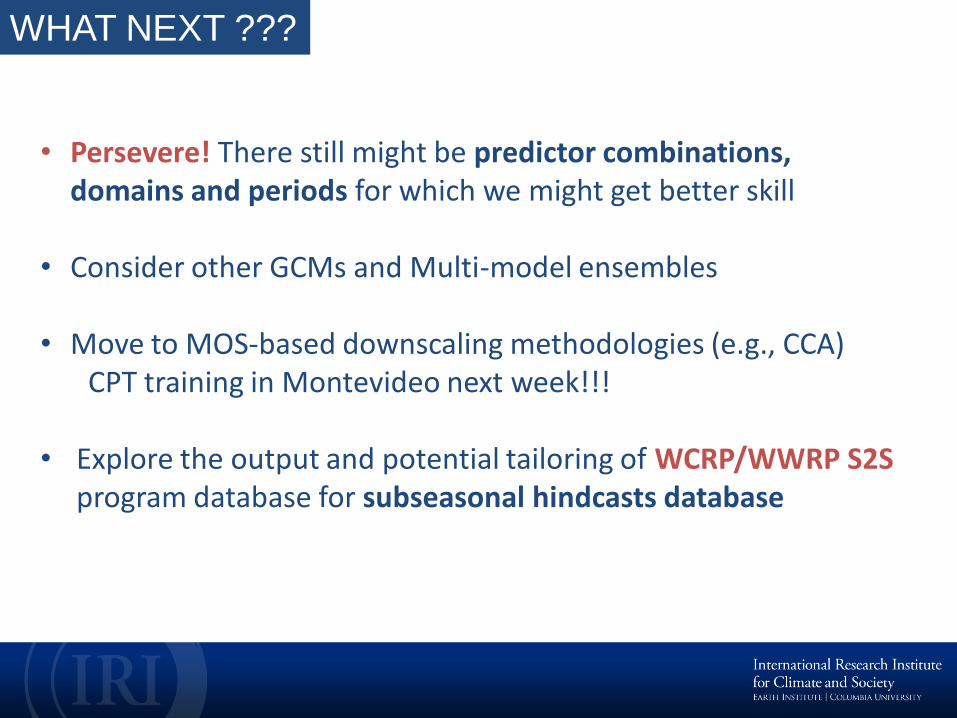
• Persevere! There still might be predictor combinations, domains and periods for which we might get better skill
• Consider other GCMs and Multi-model ensembles
• Move to MOS-based downscaling methodologies (e.g., CCA) CPT training in Montevideo next week!!! • Explore the output and potential tailoring of WCRP/WWRP S2S
program database for subseasonal hindcasts database