Embed Size (px)
Citation preview
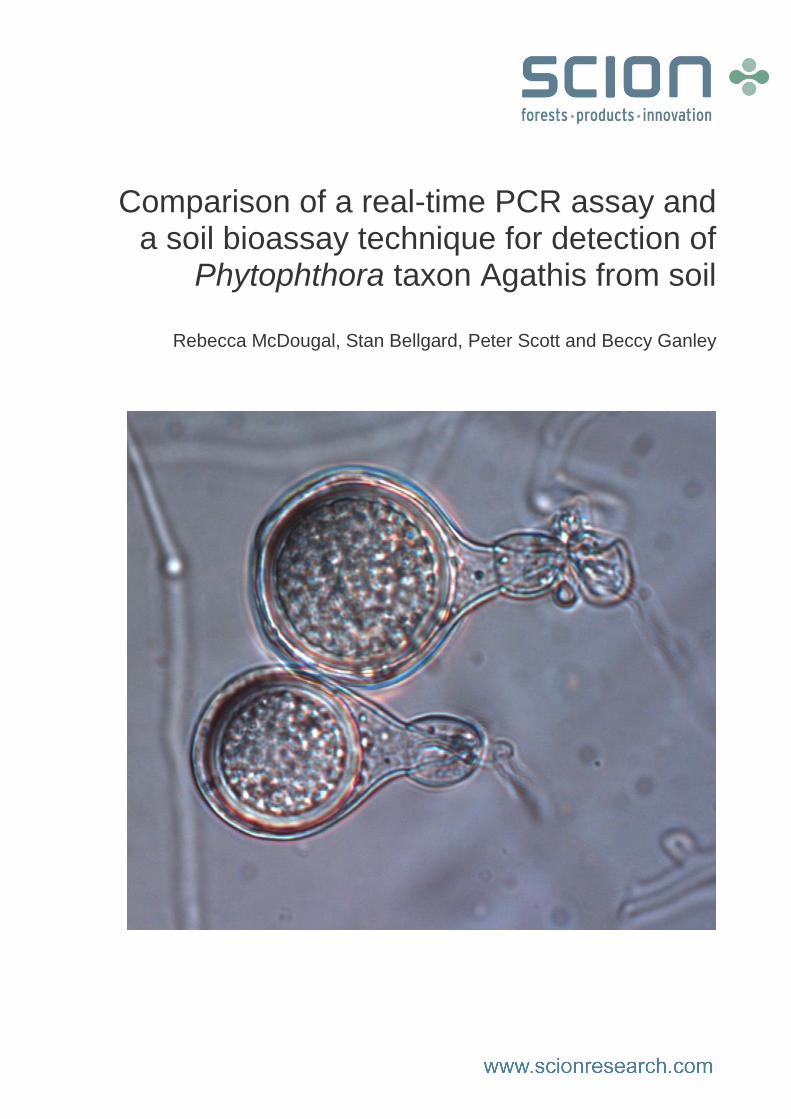
Comparison of a real-time PCR assay and a soil bioassay technique for detection of
Phytophthora taxon Agathis from soil
Rebecca McDougal, Stan Bellgard, Peter Scott and Beccy Ganley
REPORT INFORMATION SHEET REPORT TITLE
COMPARISON OF A REAL-TIME PCR ASSAY AND A SOIL BIOASSAY
TECHNIQUE FOR DETECTION OF PHYTOPHTHORA TAXON AGATHIS
FROM SOIL
AUTHORS
REBECCA MCDOUGAL, PETER SCOTT AND BECCY GANLEY [SCION]; STAN BELLGARD [LANDCARE RESEARCH]
CLIENT
KAURI DIEBACK JOINT AGENCY RESPONSE
CLIENT CONTRACT
NO:
17101 - TECHNIQUE FOR DETECTION OF PHYTOPHTHORA TAXON
AGATHIS
SIDNEY OUTPUT
NUMBER
53789
DATE
JUNE 2014
CONFIDENTIALITY
REQUIREMENT
CONFIDENTIAL (FOR CLIENT USE ONLY)
INTELLECTUAL
PROPERTY
© NEW ZEALAND FOREST RESEARCH INSTITUTE LIMITED ALL RIGHTS RESERVED. UNLESS PERMITTED BY CONTRACT OR LAW, NO PART OF THIS WORK MAY BE REPRODUCED, STORED OR COPIED
IN ANY FORM OR BY ANY MEANS WITHOUT THE EXPRESS PERMISSION
OF THE NEW ZEALAND FOREST RESEARCH INSTITUTE
LIMITED (TRADING AS SCION). Disclaimer The information and opinions provided in the Report have been prepared for the Client and its specified purposes. Accordingly, any person other than the Client uses the information and opinions in this report entirely at its own risk. The Report has been provided in good faith and on the basis that reasonable endeavours have been made to be accurate and not misleading and to exercise reasonable care, skill and judgment in providing such information and opinions.
Neither Scion, nor any of its employees, officers, contractors, agents or other persons acting on its behalf
or under its control accepts any responsibility or liability in respect of any information or opinions provided
in this Report.
(i)
EXECUTIVE SUMMARY
Comparison of a real-time PCR assay and a soil bioassay technique for detection of
Phytophthora taxon Agathis from soil Rebecca McDougal, Stan Bellgard, Peter Scott, and Rebecca Ganley
The problem
In order to slow the spread of Phytophthora taxon Agathis (PTA) and to undertake measures to limit its effect on individual trees and on ecosystems, specific and accurate detection of PTA is required for reliable delimitation and diagnostic purposes. The development of a real-time PCR assay for molecular detection of PTA from soil samples provides an opportunity to increase diagnostic throughput, accuracy and cost-effectiveness. However, a comparison of current PTA detection methods with the real-time PCR assay is needed to determine the advantages and disadvantages of the two individual methods.
This project This project compares the efficacy of real-time PCR versus conventional soil bioassay for detection of PTA from soil samples. Samples collected from around trees known to be infected with PTA and a set of reference soil samples from Landcare Research were tested. The real-time PCR detection efficiencies were compared in a double-blind experiment between laboratories at Scion and Landcare Research. The results from the real-time PCR were then compared to conventional soil bioassay results to assess the robustness and reliability of each method.
Key Results
There were two deviations from the published real-time PCR assay: A reverse-complement of the published sequence was required and the probe was also shortened by two nucleotides; and DNA was ethanol precipitated and purified using an alternative kit as the automated DNA extraction X-tractor was not available to researchers at Scion. The DNA extraction method was laborious with the number of samples tested. Issues identified with the method could bias the extraction procedure and influence the effectiveness of the DNA extraction when a large number of samples are required to be processed. There was considerable variation in the detection or recovery of PTA both between organisations and between the detection methods used. Of the 26 soil samples tested 13 samples tested positive for PTA but only one soil sample, RT PCR 11, tested positive at both organisations using both detection methods. Scion detected or recovered PTA from 13 of the soil samples tested and Landcare detected or recovered PTA from five samples, with four equivocal PCR results. The real-time PCR assay detected PTA in nine of the samples, with an additional three equivocal PCR results. The soil bioassay recovered PTA from eight of the soil samples. Of the 13 positive PTA detections, only four of these were detected or recovered by both the real-time PCR and the bioassay.
Implications of Results for Client The overall rate of detection or recovery of PTA between real-time PCR and the bioassays was very similar and one technique over the other could not be recommended at this stage. Both methods are effective at detecting PTA in soil samples but changes to the current protocols could potentially improve detection rates. If real-time PCR was chosen as the preferred method of detection, then results that are inconclusive from the initial PCR reaction could be repeated with increased volumes of DNA or the bioassay could be subsequently performed.
Page 2 of 23
Recommendations Based on the results from this study we would recommend the following:
1. DNA extraction is trialled using a paint-shaker (or equivalent instrument) and results are compared to manual vigorous shaking.
2. The bulk method of DNA extraction used in this study (and changes recommended) are compared to DNA extraction using a kit (e.g. MO-BIO, 10g samples) with multiple sub-samples and pooling of extracts for PCR.
3. A DNA extraction internal control (e.g. spiked Phytophthora DNA or oospores from a different species) is used to assist in identifying soil sample extractions where DNA recovery is low.
4. A combination of both methods of detection are adopted for PTA detection from soil samples, until improvements, as discussed in this report, can be made to increase detection rates.
Comparison of a real-time PCR assay and a soil bioassay technique for detection of Phytophthora taxon Agathis from soil Rebecca McDougal1, Stanley Bellgard2, Peter Scott1 and Rebecca Ganley1
1Scion, 2Landcare Research
June 2014
Table of Contents
EXECUTIVE SUMMARY ------------------------------------------------------------------------------------------- i Introduction ----------------------------------------------------------------------------------------------------------5 Materials and Methods --------------------------------------------------------------------------------------------6
Soil samples -------------------------------------------------------------------------------------------------------6 Real-time PCR assay --------------------------------------------------------------------------------------------6 Bioassay ------------------------------------------------------------------------------------------------------------7
Results and Discussion ------------------------------------------------------------------------------------------7 Soil samples -------------------------------------------------------------------------------------------------------7 Deviations from published method----------------------------------------------------------------------------7 Difficulties encountered with the published method ------------------------------------------------------8 Real-time PCR assay --------------------------------------------------------------------------------------------9 Soil bioassays --------------------------------------------------------------------------------------------------- 11 Comparison of real-time PCR and soil bioassay results ----------------------------------------------- 11
Conclusions and Recommendations ---------------------------------------------------------------------- 13 Acknowledgements ---------------------------------------------------------------------------------------------- 14 References---------------------------------------------------------------------------------------------------------- 14 Appendix ------------------------------------------------------------------------------------------------------------ 15
1. Soil baiting standard operating protocol (SOP) for Phytophthora taxon Agathis (PTA) -- 15 2. Comparison of DNA detection from pre- and post-purified DNA ------------------------------- 16 3. Scion and Landcare real-time PCR assay results of soil samples ---------------------------- 17
Page 5 of 23
Introduction
Kauri dieback, caused by Phytophthora taxon Agathis (PTA), is a disease that poses a serious threat to our indigenous kauri. It was first discovered in 1972 on Great Barrier Island and since 2006, the organism has been found in the Auckland, Northland and Coromandel regions. The soil-based pathogen attacks the roots of kauri, destroying their ability to draw water and nutrients from the soil. PTA can kill kauri seedlings and trees of all ages and spreads easily through the transfer of organic matter. The goal of the Kauri Dieback Management Programme (KDM) is to manage the disease which includes slowing the spread of PTA and to undertake measures to limit its effect on individual trees and on ecosystems. Specific and accurate detection of PTA is essential for reliable delimitation and diagnostic purposes. Until recently detection of PTA has been performed with traditional soil bioassay (baiting) techniques and plating of cork cambium tissue samples from the advancing edge of trunk lesions to Phytophthora-selective media. This diagnostic method is time-consuming as it is dependent on the pathogen growing out onto the selective media. The minimum time a sample could be completed is 15 days, although most samples take between 20 and 25 days due the time taken for the cultures to grow. The development of a real-time PCR assay for molecular detection of PTA from soil samples provides an opportunity to increase diagnostic throughput, and potentially the accuracy and cost-effectiveness of sample numbers processed. Having an alternative, high-throughput system available is essential for the success of the programme‘s work. A preliminary investigation by (Bellgard, S., Landcare Research, pers. comm.) has shown that real-time PCR can be used to detect PTA in soil. In this study, 40 samples were tested from around a single infected tree. However, the real-time PCR assay has not been validated at any other sites, other than the Waitakere Ranges, and the variation between PTA detection using the real-time PCR assay with respect to the results obtained from conventional soil bioassay needs further parameterization. A comparison of current PTA detection methods with the real-time PCR assay will provide a clear understanding of the advantages and disadvantages of the two individual methods, with respect to accuracy, time and cost per sample. It is also expected to allow appropriate selection of, and improved confidence in, real-time PCR diagnostic approaches for field based diagnosis and future research projects. This project aims to compare the efficacy of real-time PCR versus conventional soil bioassay for detection of PTA from soil samples. Samples will be collected from around trees known to be infected with PTA by KDM and an additional set of reference soil samples from Landcare Research will also be tested. The real-time PCR detection efficiencies will be compared in a double-blind experiment between two independent laboratories. This will include cycle threshold for PTA detection (Cq values), and quantification of intra- and inter-sample variation (including ―true‖ and ―technical/experimental‖ replicates). The results from the real-time PCR will then be compared to conventional soil bioassay results to assess the robustness and reliability of each method.
Page 6 of 23
Materials and Methods
Soil samples Twenty soil samples, approximately 2 kg each, from sites known to be infected with PTA were provided by KDM. Soil was collected from around trees and was sent to Scion without any location or sourcing data to allow for ―blind‖ testing. Five reference soil samples, 2 kg each, from Landcare Research were also used. These samples had been used for a previous study (Beever et al. 2010) where they had been collected from Twin Peaks Track Site (Huia) every month during 2009/10 and mixed in cement mixer. Each soil sample soil was a composite of three trees and had been stored at 10°C at Landcare Research since they were collected. These soil samples are tested yearly for PTA and are known to still contain infective propagules of PTA. Five samples from this collection were selected for analysis. A negative control, a soil sample taken from Landcare Research premises, was also included. All soil samples were homogenised and dried for 2 days then divided into the appropriate amounts for the bioassay and real-time PCR assay. The samples were labelled Set A-D by an independent researcher and randomised within each set for ―blind‖ testing. Duplicate 175g soil samples were analysed by standard bioassay procedure and duplicate 200g soil samples were analysed by DNA extraction and real-time PCR. For samples to be processed by real-time PCR, soils were sieved through a 2 mm sieve. Soils were not sieved for samples to be processed by bioassay as it is not part of the current Standard Operating Procedure (SOP; Appendix 1), as approved by the KDM. Duplicate samples for the bioassay and real-time PCR assays were tested by researchers at Scion (Rotorua) and Landcare Research (Auckland). Samples were couriered to Landcare Research with the duplicate samples kept at ambient temperature until samples had been delivered to Landcare Research. Wherever possible, soil samples were treated the same, e.g. storage of samples upon receipt, work with soil samples to commence on the same day, to minimise sample variation. Soil sample temperatures were monitored in transit using iButtons.
Real-time PCR assay
Primers and probes for the specific detection of PTA as described by Than et al. 2013 were utilised for detection of PTA from soil samples.
Standard curves for between-laboratory comparison of the real-time PCR assay were produced using a genomic DNA preparation of the PTA type-strain ICMP 17027. The same DNA preparation was used in both laboratories. Standard curves were generated on real-time PCR instruments at both organisations using DNA concentrations ranging from 2 ng/µl to 2 fg/µl DNA as per Than et al. (2013). The specificity of the real-time PCR assay was also determined at both organisations by testing with against 2ng DNA from five Phytophthora species: P. cinnamomi (NZFS 102.17), P. cryptogea (NZFS 2558), P. kernoviae (NZFS 2646), P. multivora (NZFS 2750), and PTA (NZFS 3128 Scion; NZFS 3772 Landcare).
DNA extraction from soil samples were performed as described previously by Than et al. (2013). As Scion does not have an automated DNA extraction X-tractor machine, which are no longer commercially available, an alternative purification step was performed.

Page 7 of 23
Instead, 1 ml of the DNA was concentrated by ethanol precipitation (final volume of 200ul)
and 100l of the concentrated DNA was purified using a MO BIO kit (Pro PowerClean® DNA Clean-Up Kit; #12997-50) was used to purify the DNA. The soil samples were extracted in three blocks, randomised as follows: Day1 - A, B, C, D, F, G, O, P; Day 2- E, I, K, N, Q, S, V, Z, X; Day 3 - H, J, L, M, R, T, U, W, Y. Real-time PCR was performed on triplicate reactions for each soil sample as described previously by Than et al. (2013). The same PCR kit (TaqMan® Environmental Master Mix 2.0, Life Technologies) and Internal Positive control kit (TaqMan® Environmental Master Mix 2.0, Life Technologies) were also used as per the published method. At Scion, real-time PCR was performed on an Eco Real-time PCR instrument (Illumina) and at Landcare Research a Rotor-Gene 6000 instrument (Qiagen) was used.
Bioassay
Each soil sample was assayed as per the SOP (Appendix 1.) for bioassay detection of PTA.
Results and Discussion
Soil samples The temperature of soil samples sent in chilly bins between organisations were recorded during transit. The average temperature for transit of soils was 15.1°C, with temperatures ranging from 12.5 °C to 20.5°C. The soil samples were at 20.5 °C (Scion‘s laboratory temperature) at the start of transit for approximately 20 mins and cooled down to 12.5 °C during transit. Although these temperature differences could influence bioassay recovery between labs this is considered unlikely as these variations have not impacted PTA bioassay results for other projects where soil samples have been sent and tested between multiple organisations (Scott, P., Scion, pers.comm.).
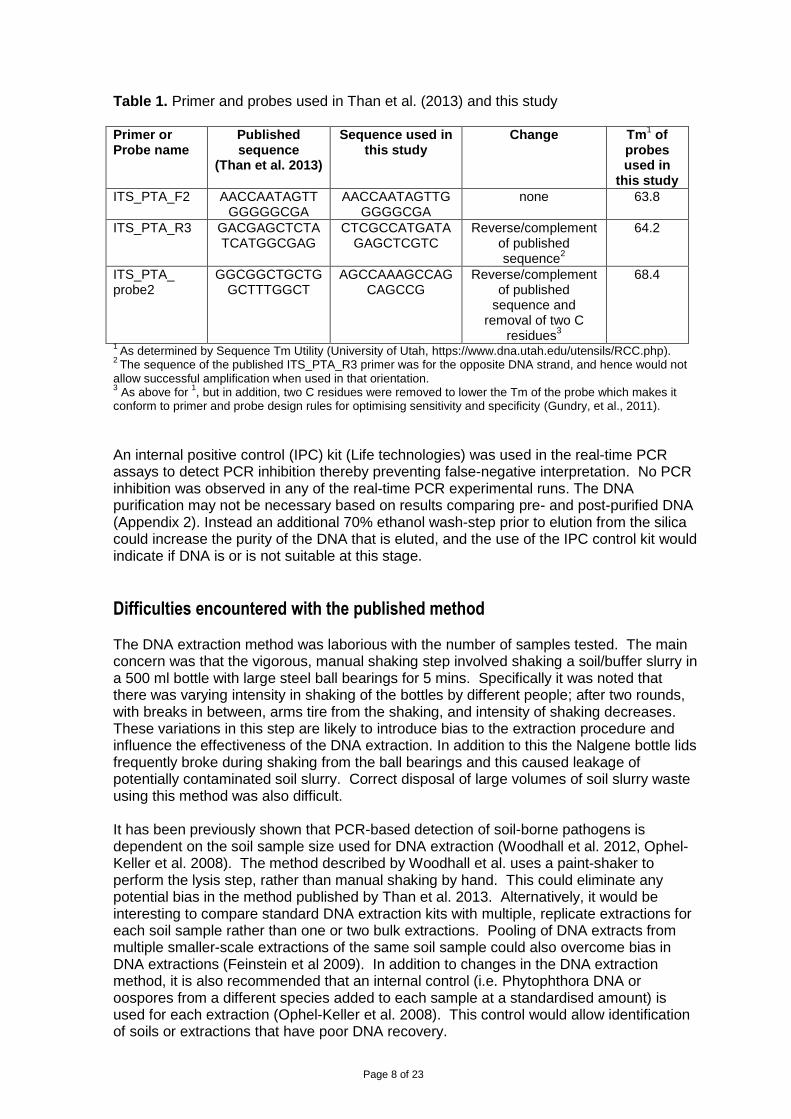
Deviations from published method The PTA reverse primer and probe used in this study differed from the Than et al. (2013) published procedure (Table 1). In Than et al. (2013) the PTA reverse primer sequence was published in an incorrect orientation and resulted in no amplification product. Reverse-complement of the published sequence allowed successful amplification and detection of the amplicon. The probe was also shortened by two nucleotides to reduce the annealing temperature and increase sensitivity. The new probe was used for the duration of the project. The final steps of the published PTA assay was unable to be performed at Scion, as Scion does not an automated DNA extraction X-tractor machine and they are no longer commercially available. A purification step was required as measurement of DNA (via Nanodrop) indicated the presence of contaminants in the DNA extracts. In addition to this, PCR on aliquots of selected extracts, spiked with genomic DNA and serially diluted, showed variable amplification and some PCR inhibition. To purify the DNA, 1 ml of the DNA was concentrated by ethanol precipitation (final volume of 100ul) and a MO-BIO kit (Pro PowerClean® DNA Clean-Up Kit) was used.
Page 8 of 23
Table 1. Primer and probes used in Than et al. (2013) and this study Primer or Probe name
Published sequence
(Than et al. 2013)
Sequence used in this study
Change Tm1 of
probes used in
this study
ITS_PTA_F2 AACCAATAGTTGGGGGCGA
AACCAATAGTTGGGGGCGA
none 63.8
ITS_PTA_R3 GACGAGCTCTATCATGGCGAG
CTCGCCATGATAGAGCTCGTC
Reverse/complement of published sequence
2
64.2
ITS_PTA_ probe2
GGCGGCTGCTGGCTTTGGCT
AGCCAAAGCCAGCAGCCG
Reverse/complement of published
sequence and removal of two C
residues3
68.4
1 As determined by Sequence Tm Utility (University of Utah, https://www.dna.utah.edu/utensils/RCC.php).
2 The sequence of the published ITS_PTA_R3 primer was for the opposite DNA strand, and hence would not
allow successful amplification when used in that orientation. 3 As above for
1, but in addition, two C residues were removed to lower the Tm of the probe which makes it
conform to primer and probe design rules for optimising sensitivity and specificity (Gundry, et al., 2011).
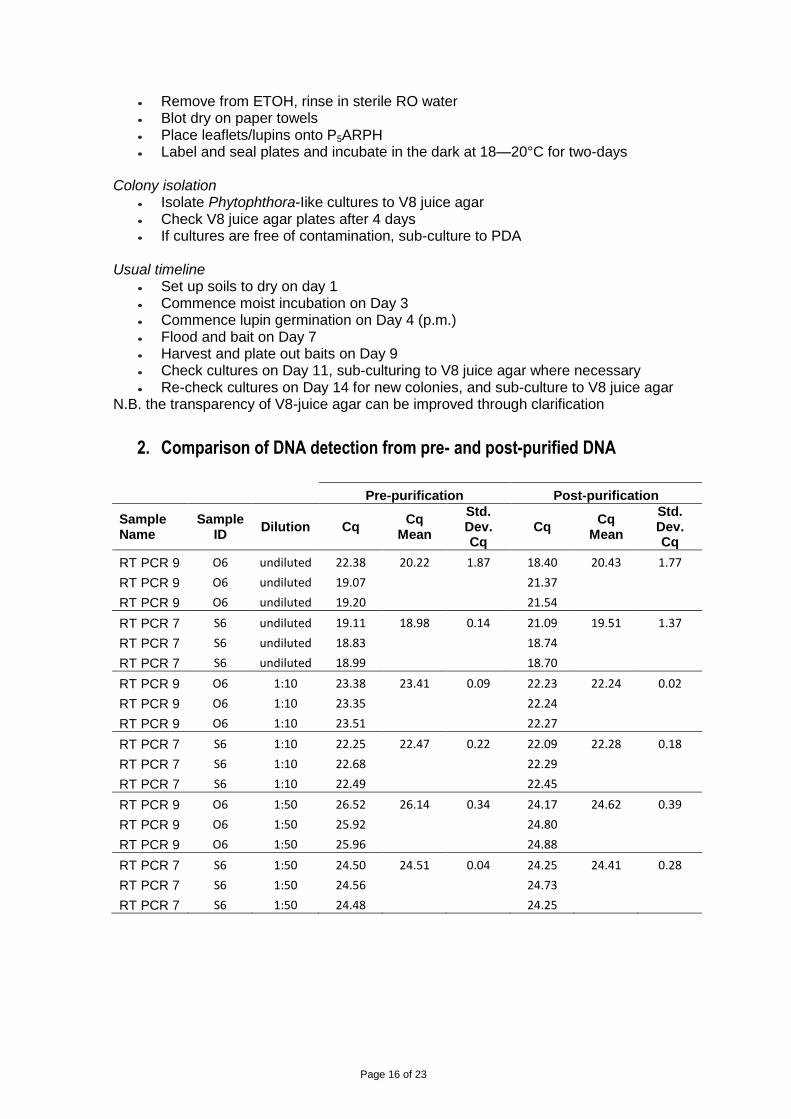
An internal positive control (IPC) kit (Life technologies) was used in the real-time PCR assays to detect PCR inhibition thereby preventing false-negative interpretation. No PCR inhibition was observed in any of the real-time PCR experimental runs. The DNA purification may not be necessary based on results comparing pre- and post-purified DNA (Appendix 2). Instead an additional 70% ethanol wash-step prior to elution from the silica could increase the purity of the DNA that is eluted, and the use of the IPC control kit would indicate if DNA is or is not suitable at this stage.
Difficulties encountered with the published method The DNA extraction method was laborious with the number of samples tested. The main concern was that the vigorous, manual shaking step involved shaking a soil/buffer slurry in a 500 ml bottle with large steel ball bearings for 5 mins. Specifically it was noted that there was varying intensity in shaking of the bottles by different people; after two rounds, with breaks in between, arms tire from the shaking, and intensity of shaking decreases. These variations in this step are likely to introduce bias to the extraction procedure and influence the effectiveness of the DNA extraction. In addition to this the Nalgene bottle lids frequently broke during shaking from the ball bearings and this caused leakage of potentially contaminated soil slurry. Correct disposal of large volumes of soil slurry waste using this method was also difficult. It has been previously shown that PCR-based detection of soil-borne pathogens is dependent on the soil sample size used for DNA extraction (Woodhall et al. 2012, Ophel-Keller et al. 2008). The method described by Woodhall et al. uses a paint-shaker to perform the lysis step, rather than manual shaking by hand. This could eliminate any potential bias in the method published by Than et al. 2013. Alternatively, it would be interesting to compare standard DNA extraction kits with multiple, replicate extractions for each soil sample rather than one or two bulk extractions. Pooling of DNA extracts from multiple smaller-scale extractions of the same soil sample could also overcome bias in DNA extractions (Feinstein et al 2009). In addition to changes in the DNA extraction method, it is also recommended that an internal control (i.e. Phytophthora DNA or oospores from a different species added to each sample at a standardised amount) is used for each extraction (Ophel-Keller et al. 2008). This control would allow identification of soils or extractions that have poor DNA recovery.
Page 9 of 23
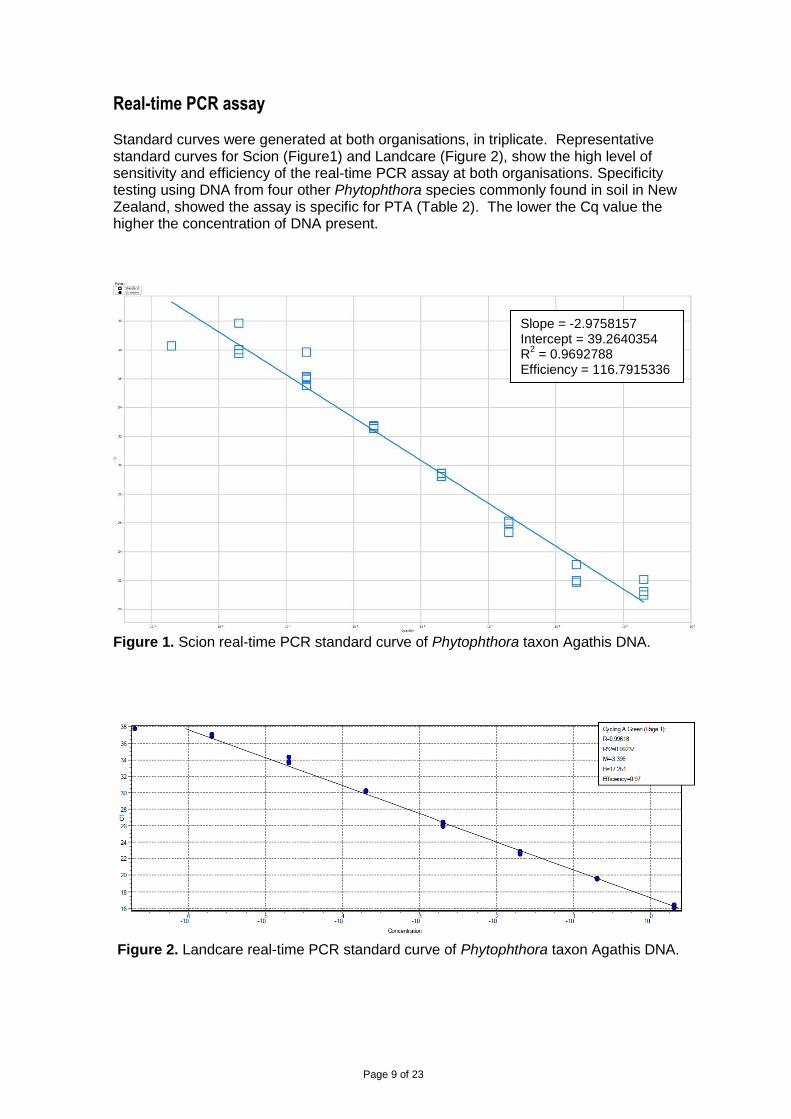
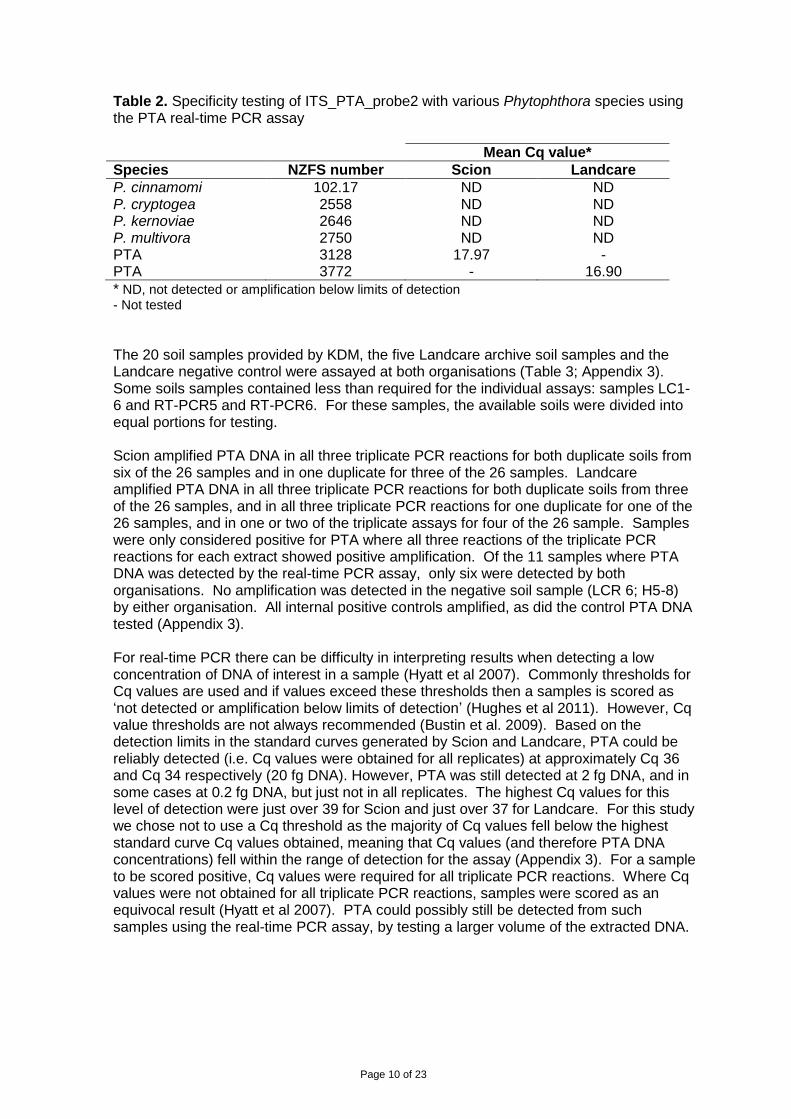
Real-time PCR assay Standard curves were generated at both organisations, in triplicate. Representative standard curves for Scion (Figure1) and Landcare (Figure 2), show the high level of sensitivity and efficiency of the real-time PCR assay at both organisations. Specificity testing using DNA from four other Phytophthora species commonly found in soil in New Zealand, showed the assay is specific for PTA (Table 2). The lower the Cq value the higher the concentration of DNA present.
Figure 1. Scion real-time PCR standard curve of Phytophthora taxon Agathis DNA.
Figure 2. Landcare real-time PCR standard curve of Phytophthora taxon Agathis DNA.
Slope = -2.9758157 Intercept = 39.2640354 R
2 = 0.9692788
Efficiency = 116.7915336
Page 10 of 23
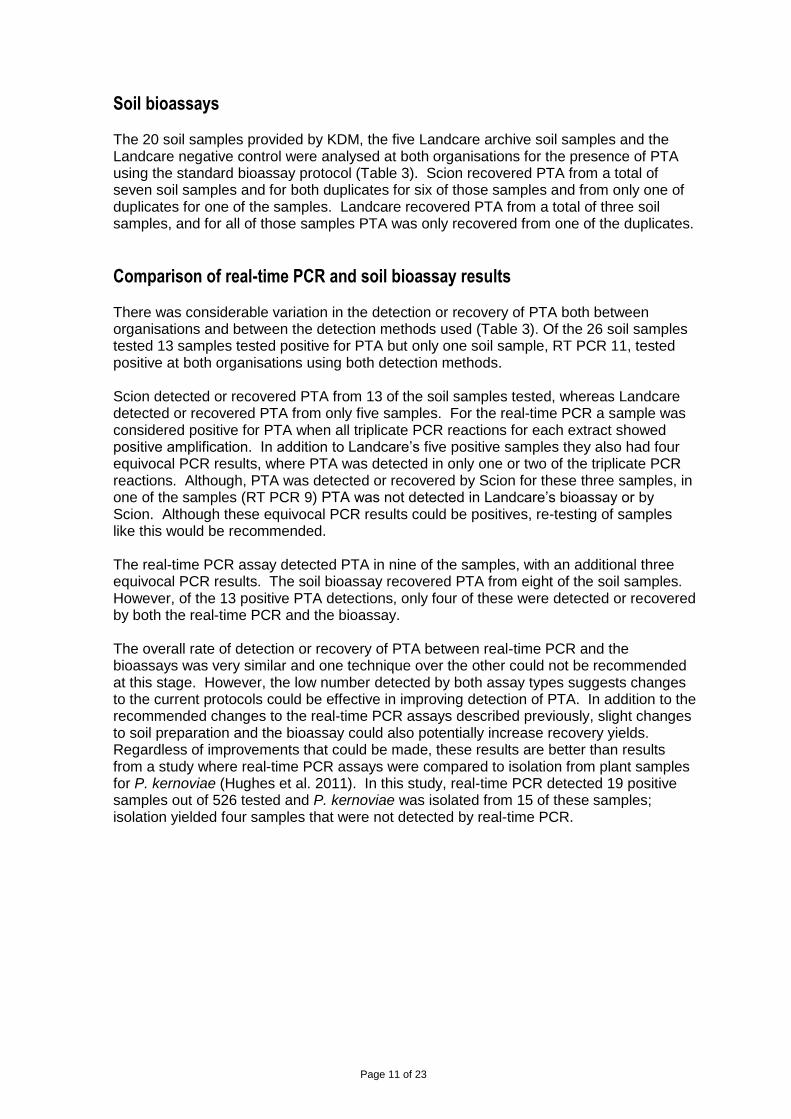
Table 2. Specificity testing of ITS_PTA_probe2 with various Phytophthora species using the PTA real-time PCR assay
Mean Cq value*
Species NZFS number Scion Landcare
P. cinnamomi 102.17 ND ND P. cryptogea 2558 ND ND P. kernoviae 2646 ND ND P. multivora 2750 ND ND PTA 3128 17.97 - PTA 3772 - 16.90
* ND, not detected or amplification below limits of detection - Not tested
The 20 soil samples provided by KDM, the five Landcare archive soil samples and the Landcare negative control were assayed at both organisations (Table 3; Appendix 3). Some soils samples contained less than required for the individual assays: samples LC1-6 and RT-PCR5 and RT-PCR6. For these samples, the available soils were divided into equal portions for testing. Scion amplified PTA DNA in all three triplicate PCR reactions for both duplicate soils from six of the 26 samples and in one duplicate for three of the 26 samples. Landcare amplified PTA DNA in all three triplicate PCR reactions for both duplicate soils from three of the 26 samples, and in all three triplicate PCR reactions for one duplicate for one of the 26 samples, and in one or two of the triplicate assays for four of the 26 sample. Samples were only considered positive for PTA where all three reactions of the triplicate PCR reactions for each extract showed positive amplification. Of the 11 samples where PTA DNA was detected by the real-time PCR assay, only six were detected by both organisations. No amplification was detected in the negative soil sample (LCR 6; H5-8) by either organisation. All internal positive controls amplified, as did the control PTA DNA tested (Appendix 3). For real-time PCR there can be difficulty in interpreting results when detecting a low concentration of DNA of interest in a sample (Hyatt et al 2007). Commonly thresholds for Cq values are used and if values exceed these thresholds then a samples is scored as ‗not detected or amplification below limits of detection‘ (Hughes et al 2011). However, Cq value thresholds are not always recommended (Bustin et al. 2009). Based on the detection limits in the standard curves generated by Scion and Landcare, PTA could be reliably detected (i.e. Cq values were obtained for all replicates) at approximately Cq 36 and Cq 34 respectively (20 fg DNA). However, PTA was still detected at 2 fg DNA, and in some cases at 0.2 fg DNA, but just not in all replicates. The highest Cq values for this level of detection were just over 39 for Scion and just over 37 for Landcare. For this study we chose not to use a Cq threshold as the majority of Cq values fell below the highest standard curve Cq values obtained, meaning that Cq values (and therefore PTA DNA concentrations) fell within the range of detection for the assay (Appendix 3). For a sample to be scored positive, Cq values were required for all triplicate PCR reactions. Where Cq values were not obtained for all triplicate PCR reactions, samples were scored as an equivocal result (Hyatt et al 2007). PTA could possibly still be detected from such samples using the real-time PCR assay, by testing a larger volume of the extracted DNA.
Page 11 of 23
Soil bioassays The 20 soil samples provided by KDM, the five Landcare archive soil samples and the Landcare negative control were analysed at both organisations for the presence of PTA using the standard bioassay protocol (Table 3). Scion recovered PTA from a total of seven soil samples and for both duplicates for six of those samples and from only one of duplicates for one of the samples. Landcare recovered PTA from a total of three soil samples, and for all of those samples PTA was only recovered from one of the duplicates.
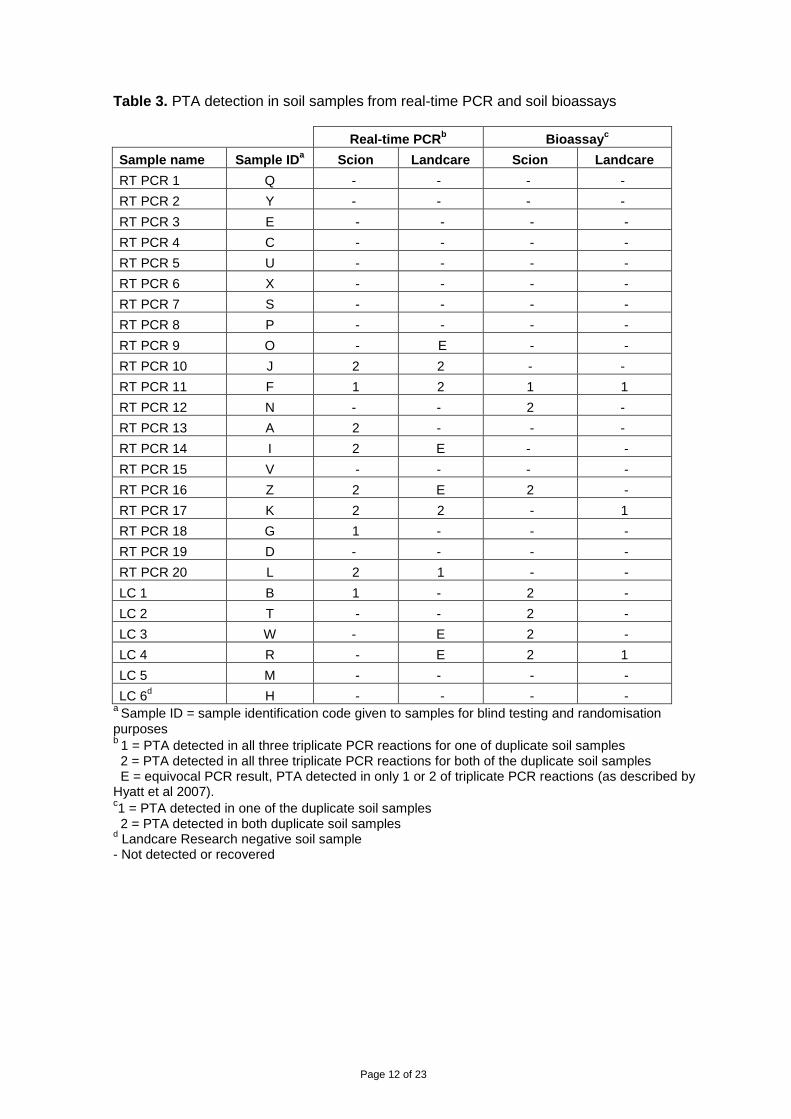
Comparison of real-time PCR and soil bioassay results There was considerable variation in the detection or recovery of PTA both between organisations and between the detection methods used (Table 3). Of the 26 soil samples tested 13 samples tested positive for PTA but only one soil sample, RT PCR 11, tested positive at both organisations using both detection methods. Scion detected or recovered PTA from 13 of the soil samples tested, whereas Landcare detected or recovered PTA from only five samples. For the real-time PCR a sample was considered positive for PTA when all triplicate PCR reactions for each extract showed positive amplification. In addition to Landcare‘s five positive samples they also had four equivocal PCR results, where PTA was detected in only one or two of the triplicate PCR reactions. Although, PTA was detected or recovered by Scion for these three samples, in one of the samples (RT PCR 9) PTA was not detected in Landcare‘s bioassay or by Scion. Although these equivocal PCR results could be positives, re-testing of samples like this would be recommended. The real-time PCR assay detected PTA in nine of the samples, with an additional three equivocal PCR results. The soil bioassay recovered PTA from eight of the soil samples. However, of the 13 positive PTA detections, only four of these were detected or recovered by both the real-time PCR and the bioassay. The overall rate of detection or recovery of PTA between real-time PCR and the bioassays was very similar and one technique over the other could not be recommended at this stage. However, the low number detected by both assay types suggests changes to the current protocols could be effective in improving detection of PTA. In addition to the recommended changes to the real-time PCR assays described previously, slight changes to soil preparation and the bioassay could also potentially increase recovery yields. Regardless of improvements that could be made, these results are better than results from a study where real-time PCR assays were compared to isolation from plant samples for P. kernoviae (Hughes et al. 2011). In this study, real-time PCR detected 19 positive samples out of 526 tested and P. kernoviae was isolated from 15 of these samples; isolation yielded four samples that were not detected by real-time PCR.
Page 12 of 23
Table 3. PTA detection in soil samples from real-time PCR and soil bioassays
Real-time PCRb Bioassay
c
Sample name Sample IDa
Scion Landcare Scion Landcare
RT PCR 1 Q - - - -
RT PCR 2 Y - - - -
RT PCR 3 E - - - -
RT PCR 4 C - - - -
RT PCR 5 U - - - -
RT PCR 6 X - - - -
RT PCR 7 S - - - -
RT PCR 8 P - - - -
RT PCR 9 O - E - -
RT PCR 10 J 2 2 - -
RT PCR 11 F 1 2 1 1
RT PCR 12 N - - 2 -
RT PCR 13 A 2 - - -
RT PCR 14 I 2 E - -
RT PCR 15 V - - - -
RT PCR 16 Z 2 E 2 -
RT PCR 17 K 2 2 - 1
RT PCR 18 G 1 - - -
RT PCR 19 D - - - -
RT PCR 20 L 2 1 - -
LC 1 B 1 - 2 -
LC 2 T - - 2 -
LC 3 W - E 2 -
LC 4 R - E 2 1
LC 5 M - - - -
LC 6d H - - - -
a Sample ID = sample identification code given to samples for blind testing and randomisation
purposes b
1 = PTA detected in all three triplicate PCR reactions for one of duplicate soil samples 2 = PTA detected in all three triplicate PCR reactions for both of the duplicate soil samples E = equivocal PCR result, PTA detected in only 1 or 2 of triplicate PCR reactions (as described by Hyatt et al 2007). c1 = PTA detected in one of the duplicate soil samples
2 = PTA detected in both duplicate soil samples d Landcare Research negative soil sample
- Not detected or recovered
Page 13 of 23
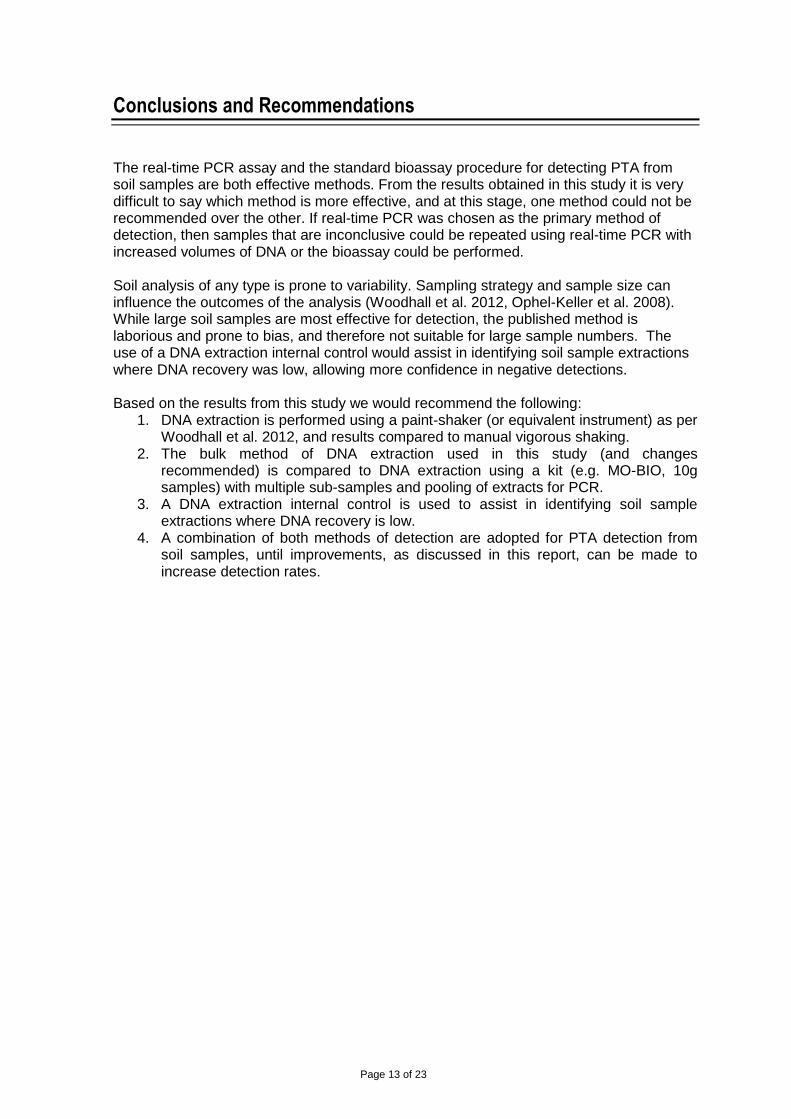
Conclusions and Recommendations
The real-time PCR assay and the standard bioassay procedure for detecting PTA from soil samples are both effective methods. From the results obtained in this study it is very difficult to say which method is more effective, and at this stage, one method could not be recommended over the other. If real-time PCR was chosen as the primary method of detection, then samples that are inconclusive could be repeated using real-time PCR with increased volumes of DNA or the bioassay could be performed. Soil analysis of any type is prone to variability. Sampling strategy and sample size can influence the outcomes of the analysis (Woodhall et al. 2012, Ophel-Keller et al. 2008). While large soil samples are most effective for detection, the published method is laborious and prone to bias, and therefore not suitable for large sample numbers. The use of a DNA extraction internal control would assist in identifying soil sample extractions where DNA recovery was low, allowing more confidence in negative detections. Based on the results from this study we would recommend the following:
1. DNA extraction is performed using a paint-shaker (or equivalent instrument) as per Woodhall et al. 2012, and results compared to manual vigorous shaking.
2. The bulk method of DNA extraction used in this study (and changes recommended) is compared to DNA extraction using a kit (e.g. MO-BIO, 10g samples) with multiple sub-samples and pooling of extracts for PCR.
3. A DNA extraction internal control is used to assist in identifying soil sample extractions where DNA recovery is low.
4. A combination of both methods of detection are adopted for PTA detection from soil samples, until improvements, as discussed in this report, can be made to increase detection rates.
Page 14 of 23
Acknowledgements
Nari Williams, Anna Caird, Catherine Banham, Pam Taylor, Judy Gardner, Heather Flint, and other technical staff at Scion; Chantal Probst, Nitish Anand, and other technical staff at Landcare Research, for their assistance in this project. John Mackay (dnature) for helpful discussions and advice on the real-time PCR and probe design.
References
Beever, R. E., Bellgard, S. E., Dick, M. A., Horner, I. J., & Ramsfield, T. D. (2010). Detection of
Phytophthora taxon Agathis (PTA): Final Report.: Landcare Research. Bustin S.A., Benes V., Garson J.A., Hellemans J., Huggett J., Kubista M., Mueller R., Nolan T.,
Pfaffl M.W., Shipley G.L., Vandesompele J., & Wittwer C.T. (2009) The MIQE guidelines: minimum information for publication of quantitative real-time PCR experiments. Clinical Chemistry 55, 611–622.
Feinstein L.M., Sul W.J. & Blackwood C.B. (2009) Assessment of bias associated with incomplete extraction of microbial DNA from soil. Applied and Environmental Microbiology, 75, 5428–5433.
Gundry, C. N., & Poulson, M. D. (2011). Obtaining maximum PCR sensitivity and specificity. In Kennedy, S. & Oswald, N. (Eds.), PCR troubleshooting and Optimization (pp. 79-96). Norfolk, UK: Caister Academic Press.
Hughes K.J.D., Tomlinson J.A., Giltrap P.M., Barton V., Hobden E., Boonham N., & Lane C.R. (2011). Development of a real-time PCR assay for detection of Phytophthora kernoviae and comparison of this method with a conventional culturing technique. European Journal of Plant Pathology 131.4: 695-703. doi: 10.1007/s10658-011-9843-x
Hyatt, A.D., DG Boyle, Olsen V., Boyle D.B., Berger L., Obendorf D., Dalton A., Kriger K., Hero M., Hines H., Phillott R., Campbell R., Marantelli G., Gleason F., & Colling A. (2007). Diagnostic assays and sampling protocols for the detection of Batrachochytrium dendrobatidis, Diseases of Aquatic Organisms, 73, 175–192.
Ophel-Keller, K., Mckay, A., Hartley, D., Herdina, & Curran, J. (2008). Development of a routine DNA-based testing service for soilborne diseases in Australia. Australasian Plant Pathology, 37, 243–253.
Than, D. J., Hughes, K. J. D., Boonhan, N., Tomlinson, J. A., Woodhall, J. W., & Bellgard, S. E. (2013). A TaqMan real-time PCR assay for the detection of Phytophthora 'taxon Agathis' in soil, pathogen of Kauri in New Zealand. Forest Pathology, 43(4), 324-330. doi:Doi 10.1111/Efp.12034
Woodhall, J. W., Webb, K. M., Giltrap, P. M., Adams, I. P., Peters, J. C., Budge, G. E., & Boonham, N. (2012). A new large scale soil DNA extraction procedure and real-time PCR assay for the detection of Sclerotium cepivorum in soil. European Journal of Plant Pathology, 134, 467–473.
Page 15 of 23
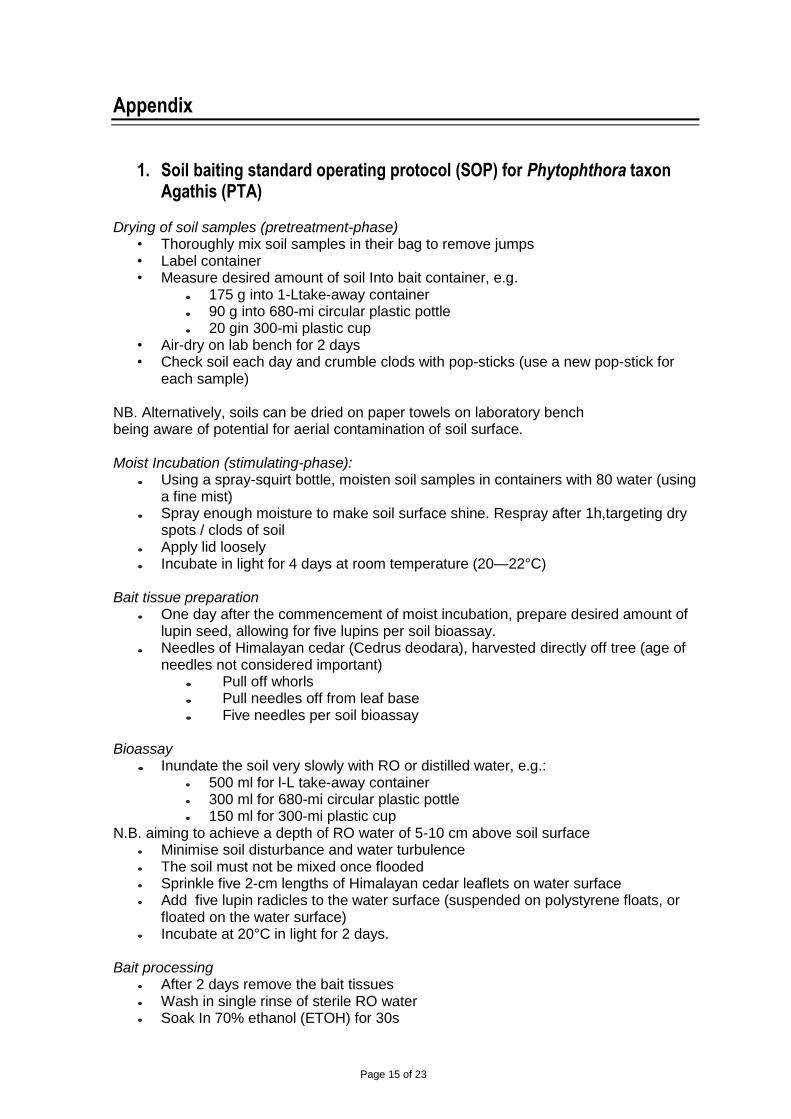
Appendix
1. Soil baiting standard operating protocol (SOP) for Phytophthora taxon Agathis (PTA)
Drying of soil samples (pretreatment-phase)
• Thoroughly mix soil samples in their bag to remove jumps • Label container • Measure desired amount of soil Into bait container, e.g.
• 175 g into 1-Ltake-away container
• 90 g into 680-mi circular plastic pottle
• 20 gin 300-mi plastic cup • Air-dry on lab bench for 2 days • Check soil each day and crumble clods with pop-sticks (use a new pop-stick for
each sample) NB. Alternatively, soils can be dried on paper towels on laboratory bench being aware of potential for aerial contamination of soil surface. Moist Incubation (stimulating-phase):
• Using a spray-squirt bottle, moisten soil samples in containers with 80 water (using a fine mist)
• Spray enough moisture to make soil surface shine. Respray after 1h,targeting dry spots / clods of soil
• Apply lid loosely
• Incubate in light for 4 days at room temperature (20—22°C) Bait tissue preparation
• One day after the commencement of moist incubation, prepare desired amount of lupin seed, allowing for five lupins per soil bioassay.
• Needles of Himalayan cedar (Cedrus deodara), harvested directly off tree (age of needles not considered important)
• Pull off whorls
• Pull needles off from leaf base
• Five needles per soil bioassay Bioassay
• Inundate the soil very slowly with RO or distilled water, e.g.:
• 500 ml for l-L take-away container
• 300 ml for 680-mi circular plastic pottle
• 150 ml for 300-mi plastic cup N.B. aiming to achieve a depth of RO water of 5-10 cm above soil surface
• Minimise soil disturbance and water turbulence
• The soil must not be mixed once flooded
• Sprinkle five 2-cm lengths of Himalayan cedar leaflets on water surface
• Add five lupin radicles to the water surface (suspended on polystyrene floats, or floated on the water surface)
• Incubate at 20°C in light for 2 days. Bait processing
• After 2 days remove the bait tissues
• Wash in single rinse of sterile RO water
• Soak In 70% ethanol (ETOH) for 30s
Page 16 of 23
• Remove from ETOH, rinse in sterile RO water
• Blot dry on paper towels
• Place leaflets/lupins onto P5ARPH
• Label and seal plates and incubate in the dark at 18—20°C for two-days Colony isolation
• Isolate Phytophthora-Iike cultures to V8 juice agar
• Check V8 juice agar plates after 4 days
• If cultures are free of contamination, sub-culture to PDA Usual timeline
• Set up soils to dry on day 1
• Commence moist incubation on Day 3
• Commence lupin germination on Day 4 (p.m.)
• Flood and bait on Day 7
• Harvest and plate out baits on Day 9
• Check cultures on Day 11, sub-culturing to V8 juice agar where necessary
• Re-check cultures on Day 14 for new colonies, and sub-culture to V8 juice agar N.B. the transparency of V8-juice agar can be improved through clarification
2. Comparison of DNA detection from pre- and post-purified DNA
Pre-purification Post-purification
Sample Name
Sample ID
Dilution Cq Cq
Mean
Std. Dev. Cq
Cq Cq
Mean
Std. Dev. Cq
RT PCR 9 O6 undiluted 22.38 20.22 1.87 18.40 20.43 1.77
RT PCR 9 O6 undiluted 19.07
21.37 RT PCR 9 O6 undiluted 19.20 21.54
RT PCR 7 S6 undiluted 19.11 18.98 0.14 21.09 19.51 1.37
RT PCR 7 S6 undiluted 18.83
18.74 RT PCR 7 S6 undiluted 18.99 18.70
RT PCR 9 O6 1:10 23.38 23.41 0.09 22.23 22.24 0.02
RT PCR 9 O6 1:10 23.35
22.24 RT PCR 9 O6 1:10 23.51 22.27
RT PCR 7 S6 1:10 22.25 22.47 0.22 22.09 22.28 0.18
RT PCR 7 S6 1:10 22.68
22.29 RT PCR 7 S6 1:10 22.49 22.45
RT PCR 9 O6 1:50 26.52 26.14 0.34 24.17 24.62 0.39
RT PCR 9 O6 1:50 25.92
24.80 RT PCR 9 O6 1:50 25.96 24.88
RT PCR 7 S6 1:50 24.50 24.51 0.04 24.25 24.41 0.28
RT PCR 7 S6 1:50 24.56
24.73 RT PCR 7 S6 1:50 24.48 24.25

Page 17 of 23
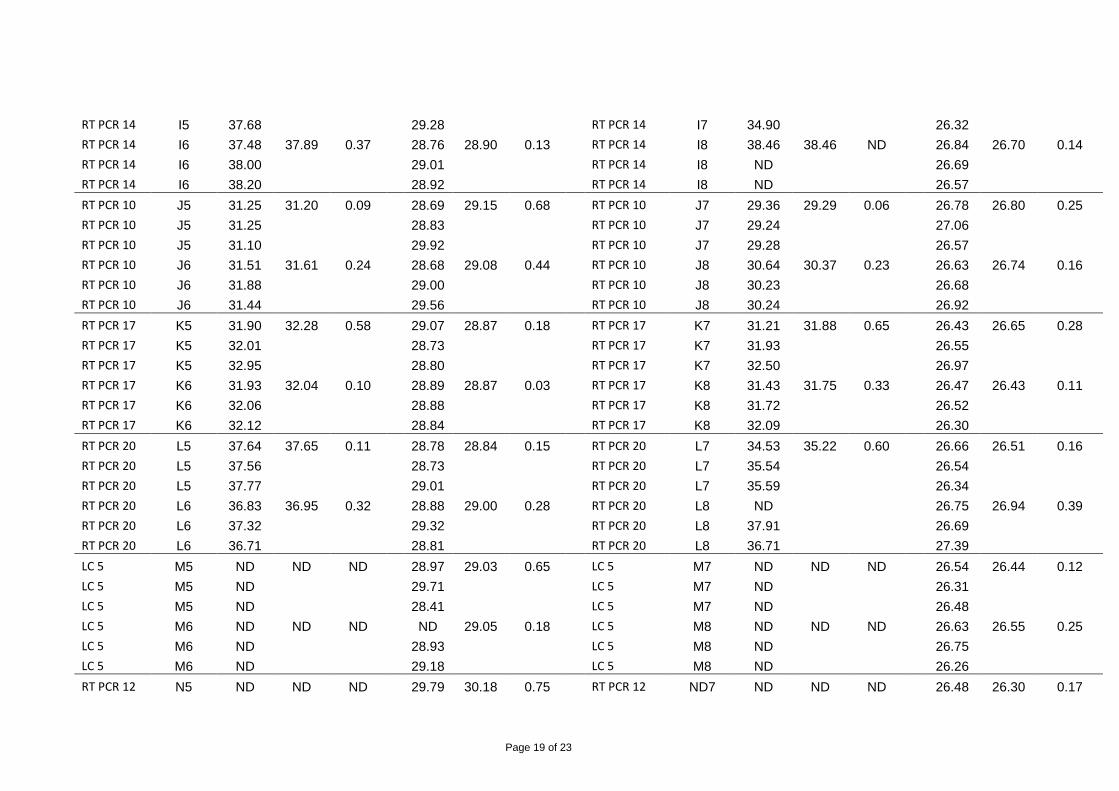
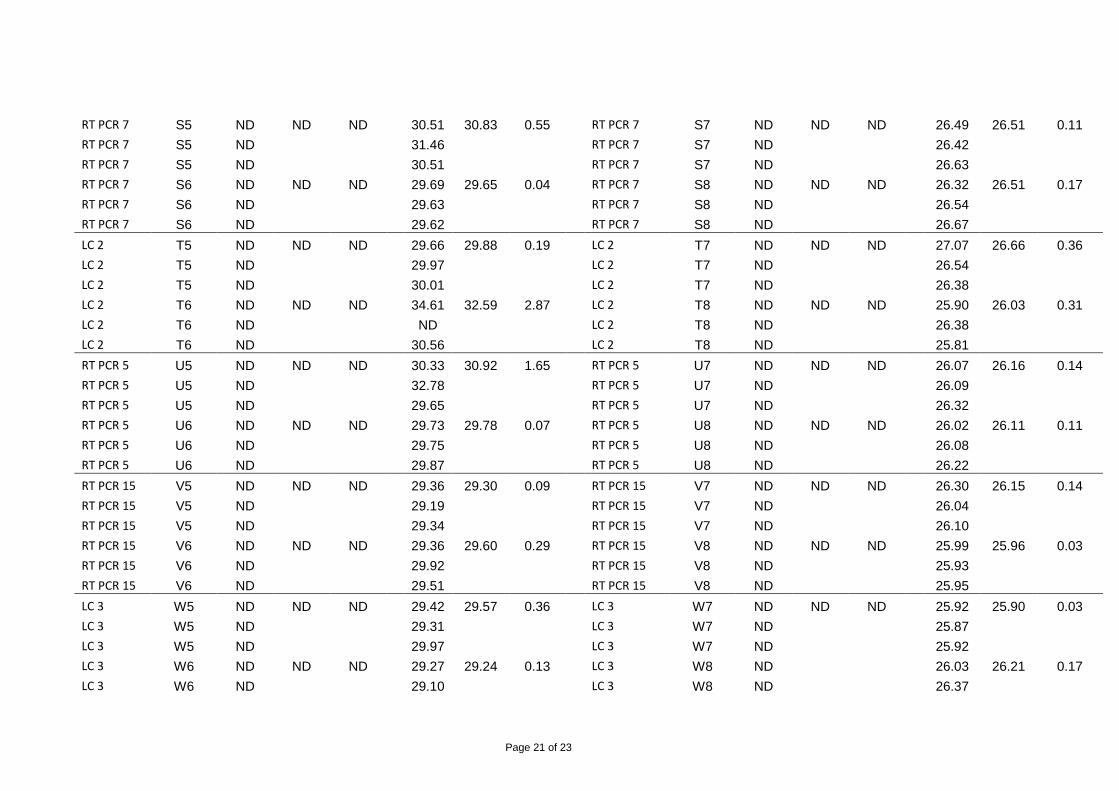
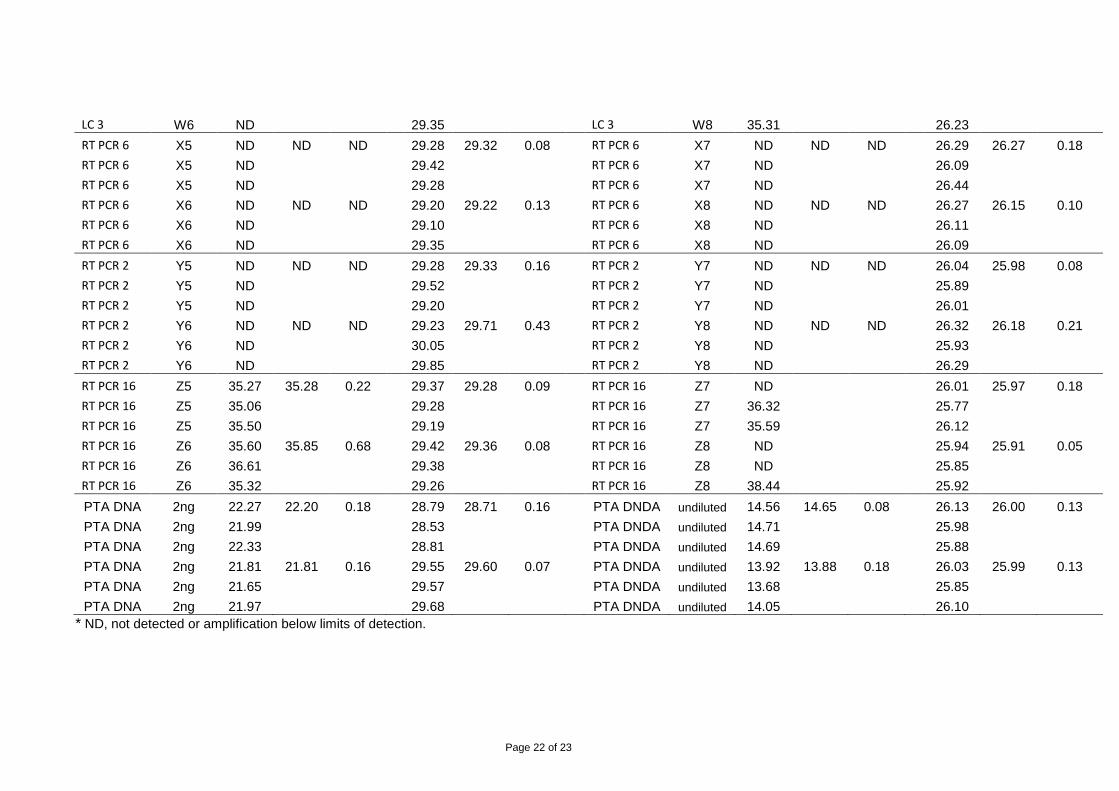
3. Scion and Landcare real-time PCR assay results of soil samples
Scion data*
Landcare data*
Soil samples
Internal positive control
Soil samples
Internal positive control
Sample name
Sample ID Cq
Cq Mean
Std. Dev. Cq Cq
Cq Mean
Std. Dev. Cq
Sample name
Sample ID Cq
Cq Mean
Std. Dev. Cq Cq
Cq Mean
Std. Dev. Cq
RT PCR 13 A5 ND 33.16 0.21
ND 30.15 0.06
RT PCR 13 A7 ND ND ND
26.55 26.49 0.12
RT PCR 13 A5 33.02
30.11
RT PCR 13 A7 ND
26.35 RT PCR 13 A5 33.31
30.19
RT PCR 13 A7 ND
26.56 RT PCR 13 A6 34.23 34.30 0.12
30.12 30.10 0.02
RT PCR 13 A8 ND ND ND
26.87 26.77 0.21
RT PCR 13 A6 34.43
30.08
RT PCR 13 A8 ND
26.92 RT PCR 13 A6 34.23 30.12 RT PCR 13 A8 ND 26.53
LC 1 B5 ND ND ND
29.97 30.22 0.30
LC 1 B7 ND ND ND
26.73 26.56 0.16
LC 1 B5 ND
30.12
LC 1 B7 ND
26.42 LC 1 B5 ND
30.56
LC 1 B7 ND
26.53 LC 1 B6 ND 37.87 0.02
29.97 30.09 0.11
LC 1 B8 ND ND ND
26.44 26.55 0.16
LC 1 B6 37.89
30.19
LC 1 B8 ND
26.48 LC 1 B6 37.86 30.12 LC 1 B8 ND 26.73
RT PCR 4 C5 ND ND ND
30.33 30.27 0.13
RT PCR 4 C7 ND ND ND
26.69 26.75 0.17
RT PCR 4 C5 ND
30.12
RT PCR 4 C7 ND
26.94 RT PCR 4 C5 ND
30.37
RT PCR 4 C7 ND
26.61 RT PCR 4 C6 ND ND ND
30.11 30.35 0.30
RT PCR 4 C8 ND ND ND
26.94 26.88 0.07
RT PCR 4 C6 ND
30.26
RT PCR 4 C8 ND
26.80 RT PCR 4 C6 ND 30.69 RT PCR 4 C8 ND 26.90
RT PCR 19 D5 ND ND ND
30.22 30.26 0.11
RT PCR 19 D7 ND ND ND
26.75 27.02 0.36
RT PCR 19 D5 ND
30.18
RT PCR 19 D7 ND
26.88 RT PCR 19 D5 ND
30.38
RT PCR 19 D7 ND
27.42

Page 18 of 23
RT PCR 19 D6 ND ND ND
30.19 30.05 0.26
RT PCR 19 D8 ND ND ND
27.12 26.98 0.21
RT PCR 19 D6 ND
30.19
RT PCR 19 D8 ND
26.74 RT PCR 19 D6 ND 29.75 RT PCR 19 D8 ND 27.09
RT PCR 3 E5 ND ND ND
30.09 30.14 0.26
RT PCR 3 E7 ND ND ND
26.87 26.77 0.13
RT PCR 3 E5 ND
29.92
RT PCR 3 E7 ND
26.82 RT PCR 3 E5 ND
30.42
RT PCR 3 E7 ND
26.62 RT PCR 3 E6 ND ND ND
30.26 30.27 0.05
RT PCR 3 E8 ND ND ND
26.31 26.53 0.20
RT PCR 3 E6 ND
30.23
RT PCR 3 E8 ND
26.70 RT PCR 3 E6 ND 30.32 RT PCR 3 E8 ND 26.57
RT PCR 11 F5 36.40 37.19 0.87
30.16 30.43 0.56
RT PCR 11 F7 34.35 34.81 0.43
26.59 26.77 0.31
RT PCR 11 F5 37.03
31.08
RT PCR 11 F7 34.86
26.58 RT PCR 11 F5 38.13
30.06
RT PCR 11 F7 35.22
27.12 RT PCR 11 F6 ND ND ND
30.75 30.93 0.27
RT PCR 11 F8 35.74 35.45 0.81
26.58 26.88 0.29
RT PCR 11 F6 ND
30.80
RT PCR 11 F8 34.52
26.93 RT PCR 11 F6 ND 31.24 RT PCR 11 F8 36.07 27.15
RT PCR 18 G5 ND ND ND
30.33 30.22 0.12
RT PCR 18 G7 ND ND ND
26.63 26.68 0.24
RT PCR 18 G5 ND
30.10
RT PCR 18 G7 ND
26.46 RT PCR 18 G5 ND
30.23
RT PCR 18 G7 ND
26.94 RT PCR 18 G6 39.53 39.15 0.54
30.19 30.25 0.37
RT PCR 18 G8 ND ND ND
26.55 26.62 0.07
RT PCR 18 G6 38.77 39.15 0.54
30.65
RT PCR 18 G8 ND
26.69 RT PCR 18 G6 ND 39.15 0.54 29.92 RT PCR 18 G8 ND 26.62
LC 6 H5 ND ND ND
29.32 29.16 0.14
LC 6 H7 ND ND ND
26.82 26.81 0.02
LC 6 H5 ND
29.07
LC 6 H7 ND
26.84 LC 6 H5 ND
29.08
LC 6 H7 ND
26.79 LC 6 H6 ND ND ND
29.22 29.31 0.13
LC 6 H8 ND ND ND
26.59 26.74 0.28
LC 6 H6 ND
ND
LC 6 H8 ND
26.57 LC 6 H6 ND 29.40 LC 6 H8 ND 27.06
RT PCR 14 I5 37.85 37.76 0.12
28.69 28.88 0.35
RT PCR 14 I7 ND 34.90 ND
26.25 26.37 0.15
RT PCR 14 I5 ND
28.68
RT PCR 14 I7 ND
26.53
Page 19 of 23
RT PCR 14 I5 37.68
29.28
RT PCR 14 I7 34.90
26.32 RT PCR 14 I6 37.48 37.89 0.37
28.76 28.90 0.13
RT PCR 14 I8 38.46 38.46 ND
26.84 26.70 0.14
RT PCR 14 I6 38.00
29.01
RT PCR 14 I8 ND
26.69 RT PCR 14 I6 38.20 28.92 RT PCR 14 I8 ND 26.57
RT PCR 10 J5 31.25 31.20 0.09
28.69 29.15 0.68
RT PCR 10 J7 29.36 29.29 0.06
26.78 26.80 0.25
RT PCR 10 J5 31.25
28.83
RT PCR 10 J7 29.24
27.06 RT PCR 10 J5 31.10
29.92
RT PCR 10 J7 29.28
26.57 RT PCR 10 J6 31.51 31.61 0.24
28.68 29.08 0.44
RT PCR 10 J8 30.64 30.37 0.23
26.63 26.74 0.16
RT PCR 10 J6 31.88
29.00
RT PCR 10 J8 30.23
26.68 RT PCR 10 J6 31.44 29.56 RT PCR 10 J8 30.24 26.92
RT PCR 17 K5 31.90 32.28 0.58
29.07 28.87 0.18
RT PCR 17 K7 31.21 31.88 0.65
26.43 26.65 0.28
RT PCR 17 K5 32.01
28.73
RT PCR 17 K7 31.93
26.55 RT PCR 17 K5 32.95
28.80
RT PCR 17 K7 32.50
26.97 RT PCR 17 K6 31.93 32.04 0.10
28.89 28.87 0.03
RT PCR 17 K8 31.43 31.75 0.33
26.47 26.43 0.11
RT PCR 17 K6 32.06
28.88
RT PCR 17 K8 31.72
26.52 RT PCR 17 K6 32.12 28.84 RT PCR 17 K8 32.09 26.30
RT PCR 20 L5 37.64 37.65 0.11
28.78 28.84 0.15
RT PCR 20 L7 34.53 35.22 0.60
26.66 26.51 0.16
RT PCR 20 L5 37.56
28.73
RT PCR 20 L7 35.54
26.54 RT PCR 20 L5 37.77
29.01
RT PCR 20 L7 35.59
26.34 RT PCR 20 L6 36.83 36.95 0.32
28.88 29.00 0.28
RT PCR 20 L8 ND
26.75 26.94 0.39
RT PCR 20 L6 37.32
29.32
RT PCR 20 L8 37.91
26.69 RT PCR 20 L6 36.71 28.81 RT PCR 20 L8 36.71 27.39
LC 5 M5 ND ND ND
28.97 29.03 0.65
LC 5 M7 ND ND ND
26.54 26.44 0.12
LC 5 M5 ND
29.71
LC 5 M7 ND
26.31 LC 5 M5 ND
28.41
LC 5 M7 ND
26.48 LC 5 M6 ND ND ND
ND 29.05 0.18
LC 5 M8 ND ND ND
26.63 26.55 0.25
LC 5 M6 ND
28.93
LC 5 M8 ND
26.75 LC 5 M6 ND 29.18 LC 5 M8 ND 26.26
RT PCR 12 N5 ND ND ND
29.79 30.18 0.75
RT PCR 12 ND7 ND ND ND
26.48 26.30 0.17

Page 20 of 23
RT PCR 12 N5 ND
31.04
RT PCR 12 ND7 ND
26.26 RT PCR 12 N5 ND
29.71
RT PCR 12 ND7 ND
26.16 RT PCR 12 N6 ND 38.91 ND
29.80 29.80 0.18
RT PCR 12 ND8 ND ND ND
26.22 26.33 0.09
RT PCR 12 N6 ND
29.62
RT PCR 12 ND8 ND
26.39 RT PCR 12 N6 38.91 29.98 RT PCR 12 ND8 ND 26.37
RT PCR 9 O5 ND ND ND
29.85 30.30 0.45
RT PCR 9 O7 37.16 37.16 ND
26.47 26.64 0.18
RT PCR 9 O5 ND
30.31
RT PCR 9 O7 ND
26.63 RT PCR 9 O5 ND
30.74
RT PCR 9 O7 ND
26.82 RT PCR 9 O6 ND ND ND
29.89 30.12 0.21
RT PCR 9 O8 ND ND ND
26.57 26.51 0.06
RT PCR 9 O6 ND
30.31
RT PCR 9 O8 ND
26.53 RT PCR 9 O6 ND 30.15 RT PCR 9 O8 ND 26.44
RT PCR 8 P5 ND ND ND
29.64 29.75 0.10
RT PCR 8 P7 ND ND ND
26.13 26.12 0.08
RT PCR 8 P5 ND
29.85
RT PCR 8 P7 ND
26.02 RT PCR 8 P5 ND
29.76
RT PCR 8 P7 ND
26.19 RT PCR 8 P6 ND ND ND
29.60 30.06 0.43
RT PCR 8 P8 ND ND ND
26.28 26.34 0.15
RT PCR 8 P6 ND
30.15
RT PCR 8 P8 ND
26.22 RT PCR 8 P6 ND 30.44 RT PCR 8 P8 ND 26.51
RT PCR 1 Q5 ND ND ND
29.68 29.67 0.12
RT PCR 1 Q7 ND ND ND
26.33 26.35 0.03
RT PCR 1 Q5 ND
29.79
RT PCR 1 Q7 ND
26.38 RT PCR 1 Q5 ND
29.55
RT PCR 1 Q7 ND
26.34 RT PCR 1 Q6 ND ND ND
31.47 31.14 0.35
RT PCR 1 Q8 ND ND ND
26.21 26.38 0.18
RT PCR 1 Q6 ND
31.19
RT PCR 1 Q8 ND
26.36 RT PCR 1 Q6 ND 30.76 RT PCR 1 Q8 ND 26.56
LC 4 R5 ND ND ND
29.65 29.76 0.21
LC 4 R7 ND 35.99 ND
26.53 26.49 0.08
LC 4 R5 ND
29.62
LC 4 R7 ND
26.54 LC 4 R5 ND
30.00
LC 4 R7 35.99
26.40 LC 4 R6 ND 38.52 ND
29.77 29.86 0.08
LC 4 R8 ND ND ND
26.53 26.49 0.22
LC 4 R6 ND
29.87
LC 4 R8 ND
26.25 LC 4 R6 38.52 29.94 LC 4 R8 ND 26.69
Page 21 of 23
RT PCR 7 S5 ND ND ND
30.51 30.83 0.55
RT PCR 7 S7 ND ND ND
26.49 26.51 0.11
RT PCR 7 S5 ND
31.46
RT PCR 7 S7 ND
26.42 RT PCR 7 S5 ND
30.51
RT PCR 7 S7 ND
26.63 RT PCR 7 S6 ND ND ND
29.69 29.65 0.04
RT PCR 7 S8 ND ND ND
26.32 26.51 0.17
RT PCR 7 S6 ND
29.63
RT PCR 7 S8 ND
26.54 RT PCR 7 S6 ND 29.62 RT PCR 7 S8 ND 26.67
LC 2 T5 ND ND ND
29.66 29.88 0.19
LC 2 T7 ND ND ND
27.07 26.66 0.36
LC 2 T5 ND
29.97
LC 2 T7 ND
26.54 LC 2 T5 ND
30.01
LC 2 T7 ND
26.38 LC 2 T6 ND ND ND
34.61 32.59 2.87
LC 2 T8 ND ND ND
25.90 26.03 0.31
LC 2 T6 ND
ND
LC 2 T8 ND
26.38 LC 2 T6 ND 30.56 LC 2 T8 ND 25.81
RT PCR 5 U5 ND ND ND
30.33 30.92 1.65
RT PCR 5 U7 ND ND ND
26.07 26.16 0.14
RT PCR 5 U5 ND
32.78
RT PCR 5 U7 ND
26.09 RT PCR 5 U5 ND
29.65
RT PCR 5 U7 ND
26.32 RT PCR 5 U6 ND ND ND
29.73 29.78 0.07
RT PCR 5 U8 ND ND ND
26.02 26.11 0.11
RT PCR 5 U6 ND
29.75
RT PCR 5 U8 ND
26.08 RT PCR 5 U6 ND 29.87 RT PCR 5 U8 ND 26.22
RT PCR 15 V5 ND ND ND
29.36 29.30 0.09
RT PCR 15 V7 ND ND ND
26.30 26.15 0.14
RT PCR 15 V5 ND
29.19
RT PCR 15 V7 ND
26.04 RT PCR 15 V5 ND
29.34
RT PCR 15 V7 ND
26.10 RT PCR 15 V6 ND ND ND
29.36 29.60 0.29
RT PCR 15 V8 ND ND ND
25.99 25.96 0.03
RT PCR 15 V6 ND
29.92
RT PCR 15 V8 ND
25.93 RT PCR 15 V6 ND 29.51 RT PCR 15 V8 ND 25.95
LC 3 W5 ND ND ND
29.42 29.57 0.36
LC 3 W7 ND ND ND
25.92 25.90 0.03
LC 3 W5 ND
29.31
LC 3 W7 ND
25.87 LC 3 W5 ND
29.97
LC 3 W7 ND
25.92 LC 3 W6 ND ND ND
29.27 29.24 0.13
LC 3 W8 ND
26.03 26.21 0.17
LC 3 W6 ND
29.10
LC 3 W8 ND
26.37
Page 22 of 23
LC 3 W6 ND 29.35 LC 3 W8 35.31 26.23
RT PCR 6 X5 ND ND ND
29.28 29.32 0.08
RT PCR 6 X7 ND ND ND
26.29 26.27 0.18
RT PCR 6 X5 ND
29.42
RT PCR 6 X7 ND
26.09 RT PCR 6 X5 ND
29.28
RT PCR 6 X7 ND
26.44 RT PCR 6 X6 ND ND ND
29.20 29.22 0.13
RT PCR 6 X8 ND ND ND
26.27 26.15 0.10
RT PCR 6 X6 ND
29.10
RT PCR 6 X8 ND
26.11 RT PCR 6 X6 ND 29.35 RT PCR 6 X8 ND 26.09
RT PCR 2 Y5 ND ND ND
29.28 29.33 0.16
RT PCR 2 Y7 ND ND ND
26.04 25.98 0.08
RT PCR 2 Y5 ND
29.52
RT PCR 2 Y7 ND
25.89 RT PCR 2 Y5 ND
29.20
RT PCR 2 Y7 ND
26.01 RT PCR 2 Y6 ND ND ND
29.23 29.71 0.43
RT PCR 2 Y8 ND ND ND
26.32 26.18 0.21
RT PCR 2 Y6 ND
30.05
RT PCR 2 Y8 ND
25.93 RT PCR 2 Y6 ND 29.85 RT PCR 2 Y8 ND 26.29
RT PCR 16 Z5 35.27 35.28 0.22
29.37 29.28 0.09
RT PCR 16 Z7 ND
26.01 25.97 0.18
RT PCR 16 Z5 35.06
29.28
RT PCR 16 Z7 36.32
25.77 RT PCR 16 Z5 35.50
29.19
RT PCR 16 Z7 35.59
26.12 RT PCR 16 Z6 35.60 35.85 0.68
29.42 29.36 0.08
RT PCR 16 Z8 ND
25.94 25.91 0.05
RT PCR 16 Z6 36.61
29.38
RT PCR 16 Z8 ND
25.85 RT PCR 16 Z6 35.32 29.26 RT PCR 16 Z8 38.44 25.92
PTA DNA 2ng 22.27 22.20 0.18
28.79 28.71 0.16
PTA DNDA undiluted 14.56 14.65 0.08
26.13 26.00 0.13
PTA DNA 2ng 21.99
28.53
PTA DNDA undiluted 14.71
25.98 PTA DNA 2ng 22.33
28.81
PTA DNDA undiluted 14.69
25.88
PTA DNA 2ng 21.81 21.81 0.16
29.55 29.60 0.07
PTA DNDA undiluted 13.92 13.88 0.18
26.03 25.99 0.13
PTA DNA 2ng 21.65
29.57
PTA DNDA undiluted 13.68
25.85 PTA DNA 2ng 21.97 29.68 PTA DNDA undiluted 14.05 26.10
* ND, not detected or amplification below limits of detection.