Embed Size (px)
Citation preview

Comparison of Agricultural Water Use Estimates Available for the CFWI
Region
For the HAT

Current USGS ECFT Model MethodSJRWMD Annual Water Use Survey
SummariesUSGS Water Use Surveys for 1995,
2000, 2005SJRWMD - CFCA Historic Agricultural
Estimation Project developed for USGS ANN
Available Data for Estimated Agricultural Water Use

AFSIRS based for SJR and SF. (SWF Not estimated and uses metered data)
Incorporates Land Use Flux Code information for agriculture for SJR and SF to identify irrigated parcels for 1995, 2000, and 2005. SJR locations were verified in 2005 for crop type and irrigation
method Uses daily RADAR Rainfall and GOES ET data that was substituted
for the long term climate data in the AFSIRS model Monthly AFSIRS quantities were adjusted with Bench Mark Farms
application rates for several crop types to reflect metered data Tables were developed to adjust AFSIRS rate to BMF rates for
Ridge Citrus, Flatwoods Citrus, Leather leaf Fern, Nursery, Potatoes, Ferns, and Sod.
Well location were created for each model cell or cells that fell into the polygons identified in land use. Actual well locations were used for SWF only.
Daily irrigation quantities were created to be incorporated into the Green-AMPT for recharge calculations.
Current USGS ECFT Model Agricultural Estimates

Based on the Modifiled Blaney-Criddle model Uses long term climatic data available with the
MBC model Generalized county wide acreage estimates
provided by the Agricultural Extension agency Provides no monthly temporal data No spatial reference is provided other than
county level totals by crop
SJRWMD Annual Water Use Surveys

Published 5 year intervals County Totals Generally taken from WMDs Appears to have discrepancies with WMD
reported data Annual values provide no monthly temporal
data No spatial reference is provided other than
county level totals by crop
USGS Water Use Surveys
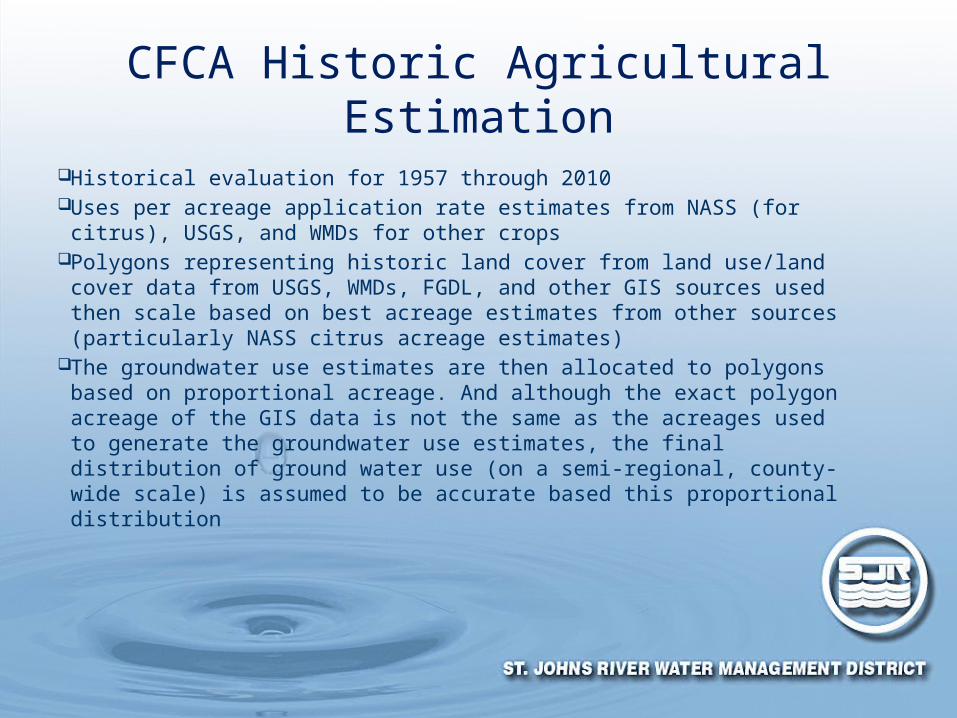
Historical evaluation for 1957 through 2010 Uses per acreage application rate estimates from NASS (for
citrus), USGS, and WMDs for other crops Polygons representing historic land cover from land use/land
cover data from USGS, WMDs, FGDL, and other GIS sources used then scale based on best acreage estimates from other sources (particularly NASS citrus acreage estimates)
The groundwater use estimates are then allocated to polygons based on proportional acreage. And although the exact polygon acreage of the GIS data is not the same as the acreages used to generate the groundwater use estimates, the final distribution of ground water use (on a semi-regional, county-wide scale) is assumed to be accurate based this proportional distribution
CFCA Historic Agricultural Estimation

Orange County Agricultural Pumping Estimates (MGD)
1995 1996 1997 1998 1999 2000 2001 2002 2003 2004 2005 20060.00
10.00
20.00
30.00
40.00
50.00
60.00
ECFT Model SJR Estimate USGS Estimate CFCA Historical
Orange County Agricultural Irrigation (MGD)

Orange County Agricultural Acres in SJRWMD for 1995, 2000, 2005, &EOP
Blueb
errie
s
CABBAGE
CITRUS
CORN,FIE
LD
FERNS
Gener
ic C
rop
Lives
tock
NURSERY,
CNTR
NURSERY,
FLD
PAST
URE
SMALL
VEG
ETS
SOD
Turf,
Lnd
scp
0
2000
4000
6000
8000
10000
12000
Orange
ACRES_95ACRES_00ACRES_05ACRES_EOP

Orange County Agricultural Irrigation Rates (In/Yr) Used in ECFT Model
Year 95 Total 96 Total 97 Total 98 Total 99 Total 00 Total 01 Total 02 Total 03 Total 04 Total
ORANGE_CABBAGE 21 22 19 28 21 - - - - -
ORANGE_CITRUS 14 14 12 21 15 31 16 12 9 11
ORANGE_CORN,FIELD 12 14 11 9 10 12 8 6 11 7
ORANGE_FERNS 37 43 38 46 38 50 36 33 33 38
ORANGE_NURSERY,CNTR 47 52 48 55 49 53 39 35 35 39
ORANGE_NURSERY,FLD 32 36 32 40 34 43 32 29 28 32
ORANGE_PASTURE 14 16 15 26 15 37 20 19 14 19
ORANGE_SMALL VEGETS 18 15 15 28 15 29 17 20 11 17
ORANGE_SOD 28 29 26 37 26 44 26 24 22 25
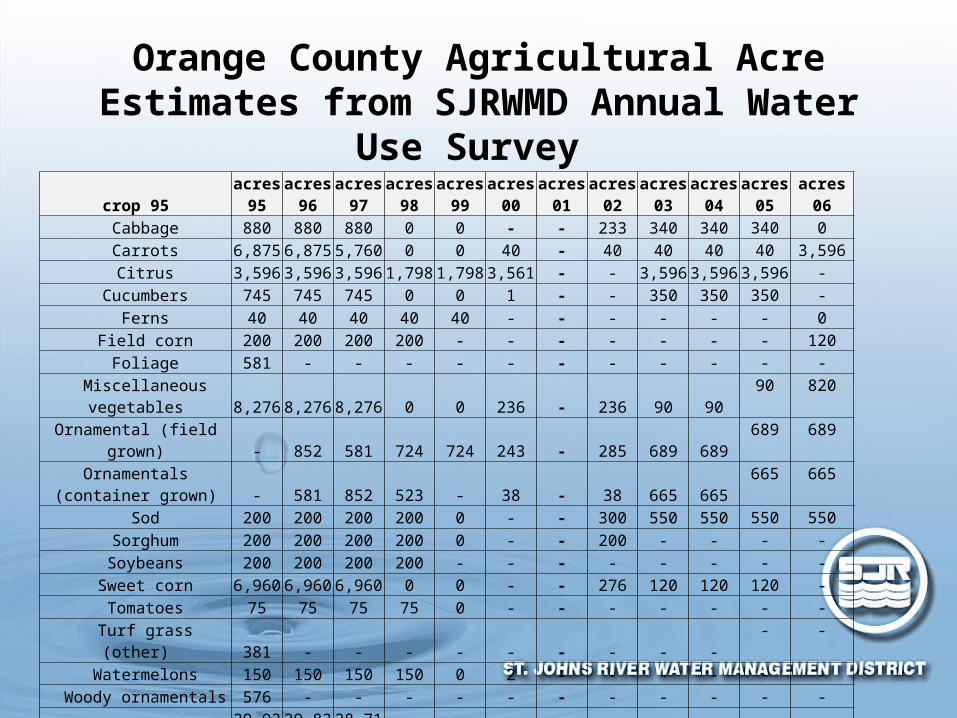
Orange County Agricultural Acre Estimates from SJRWMD Annual Water Use Survey
crop 95acres
95acres
96acres
97acres
98acres
99acres
00acres
01acres
02acres
03acres
04acres
05 acres 06 Cabbage 880 880 880 0 0 - - 233 340 340 340 0
Carrots 6,875 6,875 5,760 0 0 40 - 40 40 40 40 3,596
Citrus 3,596 3,596 3,596 1,798 1,798 3,561 - - 3,596 3,596 3,596 -
Cucumbers 745 745 745 0 0 1 - - 350 350 350 -
Ferns 40 40 40 40 40 - - - - - - 0
Field corn 200 200 200 200 - - - - - - - 120
Foliage 581 - - - - - - - - - - -
Miscellaneous vegetables 8,276 8,276 8,276 0 0 236 - 236 90 90 90 820
Ornamental (field grown) - 852 581 724 724 243 - 285 689 689 689 689Ornamentals (container
grown) - 581 852 523 - 38 - 38 665 665665 665
Sod 200 200 200 200 0 - - 300 550 550 550 550
Sorghum 200 200 200 200 0 - - 200 - - - -
Soybeans 200 200 200 200 - - - - - - - - Sweet corn 6,960 6,960 6,960 0 0 - - 276 120 120 120 - Tomatoes 75 75 75 75 0 - - - - - - -
Turf grass (other) 381 - - - - - - - - - - -
Watermelons 150 150 150 150 0 2 - - - - - -
Woody ornamentals 576 - - - - - - - - - - -
Total 29,935 29,830 28,715 4,110 2,562 4,121 5,204 1,608 6,440 6,440 6,440 6,440

Orange County Agricultural Irrigation Rate Estimates (In/Yr) from SJRWMD Annual Water Use Survey
crop rate 95 rate 96 rate 97 rate 99 rate 99 rate 00 rate 01 rate 02 rate 03 rate 04 rate 05 rate 06 Cabbage 9 10 8 - - - - 7 10 11 10 - Carrots 16 18 13 - - 42 - 21 20 21 20 38 Citrus 19 25 20 66 32 56 - - 6 8 26 -
Cucumbers 9 13 11 - - 32 - - 10 14 13 - Ferns 47 50 30 33 37 - - - - - - -
Field corn 7 11 9 14 - - - - - - - 26 Foliage 48 - - - - - - - - - - -
Miscellaneous vegetables 13 18 15 - - 34 - 22 16 22 15 19Ornamental (field grown) - 40 31 53 31 70 - 34 38 39 39 54Ornamentals (container
grown) - 40 66 32 - 50 - 19 19 23 23 34 Sod 9 14 11 18 - - - 19 53 55 55 76
Sorghum 4 5 1 7 - - - - - - - - Soybeans 4 5 3 9 - - - - - - - -
Sweet corn 17 20 12 - - - - 18 16 26 16 - Tomatoes 13 16 14 18 - - - - - - - -
Turf grass (other) 24 - - - - - - - - - - - Watermelons 4 7 4 10 - 63 - - - - - -
Woody ornamentals 48 - - - - - - - - - - -

Lake County Agricultural Pumping Estimates (MGD)
1995 1996 1997 1998 1999 2000 2001 2002 2003 2004 2005 20060
10
20
30
40
50
60
70
80
90
ECFT Model SJR Estimate USGS Estimate CFCA Historical
Lake County Agricultural pumping estimates (MGD)

Lake County Agricultural Acres in SJRWMD for 1995, 2000 , 2005, &EOP
BEANS,
GRN.
BLUEB
ERRY
CITRUS
CORN,SW
EET
FERNS
Gener
ic C
rop
Lives
tock
GRAPES
MELONS
NURSERY,
CNTR
NURSERY,
FLD
PAST
URE
PEACHES
SMALL
VEG
ETS
SOD
SQUASH
TURF,L
NDSCP
0
5000
10000
15000
20000
25000
30000
Lake
ACRES_95ACRES_00ACRES_05ACRES_EOP

Lake County Agricultural Irrigation Rates Used in ECFT Model
Year 95 Total 96 Total 97 Total 98 Total 99 Total 00 Total 01 Total 02 Total 03 Total 04 Total
LAKE_BEANS,GRN. 28 33 32 36 33 39 33 29 26 26
LAKE_BLUEBERRY 9 10 8 19 8 17 15 11 10 12
LAKE_CITRUS 14 16 16 24 16 29 17 14 11 13
LAKE_CORN,SWEET 15 16 14 28 18 31 20 18 14 16
LAKE_FERNS 37 44 38 45 41 50 38 38 36 38
LAKE_GRAPES 0 1 3 0 1 1 1 0 1 0
LAKE_GREENS,HERBS - - - - - 22 18 16 14 17
LAKE_MELONS - - - - - 23 20 15 14 16
LAKE_NURSERY,CNTR 65 72 69 73 69 57 44 43 43 46
LAKE_NURSERY,FLD 32 37 35 40 36 45 34 33 30 33
LAKE_PASTURE 7 13 9 20 13 30 13 12 7 8
LAKE_PEACHES 6 8 6 13 8 22 9 9 7 7
LAKE_PECANS 4 5 5 5 8 9 6 6 3 5
LAKE_SMALL VEGETS 13 11 13 23 12 - - - - -
LAKE_SOD 30 33 31 42 31 - - - - -
LAKE_SQUASH 18 19 18 28 20 - - - - -
LAKE_TURF,LNDSCP 34 42 37 45 40 - - - - -

Lake County Agricultural Acre Estimates from SJRWMD Annual Water Use Survey
cropacres
95acres
96acres
97acres
98acres
99acres
00acres
01acres
02 mgd 02acres
04acres
05acres
06 Blueberries 61 61 61 46 46 106 - 106 0.06 106 106 106
Cabbage 150 150 150 0 0 - - - - - - - Carrots 500 500 500 0 0 - - - - - - - Citrus 16,842 16,842 16,842 3,158 3,158 16,281 - - - 16,281 16,281 16,281
Cucumbers 370 370 370 0 0 - - - - - - - Ferns 550 550 550 550 550 941 - - - 941 941 941
Field corn 500 500 500 300 300 342 - 342 0.40 - 455 - Foliage 100 - - - - - - - - - - -
Fruit miscellaneous - - 25 15 15 29 - 29 0.05 29 29 - Grapes 54 54 54 0 0 43 - 43 0.03 43 43 43
Improved pasture 1,886 1,886 1,886 1,886 1,886 305 - 305 0.21 305 305 305 Miscellaneous fruit 25 25 - - - 268 - - - - - -
Miscellaneous vegetables 850 850 850 0 0 134 - 134 0.20 134 134 134Ornamentals (container
grown) - 950 100 450 0 1,768 - 1,768 3.84 1,7681,768 1,768
Ornamentals (field grown) - 100 950 0 450 281 - 281 0.30 281 281 967 Peaches 7 7 7 - 0 - - - - - - 0 Pecans 80 80 80 0 0 48 - 48 0.05 48 48 48
Potatoes 50 - - 0 - 38 - - - - - - Sod 250 250 250 50 50 143 - 250 0.31 1,000 1,000 1,000
Sorghum 150 150 150 150 150 - - - - - - - Strawberries 5 5 5 - 0 - - - - - - - Sweet corn 750 750 750 0 0 - - 38 0.05 38 38 38
Turf grass (other) 120 - - - - - - - - - - - Watermelons 320 320 320 320 320 - - 143 0.08 202 202 -
Woody ornamentals 950 - - - - - - - - - - -Total 24,570 24,400 24,400 6,925 6,925 20,727 23,529 3,487 5.56 21,176 21,631 21,631

Lake County Agricultural Irrigation Rate Estimates (In/Yr) from SJRWMD Annual Water Use Survey
Crop rate 95 rate 96 rate 97 rate 98 rate 99 rate 00 rate 01 rate 02 rate 03 rate 04 rate 05 rate 06 Blueberries 7 9 9 23 9 26 - 7 8 13 6 13
Cabbage 7 13 7 - - - - - - - - - Carrots 15 13 17 - - - - - - - - - Citrus 24 26 24 205 103 55 - - 8 7 6 13
Cucumbers 7 12 11 - - - - - - - - - Ferns 48 50 31 33 38 51 - - 31 42 35 46
Field corn 9 10 13 32 18 28 - 16 - - 9 - Foliage - - - - - - - - - - - -
Fruit miscellaneous - - 27 70 36 61 - 22 23 35 23 - Grapes 15 15 12 - - 36 - 10 13 20 7 19
Improved pasture 6 7 7 18 6 19 - 9 21 32 24 34 Miscellaneous fruit 27 38 - - - 9 - - - - - -
Miscellaneous vegetables 12 16 16 - - 37 - 20 15 24 15 21Ornamentals (container
grown) - 44 39 101 - 67 - 29 30 40 34 45Ornamentals (field grown) - 44 69 - 62 48 - 14 15 26 14 16
Peaches 19 0 0 - - - - - - - - - Pecans 22 22 20 - - 48 - 14 15 27 14 25
Potatoes - - - - - 41 - - - - - - Sod 11 17 15 139 56 15 - 16 39 55 45 60
Sorghum 4 7 3 11 4 - - - - - - - Strawberries 0 0 0 - - - - - - - - - Sweet corn 16 19 13 - - - - 17 11 30 11 21
Turf grass (other) 27 - - - - - - - - - - - Watermelons 4 5 6 12 - - - 7 6 8 5 -
Woody ornamentals 48 - - - - - - - - - - -Total - - - - - - 17 - - - - -

Seminole County Agricultural Pumping Estimates (MGD)
1995 1996 1997 1998 1999 2000 2001 2002 2003 2004 2005 20060.00
5.00
10.00
15.00
20.00
25.00
30.00
ECFT Model SJR Estimate USGS Estimate CFCA Historical
Seminole County Agricultural pumping estimates (MGD)
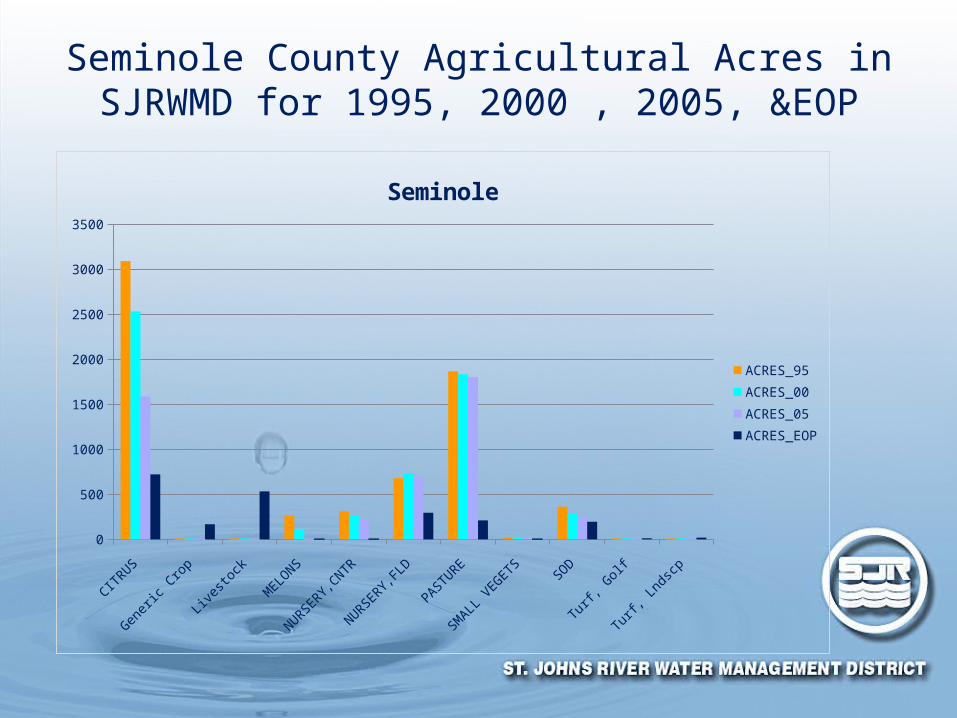
Seminole County Agricultural Acres in SJRWMD for 1995, 2000 , 2005, &EOP
CITRUS
Gener
ic C
rop
Lives
tock
MELONS
NURSERY,
CNTR
NURSERY,
FLD
PAST
URE
SMALL
VEG
ETS
SOD
Turf,
Gol
f
Turf,
Lnd
scp
0
500
1000
1500
2000
2500
3000
3500
Seminole
ACRES_95ACRES_00ACRES_05ACRES_EOP
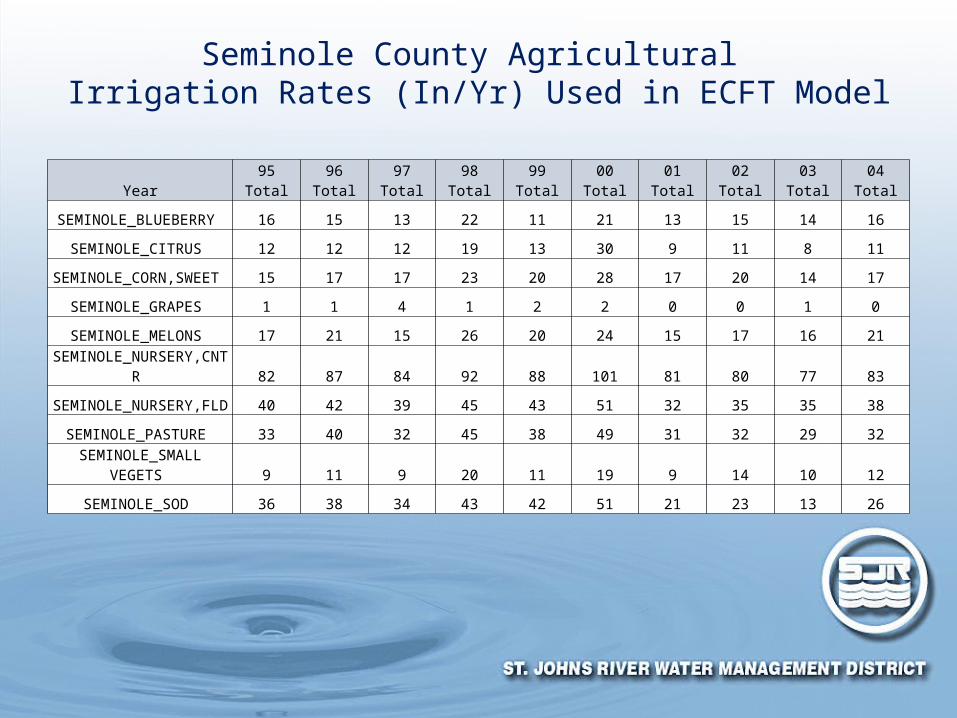
Seminole County Agricultural Irrigation Rates (In/Yr) Used in ECFT Model
Year 95 Total 96 Total 97 Total 98 Total 99 Total 00 Total 01 Total 02 Total 03 Total 04 Total
SEMINOLE_BLUEBERRY 16 15 13 22 11 21 13 15 14 16
SEMINOLE_CITRUS 12 12 12 19 13 30 9 11 8 11
SEMINOLE_CORN,SWEET 15 17 17 23 20 28 17 20 14 17
SEMINOLE_GRAPES 1 1 4 1 2 2 0 0 1 0
SEMINOLE_MELONS 17 21 15 26 20 24 15 17 16 21
SEMINOLE_NURSERY,CNTR 82 87 84 92 88 101 81 80 77 83
SEMINOLE_NURSERY,FLD 40 42 39 45 43 51 32 35 35 38
SEMINOLE_PASTURE 33 40 32 45 38 49 31 32 29 32
SEMINOLE_SMALL VEGETS 9 11 9 20 11 19 9 14 10 12
SEMINOLE_SOD 36 38 34 43 42 51 21 23 13 26

Seminole County Agricultural Acre Estimates from SJRWMD Annual Water Use Survey
crop acres 95 acres 96 acres 97 acres 98 acres 99 acres 00 acres 01 acres 02 acres 03 acres 04 acres 05 acres 06 Blueberries 5 5 5 - 0 8 - - - - - -
Cabbage 275 175 125 50 25 - - - - - - - Citrus 1,816 1,816 1,816 1,400 1,400 1,378 - 1,378 1,280 1,280 1,280 1,280
Cucumbers 130 30 30 0 - - - - - - - -
Ferns 20 20 20 20 20 4 - - - - - -
Field corn 40 40 40 0 - - - - - - - -
Field miscellaneous - - 10 10 10 - - - - - - -
Foliage 200 - - - - - - - - - - -
Grapes - - - - - 4 - - 3 3 3 -
Improved pasture 490 490 490 490 490 439 - 439 439 439 1,000 1,000
Miscellaneous grains 10 10 - - - 20 - - 5 5 5 - Miscellaneous
vegetables 425 425 100 20 20 7 - 15 150 150120 120
Ornamentals (container grown) - 400 200 320 25 292 - 292 200 200
250 250
Ornamentals (field grown) - 200 400 25 320 275 - 275 450 450
1,000 68
Peppers - - 25 0 - - - - - - - -
Potatoes 450 - 25 0 - - - - - - - -
Sod 320 320 320 320 320 320 - 320 300 300 300 300
Strawberries 20 20 20 0 0 - - - 3 3 10 -
Sweet corn 10 10 10 0 0 - - - - - - -Tomatoes - - 35 0 - - - - - - - -
Turf grass (other) 136 - - - - - - - - - - - Watermelons 50 50 50 0 0 - - - - - - -
Woody ornamentals 400 - - - - - - - - - - -Total 4,797 4,011 3,721 2655 2,630 2,747 2,719 2,719 2,830 2,830 3,968 3,018

Seminole County Agricultural Irrigation Rate Estimates (In/Yr) from SJRWMD Annual Water Use Survey
Crop rate 95 rate 96 rate 97 rate 98 rate 99 rate 00 rate 01 rate 02 rate 03 rate 04 rate 05 rate 06 Blueberries 0 0 0 - - 39 - - - - - -
Cabbage 6 8 9 27 5 - - - - - - - Citrus 22 25 24 41 25 56 - 27 21 26 23 36
Cucumbers 7 9 13 - - - - - - - - - Ferns 47 47 34 33 40 52 - - - - - -
Field corn 13 13 17 - - - - - - - - -Field miscellaneous - - 0 6 0 - - - - - - -
Foliage - - - - - - - - - - - -Grapes - - - - - 36 - - 12 18 12 -
Improved pasture 8 7 9 17 6 21 - 11 27 28 27 40 Miscellaneous grains 0 13 - - - 61 - - 17 22 19 -
Miscellaneous vegetables 13 14 17 123 67 37 - 21 18 21 15 27Ornamentals (container
grown) - 41 38 56 188 69 - 36 36 37 35 50Ornamentals (field grown) - 41 72 303 35 68 - 32 27 34 30 30
Peppers - - 16 - - - - - - - - - Potatoes 18 - 16 - - - - - - - - -
Sod 9 10 13 19 10 68 - 13 52 55 Sod 74 Strawberries 7 7 13 - - - - - 10 13 - - Sweet corn 13 13 13 - - - - - - - - -
Tomatoes - - 19 - - - - - - - - - Turf grass (other) 25 - - - - - - - - - - -
Watermelons 5 8 8 - - - - - - - - - Woody ornamentals 48 - - - - - - - - - - -
Total - - - - - - 26 - - - - -

Osceola County Agricultural Pumping Estimates (MGD)
1995 1996 1997 1998 1999 2000 2001 2002 2003 2004 2005 20060.00
20.00
40.00
60.00
80.00
100.00
120.00
ECFT Model SJR Estimate SJR Pasture USGS Estimate CFCA Historical
Osceola County Agricultural pumping estimates (MGD)

Osceola County Agricultural Acres in SJRWMD for 1995, 2000, 2005, &EOP
CITRUS Field Corn PASTURE SOD 0
500
1000
1500
2000
2500
3000
3500
4000
Osceola
ACRES_95ACRES_00ACRES_05ACRES_EOP

Brevard County Agricultural Pumping Estimates (MGD)
1995 1996 1997 1998 1999 2000 2001 2002 2003 2004 2005 20060
20
40
60
80
100
120
140
160
180
200
ECFT Model SJR Estimate USGS Estimate
Brevard County Agricultural pumping estimates (MGD)

Brevard County Agricultural Acres in SJRWMD for 1995, 2000, 2005, &EOP
Blueb
errie
s
CITRUS
Gener
ic C
rop
CORN,FIE
LD
NURSERY,
CNTR
NURSERY,
FLD
PAST
URE
SOD
SORGHUM
Pota
toes
Turf,
Lnd
scp
0
5000
10000
15000
20000
25000
30000
35000
40000
45000
Brevard
ACRES_95ACRES_00ACRES_05ACRES_EOP
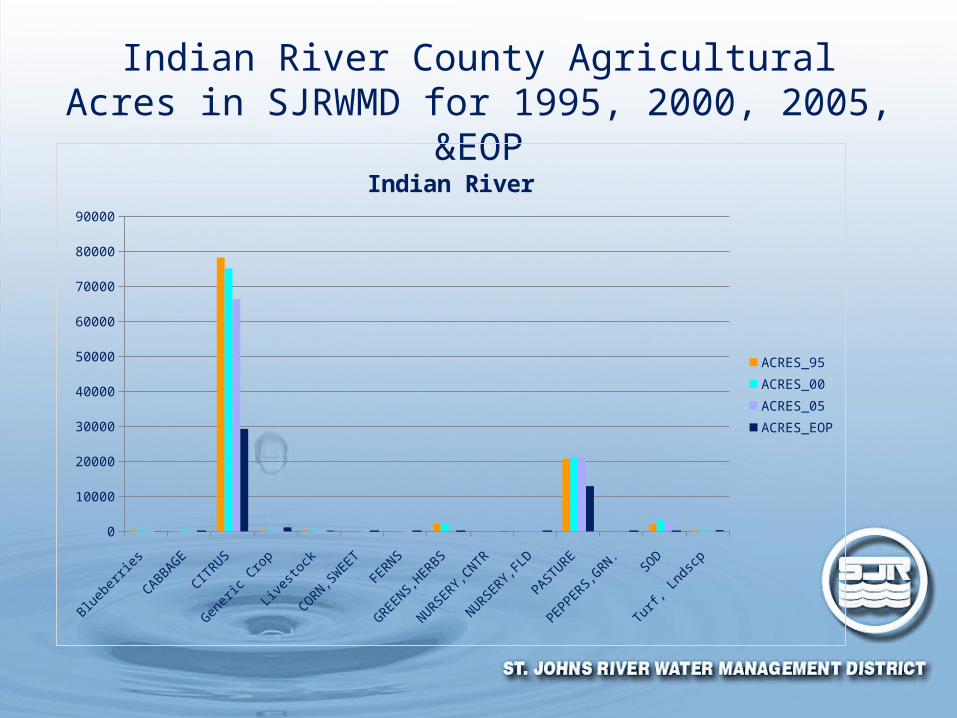
Indian River County Agricultural Acres in SJRWMD for 1995, 2000, 2005, &EOP
Blueb
errie
s
CABBAGE
CITRUS
Gener
ic C
rop
Lives
tock
CORN,SW
EET
FERNS
GREENS,
HERBS
NURSERY,
CNTR
NURSERY,
FLD
PAST
URE
PEPP
ERS,
GRN.
SOD
Turf,
Lnd
scp
0
10000
20000
30000
40000
50000
60000
70000
80000
90000
Indian River
ACRES_95ACRES_00ACRES_05ACRES_EOP

Conclusion from Comparison of Water Use Estimates
Four Estimates are available ECFT AFSIRS Method Falls into the Range
of Estimates ECFT AFSIRS is only Method to
Incorporate Same Data Used in the ECFT Calibrated Model, All Other Methods Rely on Average Climate Data
ECFT AFSIRS Method Appears to Provide Reasonable Annual average application