Embed Size (px)
Citation preview
Ž .Spectrochimica Acta Part B 55 2000 1465]1479
Comparison of calculated and measured opticalemission intensities in a direct current argon]copper
glow discharge
Annemie Bogaertsa,U, Zoltan Donkob, Kinga Kutasib, Gregor Banob,Nuno Pinhaoc, Mario Pinheirod
a ( )Department of Chemistry, Uni ersity of Antwerp UIA , Uni ersiteitsplein 1, B-2610 Wilrijk-Antwerp, BelgiumbResearch Institute for Solid State Physics and Optics, P.O. Box 49, H-1525 Budapest, Hungary
cPhysics Department, Instituto Tecnologico e Nuclear, Estrada Nacional 10, 2685 Saca¨em, Portugal´dPhysics Department, Instituto Superior Tecnico, A¨. Ro¨isco Pais, 1049-001 Lisboa, Portugal´
Received 24 March 2000; accepted 16 June 2000
Abstract
Ž q.Based on a collisional]radiative model for argon atoms and copper atoms and Cu ions, which was developed asa part of a comprehensive simulation network, optical emission intensities have been calculated for argon and copperlines in a direct current argon glow discharge with copper cathode. Comparison with experimental data has beenmade, both with respect to the optical emission spectra and to some selected emission lines as a function of axialposition. From this study, information can be obtained about the importance of various plasma processes, likeelectron, fast ion and fast atom impact excitation, and reabsorption of resonant radiation. Q 2000 Elsevier ScienceB.V. All rights reserved.
Keywords: Collisional]radiative model; Argon; Copper; Optical emission
1. Introduction
Glow discharges are used in a growing numberof application fields, e.g. in the semiconductor
U Corresponding author. Tel.: q32-3820-2364; fax: q32-3820-2376.
Ž .E-mail address: [email protected] A. Bogaerts .
industry for etching and deposition of layers, inmaterials technology for the deposition of hardcoatings, as lasers, light sources, plasma displaypanels, etc. Moreover, they also find applicationin analytical chemistry, for the spectrochemical
Ž . w xanalysis of mainly solid materials 1,2 . For thelatter application, the material to be analyzed isused as the cathode of the glow discharge, whichis sputter-bombarded by plasma species. The
0584-8547r00r$ - see front matter Q 2000 Elsevier Science B.V. All rights reserved.Ž .PII: S 0 5 8 4 - 8 5 4 7 0 0 0 0 2 5 3 - 6
( )A. Bogaerts et al. r Spectrochimica Acta Part B: Atomic Spectroscopy 55 2000 1465]14791466
Ž .sputtered analytically important cathode-atomsarrive in the plasma, where they can be ionized orexcited. The resulting ions can be measured witha mass spectrometer whereas the photons createdby excitation and subsequent radiative decay, canbe detected with an optical emission spectrome-ter.
We try to obtain a better insight into the opti-cal emission spectral intensities, which is not onlyrelevant to analytical glow discharge spectrome-try, but also to optical spectrometric plasma diag-nostic techniques. Therefore, a model has re-cently been developed to calculate the level popu-lations of various excited levels of argon and
w xcopper species 3,4 , and from this, the opticalw xemission intensities can be derived 5,6 .
In the literature, a number of papers havereported experimental optical emission intensitiesw x7]13 and the occurrence of various processes,like cascading, stepwise excitation, etc., have been
w xexplained by some simple models 14]16 . Espe-cially the spatial distribution of the emission linesis of great interest, to achieve better insight in the
w xrole of various excitation processes 7]10 . Thelines which are most often studied, are the ArI750.3 nm and the ArI 811.5 nm lines, becausethey are characterized by high intensities andthey reflect some typical excitation processesw x7]12,14 .
In the present paper, we want to make a de-tailed comparison, at exactly the same dischargeconditions and cell geometry, between calculatedand experimental optical emission intensities.Some of the experimental results have already
w xbeen published in 10 without detailed self-con-sistent models. The comparison will be performedfor a range of operating conditions in a direct
Ž .current d.c. argon glow discharge with a coppercathode. Special attention will be paid to thespatial behavior of some selected emission lines,in order to obtain information about various exci-tation processes in the plasma.
2. Short description of the model
In previous work, we have developed a compre-hensive modeling network, consisting of Monte
Carlo, fluid and collisional]radiative models forvarious plasma species: electrons, argon atoms,
Ž q 2q q.argon Ar , Ar and Ar ions, argon atoms in2various excited levels, sputtered copper atomsand the corresponding Cuq ions, both in theground state and also in various excited levels.Typical results of the modeling network, includeamong others the electric field and potential dis-tribution, densities, fluxes and energies of theelectrons, ions and neutrals, and information
w xabout collision processes in the plasma 17 . Moredetailed information can be found in work by
w xBogaerts 17 . Only the models relevant to thepresent work, i.e. the collisional]radiative mod-els, will be described in some more detail.
A collisional]radiative model is used to calcu-late the level populations of various excited lev-
Žels. It consists of a set of balance equations one.for each level with different production and loss
terms. The production and loss processes are allŽof collisional or radiative nature e.g. electron.impact excitation or radiative decay , hence the
name of this type of models.The collisional]radiative model we developed
for the argon atoms takes into account 65 argonw x Žlevels 3 . Some of these levels like the four 4s.levels are considered separately, but most levels
are a group of individual levels with similar exci-tation energy and quantum numbers. The collisio-nal and radiative processes taken into account areradiative decay, electron, fast argon ion and fastand thermal argon atom impact ionization, excita-tion and de-excitation between all the levels, elec-tron-ion radiative recombination, electron-ionthree-body recombination where the third body is
Žan electron or an argon gas atom although itshould be mentioned that electron-ion recombi-nation is found to be more or less negligible atthe conditions under study, except at the cell
.walls , and Hornbeck]Molnar associative ioniza-Žtion for levels with excitation energy above 14.71
.eV . Some additional processes are incorporatedfor the 4s levels, i.e. Penning ionization of sput-tered atoms, two- and three-body collisions withargon ground state atoms, collisions between two4s atoms, and diffusion and subsequent de-excita-tion at the walls. More information about thismodel and about the relative importance of the
( )A. Bogaerts et al. r Spectrochimica Acta Part B: Atomic Spectroscopy 55 2000 1465]1479 1467
various processes can be found in work byw xBogaerts et al. 3 . We have, however, slightly
modified the collisional]radiative model of Bo-w xgaerts et al. 3 , by including a radiation escape
w xfactor dependent on radial position 18 , to ac-count for differences in radiation absorption atdifferent positions from the central axis.
A similar collisional]radiative model was con-structed for the copper atoms, together with a
w xmodel for the copper ions 4 . This model in-cludes a set of balanced equations for eight cop-per atomic levels, seven Cuq ionic levels, as wellas for the Cu2q ions. Some levels are individuallevels and others are groups of levels, dependingon their excitation energy and quantum numbers.The relevant processes are electron, argon andcopper atom impact excitation and de-excitationbetween the various levels, as well as radiativedecay between the levels, electron impact ioniza-tion and electron-ion three-body recombination.Moreover, Penning ionization with argon meta-stable atoms and asymmetric charge transfer withargon ions are taken into account as additionalionization processes. Further information is given
w xin work by Bogaerts et al. 4 .As mentioned before, these collisional]radia-
tive models are part of a comprehensive modelingw xnetwork 17 . The only input parameters for the
model network are discharge voltage, gas pres-sure and temperature, and the discharge geome-
Ž .try see below , as well as the cross-sections for allcollision processes. The output of the Monte Carloand fluid models, such as the electron energydistribution function, electric field, electron andargon ion densities and reaction rates, are used tosolve the collisional]radiative models.
Finally, the optical emission intensities for agiven transition are calculated by multiplying thelevel populations of the excited levels with theEinstein transition probabilities for radiativedecay. With our present model, the intensities of605 argon atomic lines and 103 copper atomicand ionic lines could be calculated.
3. Experimental setup
The experimental setup is the same as in Donko
w xet al. 10 . A direct current discharge was createdbetween two flat disk copper electrodes with adiameter of 3.14 cm, at a distance of 4.5 cm fromeach other. The electrodes were confined in ametal tube at floating potential, with an internaldiameter 0.07 cm larger than the electrode di-ameter. The spatial distribution of the light inten-sity in the discharge was scanned in the axialdirection through a slit machined into the floatingtube with 0.5 mm width. The background pressureof the vacuum system was ;10y6 mbar, and thepurity of the argon filling gas was 99.999%.
The light intensity distribution measurementswere controlled by a PC. The discharge tube wasmounted on a translator, equipped with a step-ping motor under computer control. The dis-charge light was imaged onto the entrance slit ofa 2-m monochromator with a 100-mm focal lengthquartz lens. A diaphragm of 5 mm diameter wasplaced in front of the lens to obtain a lateralspatial resolution of ;0.3 mm. For measure-ments in the ultraviolet and blue part of thespectrum, an EMI 6256S photomultiplier tubeŽ .PMT was used, while an EMI 9558B PMT wasapplied for the near-infrared part of the spec-trum. The signal of the PMT was sent to aHP54501A digitizing oscilloscope connected tothe PC, using an IEEE488 interface. Finally, thePC also controlled the wavelength positioning ofthe monochromator when recording the spectralscans.
4. Results and discussion
4.1. Electrical characteristics of the discharge
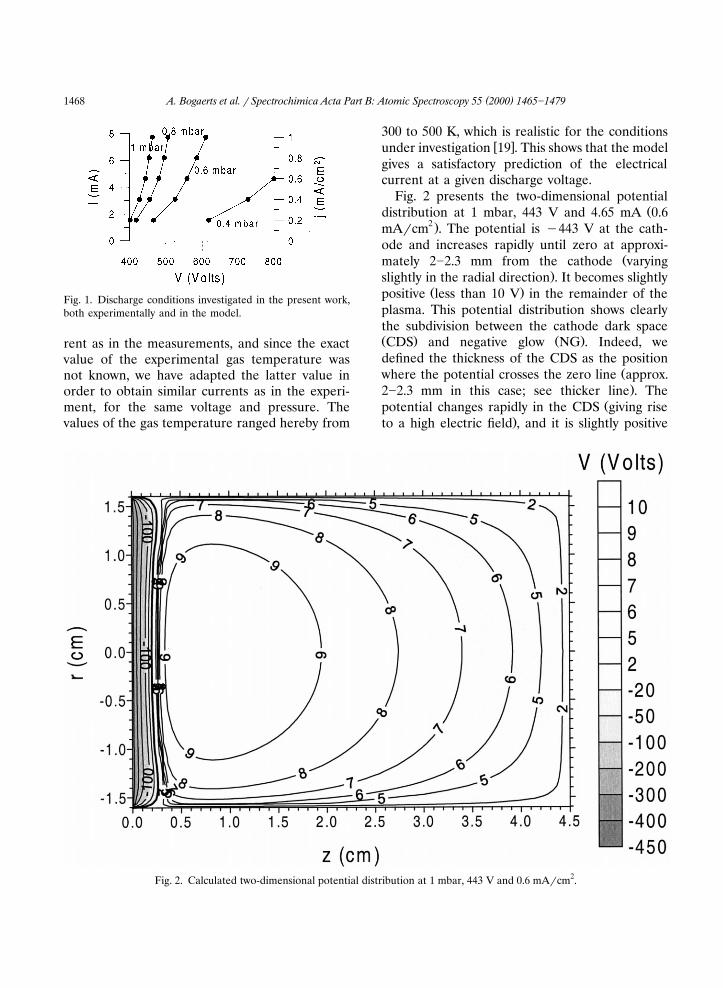
The discharge conditions investigated in thiswork, both experimentally and in the model, i.e.
Žthe currents and current densities left and right.axis, respectively as a function of voltage for
different pressures, are illustrated in Fig. 1. In themodel, the current is calculated self-consistentlyŽi.e. as the sum of the microscopic fluxes of the
.charged plasma species when the voltage, the gaspressure and temperature are given as input. Sincewe wanted to perform the calculations for exactlythe same conditions of voltage, pressure and cur-
( )A. Bogaerts et al. r Spectrochimica Acta Part B: Atomic Spectroscopy 55 2000 1465]14791468
Fig. 1. Discharge conditions investigated in the present work,both experimentally and in the model.
rent as in the measurements, and since the exactvalue of the experimental gas temperature wasnot known, we have adapted the latter value inorder to obtain similar currents as in the experi-ment, for the same voltage and pressure. Thevalues of the gas temperature ranged hereby from
300 to 500 K, which is realistic for the conditionsw xunder investigation 19 . This shows that the model
gives a satisfactory prediction of the electricalcurrent at a given discharge voltage.
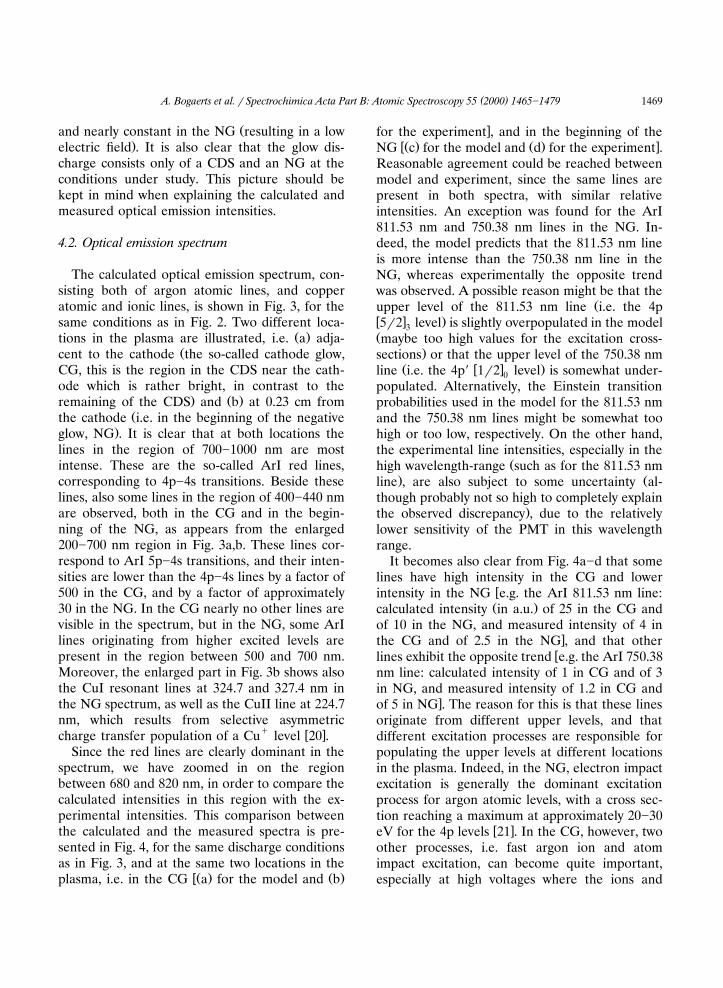
Fig. 2 presents the two-dimensional potentialŽdistribution at 1 mbar, 443 V and 4.65 mA 0.6
2 .mArcm . The potential is y443 V at the cath-ode and increases rapidly until zero at approxi-
Žmately 2]2.3 mm from the cathode varying.slightly in the radial direction . It becomes slightly
Ž .positive less than 10 V in the remainder of theplasma. This potential distribution shows clearlythe subdivision between the cathode dark spaceŽ . Ž .CDS and negative glow NG . Indeed, wedefined the thickness of the CDS as the position
Žwhere the potential crosses the zero line approx..2]2.3 mm in this case; see thicker line . The
Žpotential changes rapidly in the CDS giving rise.to a high electric field , and it is slightly positive
Fig. 2. Calculated two-dimensional potential distribution at 1 mbar, 443 V and 0.6 mArcm2.
( )A. Bogaerts et al. r Spectrochimica Acta Part B: Atomic Spectroscopy 55 2000 1465]1479 1469
Žand nearly constant in the NG resulting in a low.electric field . It is also clear that the glow dis-
charge consists only of a CDS and an NG at theconditions under study. This picture should bekept in mind when explaining the calculated andmeasured optical emission intensities.
4.2. Optical emission spectrum
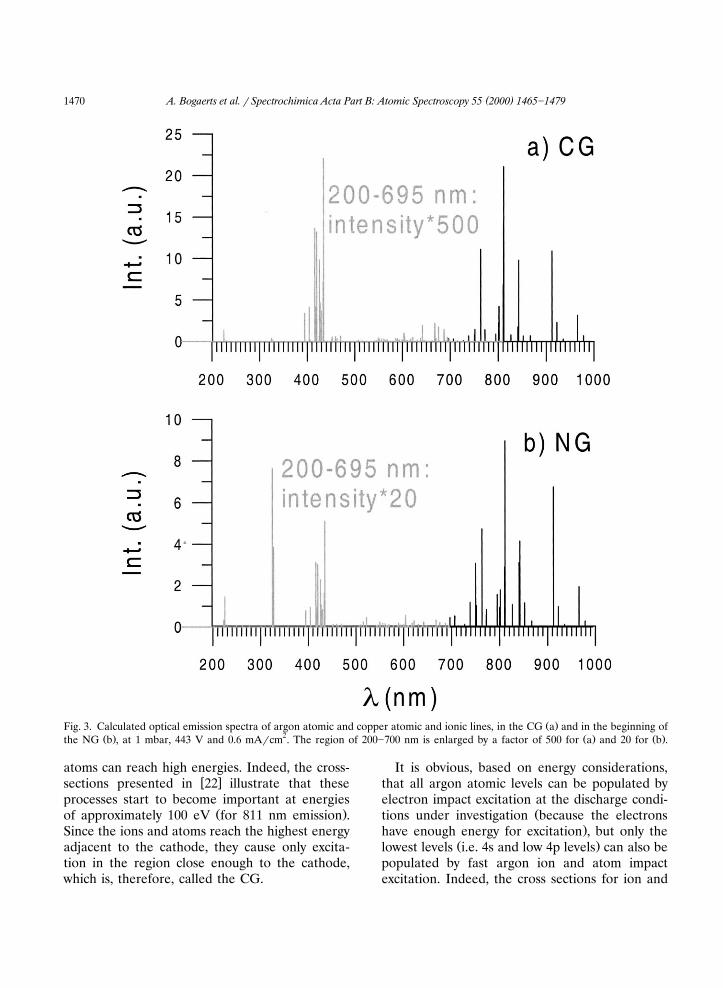
The calculated optical emission spectrum, con-sisting both of argon atomic lines, and copperatomic and ionic lines, is shown in Fig. 3, for thesame conditions as in Fig. 2. Two different loca-
Ž .tions in the plasma are illustrated, i.e. a adja-Žcent to the cathode the so-called cathode glow,
CG, this is the region in the CDS near the cath-ode which is rather bright, in contrast to the
. Ž .remaining of the CDS and b at 0.23 cm fromŽthe cathode i.e. in the beginning of the negative
.glow, NG . It is clear that at both locations thelines in the region of 700]1000 nm are mostintense. These are the so-called ArI red lines,corresponding to 4p]4s transitions. Beside theselines, also some lines in the region of 400]440 nmare observed, both in the CG and in the begin-ning of the NG, as appears from the enlarged200]700 nm region in Fig. 3a,b. These lines cor-respond to ArI 5p]4s transitions, and their inten-sities are lower than the 4p]4s lines by a factor of500 in the CG, and by a factor of approximately30 in the NG. In the CG nearly no other lines arevisible in the spectrum, but in the NG, some ArIlines originating from higher excited levels arepresent in the region between 500 and 700 nm.Moreover, the enlarged part in Fig. 3b shows alsothe CuI resonant lines at 324.7 and 327.4 nm inthe NG spectrum, as well as the CuII line at 224.7nm, which results from selective asymmetric
q w xcharge transfer population of a Cu level 20 .Since the red lines are clearly dominant in the
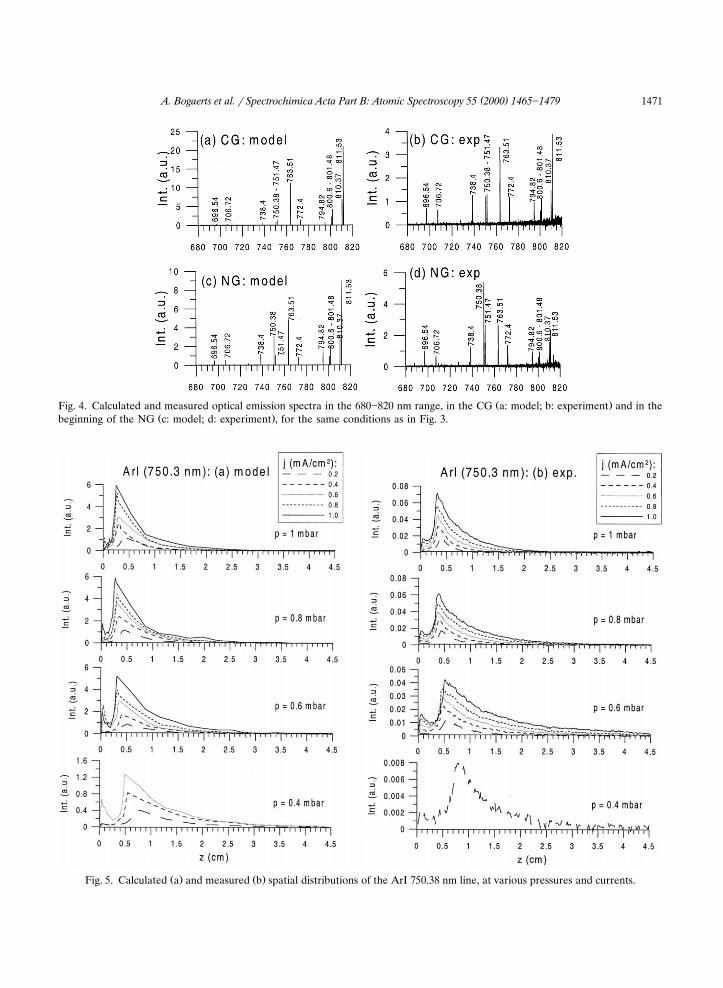
spectrum, we have zoomed in on the regionbetween 680 and 820 nm, in order to compare thecalculated intensities in this region with the ex-perimental intensities. This comparison betweenthe calculated and the measured spectra is pre-sented in Fig. 4, for the same discharge conditionsas in Fig. 3, and at the same two locations in the
wŽ . Ž .plasma, i.e. in the CG a for the model and b
xfor the experiment , and in the beginning of thewŽ . Ž . xNG c for the model and d for the experiment .
Reasonable agreement could be reached betweenmodel and experiment, since the same lines arepresent in both spectra, with similar relativeintensities. An exception was found for the ArI811.53 nm and 750.38 nm lines in the NG. In-deed, the model predicts that the 811.53 nm lineis more intense than the 750.38 nm line in theNG, whereas experimentally the opposite trendwas observed. A possible reason might be that the
Župper level of the 811.53 nm line i.e. the 4pw x .5r2 level is slightly overpopulated in the model3Žmaybe too high values for the excitation cross-
.sections or that the upper level of the 750.38 nmŽ w x .line i.e. the 4p9 1r2 level is somewhat under-0
populated. Alternatively, the Einstein transitionprobabilities used in the model for the 811.53 nmand the 750.38 nm lines might be somewhat toohigh or too low, respectively. On the other hand,the experimental line intensities, especially in the
Žhigh wavelength-range such as for the 811.53 nm. Žline , are also subject to some uncertainty al-
though probably not so high to completely explain.the observed discrepancy , due to the relatively
lower sensitivity of the PMT in this wavelengthrange.
It becomes also clear from Fig. 4a]d that somelines have high intensity in the CG and lower
wintensity in the NG e.g. the ArI 811.53 nm line:Ž .calculated intensity in a.u. of 25 in the CG and
of 10 in the NG, and measured intensity of 4 inxthe CG and of 2.5 in the NG , and that other
wlines exhibit the opposite trend e.g. the ArI 750.38nm line: calculated intensity of 1 in CG and of 3in NG, and measured intensity of 1.2 in CG and
xof 5 in NG . The reason for this is that these linesoriginate from different upper levels, and thatdifferent excitation processes are responsible forpopulating the upper levels at different locationsin the plasma. Indeed, in the NG, electron impactexcitation is generally the dominant excitationprocess for argon atomic levels, with a cross sec-tion reaching a maximum at approximately 20]30
w xeV for the 4p levels 21 . In the CG, however, twoother processes, i.e. fast argon ion and atomimpact excitation, can become quite important,especially at high voltages where the ions and
( )A. Bogaerts et al. r Spectrochimica Acta Part B: Atomic Spectroscopy 55 2000 1465]14791470
Ž .Fig. 3. Calculated optical emission spectra of argon atomic and copper atomic and ionic lines, in the CG a and in the beginning ofŽ . 2 Ž . Ž .the NG b , at 1 mbar, 443 V and 0.6 mArcm . The region of 200]700 nm is enlarged by a factor of 500 for a and 20 for b .
atoms can reach high energies. Indeed, the cross-w xsections presented in 22 illustrate that these
processes start to become important at energiesŽ .of approximately 100 eV for 811 nm emission .
Since the ions and atoms reach the highest energyadjacent to the cathode, they cause only excita-tion in the region close enough to the cathode,which is, therefore, called the CG.
It is obvious, based on energy considerations,that all argon atomic levels can be populated byelectron impact excitation at the discharge condi-
Žtions under investigation because the electrons.have enough energy for excitation , but only the
Ž .lowest levels i.e. 4s and low 4p levels can also bepopulated by fast argon ion and atom impactexcitation. Indeed, the cross sections for ion and
( )A. Bogaerts et al. r Spectrochimica Acta Part B: Atomic Spectroscopy 55 2000 1465]1479 1471
Ž .Fig. 4. Calculated and measured optical emission spectra in the 680]820 nm range, in the CG a: model; b: experiment and in theŽ .beginning of the NG c: model; d: experiment , for the same conditions as in Fig. 3.
Ž . Ž .Fig. 5. Calculated a and measured b spatial distributions of the ArI 750.38 nm line, at various pressures and currents.
( )A. Bogaerts et al. r Spectrochimica Acta Part B: Atomic Spectroscopy 55 2000 1465]14791472
atom impact excitation reach their maximum atmuch higher energies than for electron impact
Žexcitation see e.g. above for 811 nm emission,.but this applies to all energy levels . It is easy to
Žunderstand from extrapolation from the 811 nm.emission cross-section that the higher energy lev-
els require ion and atom impact excitation ener-gies, which are higher than the ion and atomenergies usually encountered for the dischargeconditions under study. Based on cross-section
w xdata in the literature 22 for two emission linesoriginating from two different 4p levels, we as-
w xsumed in our collisional]radiative model 3 thatthe cross-section for fast argon ion and atom
w x Žimpact excitation to the 4p 5r2 level i.e. a3lower 4p level at 13.12 eV, which emits radiation
.at 811.53 nm is higher than the correspondingw xcross-section for excitation to the 4p9 1r2 level0
Ž .at 13.48 eV, which emits the 750.38 nm line .Therefore, it is indeed expected that the first linewill be more intense in the CG than the secondone. In order to investigate the effect of theseexcitation processes, it is worth studying somespecific lines in more detail as a function of axialdistance from the cathode.
4.3. Spatial distributions of emission line intensities
4.3.1. The ArI 750.38 nm lineFig. 5 illustrates the line intensities of the ArI
Ž w x w x .750.38 nm line 4p9 1r2 ª4s9 1r2 as a func-0 1tion of axial position from the cathode at a rangeof different pressures and current densities, both
Ž .calculated in the model a and measured experi-Ž .mentally b . The currents and voltages corre-
sponding to the current densities at the variouspressures, can be deduced from Fig. 1. It appearsfrom Fig. 5 that the intensity distribution of the750.38 nm line is characterized by a dominantpeak in the beginning of the NG, attributed toelectron impact excitation. This is true for boththe calculated and the experimental intensities.
A minor peak can also be observed in the CG,due to ion and atom impact excitation. This smallpeak increases with current at constant pressureŽ .hence: increasing voltage , and it also increaseswith decreasing pressure at constant current
Ž .hence: again increasing voltage . Indeed, highervoltages mean higher ion and atom energies, andhence more ion and atom impact excitation in theCG. Moreover, lower pressures result in longermean free paths, which means also higher ion andatom energies, and hence, more excitation. Thedistance of the dominant peak with respect to thecathode increases slightly with decreasing pres-sure, and also with decreasing current at constantpressure. Since the dominant peak is in the begin-ning of the NG, it means, therefore, that thelength of the CDS increases with decreasing pres-sure and current. This is in agreement with theempirical formula proposed by Aston, which ex-presses the relationship between the CDS lengthŽ . Ž . Ž .L and the pressure p and current I inCDS
w xthe discharge 23 :
A BL s qCDS 1r2p I
where A and B are constants.Comparing Fig. 5a,b tells us that very good
agreement is reached between the calculated andthe measurement intensity distributions, both withrespect to the ratio of the CG and NG peaks, andto the position of the NG peak and its decay as afunction of distance from the cathode. Also theeffect of pressure and current on the shape of thespatial distributions and on the intensity valuesŽi.e. increasing with current, but more or less
.independent of pressure, at constant current , arevery similar in both experiment and modelresults.
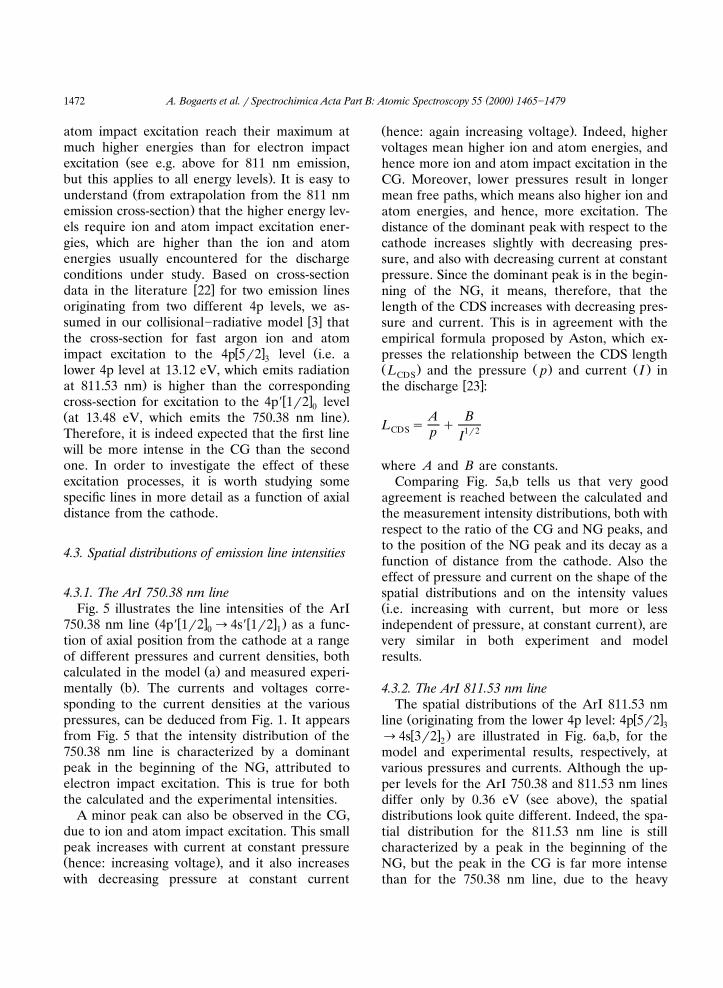
4.3.2. The ArI 811.53 nm lineThe spatial distributions of the ArI 811.53 nmŽ w xline originating from the lower 4p level: 4p 5r2 3w x .ª4s 3r2 are illustrated in Fig. 6a,b, for the2
model and experimental results, respectively, atvarious pressures and currents. Although the up-per levels for the ArI 750.38 and 811.53 nm lines
Ž .differ only by 0.36 eV see above , the spatialdistributions look quite different. Indeed, the spa-tial distribution for the 811.53 nm line is stillcharacterized by a peak in the beginning of theNG, but the peak in the CG is far more intensethan for the 750.38 nm line, due to the heavy
( )A. Bogaerts et al. r Spectrochimica Acta Part B: Atomic Spectroscopy 55 2000 1465]1479 1473
particle excitation cross-sections which appear tobe higher for the 811.53 nm line compared to the750.38 nm line.
As appears from Fig. 6a,b, the ratio of CG peakto NG peak increases with decreasing pressureŽ . Žat constant current and increasing current at
.constant pressure , for the same reasons asexplained above for the ArI 750.38 nm line. In-
Ž .deed, a lower pressure at constant current and aŽ .higher current at constant pressure correspond
both to a higher voltage, and hence to higher ionand atom energies, which give rise to more effi-cient ion and atom impact excitation, resulting ina higher peak in the CG. Moreover, the highervoltage yields also higher electron energies, andthe latter become higher than the energy corre-sponding to the maximum in the excitation cross-section, hence resulting in lower electron impactexcitation, and therefore a lower peak in the NG.
ŽThe agreement between calculated results Fig.. Ž .6a and experimental values Fig. 6b is again
satisfactory. Indeed, good correspondence isŽ . Žreached for: i the ratio of CGrNG peaks also
. Ž .as a function of voltage and current ; ii theŽposition of both peaks although in the experi-
ment, the CG peak appears to be slightly furtherfrom the cathode, and the dip between CG andNG peaks is not so pronounced as in the model,possibly due to some differences in the calculatedand real length of the CDS as a function of radial
. Ž .distance ; and iii the effect of pressure andcurrent on the intensity values.
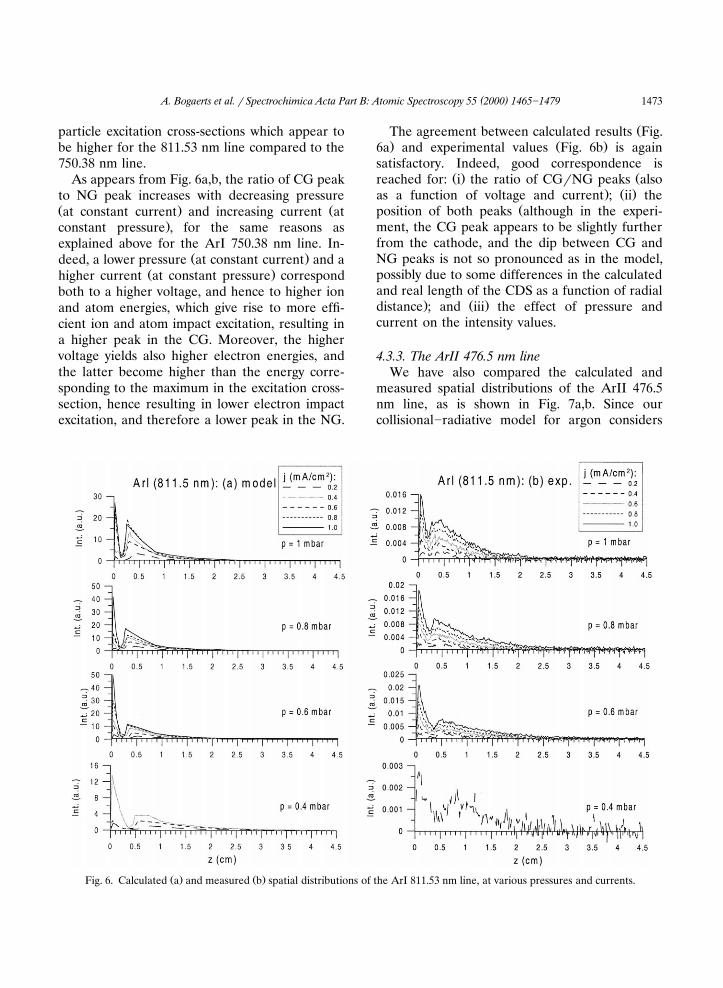
4.3.3. The ArII 476.5 nm lineWe have also compared the calculated and
measured spatial distributions of the ArII 476.5nm line, as is shown in Fig. 7a,b. Since ourcollisional]radiative model for argon considers
Ž . Ž .Fig. 6. Calculated a and measured b spatial distributions of the ArI 811.53 nm line, at various pressures and currents.
( )A. Bogaerts et al. r Spectrochimica Acta Part B: Atomic Spectroscopy 55 2000 1465]14791474
only argon atomic levels, the spatial distributionof this ionic line intensity is simply calculatedbased on the electron impact excitation rate tothe upper ionic level. This ionic line is an argon
Ž 4ion laser line, and the upper laser level 3p 4p2 .P is populated by direct electron impact exci-3r2tation from the argon atom ground state. Thecross section for this process as a function of theelectron energy is adopted from Bennett et al.w x24 . Fast argon ion and atom impact excitationare not considered for this line, because the en-ergy required to excite this ionic level is expectedto be much higher than the ion and atom ener-
Žgies at the discharge conditions under study i.e.threshold for excitation at approx. 36 eV, but theprocess will only become important for muchhigher energies, in analogy with the know cross-
w x.sections for 811.53 nm excitation 22 . Therefore,the calculated spatial distribution of this ionic
Ž .line Fig. 7a shows only a peak in the beginningof the NG, due to electron impact excitation.Indeed, electron impact excitation occurs mainlyin the beginning of the NG, where the electrons
Žhave most suitable energy for excitation i.e. nearthe energy giving rise to the maximum in the
.cross-section and, even more important, wheremost electrons are present due to back and forth
Žscattering in the weak electric field see also thew x.discussion in Bogaerts et al. 25 . The calculated
spatial distribution is in good correspondence withŽ .the experimental behavior Fig. 7b , which de-
monstrates that the above assumption of takinginto account only electron impact excitation isjustified. Comparing Fig. 7a,b tells us that notonly the position and shape of the NG peak, butalso the effect of pressure and current, are verysimilar both in the model and in the experimentalresults.
Ž . Ž .Fig. 7. Calculated a and measured b spatial distributions of the ArII 476.5 nm line, at various pressures and currents.
( )A. Bogaerts et al. r Spectrochimica Acta Part B: Atomic Spectroscopy 55 2000 1465]1479 1475
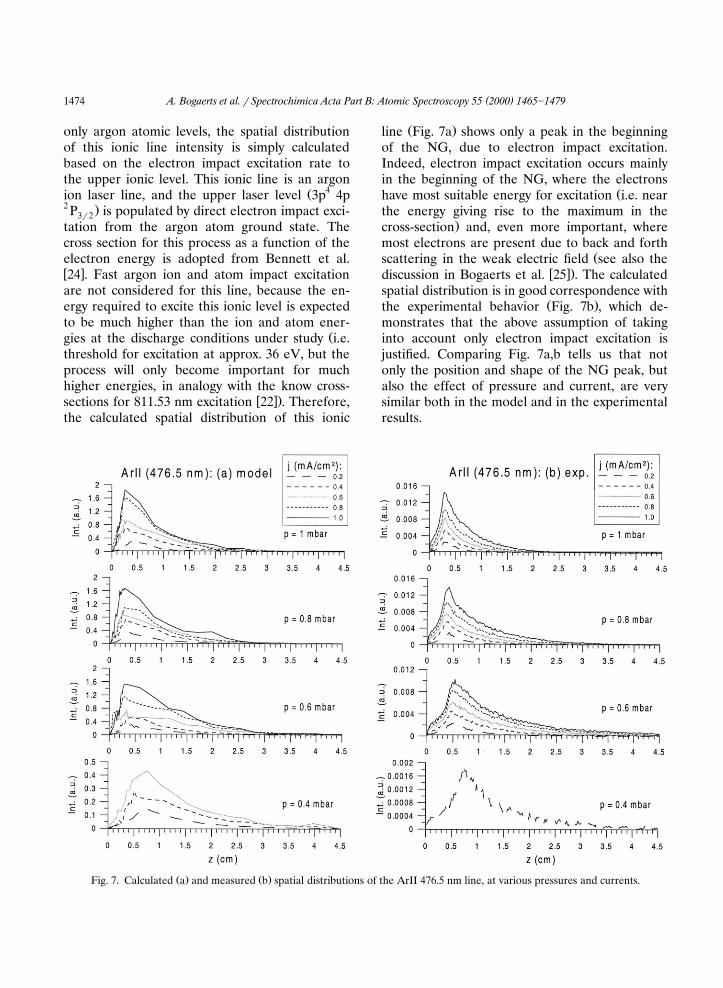
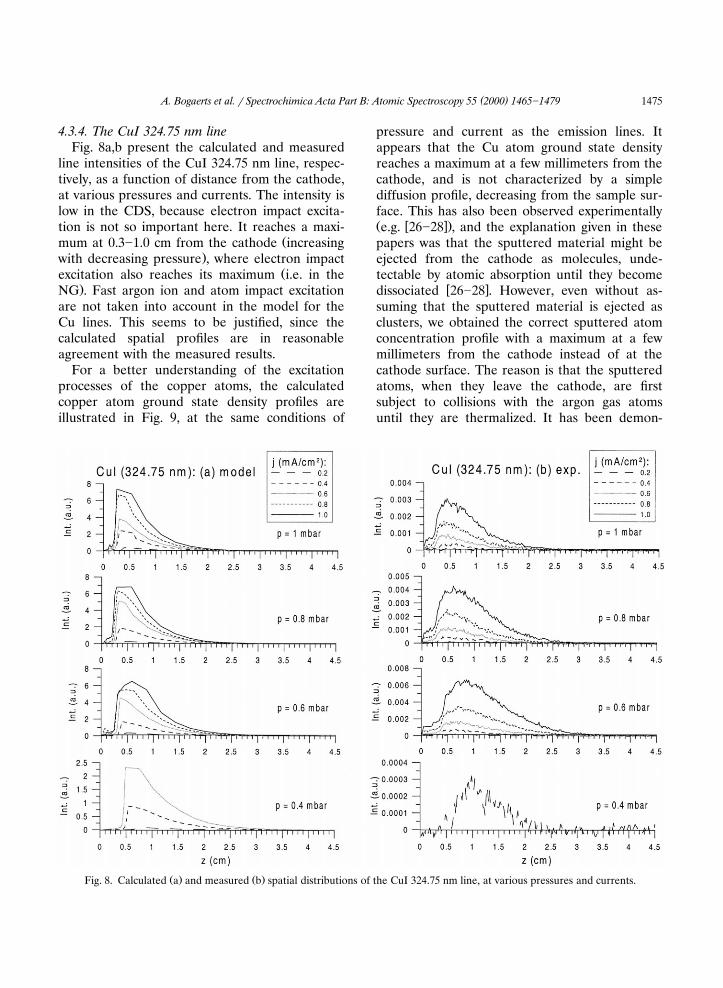
4.3.4. The CuI 324.75 nm lineFig. 8a,b present the calculated and measured
line intensities of the CuI 324.75 nm line, respec-tively, as a function of distance from the cathode,at various pressures and currents. The intensity islow in the CDS, because electron impact excita-tion is not so important here. It reaches a maxi-
Žmum at 0.3]1.0 cm from the cathode increasing.with decreasing pressure , where electron impact
Žexcitation also reaches its maximum i.e. in the.NG . Fast argon ion and atom impact excitation
are not taken into account in the model for theCu lines. This seems to be justified, since thecalculated spatial profiles are in reasonableagreement with the measured results.
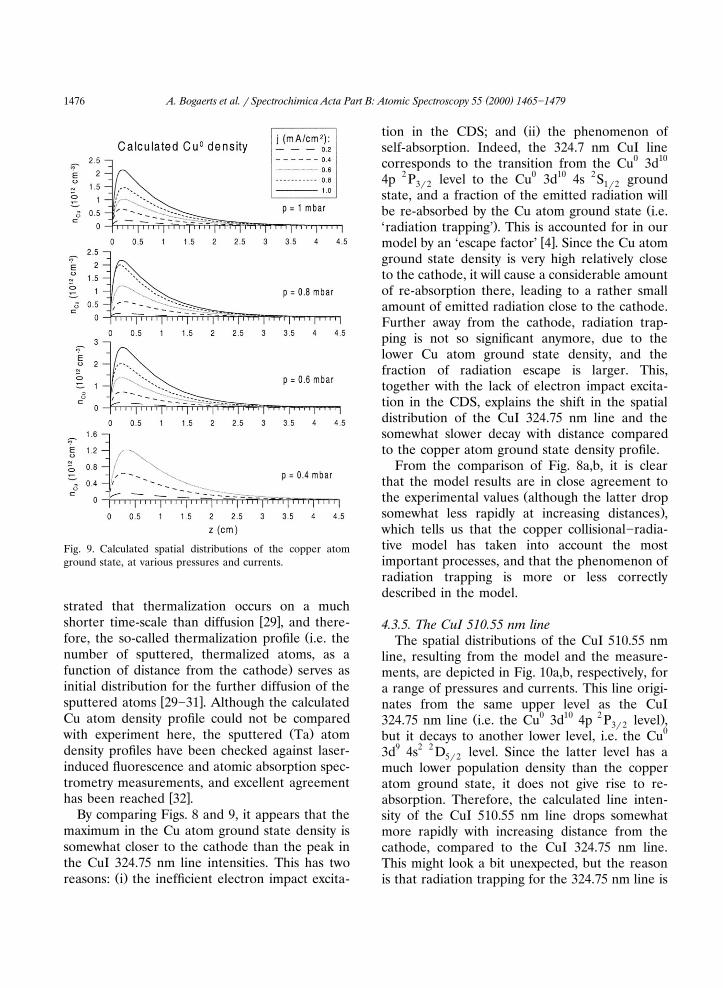
For a better understanding of the excitationprocesses of the copper atoms, the calculatedcopper atom ground state density profiles areillustrated in Fig. 9, at the same conditions of
pressure and current as the emission lines. Itappears that the Cu atom ground state densityreaches a maximum at a few millimeters from thecathode, and is not characterized by a simplediffusion profile, decreasing from the sample sur-face. This has also been observed experimentallyŽ w x.e.g. 26]28 , and the explanation given in thesepapers was that the sputtered material might beejected from the cathode as molecules, unde-tectable by atomic absorption until they become
w xdissociated 26]28 . However, even without as-suming that the sputtered material is ejected asclusters, we obtained the correct sputtered atomconcentration profile with a maximum at a fewmillimeters from the cathode instead of at thecathode surface. The reason is that the sputteredatoms, when they leave the cathode, are firstsubject to collisions with the argon gas atomsuntil they are thermalized. It has been demon-
Ž . Ž .Fig. 8. Calculated a and measured b spatial distributions of the CuI 324.75 nm line, at various pressures and currents.
( )A. Bogaerts et al. r Spectrochimica Acta Part B: Atomic Spectroscopy 55 2000 1465]14791476
Fig. 9. Calculated spatial distributions of the copper atomground state, at various pressures and currents.
strated that thermalization occurs on a muchw xshorter time-scale than diffusion 29 , and there-
Žfore, the so-called thermalization profile i.e. thenumber of sputtered, thermalized atoms, as a
.function of distance from the cathode serves asinitial distribution for the further diffusion of the
w xsputtered atoms 29]31 . Although the calculatedCu atom density profile could not be compared
Ž .with experiment here, the sputtered Ta atomdensity profiles have been checked against laser-induced fluorescence and atomic absorption spec-trometry measurements, and excellent agreement
w xhas been reached 32 .By comparing Figs. 8 and 9, it appears that the
maximum in the Cu atom ground state density issomewhat closer to the cathode than the peak inthe CuI 324.75 nm line intensities. This has two
Ž .reasons: i the inefficient electron impact excita-
Ž .tion in the CDS; and ii the phenomenon ofself-absorption. Indeed, the 324.7 nm CuI linecorresponds to the transition from the Cu0 3d10
4p 2 P level to the Cu0 3d10 4s 2S ground3r2 1r2state, and a fraction of the emitted radiation will
Žbe re-absorbed by the Cu atom ground state i.e..‘radiation trapping’ . This is accounted for in our
w xmodel by an ‘escape factor’ 4 . Since the Cu atomground state density is very high relatively closeto the cathode, it will cause a considerable amountof re-absorption there, leading to a rather smallamount of emitted radiation close to the cathode.Further away from the cathode, radiation trap-ping is not so significant anymore, due to thelower Cu atom ground state density, and thefraction of radiation escape is larger. This,together with the lack of electron impact excita-tion in the CDS, explains the shift in the spatialdistribution of the CuI 324.75 nm line and thesomewhat slower decay with distance comparedto the copper atom ground state density profile.
From the comparison of Fig. 8a,b, it is clearthat the model results are in close agreement to
Žthe experimental values although the latter drop.somewhat less rapidly at increasing distances ,
which tells us that the copper collisional]radia-tive model has taken into account the mostimportant processes, and that the phenomenon ofradiation trapping is more or less correctlydescribed in the model.
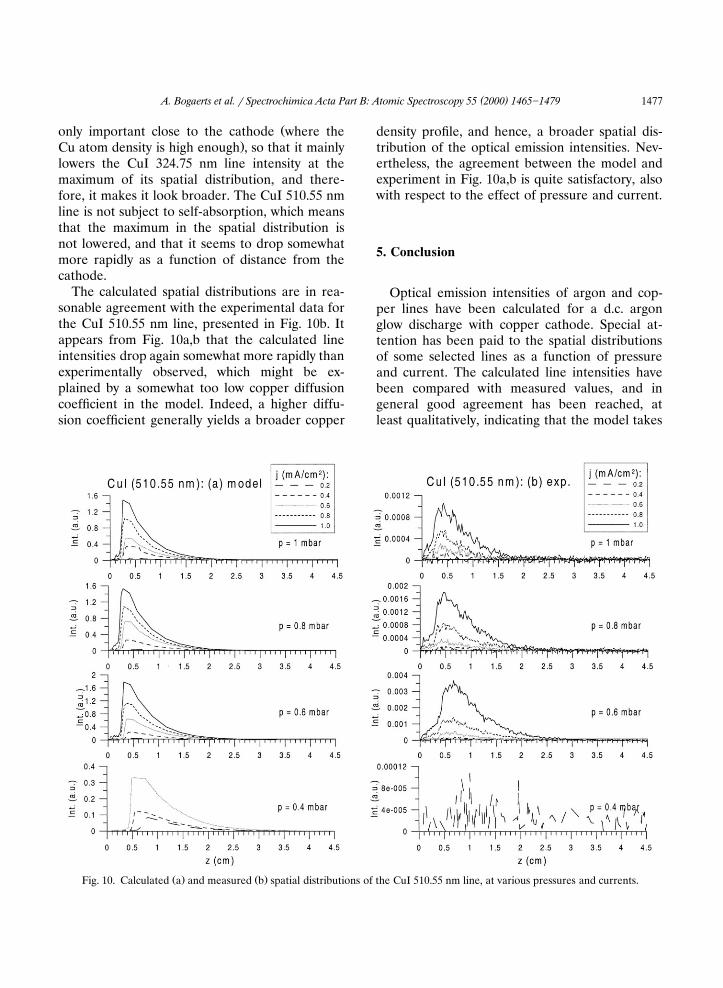
4.3.5. The CuI 510.55 nm lineThe spatial distributions of the CuI 510.55 nm
line, resulting from the model and the measure-ments, are depicted in Fig. 10a,b, respectively, fora range of pressures and currents. This line origi-nates from the same upper level as the CuI
Ž 0 10 2 .324.75 nm line i.e. the Cu 3d 4p P level ,3r2but it decays to another lower level, i.e. the Cu0
3d9 4s2 2 D level. Since the latter level has a5r2much lower population density than the copperatom ground state, it does not give rise to re-absorption. Therefore, the calculated line inten-sity of the CuI 510.55 nm line drops somewhatmore rapidly with increasing distance from thecathode, compared to the CuI 324.75 nm line.This might look a bit unexpected, but the reasonis that radiation trapping for the 324.75 nm line is
( )A. Bogaerts et al. r Spectrochimica Acta Part B: Atomic Spectroscopy 55 2000 1465]1479 1477
Žonly important close to the cathode where the.Cu atom density is high enough , so that it mainly
lowers the CuI 324.75 nm line intensity at themaximum of its spatial distribution, and there-fore, it makes it look broader. The CuI 510.55 nmline is not subject to self-absorption, which meansthat the maximum in the spatial distribution isnot lowered, and that it seems to drop somewhatmore rapidly as a function of distance from thecathode.
The calculated spatial distributions are in rea-sonable agreement with the experimental data forthe CuI 510.55 nm line, presented in Fig. 10b. Itappears from Fig. 10a,b that the calculated lineintensities drop again somewhat more rapidly thanexperimentally observed, which might be ex-plained by a somewhat too low copper diffusioncoefficient in the model. Indeed, a higher diffu-sion coefficient generally yields a broader copper
density profile, and hence, a broader spatial dis-tribution of the optical emission intensities. Nev-ertheless, the agreement between the model andexperiment in Fig. 10a,b is quite satisfactory, alsowith respect to the effect of pressure and current.
5. Conclusion
Optical emission intensities of argon and cop-per lines have been calculated for a d.c. argonglow discharge with copper cathode. Special at-tention has been paid to the spatial distributionsof some selected lines as a function of pressureand current. The calculated line intensities havebeen compared with measured values, and ingeneral good agreement has been reached, atleast qualitatively, indicating that the model takes
Ž . Ž .Fig. 10. Calculated a and measured b spatial distributions of the CuI 510.55 nm line, at various pressures and currents.
( )A. Bogaerts et al. r Spectrochimica Acta Part B: Atomic Spectroscopy 55 2000 1465]14791478
into account the correct excitation processes anduses reasonable cross-sections.
For the intensity distribution of the argonatomic lines, it was found that lines originatingfrom levels belonging to the lower 4p configura-tion exhibit a strong peak in the CG and a smallerpeak in the beginning of the NG, whereas linesoriginating from higher 4p levels are character-ized by a dominant peak in the beginning of theNG and only a minor peak in the CG. The argonionic line was only characterized by a NG peak.This demonstrates that the argon atom lower 4p
Ž .levels as well as the 4s levels can be excited byboth electron and fast argon atom and ion impact
Žexcitation, whereas the higher 4p levels as well as.all higher atomic levels and the ionic levels are
Ž .predominantly or exclusively populated by elec-tron impact excitation. The CuI lines were foundto exhibit a maximum intensity in the NG,attributed to electron impact excitation from theCu atom ground state. The spatial distribution ofthe CuI 324.75 nm line is somewhat broader thanthat of the CuI 510.55 nm line. The reason is thatthe 324.75 nm line is a resonant line to thecopper atom ground state, which is strongly sub-
Ž .ject to self-absorption ‘radiation trapping’ , atleast at the maximum of its spatial distribution.This results in a lowering of the maximum inten-sity, and hence, it looks like a broadening in thespatial distribution.
It is demonstrated in this paper that from thecomparison of calculated and experimental opti-cal emission intensities, interesting informationcan be obtained about the role of various excita-tion processes. In future work, we would like toinvestigate the effect of decreasing discharge tube
w xdiameter, because the experiment 10 revealedthe possible formation of a positive column-likeor anode fall-like region, and a good understand-
w xing of these experimental observations 10 neces-sitates detailed numerical modeling.
Finally, it should be mentioned that, althoughthe results are not presented here in a typicalanalytical glow discharge source, but in a sourceequipped with the necessary diagnostics, the dis-charge conditions and cell dimensions are moreor less comparable to analytical glow discharges.From our previous calculations, we know that the
Žpresently obtained results i.e. occurrence andpositions of the peaks in the spatial distributions
.of the different lines can be generalized to ana-lytical glow discharge sources, such as theGrimm-type source, as long as the dischargesconsist of a CDS and a NG, which is generally thecase for analytical glow discharges.
Acknowledgements
A. Bogaerts is indebted to the Flemish FundŽ .for Scientific Research FWO for financial sup-
port. This research is also sponsored by a NATOŽ .SfP Project SfP 971989 , OTKA-T-25989, P6r97
Hungarian-Portugal Bilateral Project and by theFederal Services for Scientific, Technical and Cul-
Ž .tural Affairs DWTCrSSTC of the Belgian PrimeŽMinister’s Office through IUAP-IV Conv.
.P4r10 . Finally, the authors wish to thankK. Rozsa and L. Szalai for useful discussions, andT.J. Forgacs, J. Toth, E. Sarkozi and Gy. Csaszarfor the construction of the discharge tube.
References
w x1 R.K. Marcus, Glow Discharge Spectroscopies, Plenum,New York, 1993.
w x2 R. Payling, A. Bengtson, D. Jones, Glow DischargeOptical Emission Spectrometry, Wiley, Chichester, 1996.
w x3 A. Bogaerts, R. Gijbels, J. Vlcek, J. Appl. Phys. 84Ž .1998 121]136.
w x4 A. Bogaerts, R. Gijbels, R.J. Carman, Spectrochim. ActaŽ .Part B 53 1998 1679]1703.
w x5 A. Bogaerts, R. Gijbels, J. Vlcek, Spectrochim. ActaŽ .Part B 53 1998 1517]1526.
w x Ž .6 A. Bogaerts, R. Gijbels, J. Anal. At. Spectrom. 13 1998721]726.
w x Ž .7 A.V. Phelps, B.M. Jelenkovic, Phys. Rev. A 38 19882975]2990.
w x Ž .8 D.A. Scott, A.V. Phelps, Phys. Rev. A 43 19913043]3056.
w x9 K. Rozsa, A. Gallagher, Z. Donko, Phys. Rev. E 52Ž .1995 913]918.
w x10 Z. Donko, G. Bano, L. Szalai, K. Kutasi, K. Rozsa, M.Ž .Pinheiro, N. Pinhao, J. Phys. D: Appl. Phys. 32 1999
2416]2425.w x11 Z.M. Jelenak, Z.B. Velikic, J.V. Bozin, Z.Lj. Petrovic,
Ž .B.M. Jelenkovic, Phys. Rev. E 47 1993 3566]3573.w x12 S.B. Radovanov, B. Tomcik, Z.Lj. Petrovic, B.M. Je-
Ž .lenkovic, J. Appl. Phys. 67 1989 97]107.

( )A. Bogaerts et al. r Spectrochimica Acta Part B: Atomic Spectroscopy 55 2000 1465]1479 1479
w x13 F. Guimaraes, J.B. Almeida, J. Bretagne, Plasma SourcesŽ .Sci. Technol. 2 1993 138]144.
w x14 Z.Lj. Petrovic, S. Bzenic, J. Jovanovic, S. Djurovic, J.Ž .Phys. D: Appl. Phys. 28 1995 2287]2293.
w x15 Z.Lj. Petrovic, V.D. Stojanovic, J. Vac. Sci. Technol. AŽ .16 1998 329]336.
w x16 F. Guimaraes, J. Bretagne, Plasma Sources Sci. Technol.Ž .2 1993 127]137.
w x Ž .17 A. Bogaerts, Plasma Sources Sci. Technol. 8 1999210]229.
w x Ž .18 N. Pinhao, J. Phys. D: Appl. Phys. 27 1994 1184]1192.w x19 A. Bogaerts, R. Gijbels, V.V. Serikov, J. Appl. Phys. 87
Ž .2000 8334]8343.w x20 E.B.M. Steers, R.J. Fielding, J. Anal. At. Spectrom. 2
Ž .1987 239]244.w x Ž .21 E. Eggarter, J. Chem. Phys. 62 1975 833]847.w x Ž .22 A.V. Phelps, J. Phys. Chem. Ref. Data 20 1991 557]573.w x Ž .23 F.W. Aston, Proc. R. Soc. London Ser. A 79 1907
80]85.
w x24 W.R. Bennett Jr., G.N. Mercer, P.J. Kindlmann, B.Ž .Wexler, H. Hyman, Phys. Rev. Lett. 17 1966 987]991.
w x25 A. Bogaerts, R. Gijbels, W.J. Goedheer, J. Appl. Phys.Ž .78 1995 2233]2241.
w x26 A.J. Stirling, W.D. Westwood, J. Phys. D: Appl. Phys. 4Ž .1971 246]252.
w x27 N.P. Ferreira, H.G.C. Human, Spectrochim. Acta Part BŽ .36 1981 215]229.
w x Ž .28 K. Hoppstock, W.W. Harrison, Anal. Chem. 67 19953167]3171.
w x29 J.A. Valles-Abarca, A. Gras-Marti, J. Appl. Phys. 55Ž .1984 1370]1378.
w x30 M. van Straaten, R. Gijbels, A. Vertes, Anal. Chem. 64Ž .1992 1855]1863.
w x Ž .31 A. Bogaerts, R. Gijbels, J. Appl. Phys. 79 19961279]1286.
w x32 A. Bogaerts, E. Wagner, B.W. Smith, J.D. Winefordner,D. Pollmann, W.W. Harrison, R. Gijbels, Spectrochim.
Ž .Acta Part B 52 1997 205]218.