Embed Size (px)
Citation preview
Comparison of clinical MRI liver iron contentmeasurements using signal intensity ratios, R2
and R2*
Jurgen H. Runge ,1 Erik M. Akkerman,1 Marian A. Troelstra,1 Aart J. Nederveen,1
Ulrich Beuers,2 Jaap Stoker1
1Department of Radiology, Academic Medical Center, University of Amsterdam, Meibergdreef 9, 1105AZ Amsterdam,
The Netherlands2Department of Gastroenterology & Hepatology, Academic Medical Center, University of Amsterdam, Meibergdreef 9,
1105AZ Amsterdam, The Netherlands
Abstract
Purpose: To compare three types of MRI liver ironcontent (LIC) measurement performed in daily clinicalroutine in a single center over a 6-year period.Methods: Patients undergoing LIC MRI-scans (1.5T) atour center between January 1, 2008 and December 31,2013 were retrospectively included. LIC was measuredroutinely with signal intensity ratio (SIR) and MR-relaxometry (R2 and R2*) methods. Three observersplaced regions-of-interest. The success rate was thenumber of correctly acquired scans over the total numberof scans. Interobserver agreement was assessed withintraclass correlation coefficients (ICC) and Bland–Altman analysis, correlations between LICSIR, R2, R2*,and serum values with Spearman’s rank correlationcoefficient. Diagnostic accuracies of LICSIR, R2 andserum transferrin, transferrin-saturation, and ferritincompared to increased R2* (‡44 Hz) as indicator of ironoverload were assessed using ROC-analysis.Results: LIC MRI-scans were performed in 114 subjects.SIR, R2, and R2* data were successfully acquired in 102/114 (89%), 71/114 (62%), and 112/114 (98%) measure-ments, with the lowest success rate for R2. The ICCs ofSIR, R2, and R2* did not differ at 0.998, 0.997, and0.999. R2 and serum ferritin had the highest diagnosticaccuracies to detect elevated R2* as mark of ironoverload.
Conclusions: SIR and R2* are preferable over R2 in termsof success rates. R2*’s shorter acquisition time and widerange of measurable LIC values favor R2* over SIR forMRI-based LIC measurement.
Key words: Magnetic resonance imaging—Ironoverload—Hemochromatosis—Bloodtransfusion—Biomarker—Relaxometry
Abbreviation
LIC Liver iron content
Various diseases are associated with increased liver ironcontent (LIC), which may induce or contribute to liverdamage [1–3]. Serial measurement of LIC during long-term follow-up and treatment is highly desirable, butrepeated invasive measurements are not recommendeddue to risks of complications of serial liver biopsies.Surrogate biochemical markers including serum ferritinand transferrin-saturation are widely used, but areflawed by limited specificity. Thus, accurate non-invasiveMRI-based methods of LIC measurement are used inclinical practice for patients (suspected) with increasedLIC [4, 5].
Several types of MRI LIC measurement have beendescribed in the literature. Straightforward in–out phasegradient echo (GRE) shows signal loss at the later echotime (TE) but is only qualitative and easily confoundedby the presence of hepatic steatosis. Quantitative ap-proaches include (i) signal intensity ratio (SIR) mea-surement (e.g., the Gandon method) and (ii) MR-
Electronic supplementary material The online version of this article(doi:10.1007/s00261-016-0831-7) contains supplementary material,which is available to authorized users.
Correspondence to: Jurgen H. Runge; email: [email protected]
ª The Author(s) 2016. This article is published with
open access at Springerlink.com
Published online: 18 July 2016AbdominalRadiology
Abdom Radiol (2016) 41:2123–2131
DOI: 10.1007/s00261-016-0831-7
relaxometry. The Gandon method (henceforth referredto as ‘‘SIR’’) utilizes the liver-to-muscle SIR on differ-ently weighted MRI-scans [6]. This method allows easyand free calculation of the LICSIR, by entering ROIvalues in an online tool [7]. Hence, assuming the acqui-sition and placement of regions-of-interest (ROIs) areperformed correctly, the method is robust to observerinfluences. A major limitation is its upper limit ofdetection of 350 lmol/g (equal to 20 mg/g): changesabove that threshold cannot be measured.
MR-relaxometry relies on the calculation of tissuerelaxation rates (R2 and R2*, the inverse of relaxationtimes T2 and T2*), which increase as iron accumulatesand are sensitive to changes in LIC values well above theSIR-threshold. One commercialized R2 approach usingsingle-echo spin-echo (SE) MRI is the FDA-approved St.Pierre method [FerriScan�], performed in 10 min in free-breathing [8]. The per-scan analysis price is ~$300, on topof the costs of the MRI-scan itself. Alternative free-of-charge approaches are available for R2 using free-breathing or respiratory triggered SE-MRI and for R2*using single breath-hold GRE MRI [9].
Recent developments in MR-relaxometry includemultipeak fat corrections and the use of complex instead ofmagnitude-only data fitting [10], assessment of the effect offat suppression on R2* [11] and the comparison of ad-vanced data fit models [12] and analysis approaches [13].
A comparative study of LICSIR, R2, and R2* in 94patients with b-thalassemia reported high correlations[14]. However, success rates, interobserver agreement,and applicability for diseases other than b-thalassemiawere not investigated, nor were serum markers assessed.The latter may be useful to screen for elevated LIC (i.e.,>36 lmol/g), saving expensive and limited MRI time.We hypothesize that R2* is preferable over SIR and R2 interms of success rate, acquisition time, and range ofdetection and over serum values in terms of accuracy indetecting elevated LIC.
In our center, the clinical LIC protocol has includedSIR, R2, and R2* since 2005, with regular weekly clinicalreferrals since 2008. The SIR measurement is recom-mended by the national guideline for hemochromatosis[15]. It is supplemented by R2 and R2* measurements tofill the gap caused by the SIR method’s hard cut-off at350 lmol/g. To investigate our hypothesis, we (i) as-sessed SIR, R2, and R2* LIC measurements and theirsuccess rates and interobserver agreement; and (ii) com-pared the diagnostic accuracies of LICSIR, R2, and sur-rogate serum markers for correctly predicting elevatedLIC based on increased R2*.
Materials and methods
Ethical
All data used for this study were acquired in clinicalsetting and were anonymized prior to analysis. Informed
consent was waived by the Medical Research EthicsCommittee of the AMC Amsterdam.
Patients
All MRI-based LIC measurements performed betweenJanuary 1, 2008 and December 31, 2013 were retro-spectively included in this study. As additional mea-surements were added to the protocol in 2014, onlymeasurements up to end 2013 were included. Clinicaldiagnosis and—when available—serum markers of ironmetabolism (total iron, transferrin, transferrin-satura-tion, ferritin) were collected and subsequently anon-ymized by a colleague not otherwise involved in thisstudy.
MRI
MRI-scanning was performed supine, feet first on a 1.5TAvanto MRI-scanner (Siemens AG, Erlangen, Germany)using phased-array coils (body array and spine coil) forlocalizers and R2 and R2* measurements and the bodycoil for the SIR measurement [6]. Use of the body coilprovided an as homogenous B1 field as possible, reducingvariation in SIR measurements due to variations of flipangles between patients. For R2* and R2, the B1 variationis eliminated via the data fit. Breath-hold imaging (lo-calizers, SIR and R2*) was performed in expiration.Three 10-mm slices with a variable slice gap to cover theliver were equally positioned for all three LIC measure-ments. Especially for the GRE-based SIR and R2*measurements, careful B0 shimming is important toachieve a homogenous B0 field, ensuring correct mea-surements. Shimming was performed with a shim boxcovering the field-of-view in the feet-head direction andthe contours of the abdomen (i.e., excluding the arms) inthe left–right and anterior-posterior directions. The SIRmeasurement according to Gandon et al. requires five(T1, PD, T2, T2+, and T2++) image weightings withspecific TR/TE combinations [6]. Table 1 contains anoverview of the relevant scan parameters. Of note, theTE interval used for R2* was shorter (1.41 ms) than thestandard in- and out-of-phase interval (2.26 ms).
Data analyses
After inclusion all measurements were checked for cor-rect TRs, TEs, and RF coils using DICOM headerinformation as for SIR measurements, specific TR/TEcombinations and the use of the body coil are manda-tory. Image quality was assessed by a research trainee(JHR, 4 years of experience) and an abdominal radiol-ogist (JS, 20 years of experience) using a 3-point scale(good/adequate/inadequate). The type of artifact(s) wasnoted. Measurements with incorrect scan parameters orinadequate image quality were classified unsuccessful.
2124 J. H. Runge et al.: R2* preferred for MRI LIC measurement
ROI-placement
SIR, R2, and R2* data were processed using custom-made software that allowed ROI-placement, LICSIR
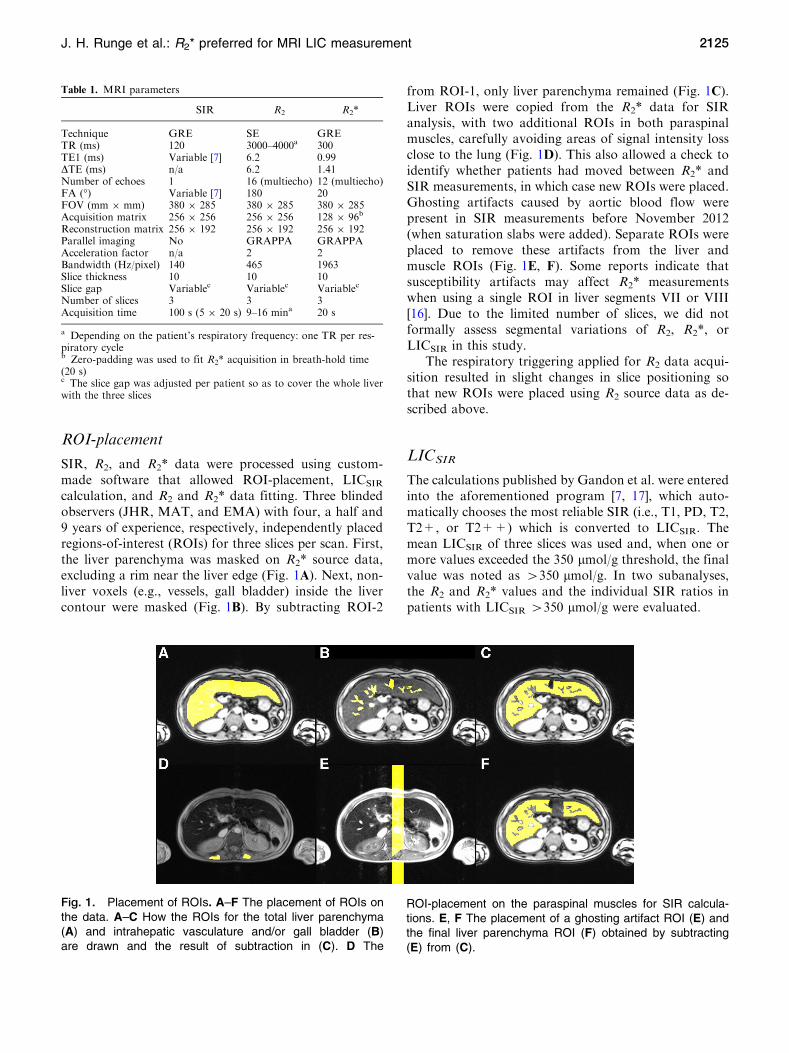
calculation, and R2 and R2* data fitting. Three blindedobservers (JHR, MAT, and EMA) with four, a half and9 years of experience, respectively, independently placedregions-of-interest (ROIs) for three slices per scan. First,the liver parenchyma was masked on R2* source data,excluding a rim near the liver edge (Fig. 1A). Next, non-liver voxels (e.g., vessels, gall bladder) inside the livercontour were masked (Fig. 1B). By subtracting ROI-2
from ROI-1, only liver parenchyma remained (Fig. 1C).Liver ROIs were copied from the R2* data for SIRanalysis, with two additional ROIs in both paraspinalmuscles, carefully avoiding areas of signal intensity lossclose to the lung (Fig. 1D). This also allowed a check toidentify whether patients had moved between R2* andSIR measurements, in which case new ROIs were placed.Ghosting artifacts caused by aortic blood flow werepresent in SIR measurements before November 2012(when saturation slabs were added). Separate ROIs wereplaced to remove these artifacts from the liver andmuscle ROIs (Fig. 1E, F). Some reports indicate thatsusceptibility artifacts may affect R2* measurementswhen using a single ROI in liver segments VII or VIII[16]. Due to the limited number of slices, we did notformally assess segmental variations of R2, R2*, orLICSIR in this study.
The respiratory triggering applied for R2 data acqui-sition resulted in slight changes in slice positioning sothat new ROIs were placed using R2 source data as de-scribed above.
LICSIR
The calculations published by Gandon et al. were enteredinto the aforementioned program [7, 17], which auto-matically chooses the most reliable SIR (i.e., T1, PD, T2,T2+, or T2++) which is converted to LICSIR. Themean LICSIR of three slices was used and, when one ormore values exceeded the 350 lmol/g threshold, the finalvalue was noted as >350 lmol/g. In two subanalyses,the R2 and R2* values and the individual SIR ratios inpatients with LICSIR >350 lmol/g were evaluated.
Fig. 1. Placement of ROIs. A–F The placement of ROIs onthe data. A–C How the ROIs for the total liver parenchyma(A) and intrahepatic vasculature and/or gall bladder (B)are drawn and the result of subtraction in (C). D The
ROI-placement on the paraspinal muscles for SIR calcula-tions. E, F The placement of a ghosting artifact ROI (E) andthe final liver parenchyma ROI (F) obtained by subtracting(E) from (C).
Table 1. MRI parameters
SIR R2 R2*
Technique GRE SE GRETR (ms) 120 3000–4000a 300TE1 (ms) Variable [7] 6.2 0.99DTE (ms) n/a 6.2 1.41Number of echoes 1 16 (multiecho) 12 (multiecho)FA (�) Variable [7] 180 20FOV (mm 9 mm) 380 9 285 380 9 285 380 9 285Acquisition matrix 256 9 256 256 9 256 128 9 96b
Reconstruction matrix 256 9 192 256 9 192 256 9 192Parallel imaging No GRAPPA GRAPPAAcceleration factor n/a 2 2Bandwidth (Hz/pixel) 140 465 1963Slice thickness 10 10 10Slice gap Variablec Variablec Variablec
Number of slices 3 3 3Acquisition time 100 s (5 9 20 s) 9–16 mina 20 s
a Depending on the patient’s respiratory frequency: one TR per res-piratory cycleb Zero-padding was used to fit R2* acquisition in breath-hold time(20 s)c The slice gap was adjusted per patient so as to cover the whole liverwith the three slices
J. H. Runge et al.: R2* preferred for MRI LIC measurement 2125
R2*
In magnitude images, the noise is distributed in a non-Gaussian manner. This is known as Rician noise [18]. Athigh signal levels, the non-zero mean has a negligibleeffect on the average signal, but near the noise level, anoise bias exists which needs to be taken into accountwhen fitting R2*. We explored three different fit routines:a truncated exponential fit (A) [19, 20], an exponen-tial + constant fit (B) [9, 21], and an exponen-tial + Rician noise (C).
The truncated exponential method A is consideredthe reference standard, but is time-consuming, wheremethods B + C do not require further manual input. Wecompared method B and C with method A as referenceusing Bland–Altman analysis and R2* data from a singlereader (EMA). Based on this comparison (mean paired
difference (�d) was 0.8 Hz for A–C and 33.6 Hz for A–B),we employed method C (Rician noise bias) for theremaining analyses [22, 23].
R2* calculation was thus performed with a monoex-ponential model (Eq. 1) with a Rician noise factor. InEq. 1, ER describes the Rice distribution (Online Re-
source 1), where r is a noise parameter and S0 � e�R2��TE
reflects the true magnitude value. Data were averagedinside the ROI before data fitting (average-then-fit).
S TEð Þ ¼ ER � S0 � e�R2��TE; r
� �ð1Þ
The effect of intrahepatic fat on R2* was assessed byapplying a biexponential model in a subset (n = 10) withdefinite presence of fat, as identified by the presence of aoscillating signal intensity decay over time.R2* valueswithand without correction were compared using Bland–Alt-
man analysis. The (�d) was 0.1 Hz—indicating low overallfat content in this cohort—and deemed negligible com-pared to the subset mean of 70 Hz. Monoexponentiallyfitted R2* values were used for all comparisons.
R2
ForR2 calculation an average-then-fit routine was appliedusing a biexponential model as shown in Eqs. 2 and 3. InEq. 2, ST (TE) is the signal intensity without noise at timeTE, S0 is the signal intensity at TE = 0, and R2 is therelaxation rate. The subscripts a and b indicate fast andslow relaxation components, respectively. For R2, Riciannoise bias was approximated by the Pythagorean additionof an extra fit parameter, the noise factor ‘m’ in Eq. 3.
ST TEð Þ ¼ S0;a � e�R2;a�TE þ S0;b � e�R2;b�TE ð2Þ
S TEð Þ ¼ffiffiffiffiffiffiffiffiffiffiffiffiffiffiffiffiffiffiffiffiffiffiffiffiffiffiST TEð Þ þ m2
q: ð3Þ
In the biexponential model, an iron-dense and aniron-sparse component are assumed, with short and long
R2, respectively. For further comparisons with LICSIR
and R2*, the bulk R2 was calculated (Eq. 4) in accor-dance with the literature [8, 9, 14].
R2 ¼S0;a � R2;a þ S0;b � R2;b
S0;a þ S0;bð4Þ
Comparison with the literature
The relations between the LICSIR, R2, and R2* werecompared to published regression analysis results basedon either biopsy-proven LIC (LICBIOPSY) [8, 9, 19–21] orLICSIR [14].
Statistical analyses
Data are described as number (%) or median (in-terquartile range, IQR). Results of observers were com-pared using a Friedman test and Wilcoxon Signed-Ranktest as post hoc. Success rates are defined as the numberof correctly acquired scans of at least ‘‘adequate’’ qualitydivided by the total number of measurements. Thesewere compared using a McNemar test. Correlations wereassessed with Spearman’s correlation coefficients (rS),interobserver agreement with two-way random, andabsolute intraclass correlation coefficients (ICCs). Bothwere graded according to Landis et al. [24]. Bland–Alt-man analysis was performed to compare accuracy be-tween the three MRI methods for a single observer andcompare the performance of the three observers [22]. In aseparate analysis, the calculated R2 and R2* values wereconverted to LICR2ð�Þ values in lmol/g using the for-
mulas provided by St. Pierre et al. and Garbowski et al.[8, 20] as these were established with image analysisprotocols similar to ours.
ROC-analyses were performed for LICSIR, R2, andserum values with significant correlation with R2* toestablish their diagnostic accuracy to identify increasedR2*, i.e., ‡44 Hz [9]. R2* was chosen as a reference valueas it had the best success rate and shortest acquisitiontime. The optimal cut-off value for R2 was found byoptimizing the Youden index, while for LICSIR we usedthe established cut-off value of >36 lmol/g. P values of<0.05 were accepted as statistically significant. Statisti-cal analyses were performed using SPSS Version 22 (IBMCorp, Armonk, NY), MedCalc Statistical Software ver-sion 16.2.0 (MedCalc Software bvba, Ostend, Belgium;https://www.medcalc.org; 2016), and GraphPad Prism5.0 (GraphPad Software, La Jolla, CA).
Results
Patients
Between January 1, 2008 and December 31, 2013, a totalof 114 patients (M/F: 74/40) underwent 144 MRI-scans
2126 J. H. Runge et al.: R2* preferred for MRI LIC measurement
for routine LIC measurement. Patient characteristics andclinical indications for LIC measurement are described inTable 2. Thirty patients had multiple measurements. Toprevent a repeated measurements effect on correlationassessment between LICSIR, R2, and R2*, only the 114baseline measurements were used. SIR, R2, and R2* datawere available for 108/114 (95%), 72/114 (63%), and 113/114 (99%) baseline measurements.
MRI success rates
Five SIR measurements were classified unsuccessful be-cause a surface coil was used, one due to erroneous TR/TE combinations. Furthermore, image quality wasinadequate (respiration artifacts) in a single patient (onlyR2 and R2* acquired). Hence, SIR was successful in 102/114 (89%), R2 in 71/114 (62%), and R2* in 112/114 (98%)subjects. The success rate of R2 was lower than that ofSIR and R2* (P < 0.0001, each). Missing datasets werepresumed to not have been scanned, with time con-straints and respiratory triggering problems as the majorcause of the low success rate of the R2 measurement. Forsubsequent analyses, only successful baseline measure-ments were used.
Interobserver agreement
LICSIR and R2 values differed between observer 1 andthe other observers (Table 3). However, these differences(median values: 80–85 lmol/g and 33–34 Hz for R2)would be negligible in clinical practice. This was con-firmed by high ICCs for SIR, R2, and R2* of 0.998,0.997, and 0.999, respectively. Bland–Altman analysisbetween pairs of observers showed a single outlier forSIR, while R2 and R2* showed differences up to 5% forhigher values, reflecting the uncertainties in the data fit atvery high LIC (Online Resource 1).
LICSIR, R2, and R2*
Median (IQR) LICSIR, R2, and R2* (given for observer 1and LICSIR <350 lmol/g) were 84 (30–205), 33 (23–48),
and 123 (56–321). LICSIR correlated positively with R2
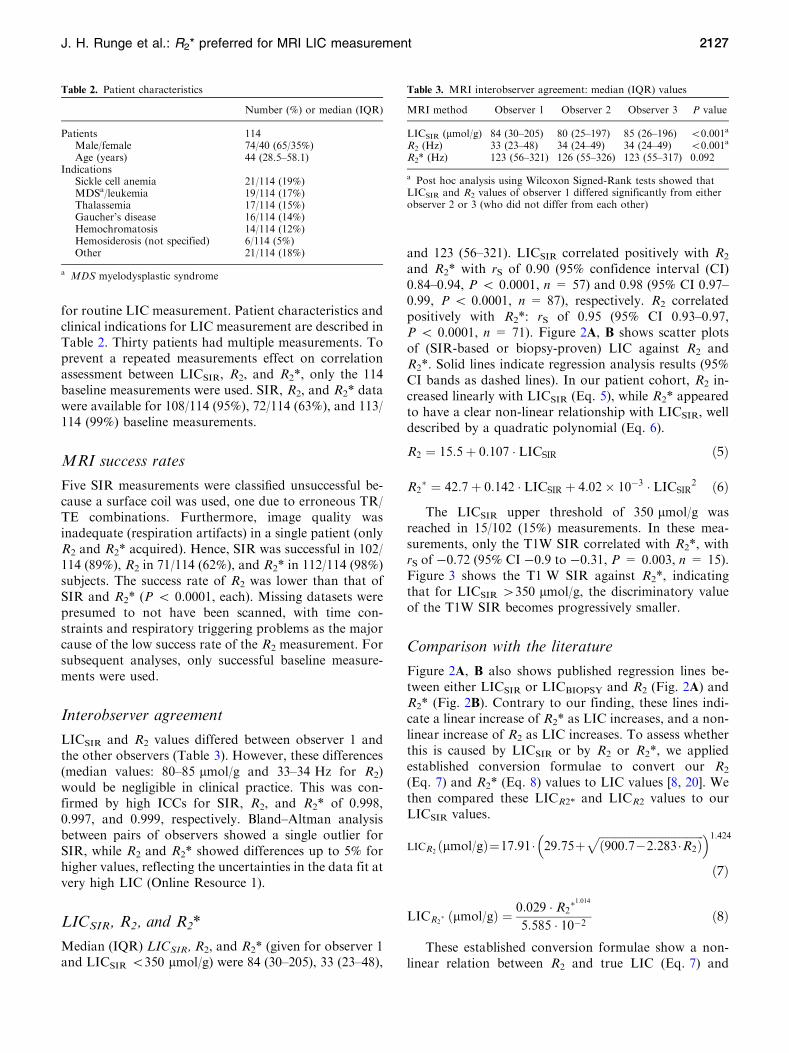
and R2* with rS of 0.90 (95% confidence interval (CI)0.84–0.94, P < 0.0001, n = 57) and 0.98 (95% CI 0.97–0.99, P < 0.0001, n = 87), respectively. R2 correlatedpositively with R2*: rS of 0.95 (95% CI 0.93–0.97,P < 0.0001, n = 71). Figure 2A, B shows scatter plotsof (SIR-based or biopsy-proven) LIC against R2 andR2*. Solid lines indicate regression analysis results (95%CI bands as dashed lines). In our patient cohort, R2 in-creased linearly with LICSIR (Eq. 5), while R2* appearedto have a clear non-linear relationship with LICSIR, welldescribed by a quadratic polynomial (Eq. 6).
R2 ¼ 15:5þ 0:107 � LICSIR ð5Þ
R2� ¼ 42:7þ 0:142 � LICSIR þ 4:02� 10�3 � LICSIR
2 ð6Þ
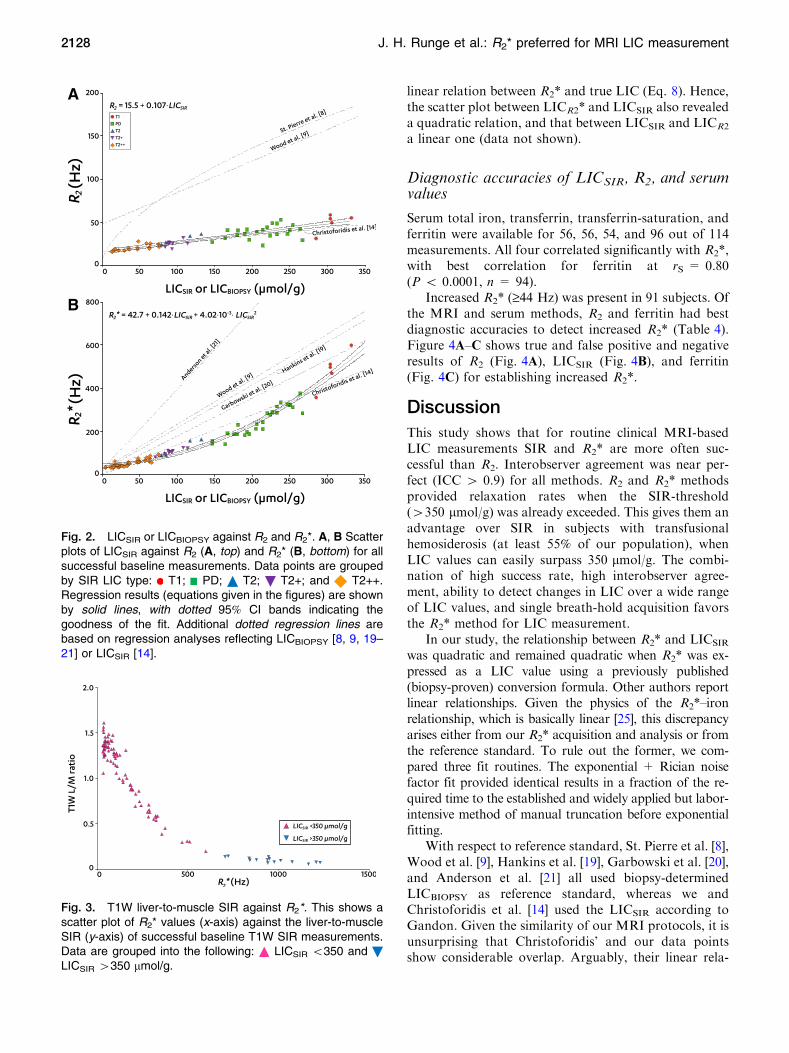
The LICSIR upper threshold of 350 lmol/g wasreached in 15/102 (15%) measurements. In these mea-surements, only the T1W SIR correlated with R2*, withrS of -0.72 (95% CI -0.9 to -0.31, P = 0.003, n = 15).Figure 3 shows the T1 W SIR against R2*, indicatingthat for LICSIR >350 lmol/g, the discriminatory valueof the T1W SIR becomes progressively smaller.
Comparison with the literature
Figure 2A, B also shows published regression lines be-tween either LICSIR or LICBIOPSY and R2 (Fig. 2A) andR2* (Fig. 2B). Contrary to our finding, these lines indi-cate a linear increase of R2* as LIC increases, and a non-linear increase of R2 as LIC increases. To assess whetherthis is caused by LICSIR or by R2 or R2*, we appliedestablished conversion formulae to convert our R2
(Eq. 7) and R2* (Eq. 8) values to LIC values [8, 20]. Wethen compared these LICR2* and LICR2 values to ourLICSIR values.
LICR2ðlmol/gÞ¼17:91� 29:75þ
ffiffiffiffiffiffiffiffiffiffiffiffiffiffiffiffiffiffiffiffiffiffiffiffiffiffiffiffiffiffiffiffiffiffiffiffiffiffi900:7�2:283�R2ð Þ
p� �1:424
ð7Þ
LICR2� ðlmol/gÞ ¼ 0:029 � R2
�1:014
5:585 � 10�2ð8Þ
These established conversion formulae show a non-linear relation between R2 and true LIC (Eq. 7) and
Table 2. Patient characteristics
Number (%) or median (IQR)
Patients 114Male/female 74/40 (65/35%)Age (years) 44 (28.5–58.1)
IndicationsSickle cell anemia 21/114 (19%)MDSa/leukemia 19/114 (17%)Thalassemia 17/114 (15%)Gaucher’s disease 16/114 (14%)Hemochromatosis 14/114 (12%)Hemosiderosis (not specified) 6/114 (5%)Other 21/114 (18%)
a MDS myelodysplastic syndrome
Table 3. MRI interobserver agreement: median (IQR) values
MRI method Observer 1 Observer 2 Observer 3 P value
LICSIR (lmol/g) 84 (30–205) 80 (25–197) 85 (26–196) <0.001a
R2 (Hz) 33 (23–48) 34 (24–49) 34 (24–49) <0.001a
R2* (Hz) 123 (56–321) 126 (55–326) 123 (55–317) 0.092
a Post hoc analysis using Wilcoxon Signed-Rank tests showed thatLICSIR and R2 values of observer 1 differed significantly from eitherobserver 2 or 3 (who did not differ from each other)
J. H. Runge et al.: R2* preferred for MRI LIC measurement 2127
linear relation between R2* and true LIC (Eq. 8). Hence,the scatter plot between LICR2* and LICSIR also revealeda quadratic relation, and that between LICSIR and LICR2
a linear one (data not shown).
Diagnostic accuracies of LICSIR, R2, and serumvalues
Serum total iron, transferrin, transferrin-saturation, andferritin were available for 56, 56, 54, and 96 out of 114measurements. All four correlated significantly with R2*,with best correlation for ferritin at rS = 0.80(P < 0.0001, n = 94).
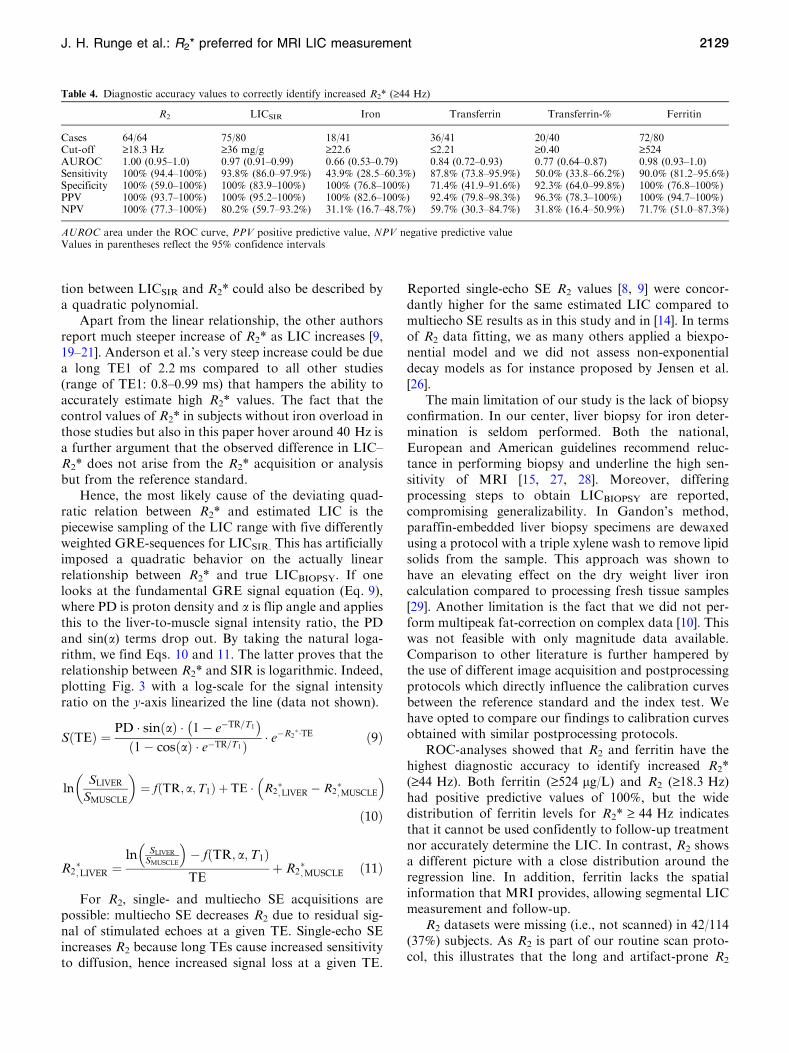
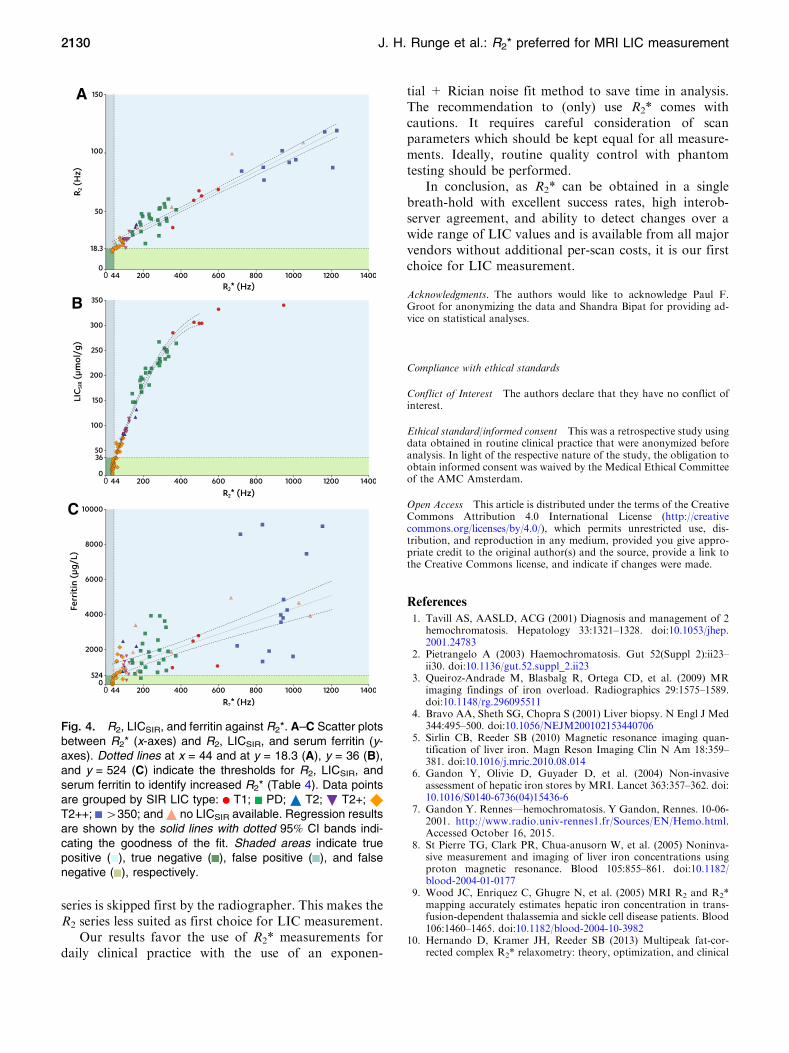
Increased R2* (‡44 Hz) was present in 91 subjects. Ofthe MRI and serum methods, R2 and ferritin had bestdiagnostic accuracies to detect increased R2* (Table 4).Figure 4A–C shows true and false positive and negativeresults of R2 (Fig. 4A), LICSIR (Fig. 4B), and ferritin(Fig. 4C) for establishing increased R2*.
Discussion
This study shows that for routine clinical MRI-basedLIC measurements SIR and R2* are more often suc-cessful than R2. Interobserver agreement was near per-fect (ICC > 0.9) for all methods. R2 and R2* methodsprovided relaxation rates when the SIR-threshold(>350 lmol/g) was already exceeded. This gives them anadvantage over SIR in subjects with transfusionalhemosiderosis (at least 55% of our population), whenLIC values can easily surpass 350 lmol/g. The combi-nation of high success rate, high interobserver agree-ment, ability to detect changes in LIC over a wide rangeof LIC values, and single breath-hold acquisition favorsthe R2* method for LIC measurement.
In our study, the relationship between R2* and LICSIR
was quadratic and remained quadratic when R2* was ex-pressed as a LIC value using a previously published(biopsy-proven) conversion formula. Other authors reportlinear relationships. Given the physics of the R2*–ironrelationship, which is basically linear [25], this discrepancyarises either from our R2* acquisition and analysis or fromthe reference standard. To rule out the former, we com-pared three fit routines. The exponential + Rician noisefactor fit provided identical results in a fraction of the re-quired time to the established and widely applied but labor-intensive method of manual truncation before exponentialfitting.
With respect to reference standard, St. Pierre et al. [8],Wood et al. [9], Hankins et al. [19], Garbowski et al. [20],and Anderson et al. [21] all used biopsy-determinedLICBIOPSY as reference standard, whereas we andChristoforidis et al. [14] used the LICSIR according toGandon. Given the similarity of our MRI protocols, it isunsurprising that Christoforidis’ and our data pointsshow considerable overlap. Arguably, their linear rela-
A
B
Fig. 2. LICSIR or LICBIOPSY against R2 and R2*. A, B Scatterplots of LICSIR against R2 (A, top) and R2* (B, bottom) for allsuccessful baseline measurements. Data points are groupedby SIR LIC type: T1; PD; T2; T2+; and T2++.Regression results (equations given in the figures) are shownby solid lines, with dotted 95% CI bands indicating thegoodness of the fit. Additional dotted regression lines arebased on regression analyses reflecting LICBIOPSY [8, 9, 19–21] or LICSIR [14].
Fig. 3. T1W liver-to-muscle SIR against R2*. This shows ascatter plot of R2* values (x-axis) against the liver-to-muscleSIR (y-axis) of successful baseline T1W SIR measurements.Data are grouped into the following: LICSIR <350 andLICSIR >350 lmol/g.
2128 J. H. Runge et al.: R2* preferred for MRI LIC measurement
tion between LICSIR and R2* could also be described bya quadratic polynomial.
Apart from the linear relationship, the other authorsreport much steeper increase of R2* as LIC increases [9,19–21]. Anderson et al.’s very steep increase could be duea long TE1 of 2.2 ms compared to all other studies(range of TE1: 0.8–0.99 ms) that hampers the ability toaccurately estimate high R2* values. The fact that thecontrol values of R2* in subjects without iron overload inthose studies but also in this paper hover around 40 Hz isa further argument that the observed difference in LIC–R2* does not arise from the R2* acquisition or analysisbut from the reference standard.
Hence, the most likely cause of the deviating quad-ratic relation between R2* and estimated LIC is thepiecewise sampling of the LIC range with five differentlyweighted GRE-sequences for LICSIR. This has artificiallyimposed a quadratic behavior on the actually linearrelationship between R2* and true LICBIOPSY. If onelooks at the fundamental GRE signal equation (Eq. 9),where PD is proton density and a is flip angle and appliesthis to the liver-to-muscle signal intensity ratio, the PDand sin(a) terms drop out. By taking the natural loga-rithm, we find Eqs. 10 and 11. The latter proves that therelationship between R2* and SIR is logarithmic. Indeed,plotting Fig. 3 with a log-scale for the signal intensityratio on the y-axis linearized the line (data not shown).
S TEð Þ ¼PD � sin að Þ � 1� e�TR=T1
� �
1� cos að Þ � e�TR=T1ð Þ � e�R2��TE ð9Þ
lnSLIVER
SMUSCLE
� �¼ f TR; a;T1ð Þ þ TE � R2
�;LIVER � R2
�;MUSCLE
� �
ð10Þ
R2�;LIVER ¼
ln SLIVER
SMUSCLE
� �� f TR; a;T1ð ÞTE
þ R2�;MUSCLE ð11Þ
For R2, single- and multiecho SE acquisitions arepossible: multiecho SE decreases R2 due to residual sig-nal of stimulated echoes at a given TE. Single-echo SEincreases R2 because long TEs cause increased sensitivityto diffusion, hence increased signal loss at a given TE.
Reported single-echo SE R2 values [8, 9] were concor-dantly higher for the same estimated LIC compared tomultiecho SE results as in this study and in [14]. In termsof R2 data fitting, we as many others applied a biexpo-nential model and we did not assess non-exponentialdecay models as for instance proposed by Jensen et al.[26].
The main limitation of our study is the lack of biopsyconfirmation. In our center, liver biopsy for iron deter-mination is seldom performed. Both the national,European and American guidelines recommend reluc-tance in performing biopsy and underline the high sen-sitivity of MRI [15, 27, 28]. Moreover, differingprocessing steps to obtain LICBIOPSY are reported,compromising generalizability. In Gandon’s method,paraffin-embedded liver biopsy specimens are dewaxedusing a protocol with a triple xylene wash to remove lipidsolids from the sample. This approach was shown tohave an elevating effect on the dry weight liver ironcalculation compared to processing fresh tissue samples[29]. Another limitation is the fact that we did not per-form multipeak fat-correction on complex data [10]. Thiswas not feasible with only magnitude data available.Comparison to other literature is further hampered bythe use of different image acquisition and postprocessingprotocols which directly influence the calibration curvesbetween the reference standard and the index test. Wehave opted to compare our findings to calibration curvesobtained with similar postprocessing protocols.
ROC-analyses showed that R2 and ferritin have thehighest diagnostic accuracy to identify increased R2*(‡44 Hz). Both ferritin (‡524 lg/L) and R2 (‡18.3 Hz)had positive predictive values of 100%, but the widedistribution of ferritin levels for R2* ‡ 44 Hz indicatesthat it cannot be used confidently to follow-up treatmentnor accurately determine the LIC. In contrast, R2 showsa different picture with a close distribution around theregression line. In addition, ferritin lacks the spatialinformation that MRI provides, allowing segmental LICmeasurement and follow-up.
R2 datasets were missing (i.e., not scanned) in 42/114(37%) subjects. As R2 is part of our routine scan proto-col, this illustrates that the long and artifact-prone R2
Table 4. Diagnostic accuracy values to correctly identify increased R2* (‡44 Hz)
R2 LICSIR Iron Transferrin Transferrin-% Ferritin
Cases 64/64 75/80 18/41 36/41 20/40 72/80Cut-off ‡18.3 Hz ‡36 mg/g ‡22.6 £2.21 ‡0.40 ‡524AUROC 1.00 (0.95–1.0) 0.97 (0.91–0.99) 0.66 (0.53–0.79) 0.84 (0.72–0.93) 0.77 (0.64–0.87) 0.98 (0.93–1.0)Sensitivity 100% (94.4–100%) 93.8% (86.0–97.9%) 43.9% (28.5–60.3%) 87.8% (73.8–95.9%) 50.0% (33.8–66.2%) 90.0% (81.2–95.6%)Specificity 100% (59.0–100%) 100% (83.9–100%) 100% (76.8–100%) 71.4% (41.9–91.6%) 92.3% (64.0–99.8%) 100% (76.8–100%)PPV 100% (93.7–100%) 100% (95.2–100%) 100% (82.6–100%) 92.4% (79.8–98.3%) 96.3% (78.3–100%) 100% (94.7–100%)NPV 100% (77.3–100%) 80.2% (59.7–93.2%) 31.1% (16.7–48.7%) 59.7% (30.3–84.7%) 31.8% (16.4–50.9%) 71.7% (51.0–87.3%)
AUROC area under the ROC curve, PPV positive predictive value, NPV negative predictive valueValues in parentheses reflect the 95% confidence intervals
J. H. Runge et al.: R2* preferred for MRI LIC measurement 2129
series is skipped first by the radiographer. This makes theR2 series less suited as first choice for LIC measurement.
Our results favor the use of R2* measurements fordaily clinical practice with the use of an exponen-
tial + Rician noise fit method to save time in analysis.The recommendation to (only) use R2* comes withcautions. It requires careful consideration of scanparameters which should be kept equal for all measure-ments. Ideally, routine quality control with phantomtesting should be performed.
In conclusion, as R2* can be obtained in a singlebreath-hold with excellent success rates, high interob-server agreement, and ability to detect changes over awide range of LIC values and is available from all majorvendors without additional per-scan costs, it is our firstchoice for LIC measurement.
Acknowledgments. The authors would like to acknowledge Paul F.Groot for anonymizing the data and Shandra Bipat for providing ad-vice on statistical analyses.
Compliance with ethical standards
Conflict of Interest The authors declare that they have no conflict ofinterest.
Ethical standard/informed consent This was a retrospective study usingdata obtained in routine clinical practice that were anonymized beforeanalysis. In light of the respective nature of the study, the obligation toobtain informed consent was waived by the Medical Ethical Committeeof the AMC Amsterdam.
Open Access This article is distributed under the terms of the CreativeCommons Attribution 4.0 International License (http://creativecommons.org/licenses/by/4.0/), which permits unrestricted use, dis-tribution, and reproduction in any medium, provided you give appro-priate credit to the original author(s) and the source, provide a link tothe Creative Commons license, and indicate if changes were made.
References
1. Tavill AS, AASLD, ACG (2001) Diagnosis and management of 2hemochromatosis. Hepatology 33:1321–1328. doi:10.1053/jhep.2001.24783
2. Pietrangelo A (2003) Haemochromatosis. Gut 52(Suppl 2):ii23–ii30. doi:10.1136/gut.52.suppl_2.ii23
3. Queiroz-Andrade M, Blasbalg R, Ortega CD, et al. (2009) MRimaging findings of iron overload. Radiographics 29:1575–1589.doi:10.1148/rg.296095511
4. Bravo AA, Sheth SG, Chopra S (2001) Liver biopsy. N Engl J Med344:495–500. doi:10.1056/NEJM200102153440706
5. Sirlin CB, Reeder SB (2010) Magnetic resonance imaging quan-tification of liver iron. Magn Reson Imaging Clin N Am 18:359–381. doi:10.1016/j.mric.2010.08.014
6. Gandon Y, Olivie D, Guyader D, et al. (2004) Non-invasiveassessment of hepatic iron stores by MRI. Lancet 363:357–362. doi:10.1016/S0140-6736(04)15436-6
7. Gandon Y. Rennes—hemochromatosis. Y Gandon, Rennes. 10-06-2001. http://www.radio.univ-rennes1.fr/Sources/EN/Hemo.html.Accessed October 16, 2015.
8. St Pierre TG, Clark PR, Chua-anusorn W, et al. (2005) Noninva-sive measurement and imaging of liver iron concentrations usingproton magnetic resonance. Blood 105:855–861. doi:10.1182/blood-2004-01-0177
9. Wood JC, Enriquez C, Ghugre N, et al. (2005) MRI R2 and R2*mapping accurately estimates hepatic iron concentration in trans-fusion-dependent thalassemia and sickle cell disease patients. Blood106:1460–1465. doi:10.1182/blood-2004-10-3982
10. Hernando D, Kramer JH, Reeder SB (2013) Multipeak fat-cor-rected complex R2* relaxometry: theory, optimization, and clinical
A
B
C
Fig. 4. R2, LICSIR, and ferritin against R2*. A–C Scatter plotsbetween R2* (x-axes) and R2, LICSIR, and serum ferritin (y-axes). Dotted lines at x = 44 and at y = 18.3 (A), y = 36 (B),and y = 524 (C) indicate the thresholds for R2, LICSIR, andserum ferritin to identify increased R2* (Table 4). Data pointsare grouped by SIR LIC type: T1; PD; T2; T2+;T2++; >350; and no LICSIR available. Regression resultsare shown by the solid lines with dotted 95% CI bands indi-cating the goodness of the fit. Shaded areas indicate truepositive ( ), true negative ( ), false positive ( ), and falsenegative ( ), respectively.
2130 J. H. Runge et al.: R2* preferred for MRI LIC measurement
validation. Magn Reson Med 70:1319–1331. doi:10.1002/mrm.24593
11. Krafft AJ, Loeffler RB, Song R, et al. (2015) Does fat suppressionvia chemically selective saturation affect R2*-MRI for transfusionaliron overload assessment? A clinical evaluation at 1.5T and 3T.Magn Reson Med. doi:10.1002/mrm.25868
12. Yokoo T, Yuan Q, Senegas J, Wiethoff AJ, Pedrosa I (2015)Quantitative R2* MRI of the liver with rician noise models forevaluation of hepatic iron overload: Simulation, phantom, andearly clinical experience. J Magn Reson Imaging 42:1544–1559. doi:10.1002/jmri.24948
13. Ibrahim EH, Khalifa AM, Eldaly AK (2016) MRI T2* imaging forassessment of liver iron overload: study of different data analysisapproaches. Acta Radiol. doi:10.1177/0284185116628337
14. Christoforidis A, Perifanis V, Spanos G, et al. (2009) MRI assess-ment of liver iron content in thalassamic patients with three dif-ferent protocols: comparisons and correlations. Eur J Haematol82:388–392. doi:10.1111/j.1600-0609.2009.01223.x
15. Swinkels DW, van Bokhoven MA, Castel A, et al. (2007) RichtlijnDiagnostiek en behandeling van hereditaire hemochromatose.Utrecht: Nederlandse Internisten Vereeniging en NederlandseVereniging voor Klinische Chemie
16. Meloni A, Luciani A, Positano V, et al. (2011) Single region ofinterest versus multislice T2* MRI approach for the quantificationof hepatic iron overload. J Magn Reson Imaging 33(2):348–355.doi:10.1002/jmri.22417
17. Gandon Y. Gandon calculations. Y Gandon, Rennes. 10-06-2001.http://www.radio.univ-rennes1.fr/Images/Externe15.js. AccessedOctober 16, 2015
18. Gudbjartsson H, Patz S (1995) The Rician distribution of noisyMRI data. Magn Reson Med 34:910–914
19. Hankins JS, McCarville MB, Loeffler RB, et al. (2009) R2* mag-netic resonance imaging of the liver in patients with iron overload.Blood 113:4853–4855. doi:10.1182/blood-2008-12-191643
20. Garbowski MW, Carpenter JP, Smith G, et al. (2014) Biopsy-basedcalibration of T2* magnetic resonance for estimation of liver ironconcentration and comparison with R2 Ferriscan. J CardiovascMagn Reson. doi:10.1186/1532-429X-16-40
21. AndersonLJ,Holden S,Davis B, et al. (2001) Cardiovascular T2-star(T2*) magnetic resonance for the early diagnosis of myocardial ironoverload. Eur Heart J 22:2171–2179. doi:10.1053/euhj.2001.2822
22. Bland JM, Altman DG (1986) Statistical methods for assessingagreement between two methods of clinical measurement. Lancet1:307–310. doi:10.1016/S0140-6736(86)90837-8
23. Akkerman EM, Runge JH, Troelstra MA, Nederveen AJ, Stoker J(2015) Non-linear relationship between estimated liver iron con-centration and R2*. ISMRM 3268
24. Landis JR, Koch GG (1977) The measurement of observer agree-ment for categorical data. Biometrics 33:159–174
25. Ghugre NR, Wood JC (2011) Relaxivity-iron calibration in hepaticiron overload: probing underlying biophysical mechanisms using aMonte Carlo model. Magn Reson Med 65:837–847. doi:10.1002/mrm.22657
26. Jensen JH, Chandra R (2002) Theory of nonexponential NMRsignal decay in liver with iron overload or superparamagnetic ironoxide particles. Magn Reson Med 47:1131–1138. doi:10.1002/mrm.10170
27. European Association for the Study of the Liver (2010) EASLclinical practice guidelines for HFE hemochromatosis. J Hepatol53:3–22. doi:10.1016/j.jhep.2010.03.001
28. Bacon BR, Adams PC, Kowdley KV, Powell LW, Tavill AS (2011)Diagnosis and management of hemochromatosis: 2011 practiceguideline by the American Association for the Study of liver dis-eases. Hepatology 54:328–343. doi:10.1002/hep.24330
29. Butensky E, Fischer R, Hudes M, et al. (2005) Variability in hepaticiron concentration in percutaneous needle biopsy specimens frompatients with transfusional hemosiderosis. Am J Clin Pathol123:146–152. doi:10.1309/PUUXEGXDLH26NXA2
J. H. Runge et al.: R2* preferred for MRI LIC measurement 2131