Embed Size (px)
Citation preview

Bulletin of the Seismological Society of America. Vol, 63, No. 4, pp. 1227-1253. August 1973
COMPARISON OF EARTHQUAKE AND MICROTREMOR GROUND MOTIONS IN EL CENTRO, CALIFORNIA
BY F. E. UDWADIA AND M. D. TRIFUNAC
ABSTRACT
Strong earthquake ground shaking has been investigated by the study of 15 events recorded in El Centro, California. The strong-motion records analyzed show that no simple features (e.g., local site conditions) govern the details of local ground shaking. Any effects of local subsoil conditions at this site appear to be over- shadowed by the source mechanism and the transmission path, there being no distinctly identifiable site periodicities.
Microtremor measurements have been taken in the area surrounding the strong- motion site. The objective was an investigation of possible correlations with strong ground motions and the analysis of site-response characteristics. Basic difficulties in ascertaining local site conditions through such low-amplitude ground motions are illustrated. It has been found that in this area microtremor and earthquake processes are widely different in character, there being little to no correlation be- tween the ground's response to earthquakes and to microtremor excitations. Microtremors have been found to be nonstationary over periods of about a day or so, introducing further uncertainties into inferences from such measurements.
INTRODUCTION
A proper understanding of the nature of structural damage caused by large earthquakes is essential in improving the criteria for the aseismic design of structures. Studies of the distribution of damage caused by earthquakes indicate that large differences in the extent of damage often occur over relatively short distances. In fact, as observed from some recent earthquakes (e.g., Jennings, 1971 ; Sozen eta[., 1968), the areas of intense damage can be highly localized, the amount of damage drastically changing over distances as short as ½ to 1 kin. Some of these large variations in structural damage can be attributed to local foundation problems, especially when the soil is "soft" (e.g., Lee and Monge, 1966; Waseda University publication, 1966). However, even in the absence of such foundation problems, the intensity of ground shaking has been observed to be widely varying over short distances (Jennings, 1971; Hudson, 1972; Gutenberg, 1957). This rather spotty distribution of the intensity of ground shaking has led some investigators to believe that it is the local subsoil conditions that are of primary importance in the assessment of damage to structures (e.g., Duke, 1958; Kanai, 1957; Kanai and Tanaka, 1961; Kanai et al., 1953; Idriss and Seed, 1967). Although the concept of site amplifica- tion may be important in the study of structural damage under certain special conditions, its general applicability as the prime criterion for the design of structures in seismic zones has not been established.
Damage to engineering structures caused by earthquakes is known to depend on the nature of the arriving seismic energy as well as on the characteristics of structures. For the purposes of engineering design, the characteristics of ground shaking that are of primary importance are the amplitude, the frequency content, and the duration of ground shaking. These characteristics are dependent on various elements such as the earthquake source mechanism (Brune, 1970; Aki, 1957; Trifunac, 1972), the orientation of the site
1227

1228 F. E. U D W A D I A AND M. D. T R I F U N A C
with respect to the source (Suzuki, 1932; Udwadia, 1972), the material properties of the earth media along which the waves propagate, the nature and orientation of various geological discontinuities (Haskell, 1962; Aki and Larner, 1970; Gupta, 1966; Sato, 1963; Hudson, 1962; Abubakar, 1962; Tsai, 1969; Trifunac, 1971b) and the local topographic conditions (Boore, 1972; Trifunac, 1973). The complex nature of earthquake source mechanisms and the irregular nature of surface layers make it difficult to deter- mine their actual influence on local ground shaking.
Due to the relatively small number of significant measurements of strong ground shaking caused by close-in earthquakes, little is known about many of the factors which affect ground motion at a site. The factor which has been most thoroughly studied is the local subsoil effect.
The large amount of interest in the study of the effects of local subsoil conditions has been principally due to two factors:
(a) Local subsoil conditions can be obtained fairly simply with a reasonable degree of accuracy through seismic prospecting, boreholes, trenching, etc. ; and
(b) Simple modeling of soil conditions by parallel isotropic homogeneous layers is easily amenable to theoretical study (Kanai, 1962; Herrera and Rosenblueth, 1965; Tsai, 1969; Sakurai and Takahashi, 1971).
Sites with conditions that closely resemble a model composed of horizontal layers having strong velocity contrasts have been investigated (Tsai, 1969), and some of the ground motions observed there have been satisfactorily interpreted through the concept of site amplification caused by vertically incident S waves. However, such simple models have at least two defects, namely, that in actuality it is unusual to have a parallel layering of homogeneous isotropic material, and that the study of ground motions generated by nearby earthquakes often necessitates the use of angles of incidence other than normal. In addition, waves other th~n body waves may play a dominant role in strong ground- motion studies (Udwadia, 1972; Trifunac, 1969, 1971a; Hudson, 1962).
Many investigators have studied the influence of local site conditions on the modifica- tion of seismic energy. Gutenberg (1957) investigated small distant earthquakes with sensitive seismometers located on various thicknesses of alluvium and on bed rock. He concluded that large variations in ground shaking could occur under various site con- ditions. His data, however, indicated a wide variation in the response at a given site caused by different earthquakes, suggesting that other variables should be considered in addition to local site conditions (Hudson, 1972). Byerly (1947) examined data from a network of stations at different locations in California which had recorded small earth- quakes. These low-amplitude motions did not indicate the presence of any local site periodicities. Similar work done by Wiggins (1964) indicates the lack of strongly prevalent "site periods".
The abundance of investigations dealing with the simple layered model has perhaps led some engineers to believe that subsoil conditions are, in general, of primary impor- tance in the determination of the nature of ground shaking. If this is taken for granted, a simple method of determining these local site characteristics would appear to be a matter of considerable practical importance. It has often been suggested that the local site periods could be obtained economically and simply through the use of low-amplitude ground motions called microtremors (Sakurai and Takahashi, 1971; Kanai, 1962). A good deal of research effort has been devoted to their study in the hope that they might reveal °'predominant site periods," thereby eliminating the need for seismic prospecting or more elaborate and time-consuming methods of exploration.
This paper attempts to investigate quantitatively the extent to which a particular local site condition correlates with ground shaking in a region where repeated measurements

COMPARISON OF EARTHQUAKE AND MICROTREMOR GROUND MOTIONS 1229
of strong ground shaking have been made. Fifteen strong-motion accelerograms, all recorded at the E1 Centro strong-motion accelerograph site in Southern California, have been studied. It has been demonstrated that no local site periodicities are identifiable, suggesting that factors such as source and transmission path effects overshadow the influence of local site conditions. The use of microtremor ground motions as indicative of the nature of strong ground shaking has also been considered. The investigations indicate that at this site microtremor processes are fundamentally different from earth- quake processes. These low-amplitude ground motions measured at five different locations near the strong-motion site indicate that they are most probably forced oscilla- tions of the ground caused by close-in excitations.
ANALYSIS OF EARTHQUAKE ACCELEROGRAMS AT EL CENTRO
The 15 strong-motion records recorded at the E1 Centro strong-motion accelero- graph site make this station unique for the study of strong earthquake ground motions. These records come from earthquakes whose assigned local magnitudes M L range from 3 to 6.8, most of them being close-in to the recording station. These epicenters surround the strong-motion site and are mainly located on or near the major faults in the area as shown in Figure 1. Table 1 indicates the locations of these earthquakes and the
TAB LE I
Event Group Code U . S . C . G . S, Locat ion C . I . T . Locat ion
No, No, No, T i m e Lat i tude Longi tude Lat i tude Longi tude M L A-kin*
1 Ill 34.2 Dec.30,1934 32°12'N I15°30'W 32°15'N i15°30'W 6.5 60
Z I 38.1 Apr. 12,1938 32°53'N 115°35 'W 32°53'N 115°35 'W 3.0 16
3 -- 38.3 June 5,1938 32°15'N II5°I0'W 32°54'N I15°13'W 5.0 35
4 III 38.4 June 6,1938 32'15' N I15°]0'W 3Z°IS'N 115'i0'W 4.0 71
5 Ill 40.1 May 18,1940 32°44'N I15°27'W 32°46'N I15°29'W 6.5 15
6 II 42.1 Oct. 21,1942 32°58'N I16°60'W 3Z°58'N I16°60'W 6.5 44
7 II 51.2 Jan, 23,1951 33°07'N 115°34'W 32°59'N I15°44'W 5.6 Z5
8 II 53.1 Jan. 14,1953 32°50'N I15°40'W 32*57'N I15°43'W 5.5 19
9 IV 54.5 Nov. 12,1954 31°30'N I16"00'W 31°30'N I16°00'W 6.3 148
10 I 55.3 Dec. 16,1955 33°00'N I15°30'W 33°00'N I15'30'W 4.3 Z7
ii I 55.4 Dec. 16,1955 33°00'N I15°30'W 33°00'N I15°30'W 3.9 27
12 I 55.5 Dec. 16,1955 33000'N I15°30'W 33°00'N i15°30'W 5.5 27
13 IV 56.1 Feb. 9,1956 31°45'N I15°55'W 31°45'N I15°55'W 6.8 i19
14 IV 56.2 Feb. 9,1956 31°45'N I15°55'W 31"45'N I15°55'W 6.1 119
15 III 66.9 Aug. 7,1966 31°48'N I16°30'W 31°48'N i14°30'W 6.3 150
16 II 68.5 Apr. 8,1968 33°IZ'N I16006!9'W 31°58'N i16°49'W 6.4 7Z
~:~Distanee f r o m El Centro .
assigned magnitudes. The code numbers in the table indicate the year in which the event occurred and the number of the event as catalogued by the Caltech Library. The event numbers correspond to those indicated in Figure 1. The epicentral locations obtained independently by the seismological laboratory at Caltech (Quarterly Bulletin of Local Shocks, Nordquist, 1964) and by the USCGS (United States Earthquakes, 1936-68) have been included. As seen from the table, most of the locations are in excellent agree- ment. These epicentral locations for most of the events can be assumed to be correct to

1230 F. E. UDWADIA AND M. D. TRIFUNAC
116" 115° 114°
~ 3 ° 0 0
n ~ G o r g o n i o P a s s
~ ~St°~%eWe/I MAP OF EL CENTRO AREA " ".~I~ "\X.~'~Thbusand Palms, Pro f i l e
, ~ o , ~ s~~o k.\~. "'~ " " . . . \ : : t '~ ~ d ~ \ ~ , ~ - , . . . . o 5.o i~o Kms ~ . • ~ 2 . ~ \ ~ . ~ - ~ ' , ~ "~::C;~, \ ~ l l ( ~ ' . . 0 5 0 Miles "~1 "..:~:!,.~,, "~ TM • I I ~ . ' . . . ' -
. : : M ~ c c a % . . ~ "~b~:-,...:. I %~ ~ L.!~'~ ~ k.%. ~;:... I
. + I t . t ' ~ ' ~ . . : : I o " G N ond 0~ .... : i 6 ! • ~:. . . / "<:. . ~ ~ '~..... ::... ....
1o " ...:-.7~
•' ,.. .~ ,~
. . . : .%,,- . - ,,~.. " ' 5 . - " ' ~ ( . "
I ~ ~ i . . : : ~ , . ~ \ 1 4,t;.':-~A ~"¢~ :. / I ~ : ~ : ~ \ I ~: .,~'/~"j:. ~ " ~:'; ." • ,..:..~. - < ~ "
_ . ~ °0-_% ~.",~
%% ~)!!~ ~',~!~.~i:":'-:~ ~.'.';:m~'.'.
N I " ~ ~ " ~ ' ~ J ~ ~ ' " ' ~ " ' " :':~ ~'' ' ' ' ' : ' ~ J
" . ' 5 " - " - : : . . ,'DI • . " : ~ . : ' . i '
~°-;"~ " :i.:<. \.oo .o,,oo \ .--;k I . . . . . . . . . . .
3 3 0 0 0 ,
32000 ,
1 1 6 ° 1 1 5 ° I 1 . ~ ~
FIG. 1. Map of E1 Centre area showing the major faults (heavy lines) and the epicenters (circles) of the events listed in Table 1.
within 2 to 5 km (Nordquist, 1964). A further advantage in the choice of this site for a comparative study of recorded accelerograms is that the area has been reasonably well studied so that the geological conditions are relatively well known (Biehler,. 1964).
Geological setting of the El Centre accelerograph site. The Imperial Valley extends to the south of the Salton Sea (Figure 1) and is bounded by the Chocolate and Cargo Muchacho Mountains on the northeast, and by the peninsular ranges on the southwest. Within the valley, along the southwest margin are several fault-controlled hills of crystal- line rock. The southeastern extent of the valley is poorly defined by mountains gradually decreasing in relief.
The valley is occupied by the sedimentary delta of the Colorado River fillin~ a basin
COMPARISON OF EARTHQUAKE AND MICROTREMOR GROUND MOTIONS 1231
about 6 km deep (Figures 1 and 2A-B). The sands, gravels, silts and clays of the delta appear to be deposited primarily over the past four million years and in large parts consist of sediments eroded out of the Colorado Plateau at the time of the cutting of the Grand Canyon and the uplift of the Kaibab Plateau (Biehler, 1964).
As studied by Crowell (1962), the predominant displacement along the faults cutting through the Imperial Valley is right lateral strike slip. The high-velocity layer, having P-wave velocities in excess of 6.4 km/sec (Figure 2A-B), is interpreted as a basement complex composed of intrusive and metamorphic rocks (Biehler, 1964). The intermediate velocity layers (shear-wave velocities between 2 and 4 km/sec) are probably Tertiary sediments having increasing velocity with increasing depth. The lower-velocity layers are recent and have been classified as Pleistocene sediments (Biehler, 1964).
Grouping ofaecelerograms. In order to study the dependence of ground motion on the azimuth of the epicenter with respect to the recording station, the different events were
SECTION A-B N 35 ° W
Son Gorgonio Poss --Weslmorelond Profile Gulf Station #-I--]
F E I Cenlro
[ ] ~ lr-lnternotionol Border [ ] 0 - - - - w a t e r - . ~
O- ~ L 8 ~ _ _ _ 1 - 12 o-L.._L .1, 1.9 I lll: i /2 .o
3- _-
0 I0 20:30 40 50 M i l e s
SECTION C-D
EAST
i Superstition Mtns ~- Corgo-Muchacho Mtns El Centro
T/--- Section A-B [ ] [ ]
0 T O ~ 1.7 I.I ...:
I , . ,
3-.,o,ooo , - ,3.7 , 5.54':.t!:-"::: :-:-..
• 1 5 , 0 0 0 4 . 7 . ~'::;.i?; ::'" 5-
Ip z,o 30 K,.~ 6- 2o,ooo ~ Ib ,~ 2b ~//~
FIG. 2. Local subsoil conditions along sections AB and CD indicated in Figure 1. The numbers indicate the P-wave velocities in kilometers per second.

1232 F. E. UDWADIA AND M. D. TRIFUNAC
ACCELERATION PLOT OF GROUP I, SOUTH COMPONENT
. s
55.5 S
Z
U, 55.4 S
0 4 .5 S
I I I I b ; I ; 15 20 25 30 315 4 ;
TIME IN SEC.
ACCELERATION PLOT OF GROUP T,WEST COMPONENT
38.1W
0 55.3 W
z
55.4 W
i f ~ 55.5 W
. . . . 2'5 ' :5" 5 I0 15 20 30 5 TIME IN SEC.
4'0 415 '50
ACCELERATION PLOT OF GROUP I, VERTICAL COMPONENT
2.5 L
°iE ~D 55.5 V o~ Z
~ 554 v
55.5 V I I I I
; Lb ,; 2b z5 30 35 40 TIME IN SEC.
FIG, 3. Acceleration time traces of events recorded at El Centro belonging to group I (events 2, 10, 11 and 12).

COMPARISON OF EARTHQUAKE AND MICROTREMOR GROUND MOTIONS
ACCELERATION PLOT OF GROUP ]]:, SOUTH COMPONENT
42.1 S
1233
~:) 51.2 S o~ z
53.1 S
IO
Z
if
; ; ,b ,; 2o 2; 3'0 3; go T IME IN SEC.
ACCELERATION PLOT OF GROUP Tr, WEST COMPONENT
42.1 W
51,2 W
55,1 W
68,5 W
; ; ,; ,'5 2'o: 2'5 3'0 3'5 4'0 TIME IN SEC.
ACCELERATION PLOT OF GROUP ]]:, VERTICAL COMPONENT
• 42.1 V
Ix.
0 51.2V o~ z
53,1V
iE 68.5 V
~, ,b i'~ 2'0 2'5 3'o 3'5 4'0 TIME IN SEC.
FIG. 4. Acceleration time traces of events recorded at El Centro belonging to group II (events 6, 7, 8 and 16).
1234 F, E. UDWADIA AND M. D, TRIFUNAC
ACCELERATION PLOT OF GROUP TIT, SOUTH COMPONENT
15L 54.2 S
t.t_ 0 38.5 S
Z
C) 3 40.1 S
I. 66,9 S
TIME JN SEC.
ACCELERATION PLOT OF GROUP 1Tr, WEST COMPONENT
2 34.2 W
tl_ o I. 38.4 W o~ z
~2 40.1 W
66.9 W
TIME IN SEC.
ACCELERATION PLOT OF GROUP fit VERTICAL COMPONENT
34.2 V
co o.sr
0.6 L 38.4 V
Z
2 40. IV
o •
O. 66.9 V
~ Jb /s :~o z'~ 3b 3's 4'o TIME IN SEC.
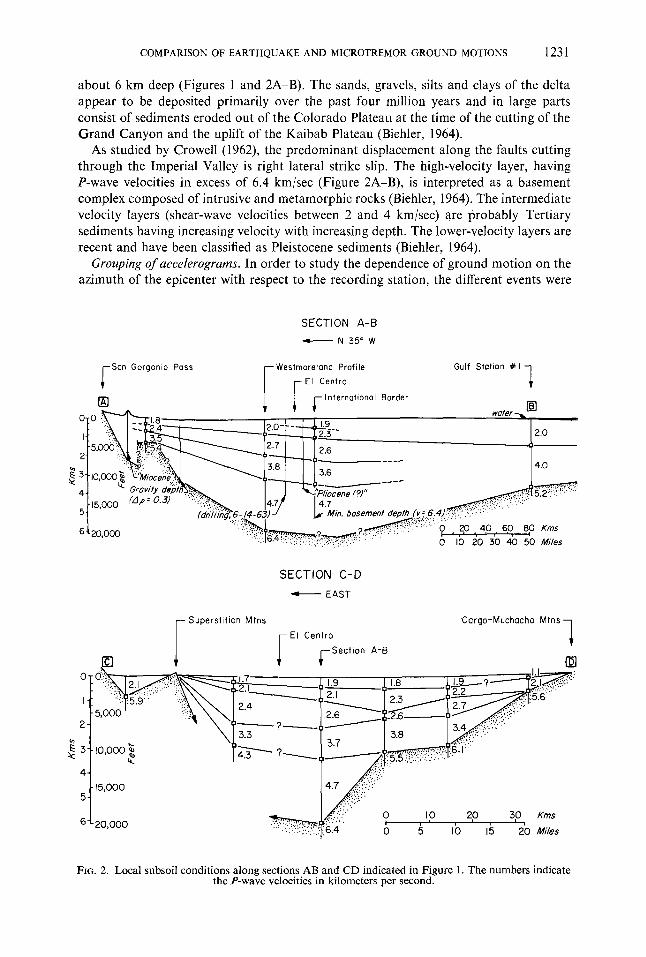
F i e . 5. A c c e l e r a t i o n t i m e t races of events r e c o r d e d a t E1 C e n t r o b e l o n g i n g to g r o u p I I I (even ts 1, 4, 5 a n d 15).

COMPARISON OF EARTHQUAKE AND MICROTREMOR G R O U N D MOTIONS 1235
ACCELERATION PLOT OF GROUP IV, SOUTH COMPONENT
54.5 S
o ~ 4
_.] 56.1S 0 (D
; ~ ,'o ,'~ 2'0 z'5 3'o 3'5 4'0 TIME. IN SEC.
ACCELERATION PLOT OF GROUP 1V WEST COMPONENT 3
LL 0 5
_z
,<
0'~.1 W
Dt~.~ w
; ~ ,; ,'5 20 2; 3; 55 20 TIME IN SEC.
A C C E L E R A T I O N PLOT OF GROUP ] 'V V E R T I C A L C O M P O N E N T
54.5 V
56.1V
O. 56.2 V
0 5 I 0 15 20 2'5 3'0 3'5 4'0
TIME IN SEC.
FIG. 6. Acceleration time traces of events recorded at El Centro belonging to group 1V (events 9, 13 and 14).
divided into four distinct groups, each group containing events that have about the same epicentral azimuths with respect to the recording site (Table 1). Group ! consists of events that have azimuths roughly between N00°E and N45°E, group I[ of events between N30°W and N45°W, group II[ of events between S00°E and $45°E and group IV of events between S00°W and S30°W (Figure 1). The first two groups which constitute
1236 F. E. UDWADIA AND M. D. TRIFUNAC
im
earthquakes with epicenters north of E1 Centro have, in general, shorter epicentral distances than those on the south of the recording site.
A study of each group will be taken up individually and the different groups will then be compared with each other.
Processing of accelerograms. The earthquake records were obtained in the form of "corrected accelerograms" (Hudson et al., 1971) from the Caltech earthquake library, and are shown in Figures 3 to 6. The method used for processing these accelerograms has been dealt with in detail by Udwadia (1972).
The nature of the ground motion at a recording station may vary widely from event to FOURIER RI'PLITU0E SPECTRUM OF RCCELEP~TION
Slem~o s~ . c~ or r, muP I mCg.EMGR~S,S0Um comment mr~ v~s E~ ixsrmmJ~r ~C l~JO
EVENT 55.5 ME • 5.4
EVENT 38.1 M E •
~," 16
M L • 4,3 ~.- 27
EVENT 55.4 ~ ~ M L " 3.9
F~QLIB~f - CPS X Ior'l
sO0
elO
io i"
FOURIER RMPLITUOE SPECTRUtt OF RCEELERRTION ~ 1 ~ f . o ~l,f.(Tr~ OF ~ I I RC~IUIROF.4~q~.~0UTt~ II(I~=OrI~NT
flRTR HR~ ~EEN IIf!IIm[I'F.NT
" EVENT 68.5 " ML" 6.4 - ~ , ' 72
EVENT 42.1 - M c • 6 . 5
. ~ . • 44
" EVENT 51.2 " ML " 5 .6
- z~ - 25
" EVENT 55.1 - ML ,5 . 5
- , ; o T,o ~ ~;o ' ,= F~EgI.tE~y - CPS X 1o - I
lee
! I
F~IJ~IER RMPLIIUOE SPECI~UN OF ACCELERRTION ~eOtNEO ~e l . l rU~ ~ Fort G~OUP I ¢¢¢~LE~ '~ . I~ST
mm ms eEEw mSl~W~r c~C~
EVENT 55 .5 M E • 5,4
~,, 27
EVENT ~ .3 U L • 4.3
~ - 27
EVENT 38.1 ML" 3
EVENT 55,4 M E • 3. 9
z~ • z?
~{IJE~Cf - c~s x io- I
FOURIER RMPLITgOE 5PEETRU4 OF RECELERRTION ~THEO ~ tn or" 6RauP I I R~I~LE~e~,~,WUr
mr~ ms eBEW I~TmMEwI comEc~..o
~5¢ - EVENT 68 .5 " - M L • 6.4
& . 7,2 x
i 3~ - EVENT 42.1 - M E • 6.5
~2m EVENT 53,1
~ i s (" ML" 5.5 - z= . 19
~101 ~ EVENT 5 [ . 2 h- ML • 5.6
' ~, ' ~ ' ~, ' ,~ = , ~ ,,,o ,~o , ; o " ' F~EOLJEklCY - ~ I tO * l
FOURIER RMPLITUOE SPIEC/~UI4 OF RCEELEf~rION SI40elRtEO ~ [TL IOE ~ IF , , ~ OF C,~OUP I tq[)Cf.L,~q~GRl~S.~RtJCt~. CaN
81 EVENT 55 .5
6 EVENT 38.1 ML '3
' 9 ; ~ ' r 6
A EVENT 55 .3 ML • 4.3
~ ~ ,27
EVENT 55 .4
52? ~ . 27
r~ ruJcT - crs x lo- I
FOURIER RPOLITIJOIE SPECTRUH OF RCCELERRTION F,M~THEO ~_CTRA OF C,~UP I I N;CF.LEROG~,VEIII C014P
~TR NR~ V=EN INSImUMBIT COImECI1EO
I
, , i i , , , , ] t , , i ,
EVENT 68 .5 ML -6 .3
~ , 72
EVENT 42.1 ML , 6 ,5
A, 44
EVENT 53.1 M L • 5.5
Z* - i 9
EVENT 51.2 M L • 5 . 6
==, 2S
so eo ioo ~zo i~o tw leo ~o ~gu~cv - ¢p$ x io- t
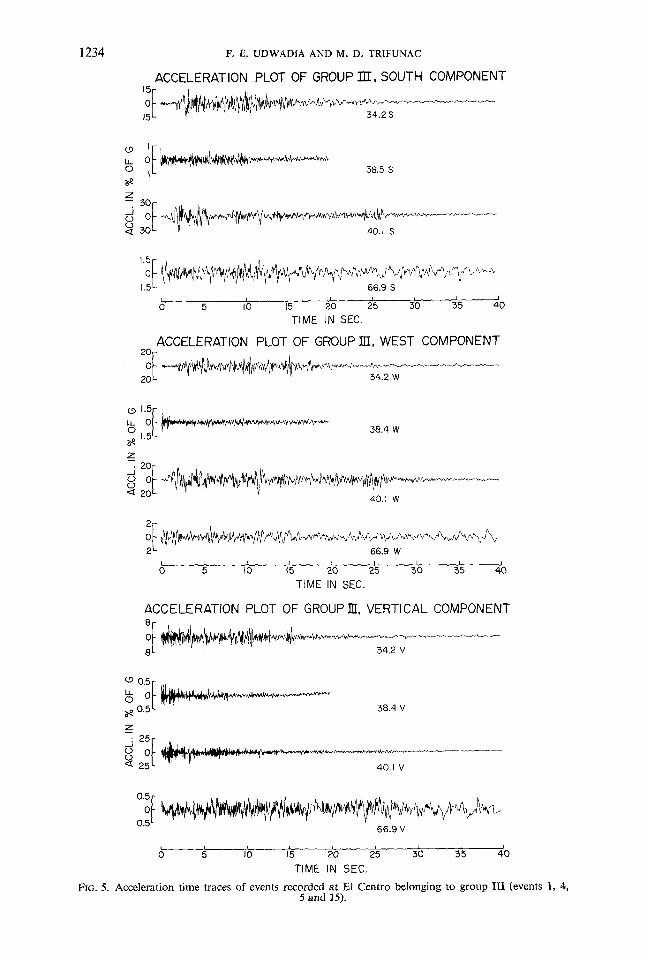
FIG. 7. Smoothed Fourier amplitude spectra of group I and group II events.

1~o
i
COMPARISON OF EARTHQUAKE AND MICROTREMOR GROUND MOTIONS
FOURIER RMPLITUDE SPECTRUM OF RCCELERRTION
rata Mm e~EW INS~U~J~r c e m ( c n ~ o
E V E N T 40 .1 M L - 6 . 5
A " 15
E V E N T 3 4 . 2 M L - 6. 5
E V E N T 6 6 . 9 U L = 6 .3
E V E N T 3 8 . 4 & • 150 M L = 4
FFIEOtJENCY - CP5 x [o - I
O~
FOURIER RHPLITUDE $PECTR~J~ Of RCCELERRTION S~COIM~O S'~EC~ Or C~ IV ~CCELE~C,~S.S~UI~ COl'@
~ T R P~$ BEEN ]NSTREII~NT E~IRECT[:O
E V E N T 56.1 M L • 6 .8
E V E N T 5 4 . 5 M L • S.3
z ~ . 14El
E V E N T 5 6 , 2 M L " 6.1
~ , = 119
FRE~JENCY - CF$ X 1~ I
1237
E~
~ ~EVENT ~6
FOU~IER RNPLITUD( SP(CTRU~ OF RCCELER~TI~N SI4~IN~D SPI~CTR~ I~F ~ I H RCI~LER~RRRS,k~ST C ~ N E N T
ORTR ~ I~.EN INSITU~J~r CO~RECIEO
~ E V E N T 40 .1 M L • 6 .5
E V E N T 3 4 . 2 M c • 6 . 4
E V E N T 6 6 . 9 M L • 6 . ]
. ~ . 4 ~ - ~50
20 ~ 8O ~ I~ 120 i~o 160 I ~ 200
FOUBIER ~V~LITU[~ 5PECT~UH OF RCCELERRTION ~ T N E O SPECTRR ~F C4~UP IV RCCELEP,~RRI~.EI~)"
m r ~ ~ eE~N Z ~ T n U ~ m C~mmCTE~
E V E N T 56.1 M c • 6 . 8
t ~ . t i e
E V E N T 5 4 , 5 M E • 6 . ~
E V E N T 5 6 . 2 M L • 6.1
& ' H 9
• ~ I I I I I 20 ~O ~0 e0 10o 120 i~o leo 180 2O0
FREOUI[N~y - C ~ x i o - I
FOURIER RHPLITUOE SPECTRUH OF R6CELERRTIf lN ~ T H E O SPECIRA ~ RCL'ELF.ROGRRM$.~N.2.1RI.~.S,YEFIt'IL'~L I~ l fO l~NT
ORTR ~ BEEN I~*~ITRIJI~NI" CI~RRECTIEO r , ~ , i , , I , , i , , , ~ i , I i
E V E N T 40.1 M L • 6 . 5
4 " ;5
E V E N T 3 4 . 2 M L • S.5
~, • 'SO
E V E N T 6 6 . 9 M L • 6 . 3
~ , . 150
20 ~o eo eo ioo 12o 1~o 160 leo ;ZOO FREgUENCy - CP$ ) 10 "1
elO~
¢' '~ad
8 ' ~o( .
=
FOURIER RMPLIIUOE SPECTRUM 0¢ R C C E L E R R T I ~ S ~ O r ~ O S R C T ~ ~ ' ~ ZV A c c e t E r ~ a m s . v E m r c o r n
ORTR ~ BEEN ~NST~IENr CORRECI[O , , , , , , t i i , i , , i f
E V E N T 56.1 M L" 6 . S
~1. H9
E V E N T 5 4 . 5
z~ • 148
E V E N T 5 6 . 2 M L • 6,1
~, • 119
20 g0 60 00 100 120 i~o 16o ltlO FREBIEkCy - CP5 X 10-1
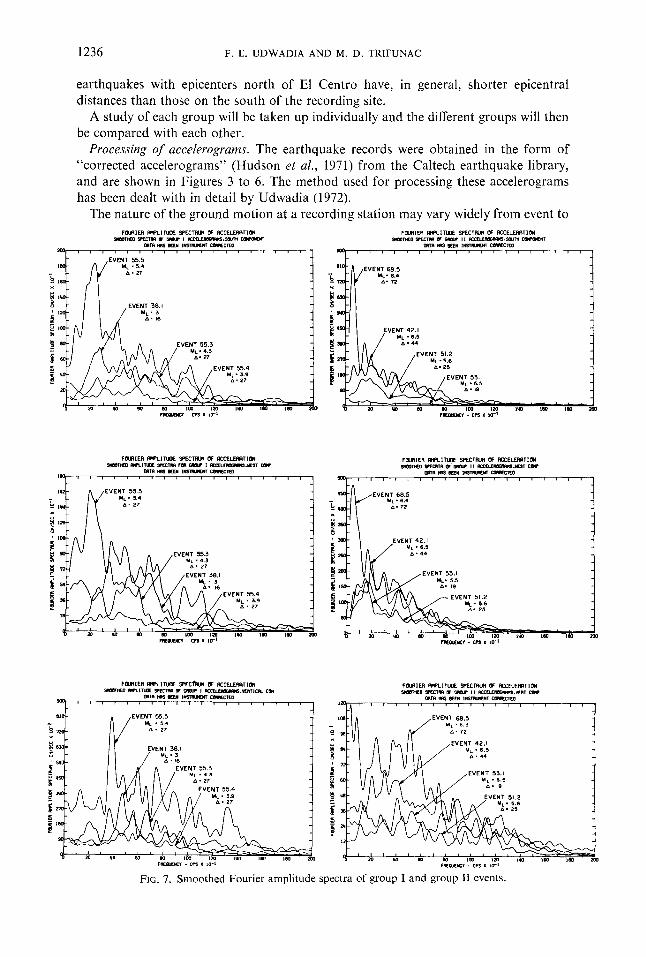
FIG. 8. Smoothed Fourier amplitude spectra of group III and group IV events.
event, each accelerogram being composed of P, S and surface waves of varying amplitude and duration. It would be instructive to interpret each time trace individually, and then Fourier analyze the segments which exhibit the corresponding predominant phases. Typical engineering structures, however, are subject to the complete accelerograph time history, and, hence, a Fourier analysis of the complete time signal is important.
To assess the frequency content of the records, Fourier transforms were computed by interpolating 212 = 4,096 equally spaced points to each accelerogram record. The lengths of signals analyzed were either 20 sec or 40 sec, depending on the duration of the record containing significant ground motions.

1238 F. E. U D W A D I A AND M. D. T R I F U N A C
As the Fourier transform amplitude is a rapidly oscillating function, it needs to be smoothed for further interpretation (Udwadia, 1972). Various smoothing techniques have been suggested in the past (e.g., Blackmann and Tukey, 1958; Parzen, 1962). After trying out several types of smoothing windows, a simple smoothing technique using a triangular window having a bandwidth of 0.4 cps was chosen. The general trends in the spectra which are of engineering importance are felt to be clearly brought out by this simple smoothing procedure. The smoothed spectra are reproduced in Figures 7 and 8.
Interpretation of ground motion in El Centro. It is obvious from the different time traces of the accelerograms (Figures 3 to 6) that the nature of the ground motion varies widely from event to event. The arrival of the different phases at the recording station and the amount of energy in each of them are significantly different for the 15 accelerograms studied here.
Figure 7 which shows the spectra of three events (55.3, 55.4 and 55.5), all of which have been assigned the same epicenter, is particularly interesting. The spectra of these three events show that the smaller events have a relatively larger proportion of higher fre- quencies in them. The spectra of the larger events show a greater contribution toward the low-frequency end of the spectrum. The different general characteristics of the three spectra indicate differences in the nature of the source mechanisms for the three events. Also, event 38.1 (ML = 3.0) caused roughly the same energy input at the site as the more distant event 55.3 (ML = 4.3), as seen from the area under the spectral curves.
Events 42.1 and 68.5 (Figure 7), which have been assignedcomparablelocal magnitudes, show spectral characteristics indicating that the total energy received at the station from the nearer, larger event is less than that from the smaller, more distant one. The con- centration at the low-frequency end observed in event 68.5 may be attributed to the surface waves (see Figure 4). This example clearly illustrates the influence of the nature of the source mechanism and the travel path upon the nature of ground shaking.
The spectrum of the vertical component of motion in the Imperial Valley earthquake of 1940 (Figure 8) shows a large peak in its vertical component at about 8.7 cycles/sec. This large peak might be attributed to the multiple-event nature of the source mechanism, involving successive arrivals of S and P waves with their relatively higher frequency content, or the close proximity of the source with respect to the receiver which allows little chance for the high-frequency waves to be attenuated, or the site amplification characteristics. However, the main causes for this peak cannot be distinctly identified from the presently available data.
It may be of some interest to compare the spectra of events 55.3, 55.4, and 55.5 (all of which have the same epicenter, Figure 7) which show distinctly dis-similar general features, with those of events 56.1 and 56.2 (Figure 8) which do show some similarities. One might deduce from the similar trends shown in the latter spectra that at distances farther from the epicenter the effects of differences in the short-time details at source are eliminated, the motions then reflecting the gross effect of source, transmission path and local topography. Another comparison can be made between events 54.5 (Figure 8) and 66.9 (Figure 8) belonging to different groups, III and IV. Despite the fact that both events have been assigned the same local magnitude (ML = 6.3) and have about the same epi- central distances from the recording site, the time histories and the spectra of the two events are quite different, indicating again the influence of the source mechanism and the nature of the transmission path on strong ground shaking.
In order to search for periodicities that appear recurrently for different azimuths, the matching of spectral peaks can be studied. For this purpose the different peaks have been picked by eye and their positions indicated in the bar chart shown in Figure 9. As the resolution of the smoothing window is 0.2 cps, two peaks more than 0.2 cps apart have

COMPARISON OF EARTHQUAKE AND MICROTREMOR GROUND MOTIONS 1239
Group E-W COMPONENT
-~ 2 2 3 2 2 :5 3 2 5 2 2 I I I I I I I I I I I
' , 1 1
I 1 2 3 3 2
L L L _ I I I I 3 2 2 2 2 2 2 I r r r l I I I I I I I
I~1 I I I I I I I I ~ I i i i i 1 i
Group N-S COMPONENT
2 3 2 5 3 22 3 3 4 r I I I I I I I I I I I I
I 1 2 3 3 3 2 2 2 I ~ 1 l i I I I I I
- I I I I I
I [ 2 2 2 2 2 2 2 2 [ T r r l ! I ! I I I ! I
I I I I I I I
I I 2 3 3
Group
T
Tr
n-r
]'7
UP COMPONENT
2 2 3 2 222
I I I I I I
2 5 3 2 2 :5 3 2 2
I l l ' " ' " I I I I I I I I I I I I
2 2 2 2 I I
I I
2 2 3 2 2
I I i I I I I I I I
3 2 I 1 I I I I
2 2 2 I I I I I I I I I
3 2 I I I I I I
2 I I I
2 2 I I I I I I
I I 1 I I I 1 I 0 2 4 6 8 I0 12 14
F R E Q U E N C Y - C P S
FIo. 9. Bar chart indicating the matching of Fourier spectral peaks. Numbers above bars indicate number of matchings. Solid bars indicate frequencies above the 95 per cent confidence level.

1240 V. E. U D W A D I A AND M. D. TRIFUNAC
been considered as being distinctly different from each other and two peaks closer than 0.2 cps from each other as being coincident. In Figure 9 the thick bars correspond to peaks above the 95 per cent confidence level (Udwadia, 1972), while the dotted bars indicate peaks below that confidence level. The numbers above each bar indicate the number of peaks that match at the frequency in question. As seen from the chart it appears that no recurrent peaks are prevalent in the horizontal components of ground motion. The location of the bars varies widely from group to group for the horizontal components of ground motion and does not indicate any frequencies that might be construed as being characteristic of the local site conditions. The same kind of general scatter is found in the vertical components of ground motions except perhaps for the line-up at a frequency of 1.8 and 2.8 cps, and a weaker possibility at 4.6 cps. The vertically ascending SH-wave model for local soil conditions gives results that do not yield peaks identifying with any of these frequencies (Duke et al., 1964).
ANALYSIS OF MICROTREMOR GROUND MOTIONS AT EL CENTRO
Two basic approaches have hitherto been used in the study of the vibrational character- istics of subsoil layers. The first involves field exploration, either through seismic pros- pecting, trenching, or bore-hole studies. The second approach, instituted chiefly by Kanai (1957, 1962) involves the application of microtremors. Microtremors, as the word suggests, are low-amplitude oscillations (1 ~ 5 microns) of the ground surface produced by natural sources such as the wind and the sea breaking on nearby shores, and by artificial ones such as vehicular traffic and other cultural noise. The measured micro- tremor motions may be modified by local soil and geological conditions and hence the recorded signal may contain information on these local conditions.
Kanai and his colleagues (Kanai and Tanaka, 1961) made several studies of micro- tremors. Their investigations typically made use of a 2-min length of record from one horizontal component of ground motion and involved measuring the intervals between successive zeros. The periods of ground motion were taken to be twice the time interval. By plotting the periods versus the number of waves of each period, they obtained a "frequency period curve". From their study they suggested (Kanai, 1962) that for a given site such curves.had some correlation with similar plots obtained from those of strong earthquake ground motions. They categorized sites in Japan on the basis of the general appearance of these "frequency-period" curves into four classes for use in assigning lateral-force coefficients in the aseismic design of structures. However, a direct correlation between strong earthquakes and microtremor processes has yet to be established in general terms. It is the purpose of this section to study the extent and nature of such a correlation so that the rationale behind the "microregionalization" of this area on the basis of variations in the nature of microtremor ground motions for the purposes of assessing damage susceptibility during strong earthquake ground motions can be critically viewed.
Before a comparative study of earthquake and microtremor observations can be made, it is necessary to study the nature of microtremors and earthquake processes, and how they resemble or differ from one another. The following is a very brief review of the physical characteristics of microtremor ground motions.
Kanai (1962) has interpreted microtremors as being chiefly multiple reflections of S H waves in parallel subsoil layers. If such a theory were totally applicable, microtremor ground motions ought not to show significant components in the vertical direction. Among other results, the present study indicates that significant vertical components of ground motion can occur in such a process.
COMPARISON OF EARTHQUAKE AND MICROTREMOR GROUND MOTIONS 1241
Wilson (1953) studied microtremors in the frequency 4 to 100 cps and found the main sources to be heavy traffic, machinery, aircraft, wind, and other cultural noise. Aki (1957) found that microtremors at a particular site had a uniform intensity with respect to azimuth. He found that these waves had a definite velocity at a given frequency and identified them as Love waves. Akamatu (1961), on studying particle orbits, arrived at the conclusion that they are mainly combinations of Love and Rayleigh waves. Recordings made at the surface and at depth by Douze (1964) indicated that microtremors may be both P and Rayleigh waves, while Allam (1969), in a recent study in Tokyo, concludes that microtremors are combinations of body and/or surface waves, which leaves open the possibility of almost any type of motion.
The above brief outline has been given to indicate the diversity of prevalent opinion on the basic nature of microtremors. The source of microtremors has been tacitly con- sidered by many investigators to be a process analogous to a white noise input into "bed rock". The validity of such a point of view is questionable in view of the strong possibility that the source often comprises close-in surface excitations. As the nature of these ground inputs is usually unknown, deductions from microtremor ground measurements need to be made with caution. One plausible reason for the wide variety of opinions expressed by various investigators on the nature of microtremor processes is the uncertain nature of this input ground motion.
Microtremor motions have been found by various investigators (e.g., Allam, 1969) to be stationary over periods of time of the order of 40 sec to 2-3 minutes. Although this point will be considered again in greater detail, it will suffice to say at this stage that earthquake processes are not stationary in nature, and, hence, ground response to the
\ tMPERIAL VALLEY COLLEGEII
J
N SCALEJN MILES 0
_ ATEN ROAD
E
ADAMS AVE
BROAD,VAIl ] ~ 3:I " • COMMERCIALMAIN ST AVE L~ CCIJRT H( JSE STATE ST - -
L . . . . . . . . . . . I ~ E~+~ ,,~
o ~ ~ ROSS AVE
F ' ~ M % ~ o
, +
J MEAOOWS .. . . . ~HO~
EL CENTRO AREA
LEGEND
• MEASUREMENT SITES
• C&G.S STANDARD ACCEL
11EO32,~,0 ,,
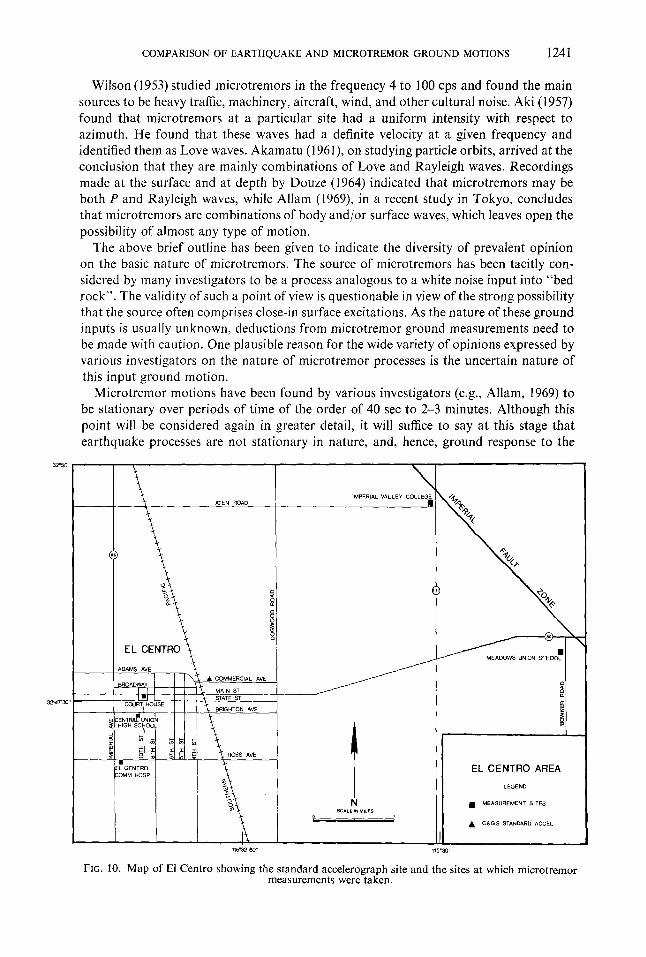
FiG. 10. Map of El Centro showing the standard accelerograph site and the sites at which microtremor measurements were taken.
1242 F. E. UDWADIA AND M. D. TRIFUNAC
two processes may be quite different. The nature of the input motions at the source is unknown in both cases. The ground input in earthquake processes has a determinable spatial relation to the receiver. However, large uncertainties exist regarding the modifica- tion of these unknown inputs as they pass through the complicated intervening medium between the source and the receiver. The receiver, of course, feels the integrated effect of all these modifications that the waves experience along their travel path from the source. Microtremors, on the other hand, are more or less locally, created by close-in sources whose spatial distribution is ordinarily unknown.
One way of studying in greater detail correlations between the two processes would be to make microtremor measurements at or near a site where a large number of strong earthquake ground motions had been recorded. Microtremor field measurements have been made, therefore, at five different sites in the E1 Centro area (Figure 10) to throw some light on their nature and to ascertain the extent to which possible correlations with the strong-motion measurements exist.
FIELD MEASUREMENTS OF MICROTREMOR GROUND MOTIONS
(a) Description of measuring equipment. Three moving coil-type seismometers with a natural period of about 1 sec and 70 per cent damping were used to measure the three components of ground motion at five different sites in the El Centro area. The velocity output was then recorded on a seven-channel FM magnetic tape recorder. A direct visual display of the ground motions was obtained by simultaneously recording the three signals on ink recorders. On the fourth channel of the tape recorder was fed a 10-cps sine wave from a function generator in order to have an accurate time control.
(b) Measurement procedure. Figure 10 shows a map of E1 Centro and the five different sites at which the microtremor measurements were made. Three of them are close (within 2 to 3 kin) to the strong-motion accelerograph site, the other two being nearer the Imperial Fault zone. Microtremor measurements could not be made exactly at the strong-motion accelerograph site which is located in a steam turbine electrical generating plant with a very high level of background noise. All measurements were made during the night in order to eliminate, as far as possible, the effects of close-by local disturbances. To establish the stationarity of the process, three of the sites were revisited the following night and measurements were taken once more. Before each set of recordings, which lasted about 4 to 5 min, a calibration run was made wherein each of the three seismometers was oriented in an EW direction. This allowed a check of the reliability of the instruments and the total error bounds on the experimental procedures coupled with the numerical processing. Figure 11 shows a typical set of spectra obtained from a calibration,run. The spectral peaks are consistent to within 2 to 5 per cent, the variance in the spectra being less than ¼ to ½ cps in the 0- to 16-cps range.
DATA ANALYSIS
The three simultaneous analog signals recorded on magnetic tape were converted to digital form by an analog-digital converter at the rate of 200 points/sec (Udwadia, 1972). Only a portion of each digitally converted 3-rain record was used in the spectral analysis. Two data blocks were selected in each run, each lasting 40 sec, by visually editing the seismometer readings on the Brush recorders to ensure that the samples were representa- tive and not contaminated by undesirable short-term disturbances, such as might be caused by passing vehicular traffic.
This signal was next passed through a low-pass filter with a cutoff frequency at 100 cps.

C O M P A R I S O N O F E A R T H Q U A K E A N D M I C R O T R E M O R G R O U N D M O T I O N S 1243
FOURIER AMPLITUDE SPECTRUM OF ACCELERATION MICROTREMOR MEASUREMENTS AT CITY HALL, EL CENTRO
AUGUST 4, 1970, II PM CALIBRATION - - EAST-WEST COMP.
INSTRUMENT I
o Ld
X 2
I.--
1.1J a . o')
1.1J a
_.J rt
r r
t~
0
0 4 8 12 16
INSTRUMENT 2
20
J 0 20
I
4 r I l 8 12 16
u.. INSTRUMENT 3
i 0 I I I I 0 4 8 12 16 20
FREQUENCY-CPS
FIG. 11. Cal ibrat ion run performed to obtain the error bounds in the recording and processing o f m i c r o t r e m o r d a t a .

1244 V. E. UDWADIA AND M. D. TR1FUNAC
This digital filter was an equally weighted running mean-type filter having three weights, each of one-third. The filtering process basically consisted of smoothing out the original signal so that the i ~h data point was replaced by the smoothed function calculated as
Vs = ( l ~ i + l q - V i - i - V i _ l ) / 3 .
The smoothed function was next decimated, taking every second point, hence reducing the number of points to 100 points/sec corresponding to a Nyquist frequency of 50 cps. This led to a considerable saving in the cost of subsequent analysis without altering the accuracy of the spectra measurably.
Transducer corrections were made by calculating the different terms of the equation governing the transducer element by differentiating the velocity signal to obtain relative
FOURIER AMPLITUDE SPECTRUH OF RCCELESRTIOR HICROTREHO#~ HERSUI~[ME/4TS RT EL CF-.NTI~O CO#4MIJ~IT'~ I'I~SP[T~_,RIJGUST t l ,1970
F-.RST-WEST COMPONENT ~F ~:l~OIJ~O MOTION i i i I I I i i i t I I [ i
A
. . . . . . . • i ~ C~t~ IOI~IZ LEVEr.
I l kl
I t B 1 2 1 6 ~ 0
FBEOLIENCY - CPS
x g
i
o:
FOUl:tIER 8MPLITUOE SPECTI:~UM OF RCCELERRTI0N MICROTREHO#~ PtEI~SURE~IENTS RT 19- CE~ITP~O COt4MIJNXT¥ PIOSPITRL,RUGUST ~,tgTO
F.F~ST-i4~ST CONPONENT OF ~ f4OT|~ i i i i I I i i I i i i i ~ i
. . . . . . . ~ PI~C~NT C~FIOIEI4CE ~
I / 1 I q I I i 12
FI~OL~NCY - CP$
l I I / I I I 16 20
FIG. 12. Comparison of Fourier spectra of two typical 40-sec lengths of record separated by a 30-sec interval, obtained from a 5-rain length of recording to study short-term stationarity.

COMPARISON OF EARTHQUAKE AND MICROTREMOR GROUND MOTIONS 1245
FOURIER aMPLITUDE SPECTFIUM OF F~CEELEBRT]ON MICROTBEM~ ~ B ~ r s ~T ]MPEBIRL C~-LEGE.EL cENrno.Ra~C,~T ~.197D,~
8 12 16 20 FRE@dlENCY - Cps
FOURIER nMPLITUDE SPECTRUM OF RCCELEBATION MIC~OT~M~ ~S~E~TS ~T I~Eel~ C~LE~.EL CENIBO.~UC~Sr S.tg~O,~ ~ ,
N~TH-~TH C~ENT ~ ~ MOTI~
~R~NCY - COS
FOU~IER RMPLITUOE SPECTRUM OF RCCELEF~TION MICROTRE~B M~R~JREM~NTS ~T IMPEfllRL COLLEC, E.EL CENTBO.F~.UST [ I . [970.~
~SI-WES~ C~NT ~ ~D ~T I~
e 12 ~e FREQUenCy - CPS
FOURIER nMPL]TUDE SPECTRUM OF nCCELER~TION WECBOT~EW~ ME~EWENTS ~T ]MeEBIR~ ~LLE~.EL ~N?B~.~S; 5.J970.I ~ .
% q e 12 1~ ~e
F~L~IIEB RMPLITUDE SPECTRUM OF R(:CELERRTION ffICROTBENCB ~Ep;~J~EMENTS RT IMPEBI~L CaLLE~E.EL CENTRO,P~ST ~ , I S T 0 . ~
~RTIC~ C~NT ~ ~ ~T1~
FOURIER AMPLITUDE SPECTRUM OF nCCELERnTION MICBOTBZM~ ~a~O~EMZNTS Rr IMPE~IRL COLLECE.EL CENrB~.~UC~ST 5.19~0.I ~ .
VERTIC~ C~NT Of ~o MOTI~
e 12 16 f~Q~WCT - C~
FIG. 13. Comparison of Fourier spectra obtained from recording 24 hours apart at the Imperial College site, indicating a lack of long-term stationarity.
acceleration and integrating the velocity signal to get the displacement. Long-period drifts were eliminated from the displacement by fitting a "least-square-fit" parabolic baseline to the calculated displacements (Udwadia, 1972). Further processing of this ground acceleration resulting in the calculation of the Fourier spectral amplitudes (Figures t2-17) proceeded in a similar way to that for the earthquake accelerograms.
To indicate the confidence with which the spectral peaks were computed, a 95 per cent confidence level line has been drawn on each spectrum (Udwadia, 1972).
SPECTRAL ANALYSIS OF MICROTREMOR MOTIONS
To determine whether or not the 40-sec length of record analyzed was sufficiently long to portray the characteristic features of ground motion at the five sites, two typical
1246 F.E. UDWADIA AND M. D. TRIFUNAC
F~U~IER AMPLITUDE SPECTRUM ~)F ECELERRTION
~TH-S~TH C ~ ~ ~ ~ T I ~
FRE~IENCy. Cp S
FeU~IEB P~'W'LITUDE SPECTPLW~ OF BCCELEF~RTION
FOURIER RMPLITUDE SPECTPL~H OF flCCELERRTION
E~T-blEST C@~CI~NT ~F GR~L~4D ~ITION
. . . . . . . . . . . _'2_i.2_221
FREQUENCY - CPS
FOURIER BMPLITUDE SPECTRUM OF ACCELERRTION mce~Te~eae ME~SOeEM~TS ~ r MEC~WS UNION S~m~-.EL CENTe~,R~C-OSl S.lSTO,2
F(~EtRIEB B~'~PLITU{]E SPECTRUM ~F RCCELERRTION NICBOTR~ ~SUREMENTS At V~OOWS UNI~ SC'HOCL.EL CENrBo.~.~SI ~,[970.10eM
ENTICE COI*@ONENr OF C,~OUNO MOTION
FOURIEF~ Pe'PLITUOE SPECTRUM OF RCCELERF~TION M[CR(]TBEP,~R MEI:~)LIREHENT5 RT ~,I~DCW$ LINI~J ~P,10(]L.EL CENTP, O,RUOJST 5,IB7(],2 RH
VERTICF¢ C~I, PO~MT Of C,~aL~O HllTION
-;iZ~ g e 12 i s
Fe~QUENC~ - CPS 8 12 16
FREQUENCy - Cp 5
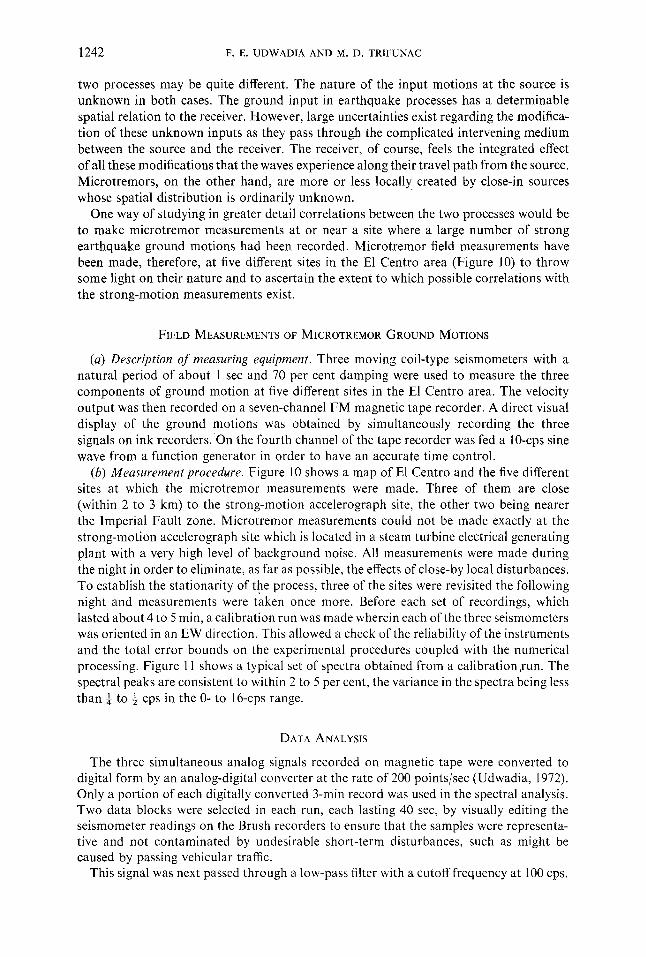
FIG. 14. Comparison of Fourier spectra obtained from recording 24 hours apart at the Meadows Union High School site, indicating a lack of long-term stationarity.
40-sec blocks were selected from the recordings at each site and their spectra compared. Figure 12 indicates a typical comparison. The figure shows that so far as short-time intervals (of the order of 2-3 min) are concerned, a 40-sec length of record is long enough to permit the extraction of information representative of the process. Over such short- time intervals the process is fairly statmnary, judging from the appearance of the spectra. To see if this stationarity persists over relatively longer periods (of the order of a day or so) measurements were made at three of the sites after a lapse of about 24 hr. These spectra are shown in Figures 13 to 15. The spectra on the right show the nature of ground motions about 24 hr after the first measurements were made. Fourier spectra obtained from recordings at the Union High School and the E1 Centro Hospital sites are shown in Figures 16 and 17.

COMPARISON OF EARTHQUAKE AND MICROTREMOR GROUND MOTIONS 1247
FOUBIEF4 nMPLITUOE SPECTRUM OF flCCELEAFqTION F~RIER f~MPLITUDE SPECTFCUM 0F ~CCELERflTIt~N HI~lI~E~i~ P4EASU~E~ENT$ Al" Oily F~qtL,EL ~NT~,~IG&/ST S,I~?O,IOF'M
FOUF~IER AMPLITUDE SPECTRUM I)~ HLt.~LERRTIO N MICB{ITB~M~ M~R~MENT~ AT ClIY ~LL.£L CENIB~,AO~T a.lgTD,lO~n
' ' ~ I , I " , , i , i , I I
FBEQU~NCy - C~
FOUAIER RMPLITUOE SPECTRUM OF BCCELERflTION H I C B O I ~ ~ E ~ N T S AT CITy MALL,EL CENTRO,~$T S.~BTO.IOpM
FOURIEB BMPLITUDE SPECIRUM OF P, CCEL~BBTI(~N M[CBaTB~M~m~ ~qSUflE~,IENT$ AT CiTY FW~LL,EL CENTB~.BLmGusT y , I ~ 7 0 , 1 { ~ M
~ T I C ~ C~'e~'CNT oF ~OU~O Morl~
FOUAIEF~ flMPLITUOE ~RECTAUM OF RCCELEF~qTION MICBOTBE~I~B ~cp.~LIgEMENTS AT CITY ~LL,EL CENTB{I.PIUC, L~3T 5,1970,]0f14
V B E ~ N C y - CPS
FIG. 15. Comparison of Fourier spectra obtained from recording 24 hours apart at the City Hall site indicating a lack of long-term stationarity.
Microtremor spectra cover a wider frequency range than earthquake spectra whose frequency content above 15 cps is very small. These higher-frequency components which are characteristic of the microtremor process can be attributed to two main causes. First, since the microtremor source areas are local in nature, there is little opportunity for attenuation of the high frequencies with distance as in the case for the more distant earthquake processes. Second, microtremors are often caused by rotating machinery, much of which undoubtedly operates in this higher-frequency range.
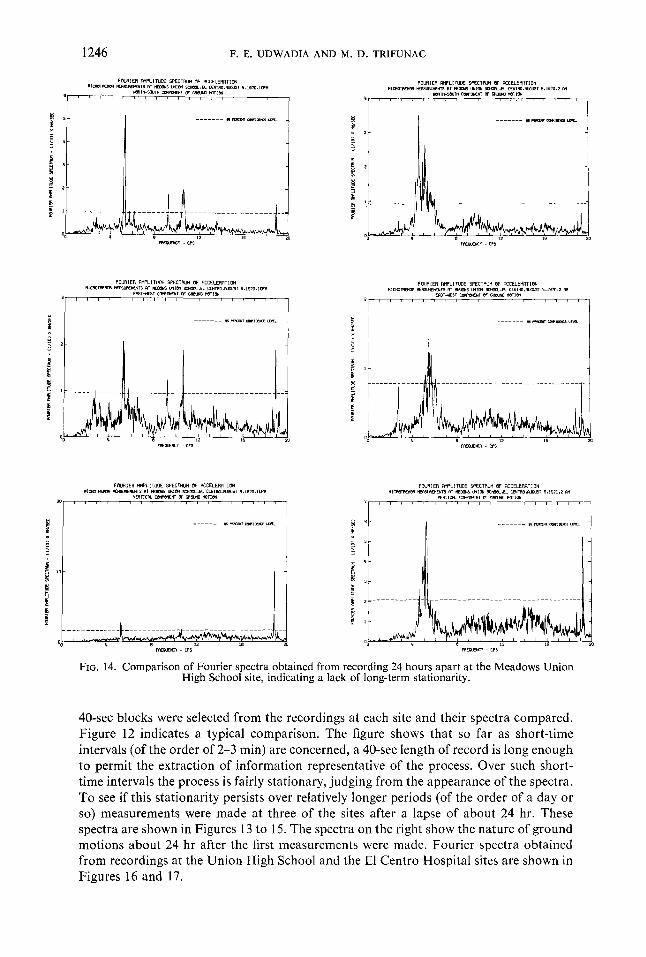
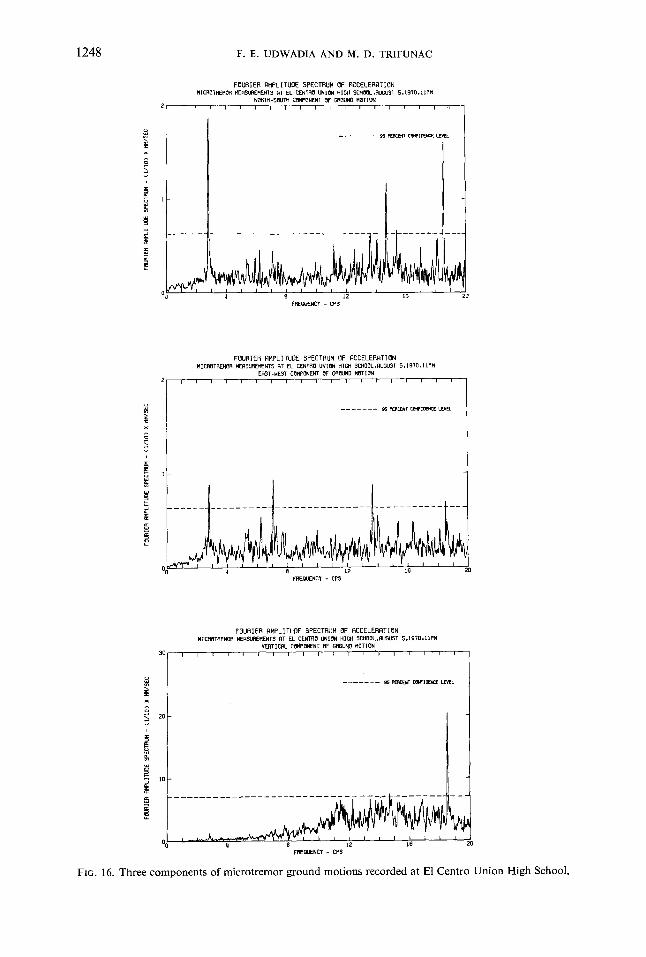
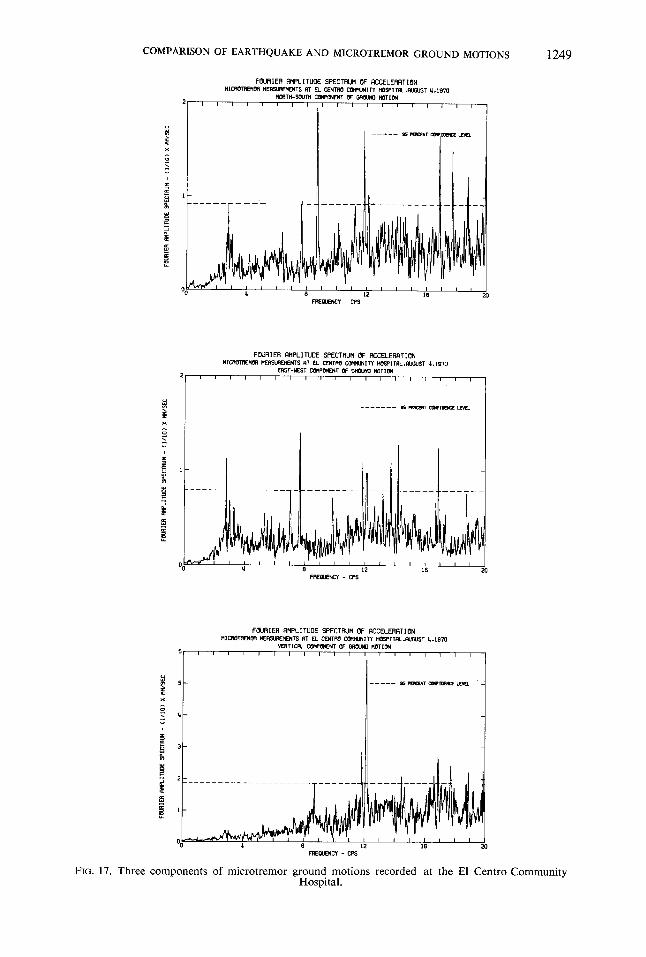
The three recordings made near the accelerograph site in the urbanized area of E1 Centro are shown in Figures 15 to 17. A visual comparison of these spectra indicates little frequency-peak correlation. As some of the peaks observed in these spectra might be the result of a particular excitation which happened to exist at the time the recording was made, deductions from these records need to be made with caution. For instance, had
1248 F.E. UDWADIA AND M. D. TRIFUNAC
FOUAIEB RMPLITUOE SPECTAUM OF I~CCELERRTION MICROTREMrJR MERSUREMENT5 @T EL CENTRB UNION HIGH SCHOaL.RUGUST 5,1970,lJPM
NOflTti-5OUTH COMPONENT OF GROuNO MOTION = i I i ~ I I i = I i = i i i = i .~
FRE(~JENCY - CPS
FSURIER RMPLITUDE SPECTRUM OF QCCELERRTION MICBSTREMOR MERSURE~NTS RT EL CENTBO UNI~HI~SCHOOL,AU~T 5.1970,IIPM
EB~T-WE~T C~MP~ENT OF~MOTION i r l t l i q l l l l l l l l l l l
. . . . . . . ~ pE~EENT C~IOE~ LEV~
X
0 ~ 8 12 16 Z FRE~ENCY - CPS
FOURIER RMPLITUDE SPECTFIUM OF ACCELERATION MICRSTBEMOfl MEASUREMENT5 RT EL CENTB8 UNION HIGH SCHOOL,RUGUST 5,1970,%IPH
VEBTICRL C~PBNENT 8F GRSUND MSTISN ~10 i I I i I i i i I i i I I ' 1 I i I I i
i . . . . . . . ~ PE~C~T CONFIDF~CE LEVEL
2o
. . . . . . . . . . . . . . . . . . . . . . . . . . . . . . . " . . . . . . . . . - - - 1
i 12 16
FREQUENCY - CP$
FIG. 16. Three components of microtremor ground motions recorded at E1 Centro Union High School.
COMPARISON OF EARTHQUAKE AND M1CROTREMOR GROUND MOTIONS 1249
FOURIER RHPLITUDE SPECTRUM OF RCCELEF~TION MICBOTBEMOB M ~ T S RT El_ CENTBO COI~ITY H~SPITRL.RLIC4~T ~.t970
t, IORTH-S~UTH C(~II~NENT OF C,~@JM] H~TIC~ J I t r I t I r t I t t t I I t ~ t I
FREIQUENCy - CP5
FOURIER RMPLITUDE SPECTRUM OF RCCELERRTION MI~TB(M~ MERSLk~-MENT$ RT EL CENTBO C(~IMA.INITY HOSPITRL.RUC, IJST ~.Lg?O EP~T-I, EST (~ ' IPON(NT OF ~ MOTION
l l i i l i l i l l i i ~ i i i ~ [
~ i~ .............................
I I I I l I I I I l
FFEOUENCY - CPS
I I 20
FOURIER RMPLITUnE SPECTBUM OF P, CCELEBRTION MICMOTMEM~ HERSUBEMENTS RT EL CENTBa C~HHUNITY HOe.PITPA..RI~_AJ~T ~.1970
V(BTICRL COMP~WENT OF ~ MOTION i i I i I I I i i t J I I ] i I
. . . . . r~ ~ cewI l~e)~ LEVEL
B 12 16 20 F~EOUEN~ - CP~
FIG. 17. Three components of microtremor ground motions recorded at the El Centro Community Hospital.

1250 F. E. UDWADIA AND M. D. TRIFUNAC
the two recordings (Figure 15) on August 4 and 5 been omitted, one might have concluded from the spectra obtained on August 4 that a sharp resonant ground frequency at 12.9 cps exists. The complete absence of such a peak after a lapse of 24 hr strongly indicates that it was probably caused by some close-in machinery.
The bar chart indicating the peaks above the 95 per cent confidence level (Figure 18) shows a significant peak around 2.8 cps. We observe from the spectra that the form of this peak in all three components of motion at a site is quite similar although marked differences are apparent from site to site. From the transfer function curves obtained by Duke et al. (1964), for the E1 Centro site under the assumption of vertically propagating S waves, it appears that the wave nature associated with this frequency is either caused by surface modes (Allam, 1969) or forced excitations originating close to the site. Because of uncertainties associated with numerical computation of the dispersion curves for such a high frequency, one cannot be completely certain of the cause, although the spectral characteristics discussed above seem to lend weight to the forced oscillation idea.
The last two sites chosen were both very close to the Imperial Fault. The spectra computed at the Imperial College site (Figure 13) at intervals of 24 hr indicate that the two sets of spectra have distinctly dis-similar natures. The marked spectral peak at 5.5 cps observed in the spectra of August 4 has disappeared in the spectra of August 5, indicating that these peaks were possibly a result of forced oscillations of the ground surface caused by local sources. We also generally observe that the spectra of all three components look very similar, giving a further indication that such a ground motion may be generated by the forced oscillations created by specific sources, hence reflecting the nature of the source rather than the characteristics of the ground properties. Also, large differences in the amplitude levels in the NS direction are observed in the spectra (Figure 13) on successive days, clearly indicating the nonstationary nature of the source functions in the microtremi3r process.
The presence of marked spectral peaks caused by machinery, etc., tends to raise the 95 per cent confidence levels and hence tends to hide the peaks of more significance to this study. In order to make a more thorough investigation, it was decided to pick out by eye possible significant peaks below the 95 per cent confidence level and include them in the bar chart (Figure 18). These are shown by crossed arrows on the chart. Since the detection
o) - ~ E-W z=Z~- U~- N-S
.d~= V
E-W
z - = N-S
==g V =o J~: E-W = ~ N-S
~ V
= E-W
Q - ~.~ N.S
~ = ~ V
J~ E-W ~.g N-S
- ~ V PEAKS FROM THEORETICAL
MODEL
t ~
t
t
t
I H
t ~ t
f
t
t
f
I I ~ [ 4
I I I 8 12
F R E Q U E N C Y - CPS
4
t t
' t
l ,
16 2 0
FIG. 18. Bar chart showing frequencies obtained from the microtremor tests. Downward pointing arrows indicate peaks obtained from the later recording taken about 24 hr after the first. The horizontal thick bars represent theoretically computed predominant frequencies for the horizontally layered S-wave model.

COMPARISON OF EARTHQUAKE AND MICROTREMOR GROUND MOTIONS 1251
of these peaks is a subjective process, the choices were independently made by two investigators and similar results were obtained. The scatter of the bars on the chart indicates that predominant frequencies, if present, are very dimcult to spot. The bar chart, however, strongly indicates that a frequency of about 2.8 cps may have some special significance. The fact that it always seems to occur in all three components suggests that it might be the consequence of a forced oscillation. One cannot rule out, however, the possibility of a surface mode at this frequency, as discussed above.
CONCLUSIONS
Analysis of El Centro Accelerograms
1. Strong ground shaking caused by close-in earthquake depends strongly on the nature of the source. Accelerograms of smaller events seem to show a relatively higher frequency content compared to those of larger events, other parameters as azimuth and epicentral distance being constant.
2. The motions recorded from large distant earthquakes indicate that surface waves play an important role in strong ground shaking.
3. The records obtained from different azimuths vary widely, both in the relative arrival times of the different phases and in their spectral properties, indicating that variations in travel path characteristics are important for this site.
4. The local magnitude scale may not be a consistent characterization of the nature of damaging motions at a site. Such factors as the location of the site with respect to faults and the character of the source mechanism are important for close-in ground shaking.
5. As commonly observed for strong-motion records, the spectra of the vertical components of earthquake ground motion show a broader band character as compared to the horizontal components, i.e., the vertical motions show significantly higher fre- quency components.
6. No distinctly identifiable site periodicities have been observed at the E1 Centro site. The effect of any local site condition seems to be overshadowed by such factors as the nature of the source and the transmission path characteristics.
Analysis of Microtremor Ground Motions
1. It has been shown that microtremor source processes at the E1 Centro site are not stationary broad-band processes with a flat spectrum, making the interpretation of the spectra of these low-amplitude ground motions difficult from a single microtremor recording at a site. To obtain information on ground periodicity, one would need to make repeated measurements at a site in the hope that some common spectral features can be attributed to "site conditions". This may make the study of site characteristics by the microtremor technique a time-consuming process of questionable reliability.
The differences in the spectra obtained at a site over time intervals of a day indicate wide variations in the nature of source excitations. The process recorded, then, seems to give details of the exciting function rather than the transfer function of the ground. The general trends in the spectra also seem to be quite different for sites close by each other that have similar subsoil conditions and also for recordings made at the same site at different times.
2. The amplitudes of vertical components of ground motion have been found to be comparable to the amplitudes of horizontal components in microtremor processes. This would seem to refute the idea that microtremors are mainly multiple reflections of SH waves. However, these vertical components show little resemblance to the earthquake spectra.
1252 F.E. UDWAD1A AND M. D. TRIFUNAC
3. A repeated frequency of about 2.8 cps shows up in the data. This could be inter- preted as being associated with a local soil condition. Other interpretations such as the effect of forced excitations are also possible. No other dominant frequencies in the 0- to 3-cps range were observed. Modeling of the soil using vertically incident S waves on horizontal layers does not satisfactorily interpret this frequency of 2.8 cps.
4. The lack of a consistent microtremor-induced pattern of ground motion makes it difficult to associate these motions with a governing physical mechanism such as the nature of the subsoil conditions. Although differences in the spectral trends of micrc- tremor ground motions are obvious, these measurements, as a whole, when compared with earthquake data, show some distinct dissimilarities in their gross spectral character- istics. Earthquake spectra seem to show larger energy concentrations in the 0- to 6-cps range, dropping off sharply beyond that, primarily due to the attenuation of the high- frequency components of earthquake ground motions. Microtremor spectra are more broad-banded. The characteristics of microtremors and earthquake motions being so widely different, microregionalization based on microtremors may not be a meaningful approach to the evaluation of earthquake risk in the El Centro area.
ACKNOWLEDGMENTS
We thank Professors D. E. Hudson, G. W. Housner, P. C. Jennings, and Dr. A. G. Brady for many valuable discussions and for critical reading of the manuscript. Mr. Richard Dielman rendered very valuable assistance during the field tests.
This research was supported in part by grants from the National Science Foundation.
REFERENCES
Abubakar, i. (1962). Reflection and refraction of plane SH waves at irregular interfaces, I, II, Phys. Earth 10, 1-14 and 15-20. ,~,
Akamatu, K. (1961). On microseisms in frequency range 1 c/s to 200 c/s, Bull. Earthquake Res. Inst., Tokyo Univ. 39, 23-76.
Aki, K. (1957). Space and time spectra of stationary stochasti c waves, with special reference to micro- tremors, Bull. Earthquake Res. Inst,, Tokyo Univ., 35, 415-456.
Aki, K. and K. Larner (1970). Surface motion of a layered medium having an irregular interface due to incident plane SH waves, Geophys. Res. 75, 933-954,
Allam, A. (1969). An investigation into the nature of microtremors, Ph. D. Thesis, Tokyo University. Biehler, S. (1964). Geophysical study of the Salton trough of southern California, Ph.D. Theais, California
Institute of Technology, Pasadena. Blackman, R. B. and J. W. Tukey (1958). The Measurement of Power Spectra, Dover Publications,
New York. Boore, D. M. (1972). A note on the effect of simple topography on seismic SH waves, Bull. Seism. Soc.
Am. 62, 275-284. Brune, J. (1970). Tectonic stress and the spectra of seismic shear waves from earthquakes, Geophys. Res.
75, 4997-5009. Byerly, P. (1947). The periods of local earthquake waves in central California, Bull, Seism. Soc. Am. 37,
291-297. Cherry, S. and P. Salt (1971). A preliminary investigation of microtremor spectra in British Columbia,
Victoria Geophysical Observatory, 4-1. Crowell, J. C. (1962). Displacement along the San Andreas Fault, California, Geol. Soc. Am. Spec. Papers
71. Douze, E. J. (1964). Signal and noise in deep wells, Geophysics 29, 721 732. Duke, C. M. (1958). Bibliography of effects of soil conditions on earthquake damage, Earthquake
Engineering Research Institute, San Francisco. Duke, C. M., J. C. Fraser, D. J. Leeds, and R. B. Matthiesen (1964). Site characteristics of southern
California strong motion earthquake stations, Part 2, Report No. 64-15, UCLA. Gupta, R. N. (1966). Reflection o f plane elastic waves from transition layers with arbitrary variation of
velocity and density, Bull. Seism. Soc. Am. 56, 633-642. Gutenberg, B. (1957). Effects of ground on earthquake motion. Bull. Seism. Soc. Am. 47, 221-250.

COMPARISON OF EARTHQUAKE AND MICROTREMOR GROUND MOTIONS 1253
Haskell, N. A. (1962). Crustal reflection of plane P and S V waves, J. Geophys. Res. 67, 4751-4767. Herrera, I. and E. Rosenblueth (1965). Response spectra in stratified soil, Proe. Worm Conf. Earth-
quake Eng., 3rd., 1, 44-60. Hudson, D. E. (1972). Local distribution of strong earthquake ground motions, Bull. Seism. Soc. Am.
62, 1765-1786. Hudson, D. E., A. G. Brady, M. D. Trifunac, and A. Vijayaraghavan (1971). Strong-motion earthquake
accelerograms, II, EERL 71-50, California Institute of Technology, Pasadena. Hudson, J. A. (1962). The total internal reflection of SH waves, Geophys. J. 6, 509-531. Idriss, I. M. and H. B. Seed (1967). Response of horizontal soil layers during earthquakes, Soil Mechanics
and Bituminous Materials Research Laboratory, University of California, Berkeley. Jennings, P. C. (Editor) (1971). San Fernando earthquake of February 9, 1971, EERL-71-02, California
Institute of Technology, Pasadena. Lanai, K. (1957). The requisite conditions for predominant vibration of ground, Bull. Earthquake
Res. Inst., Tokyo Univ. 35,457. Lanai, K. (1962). On the spectrum of strong earthquake motions, Primeras J. Argentinas lng. Anti-
sismica 24, 1. Lanai, K. and T. Tanaka (1961). On microtremors. VIII., Bull. Earthquake Res. Inst., Tokyo Univ. 39,
97-115. Lanai, K., T. Tanaka, and T. Suzuki (1953). Relation between the earthquake damage and the nature of
the ground, Bull. Earthquake Res. Inst., Tokyo Univ. 31, 57-62. Lee, K. L. and E. J. Monge (1966). Effect of soil conditions on damage in the Peru earthquake of October
17, 1966, UCLA. Nordquist, J. M. (1964). A catalog of southern California earthquake and associated electronic data
processing, Bull. Seism. Soc. Am. 54, 1003-1011. Parzen, E. (1962). Stochastic Processes, Holden-Day, San Francisco. Sakurai, A~-and T. Takahashi (1971). Amplification of earthquake ground motion in surface ground
layers deriving from the observations of the Matsushiro earthquakes, Trans. Jap. Soe. Civil Eng. 3, Part 1, 10-11.
Sato, R. (1963). Diffraction of SH waves at an obtuse angled corner, J. Phys. Earth. 11, 1-17. Sozen, M. A., P. C. Jennings, R. B. Matthiesen, G. W. Housner, and N. M. Newmark (1968). Engi-
neering report on the Caracas earthquake of 29 July 1967, National Academy of Sciences, Washington, D.C.
Suzuki, T. (1932). On the angle of incidence of the initial motion observed at Hong6 and Mitaka, Bull. Earthquake Res. Inst., Tokyo Univ. 10, 517-530.
Trifunac, M. D. (1969). Investigation of Strong earthquake ground motion, Ph.D. Thesis, California Institute of Technology, Pasadena.
Trifunac, M. D. (1971a). Response envelope spectrum and interpretation of strong earthquake ground motion, Bull. Seism. Soc. Am. 61,343-356.
Trifunac, M. D. (1971 b). Surface motion on a semi-cylindrical alluvial valley for incident plane SH waves, Bull. Seism. Soc. Am. 61, 1739-1753.
Trifunac, M. D. (1972). Tectonic stress and source mechanism of the Imperial Valley, California Earth- quake of 1940, Bull. Seism, Soc. Am. 62, 1283-1302.
Trifunac, M. D. (1973). Scattering of plane SH waves by a semi-cylindrical canyon, Intern. J, Earthquake Eng. Struct. Dyn. 1, 267-281.
Tsai, N. C. (1969). Influence of local geology on earthquake ground motion, Ph.D. Thesis, California Institute of Technology, Pasadena.
Udwadia, F. E. (1972). Investigation of earthquake and microtremor ground motions, EERL 72 02, California Institute of Technology, Pasadena.
United States Earthquakes (1936-1968). U. S. Department of Commerce, Environmental Science Services Administration, Coast and Geodetic Survey.
Waseda University Publication (1966). Special issue on Niigata earthquake, Bull. Seism. Eng. Res.Lab.34. Wiggins, J. H. (1964). Effect of site conditions on earthquake intensity, J. Struct. Div., Am. Soe. Civil
Engrs. 90, 279-314. Wilson, C. D. V. (1953). The origin and nature of microcisms in the frequency range 4 to 100 cps., Proc.
Roy. Soc. (London) Ser. A. 217, 176.
EARTHQUAKE ENGINEERING RESEARCH LABORATORY CALIFORNIA INSTITUTE OF TECHNOLOGY PASADENA, CALIFORNIA 91109.
Manuscript received November 6, 1972.