Embed Size (px)
Citation preview

Comparison of European Fire Statistics Final report for the Department for Communities and Local Government
Fire research report 1/2012
Greenstreet Berman Ltd
Department for Communities and Local Government This research was commissioned by the previous government and is not necessarily a reflection of the current government’s policies and priorities.
DCLG is publishing this report in the interests of transparency.

i
© Queen’s Printer and Controller of Her Majesty’s Stationery Office, 2010
Copyright in the typographical arrangement rests with the Crown.
You may re-use this information (not including logos) free of charge in any format or medium, under the terms of the Open Government Licence. To view this licence, visit http://www.nationalarchives.gov.uk/doc/open-government-licence/ or write to the Information Policy Team, The National Archives, Kew, London TW9 4DU, or e-mail: [email protected].
This document/publication is also available on our website at www.communities.gov.uk
If you require this publication in an alternative format please email:
Any enquiries regarding this document/publication should be sent to us at:
Department for Communities and Local Government Eland House Bressenden Place London SW1E 5DU Telephone: 030 3444 0000
2011
ISBN: 978-1-4098- 3135-8
Project managed by: Russell Hocken, Fire Service College and Analysis Division

ii
Executive summary.....................................................................................................v-vii
1 .... INTRODUCTION ..............................................................................................1 1.1 Background to the work............................................................................................ 1 1.2 Approach to the work ............................................................................................... 1
2 .... REVIEW OF LITERATURE ..............................................................................7 2.1 Introduction............................................................................................................... 7 2.2 Augsburg core group ................................................................................................ 7 2.3 Estonian Ministry of the Interior study ...................................................................... 9 2.4 Scottish community fire safety study (SCFSS)....................................................... 10 2.5 Assorted studies..................................................................................................... 11 2.6 Eurofeu survey ....................................................................................................... 14 2.7 Consumer Council.................................................................................................. 14 2.8 CTIF ....................................................................................................................... 15 2.9 European fire safety network: Annual reports ........................................................ 16 2.10 World Health Organisation ..................................................................................... 19 2.11 WFSC Survey......................................................................................................... 19 2.12 Estonian Ministry of the Interior .............................................................................. 20 2.13 EU fire safety network: Bimonthly meeting minutes ............................................... 20 2.14 What is needed to ensure consistent data is collected? ........................................ 20 2.15 Future developments.............................................................................................. 21 2.16 European Fire Academy......................................................................................... 21 2.17 Additional Information…………………………………………………………………. 22
3 .... STAKEHOLDER INTERVIEWS......................................................................23 3.1 Introduction............................................................................................................. 23 3.2 Roles and responsibilities....................................................................................... 23 3.3 Scope of data collected .......................................................................................... 25 3.4 Use of statistics ...................................................................................................... 28 3.5 Future of statistics .................................................................................................. 28 3.6 Other ...................................................................................................................... 31
4 .... SURVEY: KEY RESULTS ..............................................................................32 4.1 Introduction............................................................................................................. 32 4.2 Users and uses of fire data .................................................................................... 32 4.3 Sources and levels of data ..................................................................................... 32 4.4 Consistency in recording ........................................................................................ 33 4.5 Causes, circumstances of fire and fire safety systems .......................................... 42 4.6 Firefighter deaths ................................................................................................... 42
5 .... DISCUSSION AND CONCLUSIONS .............................................................44

3
5.1 Users and uses of fire data .................................................................................... 44 5.2 Comparability of data ............................................................................................. 44 5.3 Future of European fire statistics............................................................................ 45 5.4 Overall conclusion .................................................................................................. 47
6 .... APPENDIX A: INTERVIEWEES EXAMPLES OF DATA COLLECTED ..........48 6.1 Government agency ............................................................................................... 48 6.2 Fire Services .......................................................................................................... 49 6.3 Fire insurers ........................................................................................................... 50 6.4 Fire protection associations.................................................................................... 50 6.5 Fire protection industry........................................................................................... 50
7 .... APPENDIX B: FULL SURVEY RESULTS ......................................................52 7.1 Survey results......................................................................................................... 52 7.2 Section A: About the respondents and publication of fire data............................... 52 7.3 Section B: What is recorded about fires ................................................................. 56 7.4 Section C: Definitions of fires and buildings ........................................................... 64 7.5 Section D: Data recorded per fire ........................................................................... 75 7.6 Section E: Use of fire data...................................................................................... 82 7.7 Section F: Firefighter fatality data........................................................................... 83 7.8 Section G: Recording of costs of fire ...................................................................... 85 7.9 Section H: Quality assurance ................................................................................. 88 7.10 Section I: Plans for revising data collection ............................................................ 92
8 .... APPENDIC C: COPY OF ONLINE QUESTIONNAIRE...................................93 8.1 Section A - Roles and responsibilities .................................................................... 93 8.2 Section B – What data is collected? ....................................................................... 95 8.3 Section C – Definition............................................................................................. 98 8.4 Section E - Use of statistics.................................................................................. 103 8.5 Section F – Fire-fighter recording ......................................................................... 103 8.6 Section G – Call to the fire service ....................................................................... 104 8.7 Section H - Quality of data ................................................................................... 105 8.8 Section I – Future of statistics .............................................................................. 106

4
EXECUTIVE SUMMARY
The Department for Communities and Local Government (DCLG) noted that there is little consistency in how statistics are obtained and recorded from country to country. Therefore the EU Fire Safety Network agreed that a study is needed to look at what data is collated, what comparisons this data enables, what gaps exist and how the situation might be improved. DCLG commissioned this study, as its contribution to the work of the EU Fire Safety Network, with the aim of better understanding fire data in member European countries.
This study included a review of previous research, consultation with key stakeholders and a survey of national organisations that collect fire data in EU member states as well as Norway and Iceland. A total of seven in depth telephone interviews have been undertaken with organisations such as International Technical Committee for the Prevention and Extinction of Fire (CTIF); World Fire Statistics Centre; and EU Fire Safety Network. All states except Portugal and Romania were able to respond to the survey in 2010.
The vast majority of states collect data at a national or state basis and use this data to inform government policy, raise awareness of fire risk and develop interventions. Respondents stated that statistics are used to track and inform policy and recognise potential consumer related issues e.g. problems with furniture. Further to this, it was also noted that statistics are used to compare deaths, number of fires between countries, track and inform policy, and recognise consumer issues e.g. problems with furniture. In addition, respondents stated that key audiences and users of European statistics included, governments, academia, insurance companies, fire services, fire protection industry etc.
The literature review indicated that there have been a few comparisons of fire statistics across Europe. The literature review and the survey of member states indicated that fire statistics are typically collected by the national Fire Services, which may then be analysed and published by respective national Government Departments. However in some countries such as Germany, Fire Services of individual regions or municipalities retain a large measure of independence.
Attempts have previously been made to unify data which is available, however it must be recognised that such attempts have not managed to include statistics from all member states.
There are a number of examples of states collecting an extensive range of high quality data on fires, their causes and circumstances, including Finland, Norway, Sweden, Holland, Lithuania, Bulgaria, Slovakia, Italy and the United Kingdom. The approach to data collection and analysis applied by these states could be used to develop an overview of good practice.
A comparison of data indicates that some points of data can be compared between sub-sets of states, including fire deaths and firefighter deaths. These are identified in the main report. However, the survey confirmed the feedback from the interviews in that there are many differences in the recording of fires, fire deaths and casualties between member states. This reduces the number of directly comparable datasets to just a few states. For data to be compared, it would be necessary to reconcile the range of fires included by each state. The detailed survey results would provide a basis on which states could determine how to align their data.
Whilst most states record key points such as the number of fires and deaths, the recording of points such as type of injury, fire safety systems and size of fire is far more mixed and infrequent. Therefore, whilst there may be scope to align and compare overall rates of fire and death, there is less scope to compare other points.

5
As many member states do not record fire deaths in road traffic collisions and the definition of fire death varies, a comparison of all fire deaths does not appear feasible at this moment without additional reporting within some states. A number of options for reconciling the count of certain types of fire deaths are given in the report, such as fire deaths in the home.
As 14 states record the age of victims and 11 record the gender, there is some scope for comparing fatality rates for each age and gender. As few states (3) record disability or ethnicity (2), there is little scope to assess the role of these factors in fire deaths using interstate data.
The differences in the reporting of fires and non fatal casualties are greater than those for fire deaths. Therefore, whilst a similar approach could be adopted to producing comparable data on fires and non fatal casualties, the problems in reconciling data would be greater. As the definition of injury and the categories of injury vary between all states, there is little scope to compare the rate, types or severity of injury between states. A common set of categories would be needed before any form of comparison could be contemplated.
Some states collect data on the size (10 states) of fires thereby providing some scope to assess this along with the response of the fire services, such as response times. Few states record the cost of fires, with these mostly recording insured losses and only 2 considering uninsured and societal losses.
There is less scope to develop comparable data on the role of fire safety systems, such as sprinklers, although 12 states record presence of smoke alarms. Only 4 states record if a building was covered by specific fire safety regulations. Therefore there is limited scope to assess the extent or role of regulatory compliance in fires. However, 11 states record the item first ignited and 9 record the material mainly responsible for a fire. Therefore, there is scope to investigate using inter-state data, the role of regulated items such as furniture, furnishings and electrical products. 17 states record the cause of fire. Again this would provide a basis for a reasonable level of trans national research, although the categories may need to be aligned.
There is scope to compare fatalities between the 16 states that collect data on firefighter deaths during operations, 17 recording deaths on route to fires, 14 during training and 12 when on other duties. The composition of fire services varies greatly between states, particularly the ratio of full time to part time, retained and volunteer fire fighters. There were 15 states where the reporting of each category of firefighter matched the reporting of the number of firefighters. Therefore, there could be scope to compare firefighter fatality rates between these states, both for all types of firefighters and for each sub-category. It may be difficult to include the number of fires as a weighting factor due to the problems in producing comparable rates of fire for each state.
The main report provides an outline of options on how to make comparisons of existing data and/or how to increase the consistency of data collected by states. The main options include change reporting systems within states to produce more consistent data, or limiting comparisons to those items of existing data that are consistent, or applying correction factors to existing data to adjust for inconsistencies. It was recommended that the EU Fire Safety Network considers these options and how best to progress this work.
This study has confirmed the difficulties in comparing current fire data between member states and mapped out the differences in reporting practices. Such comparisons could be used to inform the development of fire safety interventions and to evaluate the impact of current interventions. Respondents expressed support for developing comparable datasets and this report has identified

6
where there is more scope for this. The findings from this study also indicate that reconciling current data would be a significant task.
The discussions with key stakeholders identified a number of organisations that could be asked to help take this work forward. These included:
• Eurostat;
• DG Sanco of the European Commission; and
• World Health Organization.
It was recommended that the EU Fire Safety Network contact one or more of these organisations with the aim of securing their involvement in progressing this work.

1
1 INTRODUCTION
1.1 Background to the work
The Department for Communities and Local Government has noted that:
“There is little consistency in how statistics are obtained and recorded from country to country. The European Commission have been taking a closer interest in the issue of statistics, specifically with respect to fire safety in hotels. However, systems for fire statistics still vary and are being developed in increasing numbers of member countries to give more input on policies such as fire prevention topics….. Further to the lack of consistency, there are notable omissions in the gathering of statistics. ”
Key organisations such as the Federation of the European Union Fire Officer Associations have suggested there is need to improve consistency across Europe in fire and rescue statistics to help make evidence based assessments on strategies.
The EU Fire Safety Network1 has explored2 the issue of fire statistics. They noted that:
“The main use is within the states as a tool to find ways to improve fire safety. Many states have already good systems that are improved continually.”
“Within the Network we use these statistics to compare problems and for benchmarking when we have similarities.”
A study reported by the Estonian members surveyed, through the forum, how fire deaths are described across the network members. A series of issues were noted, including that definitions of fire deaths differ, whilst some countries may only report fire deaths outside of work and some states may not collect data at a national level. Some states might report fire deaths in buildings only, other might report fire deaths in vehicles and other places. Some may include murder and suicide, others may exclude them. The network suggested that work in this area should progress in small steps and build on what is currently available, such as data on fire deaths.
Therefore the EU Fire Safety Network agreed that a study is needed to look at what data is collated, what comparisons this data enables, what gaps exist and how the situation might be improved. DCLG commissioned this study, as its contribution, with the aim of better understanding and comparing fire data in member European countries.
The terms of reference of the study were to compare and contrast the issues listed below for data on fires, injuries and fatalities (including firefighter injuries and fatalities):
• availability of data; • definitions of key statistics and differences between countries’ definitions; • organisation and relationship of authorities involved in fire statistics, and each one’s role and
responsibility for gathering recording and transmitting data; • collation and analysis of details including contributory factors and lessons learned; • how statistics are disseminated (publications, databases, websites etc); • each country’s own assessment of relative and absolute levels of data quality and completeness, and
any key issues of data quality, how data could be improved, and key barriers to improvement; • what are the data used for and by whom; • any current development initiatives on fire, injury and fatality statistics (including firefighters),
whether planned or underway, with completion dates;

2
1.2 Approach to the work
1.2.1 Stage 1: Literature review
Aims and scope of literature review
The aim of this literature review was to identify:
• Previous, current or future reviews of fire, injury and fatality statistics;
• Work on/or review on the collection of statistics on fire-fighter fatalities across Europe;
• Review any existing work on the compilation of European statistics; and
• Identify future developments in the area of fire statistics.
The scope of the review included the following:
All 27 European Union competent authorities with regards to data collection and gathering;
• All available reviews of fire, injury and fatality statistics;
• The availability of data (primarily online but also hard copies);
• Any points made for the comparison of data across EU member states; and
• Uses for the data.
Further to this, the review helped to:
• To summarise previous findings as an aim in itself; and
• To help develop an online questionnaire for completion by EU member competent bodies.
Searches and sources
Information collected for this review was obtained from material publically available online and through data provided by member state organisations.
Information was obtained via online sources, either through available publications gathered through web- searching, direct from fire organisation/statistic websites or provided directly by stakeholder organisations. The sources where information was gathered from included the following:
• World Health Organisation (WHO);
• World Fire Statistics Centre (WFSC);
• European Fire Safety Network;
• International Technical Committee for the Prevention and Extinction of Fire (CTIF);
• Geneva Association;
• Federation of European Union Fire Officer Associations;
• Alliance for Consumer Fire Safety in Europe (ACFSE);
• The Finnish Association of Fire Chiefs;
• European Fire Academy;
1 The EU Fire Safety Network was set up with the support and welcome of the Commission’s Civil Protection Unit and the Committee for the Action Programme for and the Community Mechanism in the field of Civil Protection under the aegis of the Civil Protection Committee. It has members from 23 states. 2 See minutes of http://www.raddningsverket.se/upload/SRSA/EU/fire%20safety%20network/Document%20Fire%20safety%20Networ k/Minutes/2008‐11%20Minutes.pdf

3
• Netherlands Institute for Safety (NIBRA);
• Reduced Ignition Propensity (RIP) Coalition;
• European Network for Safety Among Elderly;
• Joint Research Centre; and
• NordStat.
In terms of web searching we typically searched for publications and documents using the following phrases:
• “Fire statistics in Europe”;
• “European studies of fire statistics”;
• “EU Fire statistics comparison”;
• “Firefighter fatalities”;
• “Fire safety“
The results of the literature review are summarised in section 2.

4
1.2.2 Stage 2: Stakeholder consultation
The stakeholder consultation consulted stakeholder organisations to elicit their information and reporting requirements for cross Europe data comparison. It also established each of the organisations roles and responsibilities for gathering, recording and transmitting data.
A total of seven in depth telephone interviews have been undertaken with the following organisations:
• International Technical Committee for the Prevention and Extinction of Fire (CTIF);
• EU Fire Academy;
• Federation of British Fire Organisations (FOBFO);
• Federation of the European Union Fire Officer Association (FEU);
• Chief Fire Officers Association Scotland (CFOAS);
• World Fire Statistics Centre; and
• EU Fire Safety Network.
Attempts were also made to contact the World Health Organization (WHO) and Eurostat – however both were unable to participate in the study.
WHO stated that they are mainly concerned with data on the outcomes of fire exposures (i.e. burns-related hospital discharges or deaths), and not with the frequency, extent or nature of fires or their cost and impact, and thus were unable to contribute. They noted that they would be able to provide comment on the public health perspective of fires however this was outside of the scope of the study.
With regards to Eurostat, it was stated that fire statistics are not collected by the organisation, and hence, they too were unable to take part.
The stakeholder interviews are summarised in section 3 of this report.
1.2.3 Online survey
The online survey was disseminated to all member states of the EU Fire Safety Network, and aimed to ascertain information on the types of fire data recorded by relevant authorities and agencies. In particular the survey explored whether data on fatal fires, non fatal fires, deliberate and accidental fires etc was compiled at a national level in member states.
The full results to the survey are shown in 7 Appendix B and are summarised in section 4.
Design of the questionnaire
The findings from the literature review and the stakeholder consultation identified a number of issues that were considered during the development of the online survey. The online questionnaire was sent out to each of the 23 member states and responses were analysed and compared between all states.
Key areas for consideration in development of the online survey questions included:
• Variations in the definition and recording of fires across European member states (for example in the Netherlands fire deaths are only recorded when the death is confirmed at the scene);
• Inconsistencies in the collection of national fire statistics within each member state (e.g. in Germany fire services in individual regions retain a large measure of independence and therefore may limit the availability of national data);
• Suggested information to be included within a European fire database or cross comparison exercise:
• Fire Service resources, structure and size, and any changes in these;
• Numbers of calls received/attended by the Fire Service, broken down by type of emergency (fire, vehicle accident, chemical spill, flood, medical, false alarm, etc.);

5
• More detailed information about a sample of fires of particular interest, including data on causation, spread, evacuation, etc;
• Numbers of fires in motor vehicles, broken down by vehicle type (motor cars, heavy goods vehicles, light goods vehicles, public transport vehicles);
• Estimates of the wider financial and environmental effects of: o Major individual fires; and o Fire at the national level.
• Statistics of release of hazardous materials related to fire, particularly arising from transport accidents;
• Usage of portable fire appliances/fixed hose reels/fixed extinguishing systems, including reasons for use, plus additional details when used for fire fighting. e.g. whether fire brigade called, any casualties, time from discovery to extinction, etc;
• Installation and usage of smoke alarms: breakdown between battery-operated and permanent wired systems; and
• Statistics on evacuation and the spread of fire in buildings (suggested by academia).
• Reporting of comparative European data without description on the definition of fire measures (e.g. defining what is meant by a fire casualty);
• The definition of firefighter deaths is inconsistent across Europe and this data is not collected by all European countries;
• Variation in the information sources used to gather data across Europe;
• Variation in quality of data across Europe;
• Member States note that the priority for fire data to be standardised and collected across Europe including:
o Definition of fire deaths;
o Number of fire deaths;
o Type of casualty (e.g. age of casualty);
o Location of the fire.
Development, Testing and Dissemination of the questionnaire
The online survey was developed in PHP (Pre-Hypertext Protocol) and combined with a MySQL (Standard Query Language) database, used for storing and recording all user inputs. The database held information in text, date and time and numeric formats and allowed for free text insertion in response to specific questions. The survey was accessible through all major web-browsers such as Firefox, Internet Explorer and Google Chrome.
With regards to the content of the survey, Greenstreet Berman ensured that the terminology and language used was clear and concise – as the majority of users may have had English as a second language.
The survey went through several rounds of internal testing, with Greenstreet Berman piloting the survey to ensure that all functionalities were in working order before going live, the key elements which were tested included:
• Registration – users are able to register and sent confirmation emails;
• Login and passwords – ensuring that users are able to continually log in and logout with passwords;
• Data capture – ensuring that user responses are saved (whenever the user saves progress on the survey); and

6
• User interface testing – ensuring tick boxes, text boxes etc worked correctly.
On agreement to participate (registration), each respondent was provided with a user name, password and email instructions to complete the survey.
Following the testing phase, the survey went ‘live’ and was disseminated to potential users in 2010. With regards to dissemination a mixed approach was used, whereby potential respondents were sourced through contacts provided by DCLG, the EU Fire Safety Network and through internet searches carried out by Greenstreet Berman. Where internet searches were unsuccessful in providing a named individual, Greenstreet Berman called relevant departments and agencies to identify correct individuals to approach; this included contacting a range of EU countries such as Malta, Cyprus, Italy, and Portugal.
Respondents to the online survey
The respondents to this study were identified through contacts from the European Fire Safety Network. It is important to note that two of the respondents said that they were not the main organisation for publishing data in their state and one was unsure. In one case the researchers identified national data on the number and causes of fire deaths when the respondent stated that such data was not available. Therefore, it was possible that some respondents declared that data was not collected in their state, when another organisation did collect such data.
24 organisations completed the questionnaire in full. The organisations that responded to this survey were:
• Beredskabsstyrelsen (Danish Emergency Management Agency- DEMA);
• Emergency Services College (Finland);
• Directorate for Civil Protection and Emergency Planning- DSB (Norway);
• Ministry of Interior, Fire and Rescue Service (Czech Republic);
• Swedish Civil Contingencies Agency (Sweden);
• Department of the Environment, Heritage and Local Government (Ireland);
• State Fire Service Headquarter (Poland);
• National Directorate General for Disaster Management (Hungary);
• Statistics Netherlands3;
• Fire and Rescue Department, Ministry of the Interior (Lithuania);
• Ministere de l'interieur (France);
• Iceland Fire Authority;
• Austrian Federal Fire Brigade Federation (Austria);
• National Fire Safety and Civil Protection Services (Bulgaria);
• Department for Communities and Local Government (UK);
• Department of Supervision Crisis Management (Estonia);
• Deutsche Feuerwehrverband - German Firefighter Association– (Germany);
• Ministry of Interior, Fire and Rescue Corps (Slovakia);
• Greek Fire Corps (Greece);
• Ministero dell'Interno (Italy);
• Inspection des Services d'Incendie (Belgium);
3 Statistics Netherlands is responsible for collecting, processing and publishing statistics and data in the Netherlands

7
• Dirrecion General de Proteccion Civil y Emergencias (Spain);
• The Statistical Service of Cyprus4; and
• Division l'incendie et de sauvetage (Luxembourg).
Statistical Services from Malta and Romania did not complete the survey but responded by stating that they did not collect any data. Furthermore, Slovenia provided information on statistics collected at a national level, however did not complete the online survey. In Slovenia data collection is organised at two levels:
• By the regional centre (the notification centre report); and
• The head of emergency response (the head of emergency response’s report on the emergency response).
The type of data collected across these two levels include (amongst others): location, date & time, consequences (i.e. death, injuries and damage), number of firefighters involved, type of fire, origin of fire, cause of fire etc.
Proviso
A response was not received from Portugal. The response from Spain was provided from a civil defence organisation who replied that local fire data may be collected by municipal organisations. It was also uncertain whether the responses from Germany or Austria reflected reporting arrangements by all organisations in these states. In addition, whilst the response from Ireland stated that data was not recorded on fire deaths, the researchers identified a government report on fire deaths in the home in Ireland that was produced using national statistic5s. Therefore, there was uncertainty about the responses from four of those respondents that replied to the survey in full, namely Ireland, Germany, Austria and Spain. Thus, whilst the total number of online survey respondents was 24 (with three more stating they do not collect anything), there were uncertainties about four of these.
4 The Statistical Service is the competent authority responsible for the compilation and the publication of most of the official statistical data in Cyprus. 5 Data on all fire deaths (Age, place, type of premise, gender, cause, smoke alarms and causes of fire in Ireland is published online by the Irish Department of the Environment at http://www.environ.ie/en/Publications/StatisticsandRegularPublications/FireandEmergencyServices/

8
2 REVIEW OF LITERATURE
2.1 Introduction
The aim of this literature review was to identify:
• Previous, current or future reviews of fire, injury and fatality statistics;
• Work on/or review on the collection of statistics on fire-fighter fatalities across Europe;
• Review any existing work on the compilation of European statistics; and
• Identify future developments in the area of fire statistics.
The scope of the review included the following:
• All 27 European Union competent authorities with regards to data collection and gathering;
• All available reviews of fire, injury and fatality statistics;
• The availability of data (primarily online but also hard copies);
• Any points made for the comparison of data across EU member states; and
• Uses for the data.
Further to this, the review helped to:
• To summarise previous findings as an aim in itself; and
• To help develop an online questionnaire for completion by EU member competent bodies.
Below are summaries of relevant literature explored as part of the literature review for this project.
2.2 Augsburg core group6
Below is a summary of the Augsburg core group study, which was a joint Federation of European Union Fire Officers Associations (FEU) and World Fire Statistics Centre project exploring European fire statistics.
This study was one of few publically available studies which looked into the potential development of consistent European fire statistics. The study ended in 2005, with no follow-up being seen. The FEU, the joint sponsors, expected that the newly formed EU Fire Safety Network would take the area of fire statistics forward in the future, as well as the study noted above.
Federation of European Union Fire Officers Associations / World Fire Statistics Centre Seminar (Augsburg, June 2000)7
A fire safety initiatives workshop in April 1999 organised by Cheshire Fire and Rescue Service on behalf of the then Chief and Assistant Chief Fire Officers Association (CACFOA) and the Federation of European Union Fire Officers Associations (FEU), identified the need for better and more coherent European Fire Statistics. As a result the World Fire Statistics Centre (WFSC), offered to approach the Geneva Association 8for financial support for a seminar to take this topic further.
Accordingly, as part of the Federation of European Union Fire Officers Associations (FEU) annual conference in June the following year (in Augsburg) a half-day seminar on European fire statistics was held. It was agreed that the creation of a core group to identify the main purpose and components of a European fire database would meet the needs of the main groups of likely users (of statistics). The core group consisted of the following agencies:
6 Report provided by Tony Paish, World Fire Statistics Centre 24/02/2010 7 Report provided by Tony Paish, World Fire Statistics Centre 24/02/2010 8 www.genevaassociation.org

9
• Berlin Fire Department;
• Hereford & Worcester Fire Authority;
• Association of British Insurers;
• Confederation of Fire Protection Associations – Europe;
• Fire Protection Association;
• UK Home Office (later: Office of the Deputy Prime Minister, now: DCLG);
• Fire Industry Confederation;
• Universiteit Gent, Laboratorium voor Aanwending der Brandstoffen en Warmteoverdracht; and
• British Automatic Sprinkler Association.
A questionnaire was developed which identified the types of statistics that core group members currently collected as well as “additional statistics” that they would find useful. Replies to the questionnaire were received from respondents representing academia, fire brigades, fire insurers, fire protection associations, and fire equipment suppliers. Below are the main findings of the questionnaire9.
The study identified that most relevant fire statistics are collected by the national Fire Services, which may then be analysed and published by respective national Government Departments. However, in countries such as Germany, Fire Services of individual regions or municipalities retain a large measure of independence; which in turn means the extent of the relevant statistics available at the national level may be limited. The study recommended that for such countries, a more realistic immediate objective may be to extend the coverage of the relevant national data, with the projected content of a Europe-wide data base providing a norm to which to work.
The study also recognised the following subcategories against which the incidence of fire can be measured against:
• Population - broken down by: region, city, age, gender etc;
• Numbers of buildings - broken down by: usage (e.g. dwellings, restaurants), floor area, numbers of floors, number of sprinklers, quality of building maintenance; and
• Number of chemical industry sites.
With regards to additional data, user groups commonly identified obtaining data which would help them in their specific fields of operation. In particular, fire insurers, fire protection associations and fire equipment suppliers all seek better data on the installation, use and performance of various types of fire protection measures. In contrast fire services stated that they would appreciate the availability of detailed data needed to construct causal models for use in comparing the effectiveness of different fire services across EU member states. Factors for inclusion in such a model included:
• Method of alerting the fire brigade, e.g. telephone call, fire alarm, etc;
• Time call received at call handling centre;
• Time fire brigade dispatched;
• Number of fire appliances and “specials” (e.g. aerials) dispatched;
• Time first appliance in attendance;
• Type of property involved (construction, use, etc);
• Was fire confined to room of origin? If not, extent of spread in sq metres and number of rooms o Affected on the same floor level.
9 Consolidated responses to the questionnaire to the Augsburg core group 2000, WFSC 2005

10 Information provided by Tarvi Ojala, Estonian Ministry of the Interior, 26/02/2010
9
• Was fire confined to floor of origin? If not, extent of spread (number of floors affected);
• Was fire confined to building of origin? If not, the number of buildings affected;
• Use of room of origin/building of origin; and
• Was building fitted with sprinklers and/or a fire detection system? If so, did they activate?
Further to this other additional information which it was suggested should be included on a European fire data base included:
• Fire Service resources, structure and size, and any changes in these;
• Numbers of calls received/attended by the Fire Service, broken down by type of emergency (fire, vehicle accident, chemical spill, flood, medical, false alarm, etc.);
• More detailed information about a sample of fires of particular interest, including data on causation, spread, evacuation, etc;
• Numbers of fires in motor vehicles, broken down by vehicle type (motor cars, heavy goods vehicles, light goods vehicles, public transport vehicles);
• Estimates of the wider financial and environmental effects of: o Major individual fires; and o Fire at the national level.
• Statistics of release of hazardous materials related to fire, particularly arising from transport accidents;
• Usage of portable fire appliances/fixed hose reels/fixed extinguishing systems, including reasons for use, plus additional details when used for fire fighting. e.g. whether fire brigade called, any casualties, time from discovery to extinction, etc;
• Installation and usage of smoke alarms: breakdown between battery-operated and permanent wired systems; and
• Statistics on evacuation and the spread of fire in buildings (suggested by academia).
For statistics which are currently collected responses were seen from:
• Office of the Deputy Prime Minister – UK;
• Berlin Fire Department – Germany;
• Hereford & Worcester Fire Authority – UK;
• Association of British Insurers - UK
• International Technical Committee for the Prevention and Extinction of Fire (CTIF);
• Fire Protection Association – UK;
• Fire Industry Confederation – UK; and
• British Automatic Sprinkler Association – UK.
For full results of what is collected please see Appendix A at section 6.
2.3 Estonian Ministry of the Interior study10
The Estonian Ministry of the Interior undertook a study where member states were surveyed through a forum which looked into how fire deaths are described across the EU fire safety network members.

10
As part of the study, the Estonian ministry were able to collect data from 11 European countries including:
• Estonia;
• Latvia;
• Lithuania;
• Finland;
• Hungary;
• UK;
• Netherlands;
• Denmark;
• Sweden;
• Czech Republic;
• Sweden; and
• Norway (not an EU member state).
As part of the study, the information below for the above countries was collected11, however, this data was not necessarily comparable as different member states use different definitions.
• The definition of fire fatality – including information on whether:
o A person has been killed in an explosion;
o There was a traffic accident with fire and a person passed away because of fire?
o A person died because of the consequence arson?
o Suicide.
• Time elapsed from death e.g. few days or month after the fire – is this considered as a fire fatality? Specifically including information on:
o How long is that period in your country from the extinguishing of fire until the death of person?
• Information on who collects or records statistics about fatal fires; including:
o Type of analysis undertaken.
Further to the above information being collected, in May 2008 the Estonian Ministry of the Interior presented to the EU fire safety network on fatal fire casualties, in particular looking at issues such as differences in definitions, inclusion of explosions, car accidents, suicides, who collects data etc. Following on from the presentation it was agreed that a more detailed questionnaire with proposals of unification would be developed – however this was not taken any further.
2.4 Scottish community fire safety study (SCFSS)12
As a result of the Scottish fire service annual report in 2007-2008, which reported a 62% rise in fire deaths (from the previous year) and the view that Scotland suffers a higher number of fire deaths, casualties and injuries compared to other parts of the UK and Europe, the SCFSS were commissioned to explore issues such as:
• Key reasons why Scotland faces disproportionately high number of primary fires, fire deaths, and casualties compared to other parts of the UK and Europe?
• Key reasons why Scotland suffers increasing number of secondary fires;
• What initiatives are in place to combat these [above] issues; and
• How can good practice be implemented?
11 Some member states did not provide information for all elements of the survey. 12 Scotland Together pp.48-50, Fire Magazine, Pavilion, March 2010

11
Findings
The Scottish community fire safety study concluded that the differences in terms of fires, deaths etc from other parts of the UK and Europe were due to varied and inconsistent ways in which fire data is defined and recorded across Europe. For example as part of the study it was identified that the Netherlands Fire and Rescue Service, often only recorded when the death is confirmed at the scene. Casualties moved from dwellings, who die in a workplace incident or in medical care or those who die in road traffic collisions are not recorded as fire deaths.
As a result of the inconsistent recording mechanisms it was felt that comparisons between countries could not be made.
2.5 Assorted studies
Below is a series of studies that have discussed or used fire statistics. They illustrate examples of data that is available.
2.5.1 Fire investigation methods and lessons learned from fires and other relevant incidents13
The report recognised previous work14 which stated that statistics and facts around fires are essential for all nations in their work on fire prevention. It was also determined that fire brigade statistics are only one source of input alongside many others. Another important source of information are fire investigation programmes, which provide important details that are essential when improvements are suggested, for example on products and fire standards. The report recommended national systems to collate and disseminate facts.
2.5.2 Cigarettes
A survey of 14 member states and Norway carried out by the European Commission found that identified 11,000 fires caused by smoking causing € 13 million of material damage, 1,600 injuries and 520 deaths each year15. The report did not mention whether data for each member state was aligned.
2.5.3 Consumer fire safety: European statistics and potential fire safety measures16
The Consumer Council, Austrian Standards Institute, commissioned the Netherlands Institute for Safety (NIBRA) to conduct a research study on consumer fire safety. The report provides data for causes of all domestic fires for the UK and the Netherlands and causes of fatal domestic fires in the UK, Sweden, Denmark and the Netherlands. The causes of fire were categorised in the following ways:
• Intentional fire;
• Smoking;
• Cooking;
• Use of candles;
• Electric appliance;
13 Fire investigation methods and lessons learned from fires and other relevant incidents, Swedish Rescue Agency, 2005 14 Prevention of fires and other incidents. Report and recommendation, 2004 The project was carried out as
a part of the Civil Protection Unit within the Community Action Programme in the field of civil protection (2000-2004) 15 Vogelsang J, European Commission Presentation to Harvard School of Public Health December 2006 16 Consumer fire safety: European statistics and potential fire safety measures, http://www.nordstat.netN January 2009

12
• Use of a heating appliance;
• Imprudence;
• Playing with fire; and
• Other.
In addition to this, the report also collates data from the Netherlands on Smoke detector presence and performance.
Further to this NIBRA17 have also compiled statistics on the annual number of fire fatalities for all EU and non EU countries – however no description on definitions of fatalities or whether definitions have been aligned has been provided.
2.5.4 Forest fires
The United Nations Economic Commission for Europe18 collects information for the total number of forest fires. Their 2002 timber bulletin data for 26 EU member states (no data for Malta) provided seen, with information on the total number of forest fires from 1991 to 2001. In addition the data is categorised by:
• Area burned by type of land;
• Number of fires by known and unknown causes; and
• Number of fires by negligence.
Further to this the statistics also use common definitions for: forest, high forest, coniferous, broadleaved, coppice and other wooded land which have been taken from FAO/ECE Forest Resource Assessment 2000. No information however is provided on definitions of forest fire or other land.
The Joint Research Centre (JRC) Report ‘Forest Fires in Europe 2007’19 also provides data on forest fires for several EU states (17 in total), in addition to EU candidate countries Croatia and Turkey. Data is typically provided per country on number of fires, region, and size of area affected (burnt).
2.5.5 NordStat20
Nordstat.net contains statistics related to fires, building fires and fire deaths categorised according to gender, age, month (date), cause of fire and scene of fire. The data is based on reports from various sources, though mainly from fire brigades.
The resource collects data for Denmark, Sweden and Finland (in addition to Iceland and Norway), and collects the following information:
• Turnouts (for building fires and non building fires) e.g. Number of fires, Accidents and False calls;
• Causes of fire e.g. Smoking, Electrical causes, Wrong use of electrical equipment (cooking), Wrong use of electrical equipment (other), Candles, Deliberate (Arson, suicide, child playing with fire), Explosion, Incautiousness open fire and Chimney fire (lack of maintenance etc);
• Scene of fire e.g. Block of flats, House, Summerhouse, Health and social services, Other public building, Industrial building, Other building and Building (unknown);
• Scene of the fire (non-building) e.g. Car, Other road vehicle, Container, Ship/boat/train/Aeroplane, Terrain and Other non-building fire;
17 Fire Statistics Europe, NIBRA 18 United Nations, Timber Bulletin, Forest fire statistics, Volume LV (2002), No. 4 19 Forest Fires in Europe 2007, The Joint Research Centre 20 http://www.nordstat.net

13
• Month; and
• Fire deaths e.g. age, gender, scene of fire and cause of fire.
The online resource compiles and compares the above statistics using the following definitions, which are consistent across the three member states:
• Fire deaths (Death from accidents caused by fire and flame): In order to be categorised as a fire death, death must have occurred within 30 days of the fire incident;
• Electrical causes: Faults in electrical systems etc;
• Wrong use of electrical equipment (cooking): Incorrect use of electrical equipment during cooking;
• Wrong use of electrical equipment (other): Incorrect use of electrical equipment apart from wrong use of electrical equipment (cooking);
• House: Includes detached houses, terraced/semi detached houses;
• Summer House: Includes houses which are not the primary address of the household;
• Health and social services: Includes hospitals, residential homes, kindergartens etc; and
• Other buildings: Includes industrial buildings and other public buildings apart from health and social services.
Further to this consistent definitions are seen for number of fires, accidents: number of environmental and traffic accidents, blind calls and false calls.
2.5.6 Miscellaneous
Baltic sea countries
Estonia, Lithuania, Latvia, Finland and Sweden collect data on the listed below factors, however no attempt has been made to align definitions and this means it is not possible to truly compare the data21.
• Number of fires;
• Human losses/children among them;
• Traumatized;
• Rescued in fires;
• Number of rescue operations (fires excluded); and
• Number of inhabitants in country.
Finland
Finland collects fire statistics on22:
• Gender;
• Time e.g. month, evening;
• Cause of fire;
• Deliberate or accidental;
• Region;
• Location of fire;
21 Information provided by Kirsi Rajaniemi from EU Fire Safety Network 22 Kokki, E (2008), Fatal fires investigated by rescue departments 2007 – Presentation, Emergency Services College

14
• Smoke alarm (present, working);
• Employment status; and
• Marital status.
Hungary
Hungary collect data on cause of fire, as below23:
• Electrical power;
• Explosion;
• Open flame;
• Self-ignition;
• Technological failure;
• Heating equipment;
• Smoking;
• Other; and
• Unknown. 2.6 Eurofeu survey24
A joint survey into the use of portable fire extinguishers in the UK was recently undertaken by the Fire Extinguishing Trades Association (FETA) and the Independent Fire Engineering & Distributors Association (IFEDA).
The report provides statistics on: total number of incidents reported, type of fire, location, cause of fire, type of extinguisher used whether it was operated by a trained staff member. The following countries participated in the survey, however the definitions with regards to the statistics collected were not provided:
• UK;
• Austria;
• Netherlands;
• Germany;
• France; and
• Belgium. 2.7 Consumer Council
The Consumer Council, Austrian Standards Institute, commissioned the Netherlands Institute for Safety (NIBRA) to conduct a research study on consumer fire safety. With regards to European statistics the report noted that “Comparing the fire statistics of one country with the statistics of another country should be carried out with great care, since there are no European standards for gathering, analyzing and publicizing data on fire statistics” 25.
23 EU fire safety network annual report 2004. 24 Report on a Survey into Portable Fire Extinguishers and their use in the United Kingdom and other member countries of Eurofeu, March 2003 [http://www.ifeda.org/surveyreport.pdf]. 25 Consumer fire safety: European statistics and potential fire safety measures, NIBRA January 2009

15
The report also identifies that “There are no European standards for gathering, analyzing and publicizing data on fire statistics”, and thus making comparisons between countries can prove to be difficult.
2.8 CTIF
The International Technical Committee for the Prevention and Extinction of Fire (CTIF) – World Fire Statistics 2006, Report 11 report provides fire statistics for countries and cities around the world for 2003- 2004. As highlighted below, it can be argued that the differences in terms of the number of country’s are contributing to the report, suggest that gaps in information and data exist on fire statistics. No information regarding whether the definitions were comparable was provided.
The statistics for 2003 contain data from 31 countries and 24 cities. The statistics for 2004 contain data from 33 countries and 33 cities. Data for EU member states varies depends on the year (2003 or 2004) and the indicator as well, however common comparisons have been made for the following areas:
• Fire deaths: data was collected for Germany, France, UK, Poland, Greece, Czech Republic, Sweden, Austria, Slovakia, Ireland, Lithuania, Latvia and Estonia in 2003 and Germany, France, UK, Poland, Greece, Hungary, Bulgaria, Sweden, Slovakia, Ireland, Lithuania, Latvia, Slovenia and Estonia in 2004. The following information is collected.
o Average deaths;
o Vehicle fire deaths
• Emergency calls by type of emergency. Data was collected for Austria, Czech Republic, Estonia., France, Greece, Ireland, Latvia, Lithuania, Poland, Sweden, UK in 2003 and Bulgaria, Estonia, Finland, France, Germany, Greece, Hungary, Ireland, Latvia, Lithuania, Poland, Sweden and UK in 2004. The report provides data on the ratio of emergency calls to:
o Total calls made;
o Fires;
o Incident/accidents;
o Technical aid;
o Medical aid; and
o False calls.
• Distribution of fire by occurrence e.g. origin of fire. In 2003 data was collected for Austria, Estonia, France, Greece, Ireland, Latvia, Lithuania, Poland, Sweden and UK. In 2004 data was seen for Bulgaria, Estonia, Finland, France, Greece, Hungary, Ireland, Latvia, Lithuania, Poland, Sweden and UK. The data collected included the following:
o Structure fires;
o Chimneys;
o Out of buildings;
o Vehicle;
o Forests;
o Grass; and
o Rubbish.
• Vehicle fires data was collected for France, Poland, Greece, Sweden, Ireland, Lithuania, Latvia and Estonia in 2003 and France, Poland, Sweden, Finland, Latvia, Estonia, Lithuania, Slovenia, Greece, UK, Hungary and Bulgaria in 2004.

16
• Distribution of fire by means of extinguishing. Data was collected for Austria, Estonia and Poland in 2003 and only Finland and Poland in 2004.
o Before arrival of fire units;
o Small equipments;
o 1, 2 3 or more jets;
o Foam jets; and
o Powder jets.
• Fire-fighter deaths: in 2003 data was collected for France, Poland. Sweden, Austria, Estonia, Latvia, , Ireland, Lithuania and Greece. In 2004 data on fire-fighter deaths were collected for Germany, France, Poland, UK, Bulgaria, Sweden, Finland, Lithuania, Slovenia, Latvia, Greece, Estonia, Ireland and Hungary. No country attempts to estimate fire-fighter deaths resulting from long-term chronic exposure to toxic smoke from fires.
• Economic cost of fire: the report provides statistical data provided on the “cost” of fire as a percentage of GDP is presented. Relevant countries include Poland, Slovenia, Czech Republic, Finland, UK, France, Germany, Italy, Sweden, and Denmark.
2.9 European fire safety network: Annual reports26
The annual reports from the European fire safety networks collect statistics from EU member states (for those responding) on the following:
• Number of fire brigades;
• Number of fires in buildings;
• Number of fatal fires;
• Number of fatalities;
• Number of fire injuries;
• Property losses; and
• Number of buildings subject to fire inspections.
In total 17 member states submitted information for the 2004 report, 12 for the 2006 report and 10 for the 2008 report. It must be also noted that Norway submitted information to the reports and are part of the EU fire safety network, despite not officially being members of the EU. Greenstreet Berman do not have reports for 2005 and 2007. Nine member states have not contributed at any stage to the annual reports, they are: Belgium, Cyprus, Ireland, Italy, Spain, Slovakia, Romania, Luxembourg and Malta.
The reports also asked for member states to provide definitions of what exactly they record for number of fatal fires and fatalities; number of injuries and property losses. Only a minority of EU member states responded. For those who have responded, differences in terms of definitions (such as fatal fires etc) are seen. Further to this, data gaps are seen throughout for EU member states. Table 1 below provides details of the definitions in use for member states.
26 Reports Provided by Kirsi Rajaniemi, EU Fire Safety Network

17
Table 1 - Definitions of fatalities, injuries and property losses (European Fire Safety Network Annual Reports)
Country
Fatal fires and fatalities
Injuries
Property losses
Austria
Number of fatalities from all types of fires.
Number of fatalities from all types of fires.
No information available
Czech
includes building fires
includes building fires
No information available Denmark
Includes fatalities by the following causes: smoking, electrical defects, arsons, suicide, car fires and home accidents with open fire and electrical appliances.
No information available
Residential and business sector
Estonia
No information available
No information available
No information available Finland
Includes all fire deaths within 30 days of the incident. Arsons and other criminal acts are included as well as suicides. Traffic accidents are not included.
Needing medical care or care.
No information available
France
No information available
No information available
No information available
Germany
Number of fatalities from all types of fire:
Number of injuries of all kinds of fire
No information available Greece
Reports on fire fatalities, casualties or losses are submitted by the incident commander for internal Fire Service statistical purposes and refer to any casualties or fatalities known at the moment (by the end of the incident). No follow-up for the casualties, except by the interrogations department for legal purposes only.
Differentiation between urban and forest fire injuries
No information available

18
Country
Fatal fires and fatalities
Injuries
Property losses Hungary
Number of fires and technical rescues in buildings
Include injuries during technical rescues
Estimated value of loss during fires and engineering rescues
Latvia
No information available
No information available
This includes: in case the lost property was insured – all insurance losses; in case the lost property was not insured – property losses are estimated according to owner’s information.
Norway
The figures refer to all fatal fires, regardless of type
No information available
Insurance losses, registered by (approx. all) insurance companies
Poland
No information available
No information available
total property losses assessed by fire-fighters during operations:
Portugal
Urban fire
Urban fire and industrial fire
No information available
Slovenia
Differentiate, forest, building and traffic
Differentiate, forest, building and traffic
No information available Sweden
This is all fatal fires regardless of type, building, vehicle etc.
This is from fire brigade reports
Differentiate between Home and business loss
UK
Deaths from fire in all incidents attended by fire and rescue services
Injuries from fire in all incidents attended by fire and rescue services
Covers all types of cost associated with incidents attended by the fire and rescue service
Lithuania
No information available
No information available
No information available
Netherlands
No information available
No information available
No information available Bulgaria
No information available
No information available
Directory General Fire Safety and Saving doesn’t dispose with financial information of the losses

19
2.10 World Health Organisation
In June 2009 WHO have collected and processed data for 24 EU member states on accidental deaths from smoke, fire and flames, and also in a separate table by actual and suspected homicide or suicide. The data is available on a country by country basis and is categorised by gender, age and year, but excludes deaths arising from transport accidents. The data is collected through the death registration process from death certificates. It must be noted that data is not provided for all member states for all years. Countries where no available data is apparent are for the following27:
• Cyprus;
• Luxembourg; and
• Malta. 2.11 WFSC Survey
The aim of the World Fire Statistics Centre is to persuade governments to adopt strategies aimed at reducing the cost of fire28. No information on whether definitions were comparable were provided.
International information on fire statistics are published annually on the WFSC website (Geneva Association). In general the statistics include data on the following:
• Direct fire losses29 in millions (Japan – Billions) – the information is also expressed as a percentage of GDP however no information on how this is calculated is provided;
• Indirect fire losses in millions (Japan – Billions) – the information is also expressed as a percentage of GDP however no information on how this is calculated is provided;
• Fire deaths;
• Fire injuries;
• Cost of fire fighting organisations (average percentage of GDP);
• Cost of fire insurance administration (average percentage of GDP);
• Cost of fire protection to buildings;
• Fire brigades e.g. private, public etc; and
• Fire insurance.
Respondents to the survey vary year on year and by category type (above) and do not at present capture information from all 27 EU member states. However in the 2008 report it was noted that the following countries had contributed to all surveys, these being Denmark, Finland, France, Norway, UK and Sweden (in addition to USA and Japan). In addition the Czech Republic, Germany, Italy, the Netherlands and Poland have participated in many years of enquiries over the past two decades. The WFSC annual Fire Statistics Questionnaire and the WFSC annual report to the UNECE Committee on Housing & Land Management provide more detail on data sources, definitions and comparability.
27 Based upon data held by Greenstreet Berman Ltd. 28 World Fire Statistics, Information Bulletin of the World Fire Statistics, Issue 19 October 2003 29Fire losses include explosion losses following fires, but exclude explosion loss where no fire occurs e.g. acts of terrorism

34 EU fire safety network meeting, November 2008
20
2.12 Estonian Ministry of the Interior30
The Estonian Ministry of the Interior identified a number of different types of fire deaths, these included the following:
• Death is caused by fire or explosive burning;
• Death is caused by fire (CO-poisoning or burns);
• Death is caused by fire or flames;
• Death is caused by fire, high temperature, burning products effect, construction collapse and other factors in the place of the event;
• Death is in connection with the fire; and
• Death occurred on the site of fire. 2.13 EU fire safety network: Bimonthly meeting minutes
The EU fire safety network is a group of national governmental fire agencies who implement rules on fire safety, statistics and fire research results.
In May 2005 the EU fire safety network minutes noted that “different definitions of fire deaths used by different members, this view was reiterated in later network meetings as well (e.g. UK 2008). It was thought to be very difficult to get agreement on definitions within a country and much too ambitious to try to agree definitions across the EU Fire Safety Network”31 – further to this network members suggested that consistent definitions were not essential. Exploring trends was noted as being more important. However the need for reliable statistics on fatal fires was reiterated in the following meeting in Warsaw32.
In addition to this, during the network meeting in Prague 2007, general discussion in relation to the importance of obtaining realistic statistics from network members was again expressed. One member stated that “there is no consistency in how statistics are obtained/recorded from country to country and suggested that unless the Commission produces legislation that will force counties to provide common statistics, countries will continue to do their own thing”33.
With regards to statistics however, members of the network suggested that they can give the most reliable figures on fire deaths and other fire statistics e.g. fire injuries.
2.14 What is needed to ensure consistent data is collected?
During the EU fire safety meeting in November 200834 some members suggested that the only way in which to ensure that common data is collected is to introduce new legislation at EU level to ensure that all member states collect data in a standardised format.
30Ojala, T; Who is a fatal fire casualty? Estonian Ministry of Interior 2008 31 EU fire safety network, Frankfurt, 30-31 May 2005 32 EU fire safety network, Warsaw, 1-2 December 2005 33 EU fire safety network, Prague, 31 May to 1 June 2007

21
2.15 Future developments
The Estonian Ministry of the Interior in their report35 in 2008 stated that they will prepare a detailed questionnaire with proposals of unification (of data) – however we have been unable to locate this.
2.16 European Fire Academy
In mid 2009, the European Fire Academy held workshops with a total of 35 participants from 10 member states. As part of the workshop one of the key areas of focus was on statistics. During the meeting, the working group acknowledged that no reliable fire statistics are available for Europe36.
To address the issue of insufficient fire statistics, the group agreed upon the following objectives:
• Compare who investigates fire causes in fire services across Europe;
• Gain an overview of how data is collected within member states;
• Collaborate with the European Burns Casualties Association in identifying available statistics;
• Understand electrical sources of fires; and
• Communicate the results of fire cause investigation to DG SANCO.
In order to work towards achieving the above objectives the following actions were agreed by the working group:
• Create and distribute to European Fire Academy member fire brigades a questionnaire enquiring organisation of fire investigation in the fire brigades, the main causes of fires and how data are collected in member states;
• Determine a sampling approach for future studies;
• Analyse data on fires of electrical causes available from the London Fire Brigade, Merseyside Fire & Rescue Service and Amsterdam Fire Service; and
• Cooperate with other fire brigades across Europe in obtaining information on fire causes.
The questionnaire as noted above was due to be sent in June 2009, with the working group establishing a deadline of September 2009 for the return of questionnaires to ensure that a comparative analysis of the results could be presented at the next European Fire Academy roundtable in November 2009. The results of the questionnaires are not yet publically available.
35 Ojala, T; Who is a fatal fire casualty? Estonian Ministry of Interior 2008 36 European Fire Academy Roundtable London, 13 – 14 May 2009

22
2.17 Additional Information Following completion of the report, additional comment was received from the World Fire Statistics Centre and a number of documents which may be of interest were highlighted. These are included for the benefit of those who may wish to build on this work in the future but did not inform this report.
• Studies on the estimation of the economic cost of fire in England and Wales, commissioned by the Home Office and successor government departments including DCLG, published in 1997,2001,2003,2005, 2006,and 2011
• “The socio-economic cost of fire in Denmark”, published in 2001 by the Danish Emergency Management Agency
• A study on “International Fire Statistics and the Potential Benefits of Fire Counter Measures” for the European Flame Retardants Association, published by the University of Surrey Polymer Research Centre in February 2006
• A succession of annual reports on “The Total Cost of Fire in the United States” produced since 1981 by Dr. John Hall of the US National Fire Protection Association
• A report on the total cost of fire in Canada by Phil Schaenman and others (TriData Corpn) for the National Research Council of Canada, published in 1991.

23
3 STAKEHOLDER INTERVIEWS
3.1 Introduction
The stakeholder interviews consulted with organisations that have an interest in European fire statistics to elicit information and reporting requirements for cross Europe data comparison. It also established each of the organisations roles and responsibilities for gathering, recording and transmitting data.
Seven in depth telephone interviews were undertaken with the following organisations:
• International Technical Committee for the Prevention and Extinction of Fire (CTIF);
• EU Fire Academy;
• Federation of British Fire Organisations (FOBFO);
• Federation of the European Union Fire Officer Association (FEU);
• Chief Fire Officers Association Scotland (CFOAS);
• World Fire Statistics Centre; and
• EU Fire Safety Network.
3.2 Roles and responsibilities
3.2.1 Purpose of organisation and role regarding fire statistics
Respondents commonly stated a wide range of roles and purposes of their organisations interviewed, these included the following:
• Raise consumer/manufacturer awareness on fire hazards (EU Fire Academy);
• Collection and analysis of statistical data and dissemination of statistical of reports (International Technical Committee for the Prevention and Extinction of Fire - CTIF);
• Umbrella organisation for major UK fire agencies and organisations (Federation of British Fire Organisations - FOBFO);
• Collection, analysis and dissemination of world fire statistics (World Fire Statistics Centre – WFSC);
• Provision of feedback to government on fire performance and input into community safety strategy (CFOAS);
• Umbrella organisation, allowing stakeholder organisation to network, develop and share information (Federation of the European Union Fire Officer Association - FEU); and
• Network, share knowledge and information (EU Fire Safety Network).
With regards to the role of organisations relating to fire statistics respondents reiterated that they collate, analyse and share information regarding statistics.
3.2.2 Who holds statistics on fire and who is responsible / or has ownership for this data?
Mixed responses were seen with regards to the fire data held. The EU fire academy for example stated that they simply collate data from other countries and do not have ownership for this information – they

24
also stated that there is limited data to collate other than from the UK and Netherlands. In addition to this, FOBFO and the EU fire safety network also stated that they rely on statistics provided by relevant agencies (e.g. fire services, fire safety organisations, government departments etc) and do not have ownership for this. CFOAS reported that statistics are collected by fire services in Scotland and then provided to them.
Some organisations however stated that they have ownership for the data they hold, these included the following:
• International Technical Committee for the Prevention and Extinction of Fire (CTIF);
• World Fire Statistics Centre (WFSC); and
• Federation of the European Union Fire Officer Association (FEU).
Further to this, the FEU noted that within the UK, Department for Communities and Local Government (DCLG) and Association of British Insurers (ABI) have ownership for the data that they hold. .
3.2.3 How is the data distributed and to whom?
With regards to the distribution of the data, mixed responses were again seen. The data was reported to be used for:
• Lobbying EU parliament and fire services on fire trends (EU fire academy);
• Disseminating information to UN committee and relevant stakeholders (WFSC);
• Publishing data online via website (FEU);
• Disseminating to national government (CFOAS) to inform national strategies;
• Producing annual report based on data provided by member states joined to network (EU fire safety network); and
• Disseminating data to national committees of CTIF (CTIF).
Further to this, CFOAS stated that they also distribute data internally to inform the community fire safety strategy (with regards to fire prevention etc).
3.2.4 How often is data updated and who provides the updates?
Data is typically updated each year, with the updates being provided by those having ownership for the data. The FEU noted that they hold additional data to that held by CLG, but are also provided updated data by Department for Communities and Local Government.
In addition to this, CFOAS stated that they update data daily for their own internal use. 3.2.5 Do you collaborate with other agencies when collecting or reporting fire statistics?
Agencies which respondents stated that they collaborate with included the following:
• Obtain data from fire services – EU fire academy;
• Collaborate with World Health Organization regarding latest data - WFSC;

25
• Collaborate informally with emergency service e.g. police, ambulance etc regarding latest data - FEU;
• Collaborate with a ‘partnership unit’ which includes: Police, teachers, NHS, community planning, housing department, building control – CFOAS;
• Collaborate with WFSC regarding latest statistics – CTIF; and
• Collaborate with government agencies and others e.g. CTIF, FEU regarding latest fire statistics – EU fire safety network.
3.3 Scope of data collected
3.3.1 What are the key differences in the fire data available from EU states?
Respondents identified a number of key differences with regards to fire data currently available, with the following being cited:
• As a volunteer fire service in Germany, one respondent suggested that recording processes here would not be as stringent as in countries where a professional fire service is seen;
• New EU member states do not have consistent data collection systems;
• Differences in definition of:
o Fires;
o Fire deaths;
o Fire injuries;
o Firefighter deaths and injury;
o Causes of fires.
In addition to this, the WFSC stated that data availability varies widely across EU member states, with this partly as a result of how data is shared and accessed from different organisations within a country. The respondent also reiterated that several countries (e.g. Germany, Spain, France etc) have no central source for statistics whilst Denmark use newspaper reports as one source to obtain statistics. The WFSC also stated that particularly with regard to fires in the home, many fires are not attended by the fire brigades and are therefore not included in fire incident reports. Indeed, previous research in the UK has highlighted that only 22% of fires in the home are attended by the Fire and Rescue Service. CFOAS also stated that inconsistencies with reporting are also seen throughout Europe and cited the example of the Netherlands where fire deaths are only included if victim is dead at scene of fire.
3.3.2 How does the definition of the following points differ between EU member states?
Respondents were unable to provide specific details in which definitions of the below points differ between countries, however recognised that they did. Below are detailed findings from respondents.
3.3.3 What is a fire death
Respondents stated that the definition of a fire death differs considerably across EU member states, and may often vary from country to country respondents however we unaware of specific examples from different EU states regarding what a fire death is. Respondents also provided the following points:

26
• CTIF defined fire death as “A person whose death is attributed to a fire is counted as a fatality even if the death occurred days, weeks or months later”.
• The EU fire academy noted that defining a fire death is difficult for example “in the UK … follow up injuries that relate to fatalities is defined as a fire death… this is not seen across the EU”. This respondent however noted that most member states record the number of fatalities, irrespective of whether a consistent definition is seen.
• FOBFO delegate stated that “definitions are patchy [across EU member states] as well as recording being arbitrary e.g. non reporting by police in some states”.
• WFSC stated that gaps [in definition] are seen even within the UK, however noted that fire deaths are defined [in UK only] by fire fatalities attended by Local Authority fire service – and does not include those attended by the military.
• The EU fire safety network also stated that definitions of fire death differs across all countries and that it is difficult to establish what is included within a definition for a given member state.
What is counted as a fire casualty
Respondents stated that the definition of a fire casualty differs considerably across EU member states, and may often vary from country to country respondents however we unaware of specific examples from different EU states regarding what is counted as a fire casualty. Respondents also provided the following points:
EU fire academy stated that differences in definition across EU member states was seen, although they were unable to elaborate further.
WFSC suggested that in the UK a fire casualty is counted by those injured and in hospital. The respondent also stated that the fire service should follow up injuries up to a year later but resources are not available to do this.
Are rescues from fire recorded – what is counted as a rescue?
CTIF stated that rescues of people or animals are recorded. Other respondents stated that this may vary from country to country, depending on the recording processes in place - respondents however were unaware of specific examples from different EU states.
What is a home?
Respondents stated that the definition of a home differs considerably across EU member states, and may often vary from country to country - respondents however were unaware of specific examples from different EU states regarding what a home is.
CTIF however defined home as a “house for residence”.
Whether deaths in road traffic collisions (that are due to a fire in the accident) are counted as fire deaths or as a road traffic accident death?
Respondents stated that the recording of deaths in road traffic collisions due to a fire in an accident, as a fire statistic or a road traffic accident varies from country to country – respondents however were unaware of specific examples from different EU states regarding whether RTC deaths are counted as a fire death or road traffic death (when a fire is seen).

27
What is a fire-fighter death
The EU fire academy respondent stated that this data does exist in some states however definitions again vary depending on who collects the information e.g. government, fire service etc. The respondent also noted that in most circumstances, only multiple or ‘novel’ i.e. out of the ordinary deaths would be investigated.
CTIF noted that firefighter death includes fatalities whilst on duty or in training.
Other differences in the definitions used by member states when reporting fires?
In general respondents stated that they were not aware of any other differences in definitions, although some stated that other differences may still exist.
3.3.4 What information source is the count of fires for EU states based upon?
Respondents stated that the information source varies from country to country and can include:
• Newspaper reports (Denmark);
• National/government statistics;
• Municipal/provincial statistics;
• Insurance information; and
• Fire service statistics.
No specific examples from EU member states, regarding the sources of information were provided. 3.3.5 Do some member states report the number of fires without stating the types of fires
included?
Respondents stated that in terms of recording detail of fires e.g. what type they are, this again varies from country to country – depending on a country’s recording processes, with some recording this information, whilst others do not. Respondents in general were unable to state which EU countries record this data or and which do not.
3.3.6 Are there “quality” problems with fire data in some EU member states?
Respondents stated that quality of data varies considerably from country to country. The EU fire academy noted that the UK, Netherlands, Poland and Nordic countries were best case examples of where the quality of data collected is good. Further to this, CFOAS also recognised that the quality of data within the UK is good in terms of accuracy and that there are no omissions or errors for these statistics.
Further to this, the respondent from the WFSC stated that ‘in some countries there seems to be political pressure to get lower figures for the estimated adjustments, previously agreed with the WFSC, to the officially sourced figures of fire deaths and/or injuries, thus compromising the validity of these data when published by the WFSC.’
Further to this, the EU fire safety network noted that where there is no dedicated governmental statistics department or organisation this also compromises the quality of data. The respondent also noted that establishing such a system would be very expensive to set up and run, in countries where this is currently

28
not in place. 3.3.7 Are there some states which do not compile fire data at a national level?
Respondents stated that there are a number of countries that do not compile data at a national level. These countries include: Germany, France, Italy, Spain, and Austria.
In these countries, statistics are often collected by fire services at a municipal or provincial level. 3.4 Use of statistics
3.4.1 How are fire statistics used in Europe?
Respondents in the main, stated that statistics are used to track and inform policy and recognise potential consumer related issues e.g. problems with furniture. Further to this, it was also noted that statistics are used to compare deaths, number of fires etc between countries; although no specific examples were provided.
In addition to this, the EU fire safety network also noted that statistics can also be used to make decisions on the number of fire engines, location of fire stations etc. Moreover, it was suggested that in countries where “good” systems of recording are seen, statistics can be used to “push through legislation” – no examples however were provided on this.
CTIF noted that statistics are also used to explore historical trends in fire in Europe and to evaluate the impact of fire safety law and schemes.
3.4.2 Who are the key audiences for and users of European fire statistics?
Respondents stated the following groups as being key audiences and users of European statistics:
• Member state government;
• Academia;
• Insurance;
• Fire services;
• Fire protection industry;
• Consumer safety agencies;
• Various interest/lobby groups; and
• Politicians. 3.5 Future of statistics
3.5.1 Feasibility of common reporting
To what extent do you think it would be a) feasible b) beneficial for all EU member states to provide and record against common fire definitions, perhaps for a core set of incident

29
such as all fires in the home?
All respondents stated that it would be beneficial for all member states to provide and record against a common set of fire definitions. However with regards to feasibility, it was noted as being “extremely difficult” to put into practice.
The EU fire academy suggested that it may be “better” to establish what data is currently collected by EU member states and then use this accordingly. FOBFO stated that common definitions should be agreed by a core group of member states who have reliable data – this it was suggested would be more feasible to implement. FOBFO also suggested that it may be easier to get emerging countries to work towards common definitions rather than established ones, as it may be easier to change their systems.
In addition to this, the respondent from the EU fire safety network suggested that recording against common definitions would only be possible if EU legislation was implemented which “forced” member states to do this.
3.5.2 Priorities
What do you think would be the priorities with respect to helping to standardise fire statistics and what should be a minimum set of fire data that should be collated across Europe?
Respondents stated that a common definition of fire death should be worked towards by member states.
In addition to this, respondents suggested that the following information should be collected as a minimum:
• Number of fire deaths;
• Number of fires;
• Type of casualties e.g. old person, young person etc
• Location of fire.
In addition to the above, the respondent from CFOAS stated that the following areas also need to be developed further throughout Europe: accidental housing fires, social and economic background [in relation to fires], and alcohol and fire. Moreover it was also noted that a distinction between preventable and non preventable fire needs to be seen i.e. what constitutes each of these (non preventable and preventable), more detail on this topic needs to be seen.
3.5.3 Suggestions on standardisation
If a common approach was an aspiration, what proposals would your organisation have regarding the standardisation of reporting across Europe?
Respondents stated that the following should be included within standardised reporting:
• The types of fire incidents be reported on across Europe;
• The collection of details regarding an incident e.g. cause, costs, locations etc.;
• Firefighter fatalities.

30
FEU stated that performance information should be collected; this may for example include data on effectiveness of extinguishing fires.
3.5.4 What national or European organisations would need to be involved in improving
European fire statistics and what could they do?
In addition to CTIF and WFSC respondents also noted that the following agencies which should be involved in improving fire statistics, the agencies mentioned included:
• Eurostats – although they do not collect any fire statistics at present;
• DG Sanco – involved in public health and consumer safety and thus should be involved; DG Sanco aims to:
o Empower consumers
o Protect and improve human health
o Ensure food is safe and wholesome
o Protect the health of animals and plants
o Promote the humane treatment of animals
• World Health Organization – as they collate mortality rate/number of deaths/injuries through fire, smoke inhalation etc.
Respondents also noted that in countries where data is collected only at a municipal level, the Government of such countries should ensure that all data is sent on to the relevant central agency.
In addition to this, the EU fire safety network also noted that a change in culture would also be need to be seen, with regards to collecting information against common definitions e.g. collecting data at municipal level only. CFOAS noted that a gap analysis may need to be undertaken to identify who provides what data – this in turn may help to establish which other organisations need to be involved in the area.
3.5.5 Are you aware of any ongoing or planned changes in the collation of fire statistics in
Europe, if so what are they?
None of the respondents were aware of any ongoing or planned changes with regards to fire statistics.
CFOAS noted that they are taking the recommendations in the Scotland Together report forward – particularly those surrounding secondary fires, accidental fires in the home and fire and antisocial behaviour. In total there are 37 recommendations suggested within the report including the following (amongst others):
• Support the work of other European Union countries to share consistent information regarding the recording of fire statistics;
• Establishment of performance targets for Scottish Fire and Rescue Services in relation to fire casualties, injuries and all incidence of fire;
• Additional information is captured at fire incidents, particularly in relation to contributory factors;

31
3.6 Other
Respondents noted that the motivation to collect data against common definitions is present; however it remains difficult to implement. The respondent from the EU fire academy suggested that the information currently being collected needs to be explored further, with statistics being compared accordingly as a result of this. The respondent suggested that “it would not be possible to come up with a brand new set of definitions and use them to capture data”.

32
4 SURVEY: KEY RESULTS
4.1 Introduction
The online survey was disseminated to all member states of the EU Fire Safety Network, and aimed to ascertain information on the types of fire data recorded by relevant authorities and agencies. In particular the survey explored whether data on fatal fires, non fatal fires, deliberate and accidental fires etc was compiled at a national level in member states.
Appendix 7 provides a detailed presentation of the results from the survey, with the questionnaire shown in Appendix 8. This section of the report highlights some of the key findings regarding what is collected and the extent to which data is comparable between states.
It should be noted that the respondents from Malta and Slovenia indicated that data is not collected, whilst Portugal and Romania did not complete the survey and the response from Spain was limited to outdoor fires. Therefore, in most cases the analysis is focused on the 24 states that completed the online questionnaire, with proportions calculated out of 24 respondents (unless otherwise stated). In some cases one or two respondents did not answer a specific questions, causing the number of respondents to vary slightly between questions.
4.2 Users and uses of fire data
According to the responses from the 24 states that completed the online questionnaire, the four main users of information were:
• The responding organisations (96% of the 24 respondents) who were a mixture of fire service organisations, government departments and national statistics organisations;
• Fire services in 21 states (84% of 24 respondents);
• The government and the public in 19 states (77% of 24 respondents).
40% of the 24 survey respondents indicated that insurers, research agencies, academia and regulators also use the data.
The respondents analyse fire data to inform policy, share lessons and raise awareness of fire. Indeed, of those 24 states that completed the online questionnaire, the top four uses were:
• 88% of respondents use fire data to inform government policy;
• 80% to raise awareness of trends;
• 75% to develop strategies to prevent fires and deaths;
• 73% to evaluate fire service performance.
4.3 Sources and levels of data
The main sources of data were the fire service (21 states), followed by police (10 states), national organisations such as regulators and agencies (9 states), health service (9 states), insurers (9 states) and occasional surveys (9 states). Most states used more than one source of data.
54% of the respondents (13 out of 24 respondents) said they publish data annually with another 29% publishing monthly data (7 out of 24 respondents). 87% of states publish data on the internet (20 out of 24 respondents), 91% in annual reports (21 out of 24 respondents) with a further 7 respondents (out of 24)

33
using online databases for publication (28%). In most cases data is published for the nation as a whole (79% of respondents – 19 out of 24 states) and per fire service (68% - 17 out of 24 respondents), with 58% (14 out of 24 respondents) also reporting at a regional level and some at a local level such as towns and cities (46% - 11 out of 24 respondents).
4.4 Consistency in recording
4.4.1 Overview
In most states (19 out of 24 states– 79% of respondents) reporting of fires by the fire service is mandatory and most of these states have guidance on reporting (14 out of 24 states) and lists to use when coding fires (20 out of 24 states) but only 8 out of 24 states have some form of Quality Assurance standard for use by fire services against which to report fires. 71% (17 out of 24 states) of those states that report fire data said the standard of reporting was satisfactory or better, with 25% (6 out of 24 states) saying it was poor. Nine states reported they were making changes to the reporting of fire data in their countries.
Fourteen states reported that they record all types of fires, deaths and non fatal fire casualties, with another four (Luxembourg, Denmark, Hungary, Ireland) also reporting all forms of fire deaths but not fires. Poland said they report accidental fire deaths only.
A more detail assessment of consistency is given below for fire deaths, non fatal casualties and fires.
4.4.2 Consistency in recording fire deaths
Table 2 summarises the reporting of fire deaths. These results are based on the responses to the online survey and emailed clarifications from some respondents. The table is split by greyed rows. Those states presented between greyed rows have broadly similar ways of reporting fire deaths. Thus, those states that whose total count of fire deaths appeared to be produced in a broadly similar way were grouped as follows:
• UK, France, Sweden, Luxemburg and Poland;
• Norway, Holland, Iceland, Czech, Cyprus, Denmark and Estonia;
• Slovakia, Italy, Belgium and Bulgaria;
• Lithuania and Finland;
• Greece and Ireland;
• Hungary, Austria and Germany.
With respect to fire deaths there are many examples of potential inconsistencies in recording, such as:
• Hungary only report deaths if within 72 hours of fire;
• Swedish fire deaths are collated from Board of Health data rather than from fire services (unlike other states);
• Belgium, Italy, Slovakia and Bulgaria include all deaths at fires, including where a person dies from natural causes prior to the fire – whilst most other states exclude these;
• It is uncertain which types of deaths are included in Greece and Hungary, such as whether they exclude deaths unrelated to the fire;
• Czech, Holland, Poland, Norway, Denmark, Cyprus and Iceland exclude deaths due to attempting to escape from a fire, such as jumping from a window.

34
In addition, whilst eleven states restrict “home” to houses and flats, with ten others recording sub- categories that include houses and flats. Therefore, to get a comparable measure of fire deaths in the home would require most states to sub-divide their data and extract those deaths in the ‘home’.
Figure 1 shows the proportion of respondents that include each of the types of fire deaths in their count of fire deaths. Varied response rates (N=24 or 23) were seen in recording fire deaths with as one respondent not providing a response for ‘none of the above’.
As noted, practices vary. As highlighted the majority of member states include ‘Accidental fire death’ as a sub category, followed by deliberate fire death and suicide. Very few respondents recorded death unrelated to a fire.
Figure 1: Fire death sub-categories included by states in count of fire deaths (N = 24, (N=23 for ‘none of the above’ as one respondent left the question blank)
Time limit to the determination of a death from fire
Figure 2 shows the proportion of respondents that apply each time limit to the determination of a death from fire. In total 21 survey respondents provided a response to the question. Only 20% (4 out of 21 states) report death immediately (up to 72 hours) – however a total of 55% (11 out of 21 states) take between 1-3 months to report deaths.

35
Figure 2: Timeframe for reporting of fire deaths (within which death must occur to be defined as a fire death) N=21 as 3 organisations did not provide a response
The following groups appear to have broadly consistent methods of reporting fire deaths (in terms of timeframe within which a fire death is reported):
• Belgium, Spain and Hungary (Immediately);
• Denmark, Finland, Czech, Sweden, Bulgaria, (circa one month);
• Norway, Ireland, Netherlands (two to three months)
• Slovakia, Lithuania (No limits).
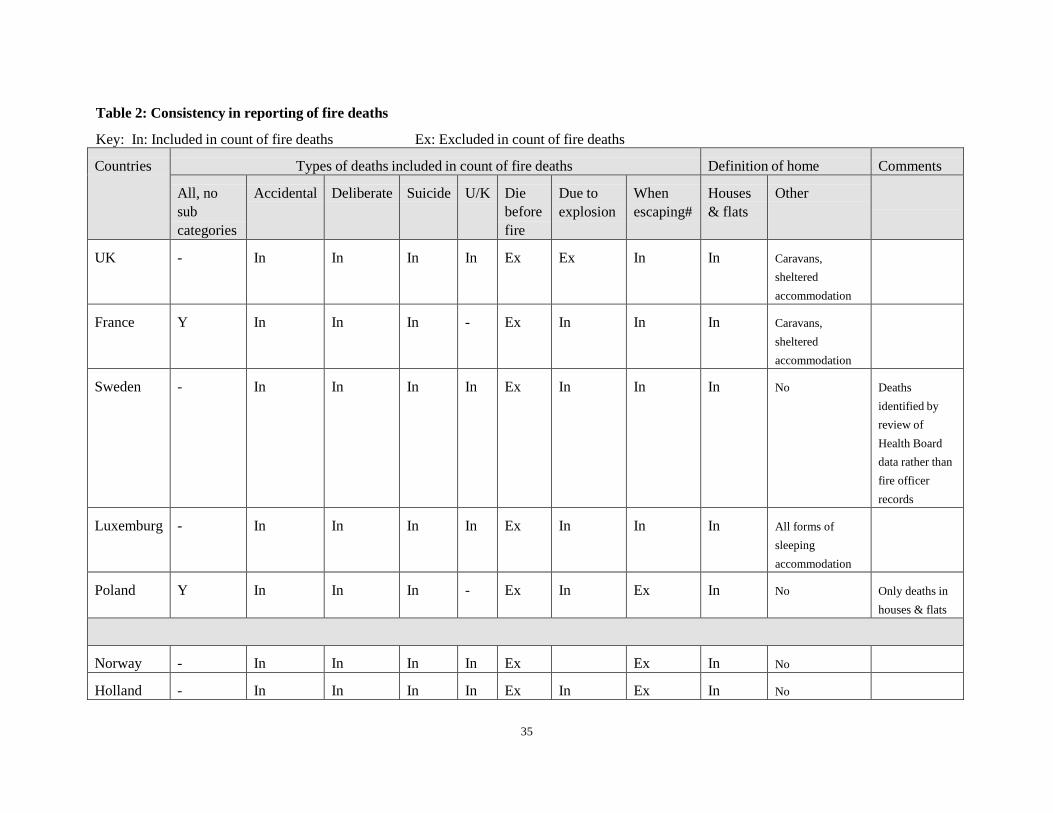
35
Table 2: Consistency in reporting of fire deaths
Key: In: Included in count of fire deaths Ex: Excluded in count of fire deaths
Countries
Types of deaths included in count of fire deaths
Definition of home
Comments
All, no sub categories
Accidental
Deliberate
Suicide
U/K
Die before fire
Due to explosion
When escaping#
Houses & flats
Other
UK
-
In
In
In
In
Ex
Ex
In
In
Caravans, sheltered accommodation
France
Y
In
In
In
-
Ex
In
In
In
Caravans, sheltered accommodation
Sweden
-
In
In
In
In
Ex
In
In
In
No
Deaths identified by review of Health Board data rather than fire officer records
Luxemburg
-
In
In
In
In
Ex
In
In
In
All forms of sleeping accommodation
Poland
Y
In
In
In
-
Ex
In
Ex
In
No
Only deaths in houses & flats
Norway
-
In
In
In
In
Ex
Ex
In
No
Holland
-
In
In
In
In
Ex
In
Ex
In
No
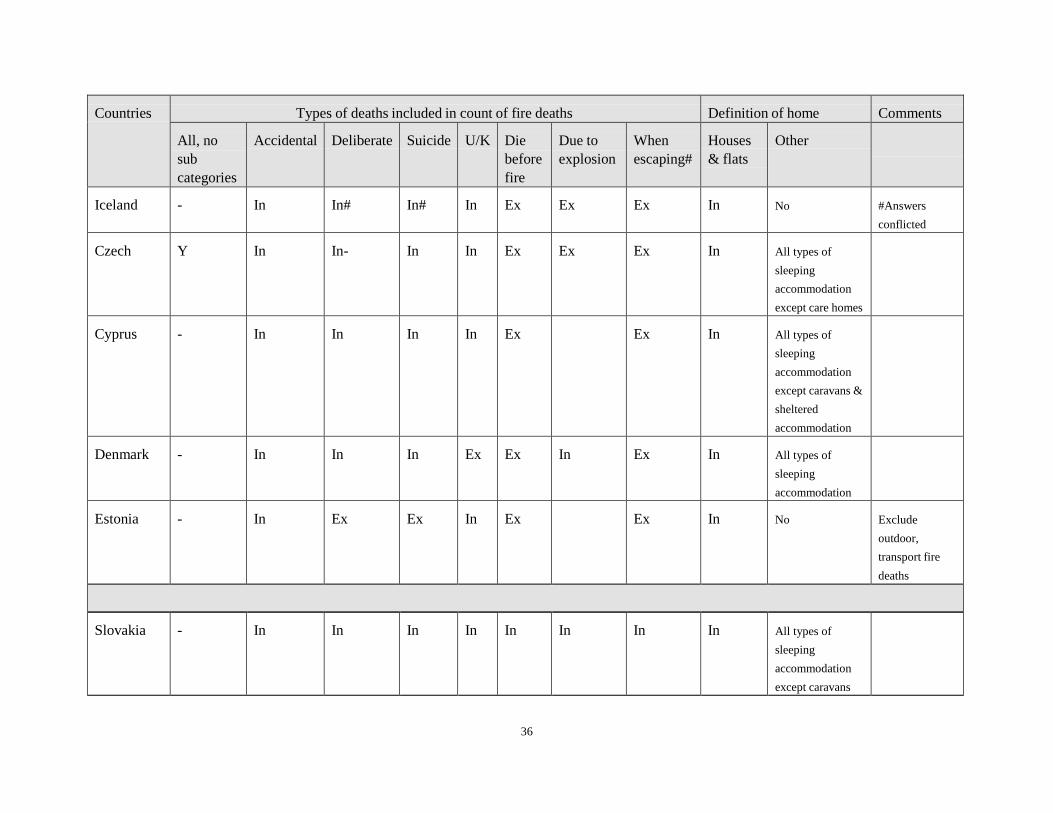
36
Countries
Types of deaths included in count of fire deaths
Definition of home
Comments
All, no sub categories
Accidental
Deliberate
Suicide
U/K
Die before fire
Due to explosion
When escaping#
Houses & flats
Other
Iceland
-
In
In#
In#
In
Ex
Ex
Ex
In
No
#Answers conflicted
Czech
Y
In
In-
In
In
Ex
Ex
Ex
In
All types of sleeping accommodation except care homes
Cyprus
-
In
In
In
In
Ex
Ex
In
All types of sleeping accommodation except caravans & sheltered accommodation
Denmark
-
In
In
In
Ex
Ex
In
Ex
In
All types of sleeping accommodation
Estonia
-
In
Ex
Ex
In
Ex
Ex
In
No
Exclude outdoor, transport fire deaths
Slovakia
-
In
In
In
In
In
In
In
In
All types of sleeping accommodation except caravans

37
Countries
Types of deaths included in count of fire deaths
Definition of home
Comments
All, no sub categories
Accidental
Deliberate
Suicide
U/K
Die before fire
Due to explosion
When escaping#
Houses & flats
Other
Italy
-
In
In
In
In
In
In
In
No response
All types of sleeping accommodation except care homes
Stated deaths in houses & flats fires not recorded
Belgium
-
In
In
In
In
In
In
In
In
No
Bulgaria
-
In
In
In
Ex
In
In
In
In
Also caravans & barracks
Lithuania
-
In
In
Ex
In
Ex
Ex
In
In
Also hotels, hostels, care home & barracks
Finland
-
In
In
Ex
In
Ex
Ex
In
In
No
Greece
-
In
In
In
In
-
-
-
Not collected
Nature of death not recorded
Ireland*
-
In
In
In
In
-
-
-
In
Also hotel, hospice, caravans & boarding schools
Nature of death not recorded
Hungary
Y
-
-
-
-
-
-
-
In
No
Only report deaths if within 72 hours of fire.

38
Countries
Types of deaths included in count of fire deaths
Definition of home
Comments
All, no sub categories
Accidental
Deliberate
Suicide
U/K
Die before fire
Due to explosion
When escaping#
Houses & flats
Other
Not all fires reported centrally or investigated
Austria
Y
-
-
-
-
-
-
-
In
No
Nature of death not recorded
Germany
Y
-
-
-
-
-
-
-
Unknown
Malta
Respondent said that no fire data is recorded
Slovenia
Respondent said that no fire data is recorded
Spain
Only responded on outdoor fires - Other fires recorded by Municipalities
Portugal
No response
Romania
No response
*Questionnaire declared that they only report fires but researchers found national statistical bulletin reporting fire deaths.
#This refers to where the person dies due to injuries received when escaping from a fire, such as jumping from a window. The person did not die from burns or smoke inhalation.

39
4.4.3 Consistency of recording fire injuries
Non- fatal injury
All 24 survey respondents provided a response to the question. Most states record whether non fatal injury involved burns or smoke inhalation, with 16 providing guidance on the criteria for recording injuries. However, only about 20% record sub-categories of injury, such as concussion or asphyxiation. Also, as shown in Figure 3, there was great variation in what types of injuries are included in the count of non fatal fire injuries, with ‘physical injury due to fire & first aid received’ And ‘smoke inhalation & first aid received’ being the most common.
Figure 3: Non-fatal fire injury categories
4.4.4 Consistency in recording fires
All states record the number of fires except for respondents from France, Malta and Slovenia. However, there were inconsistencies in the recording:
• Some exclude certain types of fires such as outdoor fires and fires in derelict buildings;
• Some (Holland, Estonia, Spain and Ireland) exclude fires the fire service was called to but was extinguished before their arrival;
• Some include fires in chimney as fires in buildings (Luxemburg, Italy, Norway, Sweden, Cyprus, Slovakia, Czech and Hungary) and other treat these as a separate category;
• Lithuania and Greece also include fires in the garden (that do not spread to the building) as a fire in a home.
16 states (90% of respondents who report fires) stated they sub-divide non residential fires into categories such as school, shop, hotel etc. However, the sub-categories used for buildings vary greatly between states, as per the examples in Table 3.
Whilst 84% of respondents include both grass land and forest in the count of outdoor fires, only 68% include rubbish and farmland fires (16 states).
As regards vehicle fires, 14 include derelict vehicle fires, 12 include fires in vehicles that were involved in a

40
road traffic accident and 17 where the vehicle was not being driven. In most cases states included all three categories of vehicle fires or none at all. Italy, Estonia, Slovakia, Lithuania and Ireland exclude fire in vehicles involved in road traffic accidents but include the other two types. Thus, there should be comparable data in about nine states.
Also, the sub-divisions used for recording the type of building differ greatly, making it difficult to compare counts of fire for each type of building. Examples of the sub-divisions are shown in Table 3
Thus, the overall counts of fire are not comparable between member states. As with data on fire deaths, it would be necessary to extract a sub-set of data to make valid comparisons between states.
Table 3: Examples of sub-divisions of building categories
Czech Republic: Buildings for health service, Buildings for services and personal hygiene, -Buildings for education, science and research, -Buildings for culture, education and sport, -Administration buildings, -Buildings for accommodation and recreation, -Buildings for trade and community feeding including handy warehouse and shop-window, -Buildings for social security, -Historic and religion buildings, -Buildings and halls for production and services -Energetic production buildings -Buildings for transport and telecommunications, -Parking objects -Buildings for storage (except agricultural), -Buildings for livestock production and plant production, -Buildings for storage of agriculture products, animal feed, fertilizer, - Buildings and objects under construction/reconstruction, -Abandoned and demolition buildings, -Building armed forces,
These buildings have additional subcategory. For an example building for education, science and research are divided in: -cinemas, -theatres, -houses of culture, -galleries and showrooms, museums, fairgrounds, - libraries, archives, -gymnasiums, sports halls, bathing pools (indoor), other buildings for education, science and research.
Finland Free-time residential buildings; Commercial buildings Wholesale and retail trade buildings; Shopping halls; Shops, department stores and shopping centres; Other wholesale and retail trade buildings; Hotel buildings
Norway The main categories include: 1. Detached house. Terrace house. Block/flat, 2. Vacation home, 3. Camping hut, Prefab., Garage, Aircraft, Ship, 4. Agriculture, hunting and Forestry, Fishing, 5. Mining and quarrying, 6. Manufacturing, /. Electricity, gas and water supply, 8. Construction, 9. Wholesale and retail trade, 10. Hotels and restaurants, 11. Transport, storage and communication, 12. Financial intermediation, Real estate, renting and business activities, 14. Public administration and defence, 15. Education, 16. Health and social work, 17. Other community social and personal service activities, 18. Other buildings. The list of detailed NACE (Nomenclature générale des activités économiques dans les Communautés Européennes’)codes can be find on this link below – NACE is the standard for classification of economic activities in the EU: http://www.ssb.no/emner/10/01/nace/sn2007/sn2007_engelsk.pdf
Sweden Shop, Hospital, Care of the elderly, Psychiatric care, Prison, Other care centre, Theatre/cinema/museum/library, Church etc, Restaurant/nightclub, Hotel/guest house, Military building, School, Youth club, Nursery school, Student hall, Sport facility.
Ireland Hospitals, Schools, Other Institutions, Factories, Chemical Plants, Storage Buildings / Warehouses, Shops / Supermarkets, Offices, Hotels/Guesthouses/Boarding Houses, Dance Halls/Discos/Cinemas/Theatres, Public Houses, Restaurants, Motor Vehicles, Unoccupied.
Poland Administrative offices, banks, education and science, in particular the teaching buildings, schools,

41
kindergartens, health professionals, especially hospitals, sanatoriums, retirement homes, clinics, nurseries, retail and services, particularly shops, department stores, food and beverage outlets, wholesalers, service establishments, passengers in communication, in particular bus and train stations, river ports and seaports, train stations, airports, entertainment and sports entertainment, worship, religious, museums, outdoor museums, exhibitions, galleries, libraries, archives, detention facilities, particularly prisons, houses of detention, correctional homes, other public utilities. Residential buildings subdivided into: hotels, night shelters; children's homes; boarding schools, dormitories; barracks; homes of pensioners; boarding houses, guest houses; shelters; other residential buildings, in particular, gazebos, caravans, cottages. Three production facilities further divided into: production buildings; outbuildings, including garages, without shelter; social facilities, particularly changing rooms, canteens; technological installations outside of buildings; machines and technological equipment; administrative areas; pipelines, transmission facilities between objects on-site and off-site transit. Warehouse buildings subdivided into: warehouses, sheds at the premises of production, stores, warehouses, bus shelters, freestanding warehouses, warehouses in facilities designed to accommodate people.
Hungary Hotel establishment, Healthcare, social establishment, Cultural and sport establishment, Educational establishment, Commercial, service establishment, Administrational, office establishment, Transportation establishment, Industrial, production.
Holland Prison, police cell, Lodging (hotel, hostel, Bed & Breakfast etc.), Office building, Education building (school, university etc.), Health care (hospital, doctor's office, Building used for manufacturing, agriculture, stock breeding, Station (train, bus etc.). Building of gathering (e.g. shopping mall, restaurant, cinema, theatre, day care centre etc.). Building being built/under construction. Vacant building. Building to be demolished
Lithuania Administrative buildings (banks, post office, offices etc.); Commercial buildings (shop, Shopping center, pharmacy, bookstore etc.); Service buildings (beauty salon, hairdresser, car service etc.); Dining buildings (dining room, restaurant, cafe, bar,
France School, Shop, Hotel, Cinema, Discotheque, Stadium, Library, Museum, restaurant, Hospital, Church, etc.
Iceland Industrial, public, agriculture, shops, offices, and also garbage bins, grass and outdoor fires.
Estonia Hotels, other accommodation and catering buildings. Office and administrative buildings. Trading and service buildings. Transport and communications buildings. Industrial and warehouse buildings. Entertainment, education, health care and other public buildings. Other non-residential buildings
Cyprus Store, Office, Church, Workshop, Factory, Restaurant, Theater / cinema, Shop, Cafeteria, Clinic, Farm, Government Building, Club, Engine room, Kindergarten, Hospital, Night Club, Hotel, Kiosk, School, Supermarket / fruit market, Electricity sub-station
Belgium Offices, care homes, schools, tourism, commercial, public.

42
4.5 Causes, circumstances of fire and fire safety systems
Three states said they do not report anything. Out of the 24 organisations responding to the online survey;
• The majority record:
o The type of building – 84% (20 of the 24 responding states) -
o Time/date of fire (76%, 18 out of 24);
o The cause of fire – 64% (15 out of 24);
• As regards the attributes of the casualties:
o A slight majority record age of casualties (56%, 13 states) and less than half record gender (44%, 11 states) and disability (44% 11 states);
o Only a small minority record items such as ethnicity (13%, 3 states), or nationality (8%, 2 states);
• A minority record the item first ignited (40%, 10), item mainly responsible for the fire (32%, 8), presence of hazardous materials (36%, 9 states) or how the call was made to the fire service (44%);
• A minority report presence of smoke alarms (40%, 10 states) (with only half of these recording the type of smoke alarm), or the presence of other types of fire safety systems such as sprinklers and extinguishers.
Thus, there is limited scope to compare data on the role of fire safety systems or materials involved in fires. There is more scope to compare causes of fires.
The majority of 24 states responding to the survey record the response of the fire service, such as time the fire service attended the incident and persons evacuated, with around 60% (14 states) also reporting items such as the equipment used.
Size and cost of fires
There is limited data on the size and cost of fires:
• 12 states said they record the cost of fire but only 6 use insurance claim data on the cost of fires and only 2 assess uninsured costs of fire;
• 4 states record if a fire safety regulation was breached;
• Only 3 states record the extent of smoke damage in m2 with 10 recording fire damage in m2. 4.6 Firefighter deaths
The states have been grouped according to their recording of firefighter deaths in Table 4. Whilst nine states said they do not record firefighter deaths, 19 did with:
• Seven recording all deaths except those off duty;
• Five recording all deaths including those on duty, and;
• Seven recording other combinations of occasions.
From Table 4 seventeen record firefighter deaths whilst at an incident or when on route to an incident. Most of those states that record firefighter deaths also record the causes of fatality (13 states) and the type of building involved (14 states).
The vast majority of states do record the number of fire engines and other types of emergency vehicles as well as the number of full time firefighters. Only three states (who report firefighter deaths) do not record the number of firefighters at all. Thus, there were potentially seventeen states that report firefighter deaths (at an incident) and the number of firefighters at an establishment.

43
Table 4: Do you collect data on firefighter deaths that occur? Please tick all that apply
Whilst at an incident having responded to an emergency telephone call
Whilst on route to an incident
Whilst on duty but not responding to an incident
Off Duty
Whilst on training
Do not collect data
Denmark
No
No
No
No
No
Norway
No
No
No
No
No
Sweden
No
No
No
No
No
Ireland
No
No
No
No
No
Cyprus
No
No
No
No
No
Belgium
No
No
No
No
No
Romania
No
No
No
No
No
Malta
No
No
No
No
No
Slovenia
No
No
No
No
No
All occasions except when off duty
Estonia
Yes
Yes
Yes
No
Yes
Austria
Yes
Yes
Yes
No
Yes
Lithuania
Yes
Yes
Yes
No
Yes
France
Yes
Yes
Yes
No
Yes
Iceland
Yes
Yes
Yes
No
Yes
Hungary
Yes
Yes
Yes
No
Yes
Luxembourg
Yes
Yes
Yes
No
Yes
All occasions
Greece
Yes
Yes
Yes
Yes
Yes
Slovakia
Yes
Yes
Yes
Yes
Yes
UK
Yes
Yes
Yes
Yes
Yes
Poland
Yes
Yes
Yes
Yes
Yes
Other combinations of occasions
Finland
Yes
Yes
No
No
No
Czech
No
Yes
Yes
No
Yes
Holland
Yes
No
No
No
No
Bulgaria
Yes
Yes
No
No
Yes
Germany
Yes
Yes
No
No
Yes
Spain
Yes
Yes
No
No
No
Italy
No
Yes
No
No
No

44
5 DISCUSSION AND CONCLUSIONS
5.1 Users and uses of fire data
The vast majority of states collect data at a national or state level and use this data to inform government policy, raise awareness of fire risk and develop interventions. The interviews and the online survey indicated that in the main, the role of the responding organisations were to:
• Raise awareness on the issue of fire statistics;
• Collect, analyse and disseminate information;
• Provide feedback to government on fire performance;
• Act as an umbrella body for stakeholder organisations; and
• Share information and knowledge.
Respondents stated that statistics are used to track and inform policy and recognise potential consumer related issues e.g. problems with furniture. Further to this, it was also noted that statistics are used to compare deaths, number of fires between countries, track and inform policy, and recognise consumer issues e.g. problems with furniture. In addition, respondents stated that key audiences and users of European statistics included, governments, academia, insurance companies, fire services, fire protection industry etc.
5.2 Comparability of data
The literature review indicated that there have been few comparisons of fire statistics across Europe. The literature review and the survey of member states indicated that fire statistics are typically collected by the national Fire Services, which may then be analysed and published by respective national Government Departments. However in some countries such as Germany, Fire Services of individual regions or municipalities retain a large measure of independence.
Attempts have previously been made to unify data which is available, however it must be recognised that such attempts have not managed to include statistics from all member states. Examples of the type of data which have been previously collated include:
• The definition of fire fatality – including information on whether:
o A person has been killed in an explosion;
o There was a traffic accident with fire and a person passed away because of fire?
o A person died due to the consequence of arson
o A person died due to the consequence of suicide.
• Time elapsed between fire and death e.g. few days or month after the fire and whether this is considered as a fire fatality? Specifically including information on:
o How long is that period in your country from the extinguishing of fire until the death of person?
• Information on who collects or records statistics about fatal fires;
• Turnouts (for building fires and non building fires) e.g. Number of fires, Accidents and False calls
• Cause of fire e.g. Smoking, Electrical causes, Wrong use of electrical equipment (cooking), Wrong use of electrical equipment (other), Candles, Deliberate (Arson, suicide, child playing with fire), Explosion, Incautiousness open fire and Chimney fire (lack of maintenance etc);
• Date of fire (by month); and
• Scene of fire (building and non building) e.g. Block of flats, House, Summerhouse, Health and social

45
services, Other public building, Industrial building, Other building and Building (unknown), Car, Other road vehicle, Container, Ship/boat/train/Aeroplane, Terrain and Other non-building fire.
The survey confirmed the feedback from the stakeholder interviews in that it shows there are many differences in the recording of fires, fire deaths and casualties between member states. This reduces the number of directly comparable datasets to just a few states. For data to be compared, it would be necessary to reconcile the range of fires included by each state. The detailed survey results would provide a basis on which states could determine how to align their data.
Whilst most states record key points such as the number of fires and deaths, recording of points such as type of injury, fire safety systems and size of fire is far more mixed and infrequent. Therefore, whilst there may be scope to align and compare overall rates of fire and death, there is less scope to compare other points.
5.3 Future of European fire statistics
5.3.1 Respondents’ view
All respondents suggested that it would be beneficial for all member states to provide and record against a common set of fire definitions. However with regards to feasibility, it was noted as being “extremely difficult” to put into practice. With regards to minimum levels of information to be collected, respondents suggested the following:
• Number of fire deaths;
• Number of fires;
• Type of casualties e.g. old person, young person etc;
• Location of fire.
• Injuries; and
• Cost of fire.
The implication of the online survey for comparing data between states is outlined below. We have indicated where there could be scope to develop comparable data and what this would require.
5.3.2 Fire deaths: researchers’ view
In order to compare counts of fire deaths the data need to include the same range of types of fire (accidental, deliberate, suicide and unknown), apply the same definitions of deaths (e.g. exclude deaths that occur before a fire and include those that occur within, for example, 3 months), include the same range of causes (burns, smoke, falls from a window), occur in the same range of locations (houses, vehicles, outdoors etc) and are identified through similar investigation / reporting procedures (such as by fire officers versus from health boards). Practices vary between states across many of these points.
There may be a number of options for developing a comparable set of fire fatality data, at least to enable comparison of the rates of fire death between states. It should be noted that some states do not record suicides or murder (by fire) as fire deaths, whilst others include people who died from other causes prior to the fire and some exclude people who die from injuries from (for example) jumping from a window to escape a fire. Any attempt to compare data would require datasets to be reconciled.
To develop completely comparable data on all types of fire deaths would require some states to change their policies, such as including suicides and deaths in car fires causes by road traffic collisions, and to require that all fatal fires are investigated. This would obviously incur major demands on resources.
Potential options that member states can adopt which would help avoid changes in reporting procedures would be to:
• Limit the comparison to accidental fire deaths in the home – defining this as flats and houses;

46
• Judge the proportion of occasions where people die and then a fire occurs, such as from a review of fatal fire investigation to determine the proportion of deaths that are found by coroners to be unrelated to the fire – and reduce the number of fires recorded by those states that currently include them by this amount;
• Calculate the proportion of fire deaths involving people escaping from a fire, such as from review of data in those states that include these and either add this proportion to other member states or delete these from those states that currently include them;
This would require member states to sub-divide their data. This would enable comparison between all states that collect data.
Another option would be to:
• Compare the total number of fire deaths in buildings;
• Exclude those states that do not record fire deaths in commercial or public property and exclude those that do not count deaths due to arson;
• Estimate the proportion due to suicide and add this to those states which do not record suicide fire deaths.
As many member states do not record fire deaths in road traffic collisions, a comparison of all fire deaths does not appear feasible at this moment without additional reporting within some states.
As 14 states record the age of victims and 11 record the gender, there is some scope for comparing fatality rates for each age and gender. As few states (3) record disability or ethnicity (2), there is little scope to assess the role of these factors in fire deaths using inter state data.
5.3.3 Fires and non fatal casualties: researchers’ view
The differences in the reporting of fires and non fatal casualties are greater than those for fire deaths. Therefore, whilst a similar approach could be adopted to producing comparable data on fires and non fatal casualties, the problems in reconciling data would be greater. This includes attempting to compare the rate of fire in the home, remembering that there are differences in the inclusion of chimney fires, fires in gardens and fires that are extinguished before the fire service arrives, as well as in the definition of the home. To compare the rate of fire in the home, it would need to have common treatment of chimney fires, garden fires, common definitions of the home and treatment of fires extinguished before arrival of the fire service.
As the definition of injury and the categories of injury vary between all states, there is little scope to compare the rate, types or severity of injury between states. A common set of categories would be needed before any form of comparison could be contemplated.
5.3.4 Fire safety systems, causes, costs of and size of fires: researchers’ view
Some states collect data on the size (10 states) of fires providing some scope to assess this along with the response of the fire services, such as response times. Few states record the cost of fires, with these mostly recording insured losses and only 2 considering uninsured and societal losses. Therefore, there is far less scope to develop transnational estimates of the cost of fire based on recorded data.
There appeared to be less scope to develop comparable data on the role of fire safety systems, such as sprinklers, although 12 states record presence of smoke alarms.
Only 4 states record if a building was covered by specific fire safety regulations. Therefore there is limited scope to assess the extent of regulatory compliance in fires.
However, 11 states record the item first ignited and 9 record the material mainly responsible for a fire. Therefore, there is scope investigate using inter-state data, the role of regulated items such as furniture, furnishings and electrical products.
Seventeen states record the cause of fire. Again this would provide a basis for a reasonable level of trans
47
national research, although the categories may need to be aligned.
5.3.5 Fire fighter fatalities: researchers’ view
The survey asked whether states collected data on the number of firefighters and firefighter deaths. The survey did not ask why such data was collected or how it was used.
There is scope to compare firefighter fatalities between those states that currently collect data on fire fighter fatalities. Sixteen states collect data on firefighter deaths during operations, 17 recording deaths on route to fires, 14 during training and 12 when on other duties. The composition of fire services varies greatly between states, particularly the ratio of full time to part time, retained and volunteer fire fighters. There were 15 states where the reporting of each category of firefighter matched the reporting of the number of firefighters (Finland, Norway, Czech, Poland, Hungary, Holland, Lithuania, France, Austria, Bulgaria, UK, Germany, Slovakia, Estonia, Greece, Italy and Luxemburg). Therefore, there could be scope to compare firefighter fatality rates between these states, both for all types of firefighters and for each sub-category. It may be difficult to include the number of fires as a weighting factor due to the problems in producing comparable rates of fire for each state.
Two other states recorded firefighter deaths but not the number of firefighters. Another option therefore would be to compare the rate of fire fighter deaths per one million population, for seventeen states.
5.4 Overall conclusion
This study has confirmed the difficulties in comparing current fire data between member states and mapped out the differences in reporting practices. Such comparisons could be used to inform the development of fire safety interventions and to evaluate the impact of current interventions. Respondents expressed support for developing comparable datasets and this report has identified where there is more scope for this. The findings from this study also indicate that reconciling current data would be a significant task.
The discussions with key stakeholders identified a number of organisations that could be asked to help take this work forward. These included:
• Eurostat;
• DG Sanco of the European Commission; and
• World Health Organization.
It was recommended by this study that the EU Fire Safety Network contact one or more of these organisations with the aim of securing their involvement in progressing this work.

48
6 APPENDIX A: INTERVIEWEES EXAMPLES OF DATA COLLECTED
6.1 Government agency
Department for Communities and Local Government (DCLG)
Fire Statistics United Kingdom (annual, but with a selection of figures published quarterly)
• Number of fires, analysed by year, location/type of fire (primary, secondary, chimney, outdoors).
• Number of building fires, analysed by year and occupancy (e.g. dwelling, education, retail distribution).
• Number of outdoor fires and secondary fires, analysed by year and location (e.g. road vehicle, grassland, refuse/refuse containers).
• Number of building fires, analysed by year, dwellings/other and cause (accidental/malicious, and for the former, source of accident, e.g. faulty appliances, chip pan fires).
• Number of building fires, analysed by year, dwellings/other and source of ignition (e.g. smokers’ materials, cooking appliances).
• Number of building fires, analysed by year, dwellings/other and spread of fire (e.g. confined to item/room of ignition).
• Fire casualties, analysed by year, number, number per million population, and fatal/non-fatal.
• Number of fire casualties, analysed by year, fatal/non-fatal and location group (e.g. dwellings, road vehicles).
• Number of fire deaths, analysed by year and cause (e.g. burns, overcome by gas or smoke).
• Number of non-fatal casualties, analysed by year, fire brigade personnel/other, and nature of injury, e.g. burns, shock, physical injury).
• Number of dwelling fire casualties, analysed by year, fatal/non-fatal, malicious/accidental and, for malicious fires, cause (e.g. suicide attempt, ignition of own building).
• Number of accidental dwelling fire casualties, analysed by year, fatal/non-fatal and cause.
• Number of accidental dwelling fire casualties, analysed by year, fatal/non-fatal and source of ignition.
• Number of accidental dwelling fire casualties, analysed by year, fatal/non-fatal, room of ignition/other, and use of room of ignition (e.g. bedroom).
• Number of fire deaths, analysed by year and number of deaths per fire.
• Number of malicious building fires and fatal/non-fatal casualties in them, analysed by year and building occupancy.
• Number of vehicle fires and fatal/non-fatal casualties in them, analysed by year, type of vehicle, malicious/accidental and, for accidental fires, cause/source of ignition.
• Some more detailed tables in respect of the latest year only, covering e.g. a breakdown of data by fire brigade area, and a more detailed analysis of fire cause/source of ignition.
The contents of Fire Statistics United Kingdom are based upon data collected on standard fire incident report forms by fire brigades throughout the UK. Following review the method of data collection has changed to become all-electronic (Incident Reporting System (IRS)).
Periodic reports on the estimated cost of fire in England and Wales

49
A series of such reports have been published, including “The economic costs of fire 2004” (DCLG, 200637). Costs are divided into three categories:
• In anticipation (fire protection, fire safety, fire insurance administration).
• As a consequence (direct property loss, business interruption, human losses).
• In response (Fire Service response costs). 6.2 Fire Services
Berlin Fire Department
Most data are provided for the latest year only, but with some national totals also for the four preceding years
• National data broken down between professional and volunteer brigades, etc:
o Fire engines and other appliances, fire stations; and
o Numbers of fire fighting personnel, by category (in figures and percentages of the total).
• Data broken down by region and category of brigade for numbers of :
o Breathing apparatus sets;
o Communication radio sets installed in fire engines;
o Specialised vehicles of different types’
o Average number of missions annually per fire engine, per active firefighter, and
o Per fire station; and
o Personnel of different categories (including senior staff and female staff).
• Data for each region of:
o Numbers of districts, municipalities and administrative parishes;
o Population and geographical area;
o Population per square km; and
o Percentage share of the total population and total area.
• National data for fire brigade call-outs, broken down by category of call-out (e.g. Fire/explosion, false alarm, invalid transport).
Hereford & Worcester Combined Fire Authority
In addition to the same sort of data as published in Fire Statistics United Kingdom, the Authority collects statistics of:
• Attendance times on call-outs to all property fires, and
• The status of all the doors in the property, i.e. whether found open or closed.
37 http://www.communities.gov.uk/fire/researchandstatistics/firestatistics/economiccost/

50
6.3 Fire insurers
Association of British Insurers
Quarterly and annual estimates of gross UK claims incurred in respect of:
• Fire damage; and
• Business interruption (consequential loss) arising from fire.
Some figures are the subject of press releases; otherwise they may be accessed by subscribing to the ABI statistics published (increasingly) on the ABI website or (decreasingly) in hard copy format.
6.4 Fire protection associations
Fire Protection Association
The following statistics are published in Fire Prevention and Fire Engineers Journal (monthly):
• Monthly and annual summaries of a large sample of fires reported by loss adjusters, analysed by:
o Geographical location;
o Building occupancy (e.g. warehouse, food processor, residential, etc);
o Presumed cause (e.g. arson, electrical fault, etc); and
o Estimated insured property loss.
• Annual summary of all fires reported to the FPA costing more than £50,000 or causing:
o Death, analysed by cause of fire, time of occurrence, point of origin, occupancy; and
o Amount of loss. • Monthly analyses of themed issues (e.g. a specific occupancy or cause), based on data drawn from
the above.
International Technical Committee for the Prevention and Extinction of Fire (CTIF)
CTIF produce every few years a World Fire Statistics Report. The report published in 2006 contained fire statistics of many countries and cities of the world for 2003-2004. The statistics for 2003 contain data from 31 countries and 24 cities whilst statistics for 2004 contained data from 33 countries and 33 cities38.
6.5 Fire protection industry
Fire Industry Confederation
Report published every 3 to 4 years, showing the value of the output of the UK fire protection industry, both active and passive, broken down by:
• Product type;
• Market segment; and
• Exports/home market sales.
38 N.N. Brushlinsky, J.R. Hall , S.V. Sokolov, P. Wagner; ‘Fire Statistics’ Report Number 11, Center of Fire Statistics (CTIF), 2006

51
British Automatic Sprinkler Association
Statistics are published (for the UK) of:
• Number of sprinkler heads and sprinkler alarm valves installed; and
• Number of companies installing sprinkler systems.
In addition, selected case studies are published of sprinkler actuations and of number of sprinkler heads operating. Finally, data could be made available on the average cost of systems installed (large, medium or small).

52
7 APPENDIX B: FULL SURVEY RESULTS
7.1 Survey results
Respondents from three states indicated that they do not collect any data, namely Romania, Malta and Slovenia. A response was not received from Romania or Portugal. The response from Spain was provided from a civil defence organisation who replied that local fire data may be collected by municipal organisations. It was also uncertain whether the responses from Germany or Austria reflected reporting arrangements by all respondents in these states. In addition, whilst the response from Ireland stated that data was not recorded on fire deaths, the researchers identified a government report on fire deaths in the home in Ireland using national statistics39. Therefore, there was uncertainty about the responses from four of those respondents that replied to the survey in full, namely Ireland, Germany, Austria and Spain. Thus, whilst the total number of online survey respondents was 24 (with two more stating they do not collect anything), there were uncertainties about four of these.
7.2 Section A: About the respondents and publication of fire data Q1: Are you the main organisation that collects fire data in your country?
Twenty three of the 24 respondents indicated that fire data was collected in their state.
Table 5: Total organisations collecting fire data
Response
Number
Yes
23
No
1
Total
24
Q2: What is the main purpose and role of your organisation in relation to fire data?
Figure 4 highlights that 61% of respondents (14 out of 23 states) have their main role as being to collect, analyse and disseminate information with a further 30% (7 out of 23) noted that they share information and knowledge. A total of 23 respondents responded to the question.
39 For examples see data published at http://www.environ.ie/en/Publications/StatisticsandRegularPublications/FireandEmergencyServices/

53
Figure 4: Role of organisation in relation to fire data
Q3: Who are the main users of the fire data you hold?
Figure 5 highlights that over 83% of respondents (20 out of 24 states) noted main users of fire data are that the Government with 88% (21 out of 24 states) noting that Fire Services make use of the data that they hold. In addition 79% (19 out of 24 states) is used by the public. All 24 survey respondents provided a response to the question.
Figure 5: Main users of fire data

54
Q4: Who else collects fire data at a national level in your country?
Figure 6 highlights that the fire data is also collected by 38% (9 out of 24 states) of Insurers, Government and Fire Services. All 24 respondents responded to the question.
Figure 6: Collectors of fire data
Q5: What are the sources of your fire data? How often is the fire data recorded either by you or the organisation(s) who provide the data?
As highlighted in Figure 7, fire data is recorded most commonly by fire services immediately. The chart also shows that respondents noted that fire data is not recorded by a range of groups. All 24 respondents responded to the question.
Figure 7: Sources and frequency of fire data
25
20
15 Number of
respondents 10
5
0
Not recorded
On demand
Immediately
Monthly
Quarterly
Annual Every
two years
Less than every two years

55
Q6: Is your organisation the main organisation that publishes fire stats in your country?
As highlighted below in Table 6, the vast majority of respondents responding to the survey were the main respondent responsible for publishing fire statistics. All 24 survey respondents provided a response to the question.
Table 6: Respondent main organisation publishing fire statistics
Number
Percentage
Yes
21
88%
No
2
8%
Unsure
1
4%
Total
24
100%
Q7: How often are fire statistics published by the organisation responsible for publishing it?
Figure 8 highlights that majority of respondents publish statistics on annual basis (54% - 13 out of 24 states), with a further 29% (7 out of 24 states) responded that they publish fire statistics monthly. All 24 respondents responded to the question.
Figure 8: Frequency of fire statistic publication

Q8: Where does your organisation publish fire stats?
Figure 9 show that the 87% (20 out of 23 states) publish statistics on the internet and 91% (21 out of 23 states) in annual reports. Mixed response rates are seen (N=23 for ‘on the internet’ & ‘annual reports’ as one respondent provided no response to these categories). All 24 respondents provided a response to ‘online databases’ and ‘industry magazines’.
Figure 9: Location of fire statistic publication
7.3 Section B: What is recorded about fires
Q9: At which of the following levels is fire data collected and/or reported within your country or state?
Figure 10 highlights that 79% (19 out of 24 states) collect and/or report fire data at a national level, with 71% (17 out of 24) stating that they are done at a fire service level. In addition 58% (14 out of 24 states) stated regional collection and/or reporting is seen.
Figure 10: Location of fire statistic publication
56

57
Q10 (Part One): Do you record the number of fires for the following categories and/or sub categories?
Figure 11 shows that the vast majority of respondents (91% - 21 out of 23 respondents) stated that they record fires.
Figure 11: Record number of fires – yes or no
(a) Accidental fires
Figure 12 highlights that in general 50-60% of respondents recorded accidental fires for the cited categories. All 24 respondents responded to the question.
Figure 12: Fire category recorded (accidental fires)
(b) Deliberate fires
Figure 13 highlights that in general 50-60% of respondents recorded deliberate fires for the cited categories.
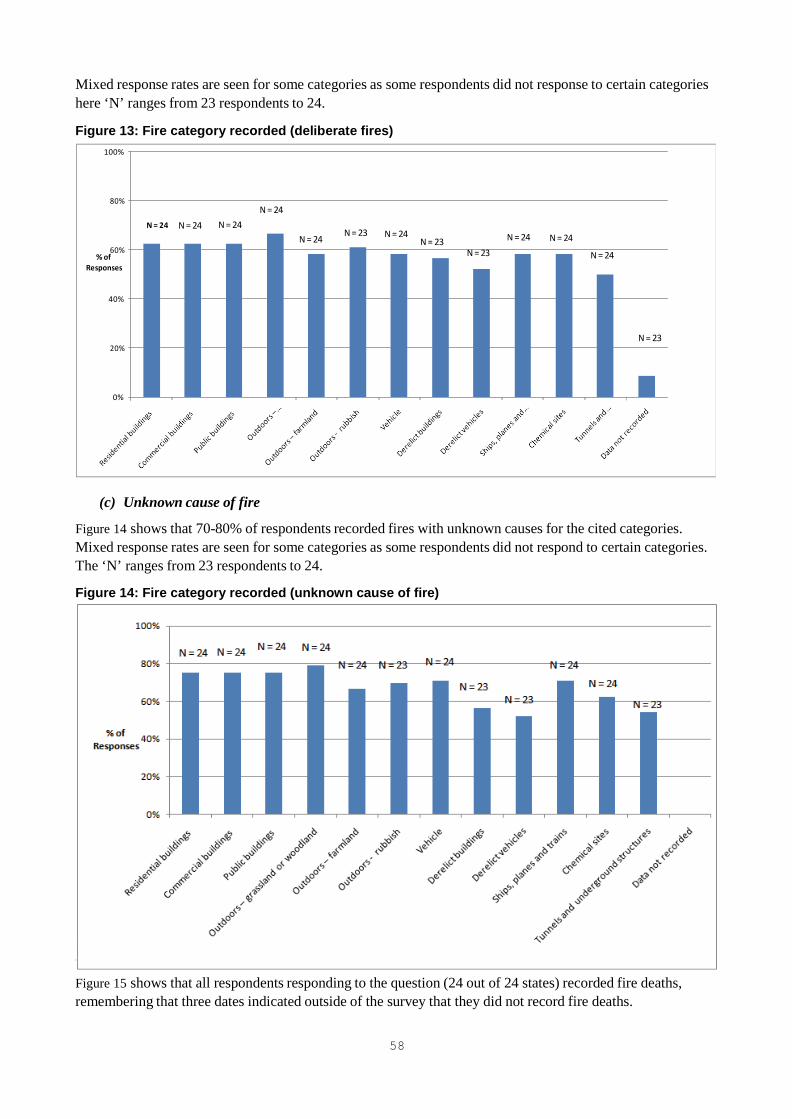
58
Q10 (Part Two): Do you record the number of fire related deaths for the following categories and/or sub categories?
Mixed response rates are seen for some categories as some respondents did not response to certain categories here ‘N’ ranges from 23 respondents to 24.
Figure 13: Fire category recorded (deliberate fires)
100%
80%
60% % of
Responses
N = 24
N = 24 N = 24
N = 24
N = 24
N = 23
N = 24
N = 23 N = 24 N = 24 N = 23
N = 24
40%
20% N = 23
0%
(c) Unknown cause of fire
Figure 14 shows that 70-80% of respondents recorded fires with unknown causes for the cited categories. Mixed response rates are seen for some categories as some respondents did not respond to certain categories. The ‘N’ ranges from 23 respondents to 24.
Figure 14: Fire category recorded (unknown cause of fire)
Figure 15 shows that all respondents responding to the question (24 out of 24 states) recorded fire deaths, remembering that three dates indicated outside of the survey that they did not record fire deaths.

59
Figure 15: Record number of deaths – yes or no
(a) Accidental fires
Figure 16 highlights that between 50-60% of respondents record the different categories below for accidental fire deaths. The response rate for this question ranges between 24-27 respondents as it also includes 3 respondents (from Malta, Romania and Slovenia) who stated that they collect data on fire deaths but did not complete the survey (as stated earlier in the report).
Figure 16: Number of fire related-deaths recorded (accidental fires)
(b) Deliberate fires
Figure 17 highlights that between 50-60% of respondents record the different categories below for deliberate fires. The response rate for this question ranges between 26-27 respondents as it also includes 3 respondents (from Malta, Romania and Slovenia) who stated that they collect data on fire deaths but did not complete the

60
(c) Suicide
survey (as stated earlier in the report).
Figure 17: Number of fire related-deaths recorded (deliberate fires)
Figure 18 highlights that between 40-50% of respondents record suicides in the different categories of fires below. The response rate for this question ranges between 26-27 respondents as it also includes 3 respondents (from Malta, Romania and Slovenia) who stated that they collect data on fire deaths but did not complete the survey (as stated earlier in the report).
Figure 18: Number of fire related-deaths recorded (suicide)
(d) Unknown cause of fire
Figure 19 highlights that generally between 60-70% of respondents record fires with unknown causes for the different categories below. The response rate for this question ranges between 25-27 respondents as it also

61
includes 3 respondents (from Malta, Romania and Slovenia) who stated that they collect data on fire deaths but did not complete the survey (as stated earlier in the report).
Figure 19: Number of fire related-deaths recorded (unknown cause of fire)
Q10 (Part Three): Do you record the number of non-fatal injuries for the following categories and/or sub categories?
Figure 20 shows that circa 88% of respondents (21 out of 24 states) recorded non fatal injuries.
Figure 20: Record number of non-fatal injuries – yes or no
Figure 21 highlights that generally between 50-60% of respondents record the different categories below for accidental non fatal injuries. The response rate for this question ranges between 21-24 respondents as not all respondents provided a response.

62
Figure 21: Number of non-fatal injuries record (accidental fires)
Figure 22 highlights that generally 50% of respondents record deliberate non fatal injuries for the cited categories below. The response rate for this question ranges between 23-24 respondents as not all respondents provided a response.
Figure 22: Number of non-fatal injuries recorded (deliberate fires)

63
Figure 23 highlights that generally 50% of respondents record attempted suicide or self harm for non fatal injuries for the cited categories below. The response rate for this question ranges between 23-24 respondents as not all respondents provided a response.
Figure 23: Number of non-fatal injuries recorded (attempted suicide or self-harm)
Figure 24 highlights that generally 60% of respondents record unknown fire causes non fatal injuries for the cited categories below. The response rate for this question ranges between 23-24 respondents as not all respondents provided a response.
Figure 24: Number of non-fatal injuries recorded (unknown cause of fire)

64
7.4 Section C: Definitions of fires and buildings
Q11: When you report fires in a home, which of the following is included in the category of home (dwelling)?
Figure 25 shows that 83% (20 out of 24 states) of respondents who report fires in a home, record in the category of ‘house/flat/apartment’. The remaining categories typically saw between 30-40% of respondents reporting them. In total all 24 respondents provided a response to the question.
One respondent indicated they do not collect data on dwelling fires despite noting to a previous question that they did. Also four did not report using the category house/flat/apartment. This was attributed to their use of alternative categorisation systems.
Figure 25: Included in category of ‘home’ (‘dwelling’)

65
Q12: How do you sub-divide non-residential property?
Figure 26 shows that the vast majority of respondents (86% - 19 out of 2 2 states) responded that they subdivided residential property by the type of building. 22 respondents provided a response to the question.
Figure 26: Subdivision of non-residentiaI property
80% %
0
f
60% R e s p 0 40%
n s e s 20%
N= 22
Split between commercial and Sub-divide by the type of public
building(e.g.school,hotel, shop etc)
Other

66
Q13: What are fires in religious buildings defined as (e.g. Church, Mosque, Synagogue)?
Figure 27 shows that few respondents reported fires in religious buildings in the categories provided (below). Of those responding the most commonly reported category was 'fire in a publically owned building' (29%- 7 out of 24 respondents). :Mixed response rates are seen as not all respondents provided a response to each of the categories highlighted below.
Figure 27: Categorisation of fires in religious buildings
100%
80% +-------------------------------------------------------------------1
R e s 60%
% p
0
0 n d e 40% n t
s
20%
0%
Fir e in a residenti.al
building
Fir e in a commercial
building
Fir e in a privately owned
building
Fir e in a
publically owned
building
Donot know

67
Q14: How are chimney fires reported?
As per Figure 28 respondents most commonly report chimney fires as a ‘separate category’ (35% - 6 out of 17 states). The response rate is N=17 as a total of seven respondents did not respond to this question.
Figure 28: Reporting of chimney fires
Q15: Are fires in home gardens (both private and communal) which do not spread to a building reported as fires in ………..? (Please select one option)
Figure 29 highlights that the majority of respondents (68% - 15 out of 22 states) reported fires in home gardens as outdoor fires.
Figure 29: Reporting of fires in home gardens

68
Q16: When you report fires outdoors, which of the following would you report in this category?
Figure 30 highlights below that the majority of respondents report outdoor fires in the category of ‘grassland’ and ‘woodland/forest’ (95% for both – 19 out of 20 states). In addition around 75% (15 out of 20 states) also report ‘rubbish/refuse’ and ‘farmland’. The results only reflect those respondents who stated that they collect data on outdoor fires (any of accidental, deliberate or unknown cause) in the first instance (N=20).
Figure 30: Outdoor fire sub-categories
100%
80%
60%
% of Respondents
40%
20%
0%
N = 20
Gr assland Woodland/
fore st
Rubbish/
re fuse
Farmland Othe r
Q17: When you report fires in vehicles, which of the following would you report in this category?
Figure 31 shows that the most common categories in which respondents report fires in vehicles are for Motor cars (100% - 17 out of 17 states) and public transport vehicles 94% - 16 out of 17 states). The results only reflect those respondents who stated that they collect data on vehicle fires (accidental deliberate or unknown cause) in the first instance (N=17).
Figure 31: Vehicle fire sub-categories
100%
80%
60%
% of Respondents
40%
20%
0%
Motor cars Light goods He avy goods Motorc yc le s Public transport Do not know N = 17 ve hic le s ve hicle s ve hicle s

69
(c) A derelict or abandoned vehicle?
Q18: Do you record the following as a vehicle fire, in your country's statistics?
(a) A vehicle that has been involved in a road traffic accident
Figure 32 shows that 57% (12 out of 21) respondents recorded a vehicle fire for a vehicle that was involved in a road traffic accident. In addition 24% (5 out of 21) respondents stated that they did not record this.
Figure 32: Recording of vehicles involved in RTAs
(b) A vehicle that is not being driven, such as a parked car that has been deliberately set alight?
Figure 33 shows that 81% (17 out of 21 states) responded that they recorded a vehicle fire for a vehicle that was not being driven e.g. Parked car. Only 10% (2 out of 21) respondents stated that they did not record this.
Figure 33: Recording of vehicles not being driven
Figure 34 highlights that 67% (14 out of 21 states) stated that they recorded a vehicle for derelict or abandoned vehicles. 19% (4 out of 21) of respondents were unsure with 14% (3 out of 21) stating that they

70
did not record this.
Figure 34: Recording of derelict or abandoned vehicles
Q19: When you report fire deaths, which of the following are included in the category of deaths at fires?
Figure 35 highlights that 79% (19 out of 24) respondents reported accidental fire deaths followed by deliberate fire death (71% - 17 out of 24 states). Mixed response rates are seen for some categories as some respondents did not response to certain categories here ‘N’ ranges from 23 respondents to 24.
Figure 35: Fire death sub-categories
Q20: When you report fire deaths, do you also record the following?
Figure 36 shows that 50% of respondents (12 out of 24 states) recorded the location of the casualty when reporting fire deaths, around 13% (3 out of 24 states) recorded admission to hospital prior to death with 17%

71
Figure 36: Information recording in fire death report
(4 out of 24 states) recording medical treatment prior to death. In total 24 respondents provided a response to the question.
Q21: How long after a fire can a fire death be attributed to it?
Figure 37 shows the proportion of respondents that apply each time limit to the determination of a death from fire. Clearly, practices vary. Only 19% (4 out of 21 states) of total respondents stated that they report fire death immediately (up to 72 hours) and so they only report deaths that occur within 72 hours. Most states (52% - 11 out of 21 states) record fire deaths that occur within 1-3 months. Response rate is N=21 as 3 respondents did not respond to the question.
Figure 37: Timeframe for reporting of fire deaths

72
Q22: When you report non-fatal injuries, which of the following would you report as falling in the category of injury at fires?
Figure 38 highlights that 67% (16 out of 24) respondents recorded in the categories of ‘Physical injury due to fire & first aid received’ and ‘Smoke inhalation & first aid received’ for non fatal injuries (63% - 15 out of 24). In total 24 respondents provided a response to the question.
Figure 38: Non-fatal fire injury categories
100%
80%
60%
% of
Respondents
40%
20%
0%
Physical injury Physical injury Physical (heat) injury Smoke inhalation Smoke inhalation Recommended Do not collect None of the due to fire due to fire with no fire e.g. & no first aid & first aid received precautionary data on injury above
N = 24
& no first aid & first aid received cooker burn medical check‐up & no visible injury
Q23: When you report non-fatal fire injuries, do you record location of casualty in vehicle or building relative to where the fire is started?
Of those respondents responding, 86% (18 out of 21 states) noted that when they report non fatal fire injuries they record the location of the casualty. 14% (3 out of 21) of respondents did not report the location of non fatal fire injuries.
Table 7: Recording of location of casualty for non-fatal fire injuries
Response
Number
Percentage
Yes
18
86%
No
3
14%
Total
21
100%
Q24: Do you have criteria to guide the recording of injuries e.g. injury is only recorded if medical aid is received by casualty?
Of those respondents responding 86% (18 out of 21 states) respondents stated that they have criteria in place

73
to help guide the recording of injuries. 14% (3 out of 21) respondents did not have any criteria in place.
Table 8: Those with and without criteria for recording of injury
Response
Number
Percentage
Yes
18
86%
No
3
14%
Total
21
100%

Q25: Do you record the type of injury?
As highlighted in Figure 39 circa 10-20% of respondents record the following types of injuries, with the most common being heat exhaustion, burns – severe, burns – slight, chest pain and breathing difficulties. Thus few states use the cited sub-categories even if they report non fatal injuries. Varied response rates were seen as not all respondents provide answers to the question (as highlighted below).
Figure 39: Types of injury recorded
74

Q26: Do fire statistics in your country include fires put out or that stop before the fire service has arrived at the scene?
As highlighted below in Table 9, 71% (17 out of 24) of all respondents responding to the survey stated that statistics in their country included fires put out or stopped before the fire service has arrived at the scene. In total 24 respondents provided a response to the question.
Table 9: Whether fire statistics include fire put out or stopped before fire service arrival
Number
Percentage
Yes
17
71%
No
4
17%
Unsure
3
13%
Total
24
100%
7.5 Section D: Data recorded per fire
Q27: Which of the following categories of information do you record per fire?
Figure 40 highlights that 92% (22 out of 24) respondents record in the category of building/vehicle or other location. In addition 17 out of 24 respondents (71%) also record the cause of fire. 38% (9 out of 24) record the items mainly responsible for fire. In total 24 respondents provided a response to the question.
Figure 40: Categories of information recorded per fire
75

76
(a) Presence and operation of fire safety systems
Figure 41 shows that for those respondents that responded the most common type of fire system recorded is ‘Smoke alarms’ with 86 % (12 out of 14 states). Mixed response rates are seen as not all respondents provided a response to each of the categories (smoke detector/alarms N=14, battery powered N=7, long life battery alarms N=7, mains powered alarms N=7).
Figure 41: Presence and operation of fire safety systems (Part 1 – type of smoke alarm)
Figure 42 shows that 79% of respondents (19 out of 24) state that fire safety systems record the date and time of day of an incident. In addition over 63% (15 out of 24states) also record the location of fire origin as well. In total 24 respondents provided a response to the question.
Figure 42: Presence and operation of fire safety systems (Part 2 – type of system)

77
(b) Fire Service actions
Figure 43 identifies the types of fire service actions recorded. In total 24 respondents provided a response to the question. Analysis shows 79% (19 out of 24) respondents record: time emergency call receive, time fire appliances mobilised and time fire service attended incident are recorded. In addition 71% (17 out of 24 states) also record the number of persons evacuated and firefighting actions.
Figure 43: Fire Service Actions
(c) Casualty demographics
Figure 44 explores the demographics recorded by respondents, in total 24 respondents provided a response to the question. As shown below some respondents record age (58% - 14 out of 24 states) and gender (46% - 11 out of 24 states) but few record other factors.
Figure 44: Demographics recorded

78
(d) Cost of fire
Figure 45 shows that around 50% of respondents (12 out of 24) stated that they recorded the cost of fire and smoke damage. In total all 24 respondents provided a response to the question.
Figure 45: Cost of fire
(e) Regulation
Figure 46 identifies that 17% (4 out of 24) respondents recorded information on whether there was a breach of regulation(s) during an incident. In total all 24 respondents provided a response to the question.
Figure 46: Regulation

79
(f) The extent of smoke damage
In total 7 respondents (out of 21 responding to the question) stated that they record the extent of smoke damage. Of those responding 57% measured category of smoke damage (4 out of 7 states) with 43% (3 out of 7 states) also measuring the damage in m2
Figure 47: Extent of smoke damage
100%
80%
60% % of
Respondents 40%
20%
0%
N = 7
Sq. m Categories (high, medium, low
damage)
(g) The extent of fire damage
In total 16 respondents (out of 22 responding to the question) stated that they record the extent of fire damage. Of those 59% (10 out of 16 states) record fire damage in m2 with circa 41% (6 out of 16 states) record categories.
Figure 48: Extent of fire damage
100%
80%
60% % of
Respondents 40%
20%
0%
N = 16
Sq. m Categories (high, medium, low
damage)

80
(h) Fire Service information – Do you record the number of fire engines, command units, aerial ladder platforms etc in your country?
Figure 49 highlights that over 85% (17 out of 20) respondents responding to the question recorded fire service information. In total 20 respondents provided a response for this question.
Figure 49: Fire Service information
(i) Firefighter information – Do you record the following information about firefighters, in your country?
Whilst twenty respondents stating that they record fire service information twenty three respondents reported that they record the number of firefighters. It is important to note that in most cases, states that report firefighter deaths for (say) volunteers also report the number of volunteers. If a respondent did not report (say) volunteer fire deaths, they also said they did not report the number of volunteers. This can be taken to mean that they did not use volunteers. There were only two responses (Iceland and Spain) where the reporting of firefighter deaths did not align to the reporting of the number of firefighters. This indicates that in fifteen states they reported all categories of firefighter deaths and the number each category of firefighters. Five other respondents did not report firefighter deaths.
Figure 50 shows the percent of states reporting each category of firefighter. In total 23 respondents provided a response to the question. We took this to mean that this is the number of states that employ each type of firefighter, and that they all (with one exception) recorded the number employed.

81
Figure 50: Number of states reporting each category of firefighter
100%
RO%
60%
%of Responses
40%
20%
0%
N = 23
Number of full time
firefigh ters
Number of part t ime
firefighters
Number of retained
firFfightFrS
Number of volun ta ry
firefighters

7.6 Section E: Use of fire data
Q28: Are national fire statistics used for any of the following in your country?
Figure 51 provides details on the use of fire statistics. As highlighted below respondents most commonly use statistics to ‘inform government’, ‘assess trends’ and ‘raise awareness of fire’. Mixed response rates were seen, as not all respondents provided a response for the different categories. Varied response rates were seen ranging from N=22 to 24 as not all respondents provided an answer for each selection as highlighted below.
Figure 51: Use of fire statistics
82

83
Whilst at an incident having
responded to an
Whilst on route to an incident
Whilst on duty but not
responding to an
Off Duty Whilst on training
Do not collect data on fire
fighter deaths emergency
telephone call incident
7.7 Section F: Firefighter fatality data
Q29: Do you collect data on firefighter deaths that occur?
Figure 52 shows circa 63% (17 out of 27) respondents stated that they record firefighter deaths whilst on route to an incident and whilst at an incident. In addition 52% (14 out of 27) respondents also noted that they record deaths whilst firefighters are on training, In total there were 27 responses for this question as three additional countries (Malta, Romania and Slovenia) provided email responses but did not complete the survey.
Figure 52: When data is collected on firefighter deaths
100%
80%
60% % of
Respondents
40%
20%
0%
N = 27*
* three additional countries provided information via email without completing the survey
Q30: Do you collect the following information on firefighter deaths? Also indicate what type of firefighter you collect information on.
Figure 53 shows that off the 24 respondents responding to the survey 79% (19 out of 24 states) collect some data on firefighter deaths. 67% (16 out of 24 states) noted that they record the location of firefighter death.
Figure 53: Data that is collected on firefighter deaths
100%
80%
% of 60%
Respondents 40%
20%
0% N = 24
Cause of death e.g.
burns, smoke inhalation, heat
exhaustion
Location e.g.
building, outdoor fire, etc
Do not collect data
on firefighter deaths
Collect some data on
firefighter deaths

84
Figure 54 cross references the number of respondents who reported type of firefighters with the number of those reporting firefighter deaths by type. The graph shows that full time and part time fire fighter deaths are most commonly recorded.
It must also be noted that the graph shows a discrepancy in that a larger number of states reported part time firefighter death in comparison to reporting the number of part time firefighters.
Figure 54 – Number of deaths recorded in comparison to number of organisations recording firefighter type

85
7.8 Section G: Recording of costs of fire
Q31: Do you record the following?
Table 10: Data recorded
Response
Number
Percentage
Number of emergency telephone calls made to fire services asking for emergency assistance
17
71%
Number of false/malicious emergency telephone calls (calls by people pretending there is a fire) made to fire services
15
63%
Number of false emergency telephone calls with good intent e.g. caller believes that there is a fire but this is not the case
14
58%
Number of Automatic Fire Alarms (an Automatic Fire Alarm is where a smoke or fire detector is either relayed directly to the fire service or is relayed via an alarm monitoring service.)
14
58%
Number of calls from Automatic Fire Alarms where there was no fire
12
50%
Number of emergency telephone calls made to the fire service for emergencies other than fires (e.g. road traffic collision)
14
58%
Number of times the fire service have responded to an emergency telephone call e.g. attended a fire, road traffic accident, etc
18
75%
Figure 55shows that respondents responding to the question (N=24) most commonly record the number of time the fire service has responded to an emergency call (75% - 18 out of 24 states), followed by telephone calls asking for assistance (71% - 17 out of 21 states).
Figure 55: Data recorded
100%
80%
60%
% of Respondents
40%
20%
0%
N = 24
Telephone calls
asking for emergency assistance
False emergency telephone calls
False emergency telephone calls
with good intent
Automatic Fire
Alarms
Number of calls from Automatic
Fire Alarms where there was no fire
Number of emergency
telephone calls made for non‐fire
emergencies
Number of times fire service has responded to emergency
telephone call

86
Q32: Do you record the cost per fire (e.g. uninsured costs, insured costs, cost estimates, claims to insurance companies)?
Figure 56 shows that a total of five states (including Norway) recorded the cost per fire. 50% (12 out of 24 states) did not record data on costs of fire with 33% (8 out of 24 states) were unsure.
Figure 56: Any data recorded
100%
80%
60% % of
Respondents 40%
20%
0%
N = 24
Yes* No Unsure
* Norway indicated that they collect partial information
(a) Do you record value of insurance claims per fire at different types of occupancy?
In total 5 respondents responded to the question, of these only 4 states collect data on the value of insurance claims as seen below in Figure 57.
Figure 57: Value of insurance claims (N = 5)
100%
80%
60%
% of Respondents
40%
20%
0% N = 5

87
(b) Do you record uninsured losses per fire at different types of occupancy?
In total 5 respondents responded to the question, of these only 2 states collect data on uninsured losses.
Figure 58: Uninsured losses (N=5)
100%
80%
60% % of
Respondents 40%
20%
N = 5 0%
(c) Do you record loss of social or public amenities?
In total 5 respondents responded to the question, of these only 2 states collect data on uninsured losses.
Figure 59: Loss of social of public amenities (N=5)
100%
80%
60% % of
Respondents 40%
20%
N = 5 0%

88
(d) Is this based on data from businesses/insurers for each fire or on estimates based on research?
As highlighted below in Figure 60 only 8% (2 out of 24) states noted that the data for ‘residential buildings’, ‘commercial buildings’, ‘public buildings’ and derelict buildings’ was based on data from businesses and insurers. In total 24 respondents provided a response to the question.
Figure 60: Data gathered versus estimates of fire cost
20%
15%
10%
% of Respondents
5%
0%
Residential buildings
Commercial
buildings
Public buildings
Derelict
buildings
Vehicles Derelict
vehicles
Ships, planes and
trains
Chemical
sites
7.9 Section H: Quality assurance
Q33: Are reporting of fire statistics by fire services mandatory or voluntary in your country? Figure 61 shows that the majority of states (79% - 19 out of 24 states) noted that reporting was mandatory. In total 24 respondents provided a response to the question. Figure 61: Is reporting mandatory or voluntary?
100%
80%
% of 60%
Respondents
40%
20%
N = 24 0% Mandatory Voluntary Varies

89
Q34: Is there a quality assurance standard against which fire services work towards when reporting fire statistics?
Figure 62 shows that the majority of states did not have a quality assurance system in place for statistical reporting. 33% (8 out of 24 states) have a system in place. In total 24 respondents provided a response to the question.
Figure 62: QA standard for Fire Service fire statistic reporting
100%
80%
60%
% of Respondents
40%
20%
0% N = 24
Yes No Did not provide response
Q35: Is there national (or other) guidance on reporting, that ensures data quality and completeness in your country?
Figure 63 shows that 58% (14 out of 24 states) have guidance in place that ensures data quality, with less than 10% (2 out of 24) stating that they did not have any such guidance in place. A third of respondents did not provide a response. In total 24 respondents provided a response to the question.
Figure 63: Guidelines for QA
100%
80%
% of 60%
Respondents 40%
20%
0% N = 24
Yes No Did not provide response

90
Q36: Do those (e.g. fire services) who report fire use a standard list of causes (for fire), types of buildings, etc or use free text to describe the cause of the fire?
Figure 64 shows that the majority of respondents (83% - 20 out of 24 states) use a standard list, whilst 13% (3 out of 24 states) use free text. A minority of respondents did not provide a response. In total 24 respondents provided a response to the question.
Figure 64: Standard list of fire cause versus free text
100%
80%
% of 60%
Respondents 40%
20%
0%
N = 24
List Free text Did not provide a response
Q37: In your opinion, how would you rate the overall quality and completeness of fire data held in your country?
Figure 65 shows that over 50% of respondents state half the quality of data that they hold was good or very good (12 out of 24 states). 25% (6 out of 24 states) however felt that the quality of data held in their country was poor. In total 24 respondents provided a response to the question.
Figure 65: Overall quality and completeness of fire data
100%
80%
% of 60%
Respondents
40%
20%
0%
N = 24
Very good Good Satisfactory Poor Very Poor Did not provide
a response

91
(a) If poor or very poor please identify in which areas you feel it could be improved e.g. building fires, grassland fires, etc
Table 11: Suggested improvements to fire data
Suggested improvements to fire data (free text)
We have a problem to get all the information we need about fire causes from the Police.
I rated Hungarian fire statistics poor compared to fire statistics of the Nordic countries or the United Kingdom or the United States of America, where statistics in connection with fires are very detailed. Hungarian fire statistics could be improved on the following areas: more detailed place of fire (event), not only type of building, but room or object or equipment which caught fire or started fire, AND more detailed fire casualties (cause of injury / death).
The level of motivation of the fire brigades to fill out the reports is quite low, which also shows in the lack of completeness of the reports or complete lack of reports at all. Because of this, a large part of the data is missing and has to be estimated. This makes the quality and reliability of the end results less than optimal. We feel that the quality and completeness of fire data could be highly improved by using data from the emergency rooms. A lot of basic information regarding all incidents that require the fire brigade is being recorded here every time someone calls the fire brigade, so this could be used to determine the total number of incidents per month in each town.
There are a lot of data, but the data base could be more flexible, dynamic and easier to get data. It is my opinion.
More emphasis could be given on recording fire safety applications and procedures (e.g. fire/smoke alarms etc) – at the moment this is at the discretion of the officer at the scene and is only examined further if/when the Fire Services' forensics unit comes.
Building fires, causes of fires, correlation between incidents and victims, technical interventions.

92
7.10 Section I: Plans for revising data collection
Q38: Do you have or know of any ongoing or future changes on the collection or reporting of fire statistics in your country?
62% (16 out of 24) respondents were unaware of any changes on the collection or reporting of fire statistics in their country (as highlighted in Figure 66). In total 24 respondents provided a response to the question. Of those who were aware of changes only one respondent provided further details:
“We have made a big change and made a new database system that has changed our method of work and at the same time we have changed some of our categories. The ongoing work with NØDNETT will probably also have an impact in the registrations to the fire services and also the police in some years time.”
Figure 66: Ongoing or future changes to reporting of fire statistics
100%
80%
% of 60%
Responses 40%
20%
0%
N = 24
Yes No
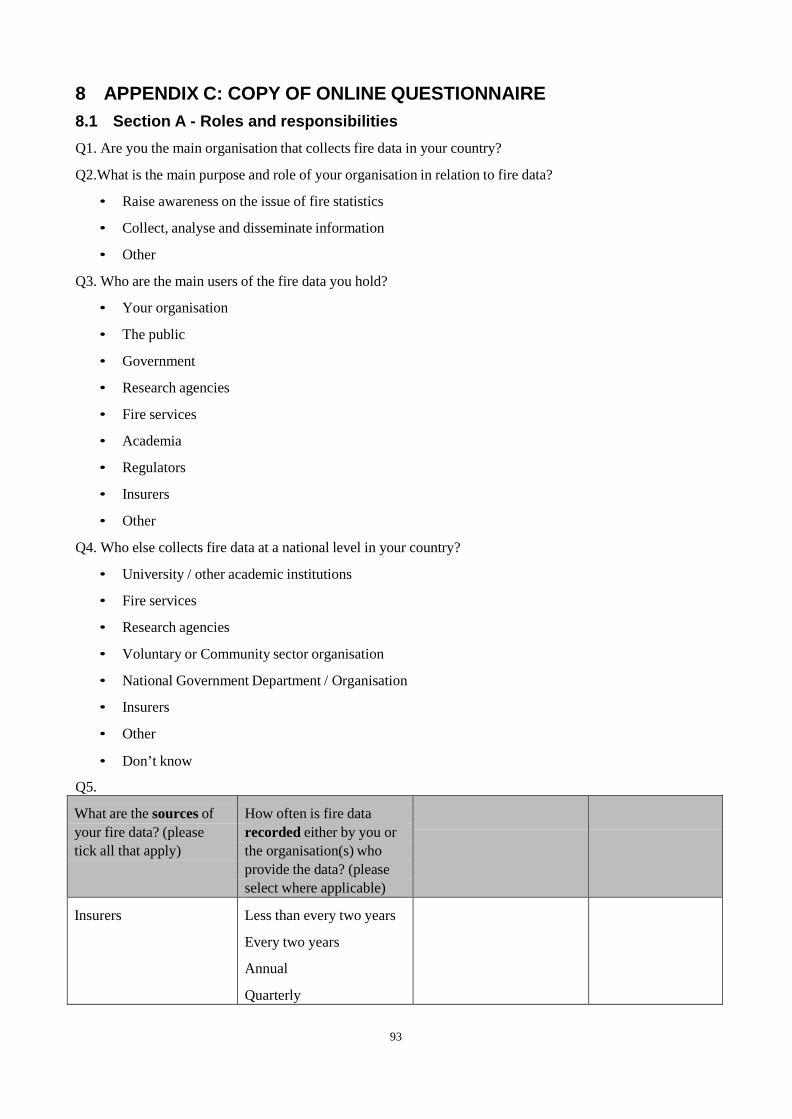
93
8 APPENDIX C: COPY OF ONLINE QUESTIONNAIRE
8.1 Section A - Roles and responsibilities
Q1. Are you the main organisation that collects fire data in your country?
Q2.What is the main purpose and role of your organisation in relation to fire data?
• Raise awareness on the issue of fire statistics
• Collect, analyse and disseminate information
• Other
Q3. Who are the main users of the fire data you hold?
• Your organisation
• The public
• Government
• Research agencies
• Fire services
• Academia
• Regulators
• Insurers
• Other
Q4. Who else collects fire data at a national level in your country?
• University / other academic institutions
• Fire services
• Research agencies
• Voluntary or Community sector organisation
• National Government Department / Organisation
• Insurers
• Other
• Don’t know
Q5.
What are the sources of your fire data? (please tick all that apply)
How often is fire data recorded either by you or the organisation(s) who provide the data? (please select where applicable)
Insurers
Less than every two years
Every two years
Annual
Quarterly

94
Monthly
Immediately
On demand
Not recorded
Other – please state
Fire services
National organisations e.g. government departments agencies
Local government e.g. councils
Police
Newspaper reports
Health service data
Surveys e.g. a large social research survey
Other – please provide details
Q6. Is your organisation the main org that publishes fire stats in your country?
• Yes
• No
Q7: How often are fire statistics published by the org responsible for publishing it?
• Less than every two years
• Every two years
Q8. Where does your organisation publish fire statistics? Please tick all boxes that apply
• On the internet
• Industry magazines
• Annual reports
• Online databases
• Other
• Do not know

95
8.2 Section B – What data is collected?
Q9. At which of the following levels is fire data collected and/or reported within your country or state? Please tick all that apply.
• Nationally
• Regionally
• Locally (City, Town or Small District)
• Post code or other small area designation
• Each Fire Service
• Other please specify
• Don’t know
Q10. Do you record the number of fires for the following categories and/or sub categories? Please tick all that apply
(see below)

96
Fires
Deaths
Non fatal injuries
Accidental Caused by accident or
carelessness
(not thought to
be deliberate).
Deliberate
Fire is started
purposefully
Not recorded
Accidental Caused by accident or
carelessness
(not thought to
be deliberate).
Deliberate Fire is started purposefully
Suicide (intentiona lly killing
oneself)
Not recorded
Accidental Caused by accident or
carelessness
(not thought to
be deliberate).
Deliberate Fire is started purposefully
Attemp ted suicide or self harm(att
empting to
intentional
ly kill or
harm
oneself)
Not recorded
Residential buildings i.e. a property that is a place of residence ( examples include flats, apartments, houses)
x
x
, ,
Commercial buildings i.e. a building privately owned by a company, trust or charity (examples include shops, offices, factories, cinemas)
x
Public buildings i.e. a building owned by the government (e.g. town hall, hospital, doctors surgery etc.)
Outdoors – grassland or woodland
x
Outdoor – farmland
Outdoor - rubbish

97
Vehicle
x
Derelict buildings
Derelict vehicles
Ships, planes and trains
x
Chemical sites
Tunnels and underground structures
Elsewhere – please state
Data not recorded

98
8.3 Section C – Definition
Q11. When you report fires in a home, which of the following is included in the category of home (dwelling)– Please tick all that apply
• House/Flat/Apartment
• Hostel
• Hotel
• Care Home
• Hospice
• Caravan/Mobile Home
• Sheltered accommodation
• Barracks
• Boarding school
• Prison or Detention Centre
• Do not collect data on dwelling fires
• Other, please specify
Q12a. How do you sub-divide non-residential property?
Q12b. Please provide a list of Non-Residential Property types used in your country.
Q13. What are fires in religious buildings defined as (e.g. Church, Mosque, Synagogue)? Please tick all that apply
• Fire in a commercial building
• Fire in a privately owned building
• Fire in a publically owned building
• Other, please specify
• Do not know
Q14. How are chimney fires reported? Please select one option.
• Fires in a buildings/dwelling
• Other please specify
Q15. Are fires in home gardens (both private and communal) which do not spread to a building reported as fires in: Please select one option

99
Q16. When you report fires outdoors, which of the following would you report in this category? Please tick all that apply
• Grassland
• Woodland/Forest
• Rubbish/Refuse
• Farmland
• Other, please specify
• Do not know
Q17. When you report fires in vehicles, which of the following would you report in this category? Please tick all that apply
• Motor Cars
• Light Goods Vehicles
• Heavy Goods Vehicles
• Motorcycles
• Public Transport Vehicles
• Other, please specify
• Do not know
Q18. Do you record the following as a Vehicle Fire, in your country's statistics?
• A vehicle that has been involved in a road traffic accident?
• A vehicle that is not being driven, such as a parked car that has been deliberately set alight?
• A derelict or abandoned vehicle?
Q19. When you report fire deaths, which of the following are included in the category of deaths at fires? Please tick all that apply
• Accidental death - caused by fire
• Deliberate death(including murder) – caused by fire
• Suicide death – caused by fire
• Explosion
• Arson related death (where murder or harm was not intended – i.e. manslaughter)
• Death unrelated to the fire, e.g. heart attack prior to start of fire
• Death related to the fire e.g. death due to fall from window to escape fire but not due to burns or smoke inhalation
• Do not collect data on nature of death
• None of the above – please specify

100
Q20. When you report fire deaths, do you also record the following?
• Location of casualty in vehicle or building relative to where the fire is started? (e.g. in room where fire started versus in room on floor above where fire started)
• Hospital admission prior to death
• Medical treatment prior to death
• None of the above: please specify
Q21. How long after a fire can a fire death be attributed to it, (e .g. if a person dies a few months later due to the injuries from the fire)?
Q22. When you report non fatal injuries, which of the following would you report as falling in the category of injury at fires? Please tick all that apply
• Physical injury due to fire e.g. burns - receive no first aid / medical treatment
• Physical injury due to fire e.g. burns - receive first aid / medical treatment
• Physical injury e.g. scolds, burns where no fire is seen e.g. contact with cooker, radiator, heater
• Smoke inhalation - receive no first aid / medical treatment
• Smoke inhalation - receive first aid / medical treatment
• Recommendation to attend medical facility for precautionary check-up (e.g. when there is no sign of injury)
• Do not collect data on injury
• None of the above: Please elaborate
Q23. When you report non fatal fire injuries, do you record location of casualty in vehicle or building relative to where the fire is started? (e.g. in room where fire started versus in room on floor above where fire started) If yes please elaborate
Q24. Do you have criteria to guide the recording of injuries e.g. injury is only recorded if medical aid is received by casualty? If yes, are they included in the count of fires or reported separately? If yes please elaborate
Q25. Do you record the type of injury? If yes, please enter what categories of injury are used:
• Overcome by gas, smoke or toxic fumes; asphyxiation
• Burns – severe
• Burns – slight
• Combination of burns and overcome by gas/smoke
• Shock / Anaphylactic shock
• Other medical condition Breathing difficulties (Other than 'Overcome by gas, smoke or toxic fumes, asphyxiation')

101
• Fracture
• Concussion
• Bruising
• Unconscious, fitting or unresponsive (no other evident significant injury)
• Other physical injury
• Cuts/Lacerations
• Impalement
• Drowning
• Hypothermia
• Heat exhaustion Back / Neck injury (spinal)
• Head injury
• Chest / Abdominal injury
• Chest pain / Heart condition / Cardiac arrest
• Choking
• Collapse
• Other
• Not recorded
Q26. Do fire statistics in your country include fires put out or that stop before the fire service has arrived at the scene? Yes/No
Q27. Which of the following categories of information do you record per fire?
• Type of building, vehicle or other type of location
• Cause of fire e.g. cigarette, electrical fault
• Items first ignited (e.g. paper-bin)
• Items mainly responsible for the fire (e.g. furniture, curtains)
• Involvement of hazardous materials or accelerants (e.g. petrol, kerosene)
• How call was made to the fire service, (e.g. by mobile phone)
Presence and operation of fire safety systems
• Smoke Detector/Alarms
• Fire Detector/Alarms
• Type of alarm
• Sprinklers
• Fire Hose
• Fire Extinguishers
• Smoke extraction system

102
• Smoke or Fire curtain
• Other, please specify
• Date & Time of day
• Location of fire origin in the building, (e.g. bedroom, ground-floor)
• Actions by people (not the fire service), (e.g. use of fire extinguishers, attempts to escape from the fire)
• If selected, please list your categories:
Fire Service actions
• Time emergency call received
• Time fire appliances mobilised
• Time fire service attended incident
• Fire fighting actions
• Rescue actions Rescue method
• Persons evacuated
• Equipment used by the fire service
• Number of appliances that attended each incident
Casualty demographics
• Age
• Gender
• Disabilities
• Ethnicity
• Nationality
Cost of fire
• Cost of fire and smoke damage – Yes/No
Regulation
• If the building was covered by regulations, do you record if there was a breach of the regulation
Do you record the extent of smoke damage?
• m2
• Categories (high, medium, low damage)
• Recorded
• Not Recorded
Do you record the extent of fire damage?
• m2
• Categories (high, medium, low damage)
• Recorded
• Not Recorded

103
Fire Service Information
• Do you record the number of fire engines, command units, aerial ladder platforms etc in your country? Yes/No
Firefighter Information
• Do you record the following information about Firefighters, in your country?
o Number of full time firefighters
o Number of part time firefighters
o Number of retained firefighters
o Number of voluntary firefighters
o Other please specify
8.4 Section E - Use of statistics
Q28. Are national fire statistics used for any of the following in your country? Please tick all that apply
• Reporting to the WHO or the UN
• Raising awareness of fire in your country
• Assessing trends over time
• Informing Government
• Identifying national strategies to prevent fires and/or fire deaths
• Evaluating performance of the fire service
• Evaluating the impact of fire interventions, policies and regulations
• Benchmarking and assessing performance between fire services in your country
• Informing regulation on consumer safety
• Informing distribution of funding to fire services
• Researching into causes and lessons learnt
• Identifying which types of buildings need support e.g. flats, hotels, shops Identifying which types of geographical areas need support
• Identifying which types of people support
• Assessing cost of fires
• None of the above: Please specify 8.5 Section F – Fire-fighter recording
Q29. Do you collect data on firefighter deaths that occur? Please tick all that apply
• Whilst at an incident having responded to an emergency telephone call
• Whilst on route to an incident
• Whilst on duty but not responding to an incident
• Off Duty

104
• Whilst on training
• Do not collect data on fire fighter deaths
Q30a. Do you collect the following information on firefighter deaths? Please tick all that apply
• Cause of death e.g. burns, smoke inhalation, heat exhaustion
• Location e.g. building, outdoor fire, etc
Q30b. Type of firefighter:
• Full time firefighter
• Part time firefighter
• Retained firefighter
• Voluntary firefighte
• Other, please specify
• Do not collect data on fire fighter deaths
8.6 Section G – Call to the fire service
Q31. Do you record the following? Please tick all that apply
• Number of emergency telephone calls made to fire services asking for emergency assistance
• Number of false emergency telephone calls (calls by people pretending there is a fire) made to fire services
• Number of false emergency telephone calls with good intent e.g. caller believes that there is a fire but this is not the case
• Number of Automatic Fire Alarms (an Automatic Fire Alarm is where a smoke or fire detector is either relayed directly to the fire service or is relayed via an alarm monitoring service.)
• Number of calls from Automatic Fire Alarms where there was no fire
• Number of emergency telephone calls made to the fire service for emergencies other than fires (e.g. road traffic collision)
• Number of times the fire service have responded to an emergency telephone call e.g. attended a fire, road traffic accident, etc Other, please specify
Q32. Do you record the cost per fire (e.g. uninsured costs, insured costs, cost estimates, claims to insurance companies)?
• Yes
• No
• Unsure
Type of loss recorded
Is this based on data from businesses/insurers for each fire or on estimates based on research?
Value of insurance claims
Uninsured losses
Loss of social or public
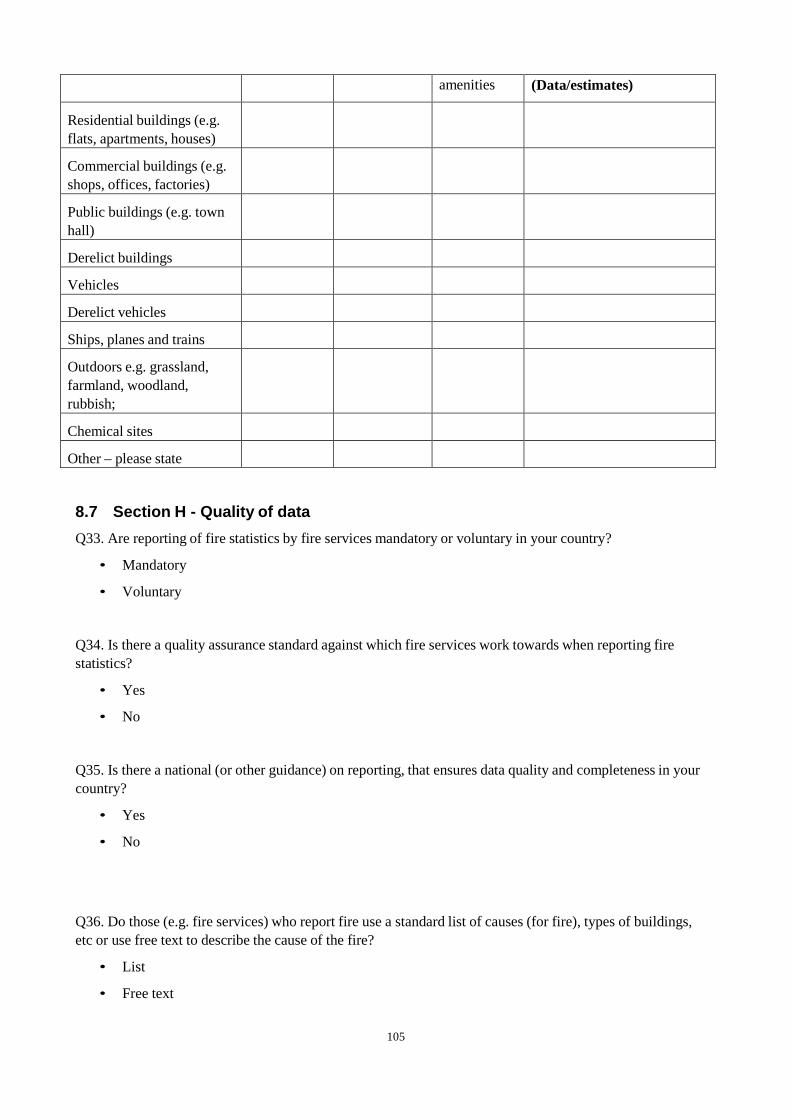
105
amenities (Data/estimates)
Residential buildings (e.g. flats, apartments, houses)
Commercial buildings (e.g. shops, offices, factories)
Public buildings (e.g. town hall)
Derelict buildings
Vehicles
Derelict vehicles
Ships, planes and trains
Outdoors e.g. grassland, farmland, woodland, rubbish;
Chemical sites
Other – please state
8.7 Section H - Quality of data
Q33. Are reporting of fire statistics by fire services mandatory or voluntary in your country?
• Mandatory
• Voluntary
Q34. Is there a quality assurance standard against which fire services work towards when reporting fire statistics?
• Yes
• No
Q35. Is there a national (or other guidance) on reporting, that ensures data quality and completeness in your country?
• Yes
• No
Q36. Do those (e.g. fire services) who report fire use a standard list of causes (for fire), types of buildings, etc or use free text to describe the cause of the fire?
• List
• Free text

106
Q37. In your opinion, how would you rate the overall quality and completeness of fire data held in your country?
• Very good
• Good
• Satisfactory
• Poor
• Very Poor
o If poor or very poor please identify in which areas you feel it could be improved e.g. building fires, grassland fires, etc
8.8 Section I – Future of statistics
Q38. Do you have or know of any ongoing or future changes on the collection or reporting of fire statistics in your country? Please elaborate.


![Comparison of a CFD fire model against a ventilated fire experiment … · Comparison of a CFD fire model against a ventilated fire experiment in an enclosure Yunlong Liu[1], Alfred](https://img.pdfslide.net/doc/110x75/5ad316257f8b9aff738d7dec/comparison-of-a-cfd-fire-model-against-a-ventilated-fire-experiment-of-a-cfd.jpg)