Embed Size (px)
Citation preview
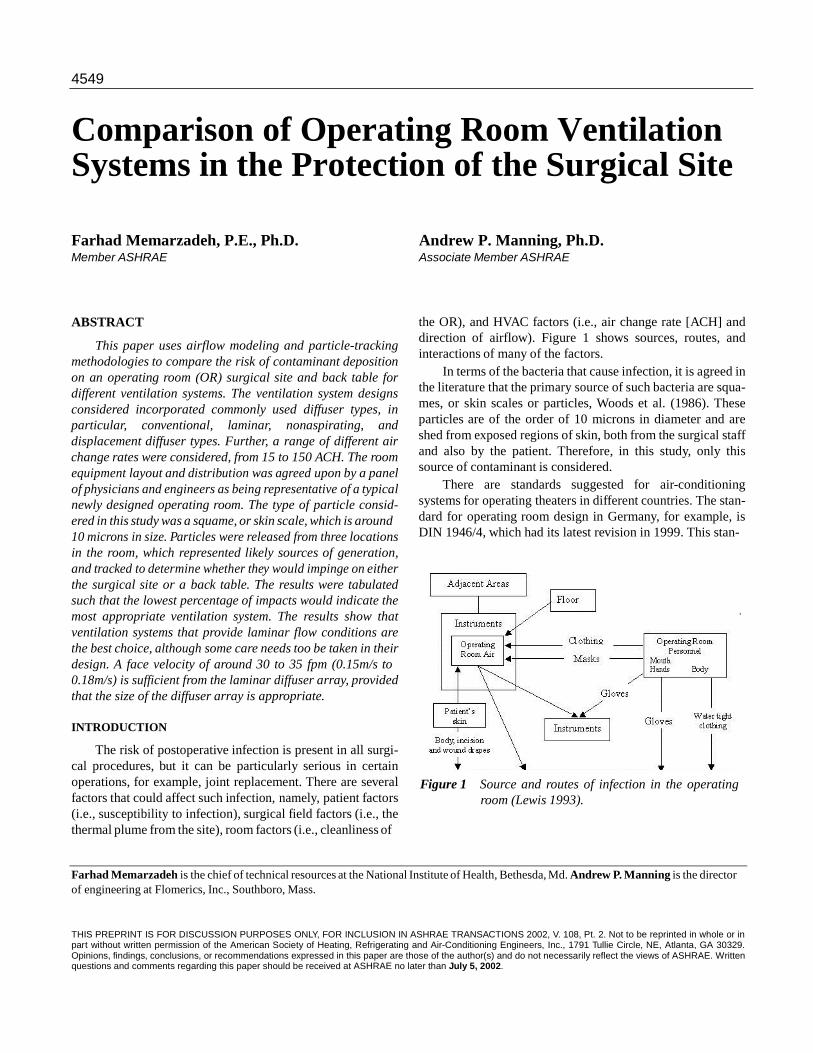
4549
Comparison of Operating Room Ventilation Systems in the Protection of the Surgical Site
Farhad Memarzadeh, P.E., Ph.D. Andrew P. Manning, Ph.D. Member ASHRAE Associate Member ASHRAE
ABSTRACT
This paper uses airflow modeling and particle-tracking methodologies to compare the risk of contaminant deposition on an operating room (OR) surgical site and back table for different ventilation systems. The ventilation system designs considered incorporated commonly used diffuser types, in particular, conventional, laminar, nonaspirating, and displacement diffuser types. Further, a range of different air change rates were considered, from 15 to 150 ACH. The room equipment layout and distribution was agreed upon by a panel of physicians and engineers as being representative of a typical newly designed operating room. The type of particle consid- ered in this study was a squame, or skin scale, which is around 10 microns in size. Particles were released from three locations in the room, which represented likely sources of generation, and tracked to determine whether they would impinge on either the surgical site or a back table. The results were tabulated such that the lowest percentage of impacts would indicate the most appropriate ventilation system. The results show that ventilation systems that provide laminar flow conditions are the best choice, although some care needs too be taken in their design. A face velocity of around 30 to 35 fpm (0.15m/s to 0.18m/s) is sufficient from the laminar diffuser array, provided that the size of the diffuser array is appropriate.
INTRODUCTION
The risk of postoperative infection is present in all surgi- cal procedures, but it can be particularly serious in certain operations, for example, joint replacement. There are several factors that could affect such infection, namely, patient factors (i.e., susceptibility to infection), surgical field factors (i.e., the thermal plume from the site), room factors (i.e., cleanliness of
the OR), and HVAC factors (i.e., air change rate [ACH] and direction of airflow). Figure 1 shows sources, routes, and interactions of many of the factors.
In terms of the bacteria that cause infection, it is agreed in the literature that the primary source of such bacteria are squa- mes, or skin scales or particles, Woods et al. (1986). These particles are of the order of 10 microns in diameter and are shed from exposed regions of skin, both from the surgical staff and also by the patient. Therefore, in this study, only this source of contaminant is considered.
There are standards suggested for air-conditioning systems for operating theaters in different countries. The stan- dard for operating room design in Germany, for example, is DIN 1946/4, which had its latest revision in 1999. This stan-
Figure 1 Source and routes of infection in the operating
room (Lewis 1993).
Farhad Memarzadeh is the chief of technical resources at the National Institute of Health, Bethesda, Md. Andrew P. Manning is the director of engineering at Flomerics, Inc., Southboro, Mass.
THIS PREPRINT IS FOR DISCUSSION PURPOSES ONLY, FOR INCLUSION IN ASHRAE TRANSACTIONS 2002, V. 108, Pt. 2. Not to be reprinted in whole or in part without written permission of the American Society of Heating, Refrigerating and Air-Conditioning Engineers, Inc., 1791 Tullie Circle, NE, Atlanta, GA 30329. Opinions, findings, conclusions, or recommendations expressed in this paper are those of the author(s) and do not necessarily reflect the views of ASHRAE. Written questions and comments regarding this paper should be received at ASHRAE no later than July 5, 2002.
2
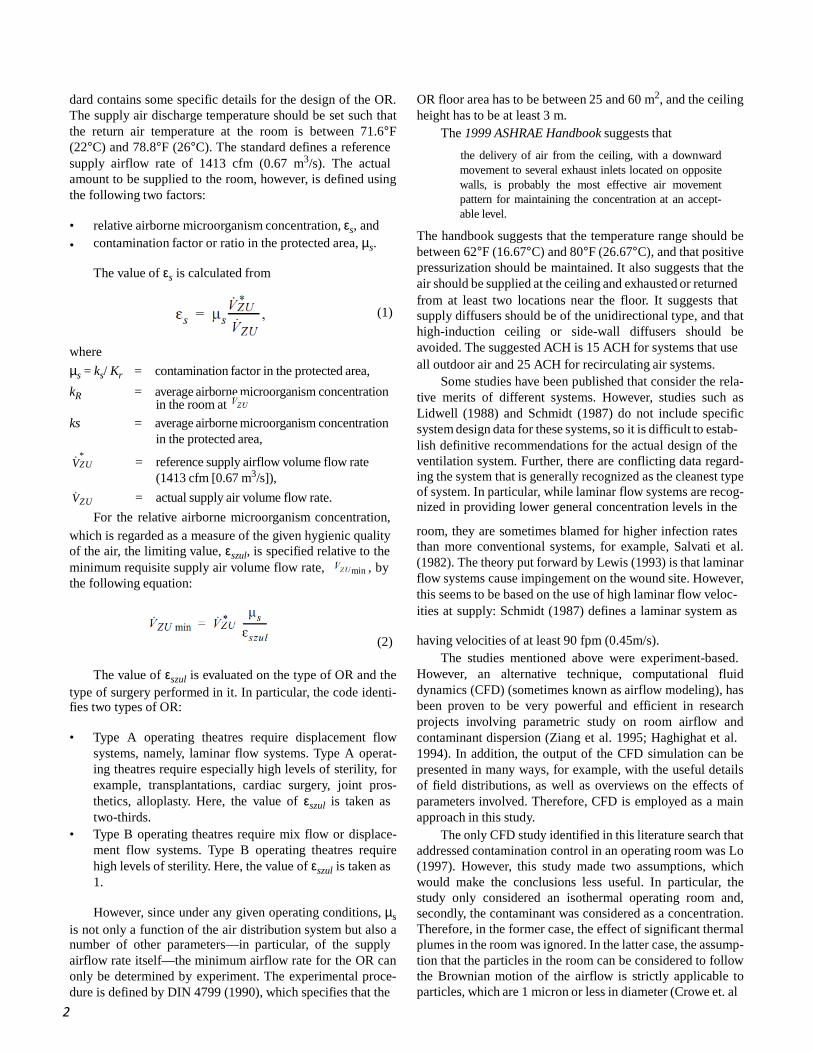
dard contains some specific details for the design of the OR. The supply air discharge temperature should be set such that the return air temperature at the room is between 71.6°F (22°C) and 78.8°F (26°C). The standard defines a reference supply airflow rate of 1413 cfm (0.67 m3/s). The actual amount to be supplied to the room, however, is defined using the following two factors:
• relative airborne microorganism concentration, εs, and • contamination factor or ratio in the protected area, µs.
The value of εs is calculated from
OR floor area has to be between 25 and 60 m2, and the ceiling height has to be at least 3 m.
The 1999 ASHRAE Handbook suggests that
the delivery of air from the ceiling, with a downward movement to several exhaust inlets located on opposite walls, is probably the most effective air movement pattern for maintaining the concentration at an accept- able level.
The handbook suggests that the temperature range should be between 62°F (16.67°C) and 80°F (26.67°C), and that positive pressurization should be maintained. It also suggests that the air should be supplied at the ceiling and exhausted or returned from at least two locations near the floor. It suggests that
where
(1) supply diffusers should be of the unidirectional type, and that high-induction ceiling or side-wall diffusers should be avoided. The suggested ACH is 15 ACH for systems that use
µs = ks/ Kr = contamination factor in the protected area, kR = average airborne microorganism concentration
in the room at ks = average airborne microorganism concentration
in the protected area,
all outdoor air and 25 ACH for recirculating air systems. Some studies have been published that consider the rela-
tive merits of different systems. However, studies such as Lidwell (1988) and Schmidt (1987) do not include specific system design data for these systems, so it is difficult to estab- lish definitive recommendations for the actual design of the
· * VZU
· VZU
= reference supply airflow volume flow rate (1413 cfm [0.67 m3/s]),
= actual supply air volume flow rate. For the relative airborne microorganism concentration,
ventilation system. Further, there are conflicting data regard- ing the system that is generally recognized as the cleanest type of system. In particular, while laminar flow systems are recog- nized in providing lower general concentration levels in the
which is regarded as a measure of the given hygienic quality of the air, the limiting value, εszul, is specified relative to the minimum requisite supply air volume flow rate, min , by the following equation:
room, they are sometimes blamed for higher infection rates than more conventional systems, for example, Salvati et al. (1982). The theory put forward by Lewis (1993) is that laminar flow systems cause impingement on the wound site. However, this seems to be based on the use of high laminar flow veloc-
· = ·
ities at supply: Schmidt (1987) defines a laminar system as VZU
(2) having velocities of at least 90 fpm (0.45m/s). The studies mentioned above were experiment-based.
The value of εszul is evaluated on the type of OR and the type of surgery performed in it. In particular, the code identi- fies two types of OR:
• Type A operating theatres require displacement flow
systems, namely, laminar flow systems. Type A operat- ing theatres require especially high levels of sterility, for example, transplantations, cardiac surgery, joint pros- thetics, alloplasty. Here, the value of εszul is taken as two-thirds.
• Type B operating theatres require mix flow or displace- ment flow systems. Type B operating theatres require high levels of sterility. Here, the value of εszul is taken as 1.
However, since under any given operating conditions, µs
is not only a function of the air distribution system but also a number of other parameters—in particular, of the supply airflow rate itself—the minimum airflow rate for the OR can only be determined by experiment. The experimental proce- dure is defined by DIN 4799 (1990), which specifies that the
However, an alternative technique, computational fluid dynamics (CFD) (sometimes known as airflow modeling), has been proven to be very powerful and efficient in research projects involving parametric study on room airflow and contaminant dispersion (Ziang et al. 1995; Haghighat et al. 1994). In addition, the output of the CFD simulation can be presented in many ways, for example, with the useful details of field distributions, as well as overviews on the effects of parameters involved. Therefore, CFD is employed as a main approach in this study.
The only CFD study identified in this literature search that addressed contamination control in an operating room was Lo (1997). However, this study made two assumptions, which would make the conclusions less useful. In particular, the study only considered an isothermal operating room and, secondly, the contaminant was considered as a concentration. Therefore, in the former case, the effect of significant thermal plumes in the room was ignored. In the latter case, the assump- tion that the particles in the room can be considered to follow the Brownian motion of the airflow is strictly applicable to particles, which are 1 micron or less in diameter (Crowe et. al
3
1998). While bacteria and viruses do conform to this criteria, as noted above, bacteria are usually transported in operating rooms by squames, which are considerably bigger (in the range of 10 microns) and so do not necessarily follow Brown- ian motion. For this reason, concentration sources were not used in this study. A further reason was that the use of concen- tration would make the question of impact of the particles on the surgical site more difficult to determine.
In the study documented here, airflow modeling is used to consider the dispersion of squame-sized particles in various ventilation system design operating rooms. The particle track- ing routine was previously developed for use in Memarzadeh (2000). In order to establish the relative ranking of the differ- ent systems, two target areas of concern are considered: the surgical site and back table. The reason for the latter target is that squames that strike this surface are likely to directly contaminate instruments.
PURPOSE OF STUDY
The main purposes of the study presented in this paper are to
• use advanced numerical modeling and empirical data to
evaluate the effects of some of the room parameters, such as
• ventilation flow rate, • diffuser type and location, • supply temperature, and • exhaust location,
on minimizing the risk of contamination of an operating room surgical site and a back table from specific particu- late sources;
• evaluate the same parameters to determine which venti-
lation systems evacuate the room of particles most effec- tively; and
• provide an architectural/engineering tool for good design practice that is generally applicable to conven- tional operating room use.
METHODOLOGY
Airflow Modeling Airflow modeling based on computational fluid dynam-
ics (CFD), which solves the fundamental conservation equa- tions for mass, momentum, and energy in the form of the Navier-Stokes equations, is now well established.
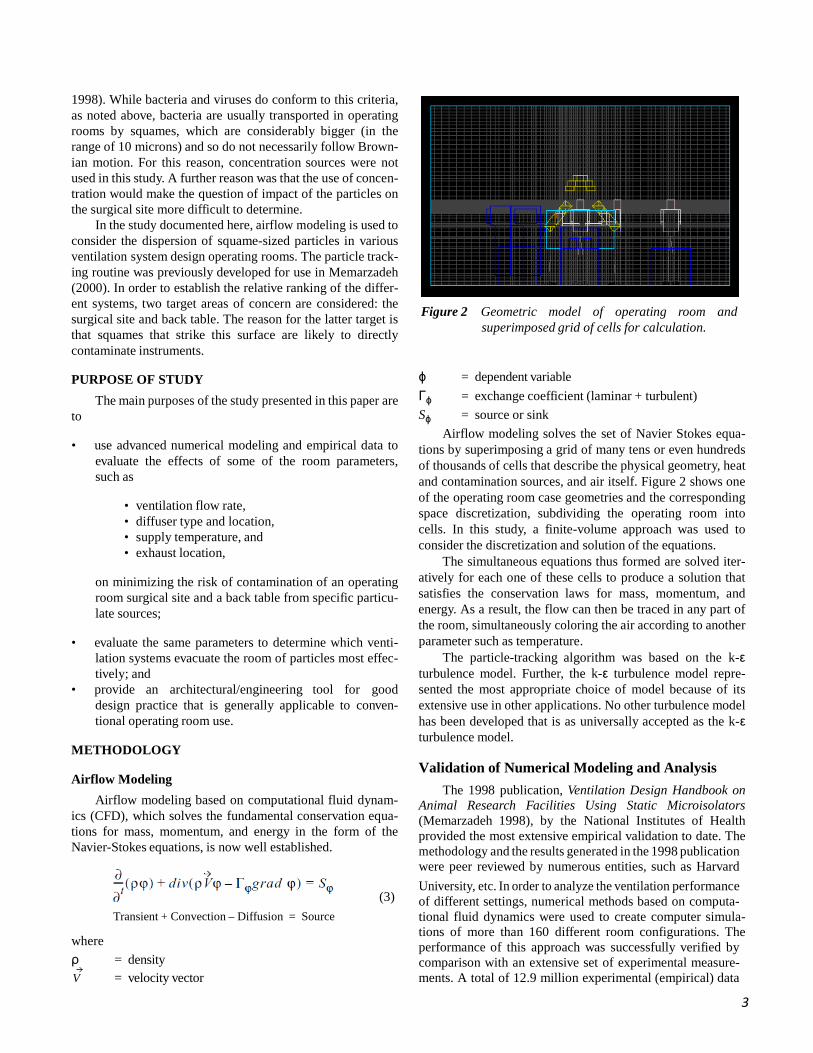
Figure 2 Geometric model of operating room and
superimposed grid of cells for calculation. ϕ = dependent variable Γϕ = exchange coefficient (laminar + turbulent) Sϕ = source or sink
Airflow modeling solves the set of Navier Stokes equa- tions by superimposing a grid of many tens or even hundreds of thousands of cells that describe the physical geometry, heat and contamination sources, and air itself. Figure 2 shows one of the operating room case geometries and the corresponding space discretization, subdividing the operating room into cells. In this study, a finite-volume approach was used to consider the discretization and solution of the equations.
The simultaneous equations thus formed are solved iter- atively for each one of these cells to produce a solution that satisfies the conservation laws for mass, momentum, and energy. As a result, the flow can then be traced in any part of the room, simultaneously coloring the air according to another parameter such as temperature.
The particle-tracking algorithm was based on the k-ε turbulence model. Further, the k-ε turbulence model repre- sented the most appropriate choice of model because of its extensive use in other applications. No other turbulence model has been developed that is as universally accepted as the k-ε turbulence model. Validation of Numerical Modeling and Analysis
The 1998 publication, Ventilation Design Handbook on Animal Research Facilities Using Static Microisolators (Memarzadeh 1998), by the National Institutes of Health provided the most extensive empirical validation to date. The methodology and the results generated in the 1998 publication were peer reviewed by numerous entities, such as Harvard
(3)
University, etc. In order to analyze the ventilation performance of different settings, numerical methods based on computa-
where
Transient + Convection – Diffusion = Source tional fluid dynamics were used to create computer simula- tions of more than 160 different room configurations. The performance of this approach was successfully verified by
ρ = density V = velocity vector
comparison with an extensive set of experimental measure- ments. A total of 12.9 million experimental (empirical) data
4
values were collected to confirm the methodology. The aver-
---------- CD AP ρ ( w – wp )
( u – up )
+ ( v vp )
+ ( w –
+ mp gz
age error between the experimental and computational values was 14.36% for temperature and velocities, while the equiva- lent value for concentrations was 14.50%.
To forward this research, several meetings were held to solicit project input and feedback from the participants. There were more than 55 international experts in all facets of the animal care and use community, including scientists, veteri- narians, engineers, animal facility managers, and cage and rack manufacturers. The prepublication project report under- went peer review by a ten-member panel from the participant group, selected for their expertise in pertinent areas. Their comments were adopted and incorporated in the final report.
The results from the 1998 publication were also reviewed
where
by several ASHRAE technical committees and were cited in the 1999 ASHRAE Handbook—Applications and the 2001 ASHRAE Handbook—Fundamentals.
Simulation of Contaminant Particles
The basic assumption in this study is that the squames can
be simulated as particles being released from several sources surrounding the occupant. These particles are then tracked for a certain period of time in the room. The methodology is simi- lar to that employed previously in Memarzadeh and Jiang (2000), where tuberculosis carrying droplets were released from around the patient in an isolation room to simulate coughs, and were subsequently tracked. Since the airflow in a
u, v, w = instantaneous velocities of air in x, y, and z directions
up, vp, wp = particle velocity in x, y, and z directions xp, yp, zp = particle moving in x, y and z direction gx, gy, gz = gravity in x, y, and z directions Ap = cross-sectional area of the particle mp = mass of the particle ρ = density of the particle CD = drag coefficient dt = time interval
ventilated room is turbulent, the squames are transported not = -
for Re ≤ 560
only by convection of the airflow but also by the turbulent diffusion. The squames are light enough and in small enough quantities that they can be considered not to exert an influence on airflow. Therefore, from the output of the CFD simulation,
and
(6)
the distributions of air velocities and the turbulent parameters can be directly applied to predict the path of the airborne squa-
mes in convection and diffusion processes. Particle Trajectories
The methodology for predicting turbulent particle disper-
sion used in this study was originally laid out by Gosman and Ioannides (1981) and validated by Ormancey and Martinon (1984), Shuen et al. (1983), and Chen and Crowe (1984). Experimental validation data were obtained from Snyder and Lumley (1971). Turbulence was incorporated into the Stochastic model via the k-ε turbulence model (Alani et al. 1998).
The particle trajectories are obtained by integrating the equation of motion in three coordinates:
The Reynolds number of the particle is based on the rela- tive velocity between particle and air.
In laminar flow, particles released from a point source with the same weight would initially follow the airstream in the same path and then fall under the effect of gravity. Unlike laminar flow, the random nature of turbulence indicates that the particles released from the same point source will be randomly affected by turbulent eddies. As a result, they will be diffused away from the streamline at different fluctuating levels. In order to model the turbulent diffusion, the instanta- neous fluid velocities in the three Cartesian directions—u, v, and w—are decomposed into the mean velocity component and the turbulent fluctuating component as
p
u = u + u ', v = v + v ', w = w + w ′,
-D 1
where u and u ' are the mean and fluctuating components in x-direction. The same applies for y- and z-directions. The stochastic approach prescribes the use of a random number generator algorithm, which, in this case, is taken from Press et
al. (1992) to model the fluctuating velocity. It is achieved by
5
using a random sampling of a Gaussian distribution with a mean of zero and a standard deviation of unity. Assuming isotropic turbulence, the instantaneous velocities of air are
then calculated from kinetic energy of turbulence:
(13)
=
v = v + Nα
w = w + Nα
(8b)
(8c)
where τ is the particle relaxation time, indicating the time required for a particle starting from rest to reach 63% of the flowing stream velocity. The variable D is the diameter of the
where N is the pseudo-random number, ranging from 0 to1, with
= ,
particle. The interaction time is determined by the relative impor-
tance of the two events. If the particle moves slowly relative to
(9) the gas, it will remain in the eddy during the whole lifetime of the eddy, te. If the relative velocity between the particle and the gas is appreciable, the particle will transverse the eddy in its
where k is the turbulent kinetic energy. The mean velocities, which are the direct output of CFD,
determine the convection of the particles along the streamline,
transient time, tr, Therefore, the interaction time is the mini- mum of the two:
while the turbulent fluctuating velocity, Nα, contributes to the turbulent diffusion of the particle.
tint = min( te , tr ) Particle Outcomes
(14)
Particle Interaction Time
With the velocities known, the only component needed for calculating the trajectory is the time interval (tint) over which the particle interacts with the turbulent flow field. The concept of turbulence being composed of eddies is employed here. Before determining the interaction time, two important time scales need to be introduced: the eddy’s time scale and the particle transient time scale.
The eddy’s time scale is the lifetime of an eddy, defined as
The methodology was refined to consider different parti- cle outcomes, namely: • the particle is vented from the room via ventilation and • the particle hits one of the two designated targets,
namely, the surgical site (defined later) or the top sur- face of the back table.
Particles that are neither vented nor strike the target are
assumed to remain in the room when the overall particle track- ing time limit is reached.
where
(10) Testing of Particle Tracking and Target Detection Methodology
A simple test configuration was defined to confirm that the particle tracking methodology was functioning as intended. There are many aspects to be investigated, including
(11) inertial, gravitational, and slip effects, but, in particular, the simulation sample here was intended to test that the target detection methodology worked correctly. The test was speci- fied to incorporate typical flow and blockage effects present in the operating room, in particular, an inlet (supply), openings (vents), a block in the flow path (internal geometry and obstructions), and a specific target.
The test configuration had dimensions of 20 in. × 20 in. × The transient time scale for the particle to pass through the
eddy, tr, is estimated as 40 in. (0.5 m × 0.5 m × 1.0 m). It contained a 20 in. × 20 in. (0.5 m × 0.5 m) supply at one end, through which the flow rate was varied, and an opening of half that size at the other end. The opening was defined as representing atmospheric condi-
tions: no flow rate was defined through the openings. There
were two blocks, of dimensions 20 in. × 10 in. × 20 in. (0.5 m and
(12)
× 0.25 m × 0.5 m) and 8 in. × 4 in. × 20 in. (0.2 m × 0.1 m × 0.5 m), which were included to represent typical obstruction. A target of dimension 6 in. × 20 in. (0.15 m × 0.5 m) was also included.
6
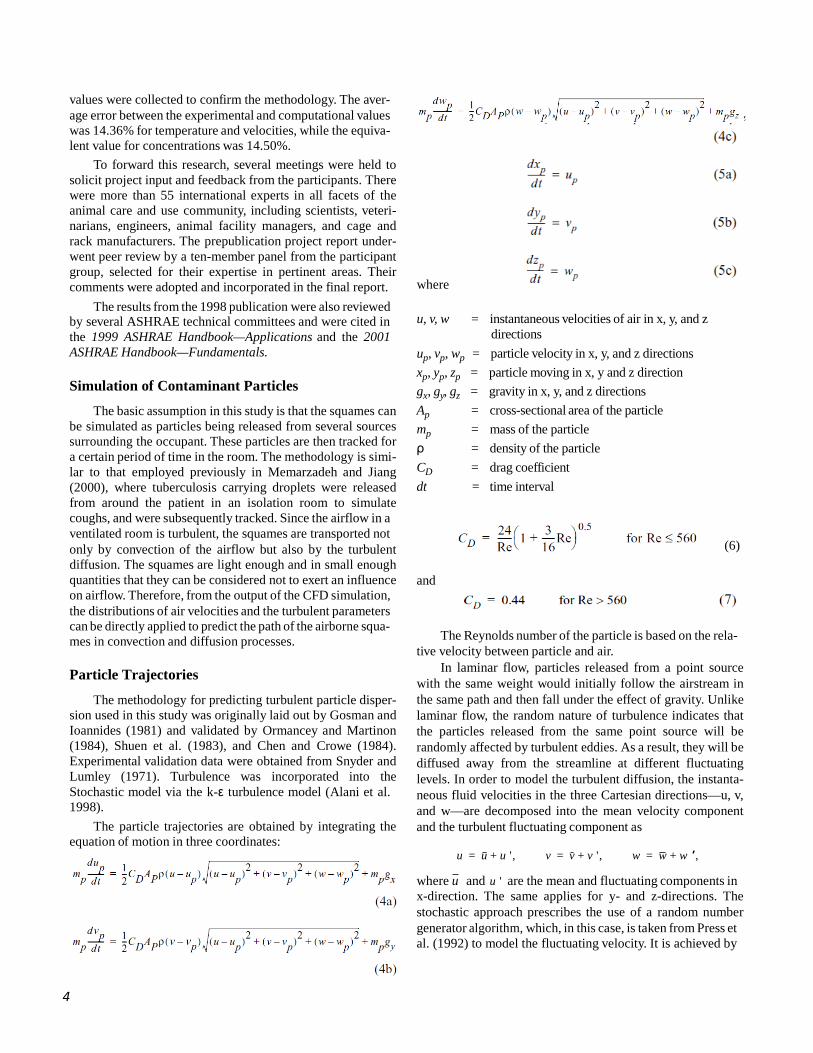
Figure 3 Result of particle target test case.
In the tests, 20 particles were released with even spacing across the center of the inlet supply. The test particles were 10 mm in diameter, with a density of 1000 kg/m3. A flow rate of 1060 cfm (0.5m3/s) was considered. Different coordinate orientations were considered to evaluate whether coordinate biasing existed. In particular, the configuration was consid- ered with the supply in the positive and negative x, y, and z directions, respectively. Therefore, six cases were run to test the particle tracking methodology.
The results of a typical case are shown in Figure 3, in particular, the positive x. The blue lines represent the particle tracks. The figure clearly shows that the target stops two parti- cles and that the rest of the particles exit correctly through the end opening.
These features are also exhibited by all the other cases. Based on the results from these tests, the particle tracking methodology can be seen to be working correctly.
Calculation Procedure
The calculation procedure was as follows:
• Compute the field distribution of fluid velocity, temper- ature, and turbulent parameters.
• Specify the source locations from where a specified number of particles are released. Note that the particles are not continuously released: they are released from the source locations only at the start of the analysis time period (i.e., t = 0 s).
• Perform computational analysis to calculate trajectory for each particle for up to 3600 s from initial release. The output of the analysis includes
• the percentage of particles that are vented from the room via ventilation, varying with time, and
• the percentage of particles that strike a desig- nated target in the room, in particular, either the surgical site or the top surface of the back table, at the end of the overall time period (3600 s). Note that this quantity was not measured with time because of the small number of particles that actually hit the targets.
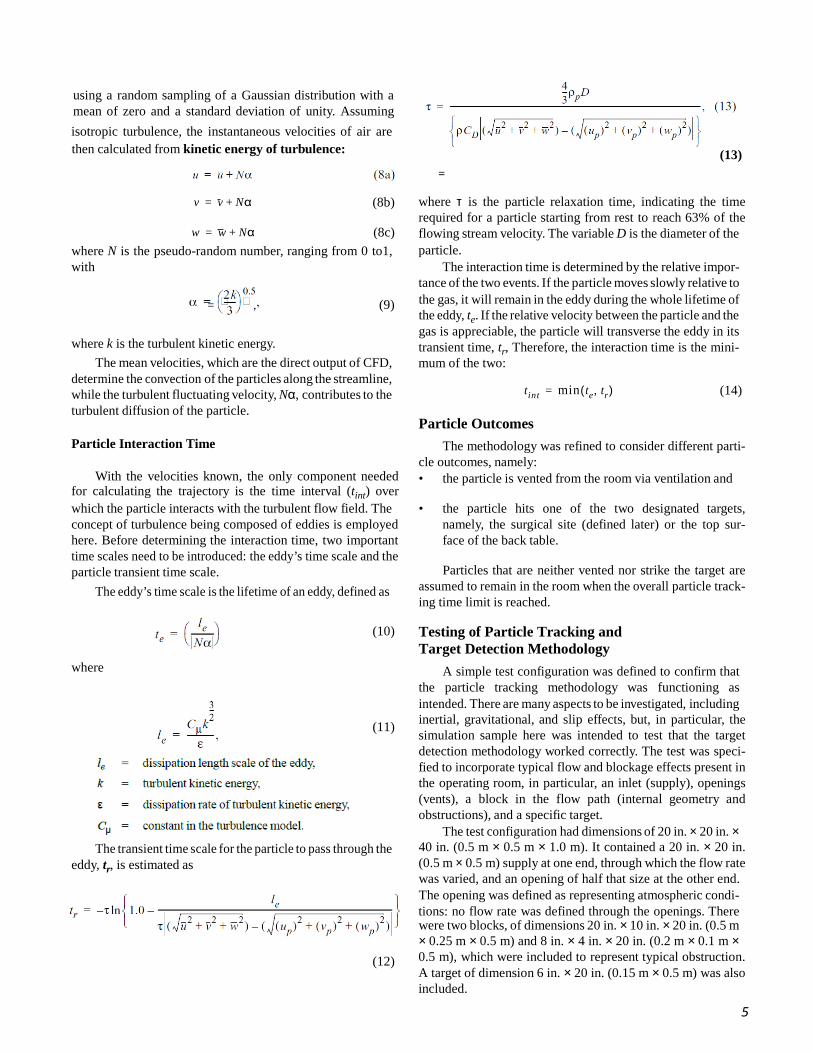
Figure 4 Layout of baseline operating room—Mayo stand
view.
OUTLINE OF BASELINE MODEL
A typical operating room layout in terms of the number of surgical staff, lights, machinery, tables, and patient was considered for the baseline model for the CFD simulations. The general features of the baseline room are given in Figure 4 and Table 1 and are listed below.
A panel of physicians and engineers agreed upon the layout of the room during the initial stages of the study. Items such as gas columns were not included with the belief that they obstruct the free movement of large equipment in operating rooms, limit the placement and position of the operating table, and are difficult to keep clean. Also, the panel believes oper- ating rooms should be going more toward connection of gas lines at the ceiling, since such lines would not provide signif- icant blockage to airflow. Other significant items of equip- ment, for example, a C-arm, were not included in this study, as the panel felt that they did not constitute “typical” equipment. It is recognized that such items may influence the airflow and temperature distribution in the OR, and that they should be considered in future studies. Description in Brief Room • 20 ft × 20 ft × 12 ft (6.1 m × 6.1 m × 3.66 m) high • Five surgical staff members • One patient • One back table • One anesthesia machine • Two monitors (and stands) • One inactive machine • Two surgical lights • Dimensions of internal blockages are given in Table 1.
7
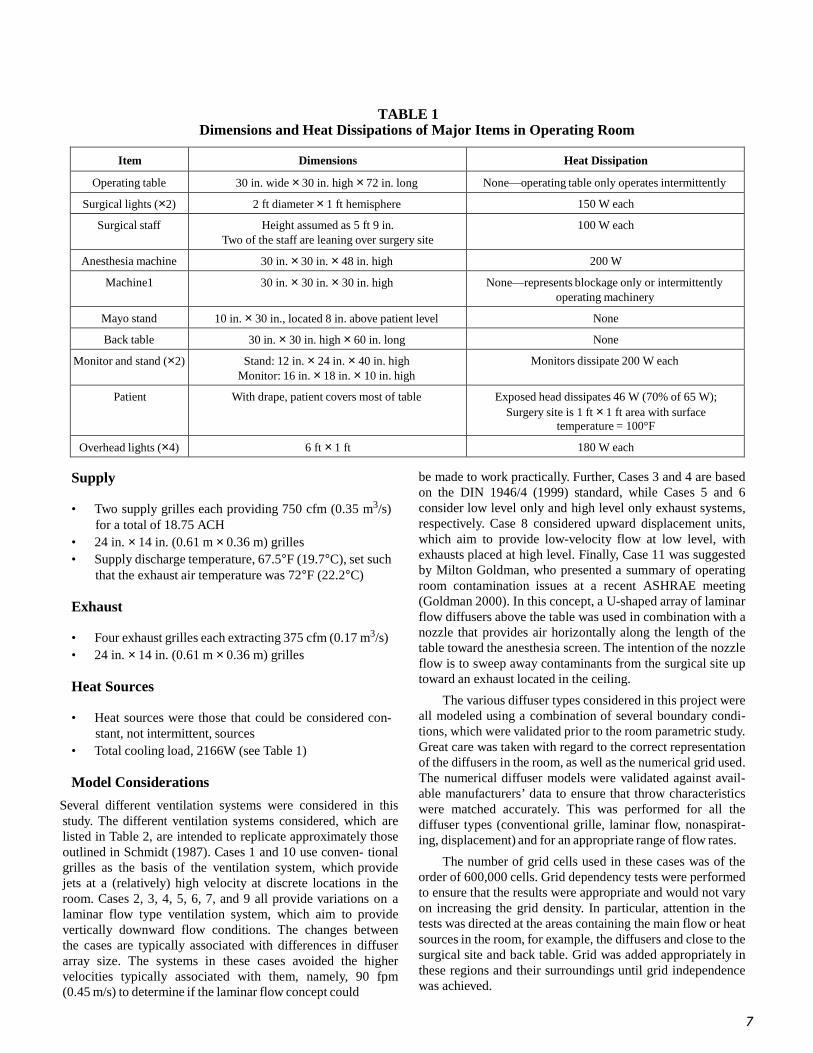
TABLE 1 Dimensions and Heat Dissipations of Major Items in Operating Room
Item Dimensions Heat Dissipation
Operating table 30 in. wide × 30 in. high × 72 in. long None—operating table only operates intermittently
Surgical lights (×2) 2 ft diameter × 1 ft hemisphere 150 W each
Surgical staff Height assumed as 5 ft 9 in. Two of the staff are leaning over surgery site
100 W each
Anesthesia machine 30 in. × 30 in. × 48 in. high 200 W
Machine1 30 in. × 30 in. × 30 in. high None—represents blockage only or intermittently operating machinery
Mayo stand 10 in. × 30 in., located 8 in. above patient level None
Back table 30 in. × 30 in. high × 60 in. long None
Monitor and stand (×2) Stand: 12 in. × 24 in. × 40 in. high Monitor: 16 in. × 18 in. × 10 in. high
Monitors dissipate 200 W each
Patient With drape, patient covers most of table Exposed head dissipates 46 W (70% of 65 W); Surgery site is 1 ft × 1 ft area with surface
temperature = 100°F
Overhead lights (×4) 6 ft × 1 ft 180 W each
Supply
• Two supply grilles each providing 750 cfm (0.35 m3/s) for a total of 18.75 ACH
• 24 in. × 14 in. (0.61 m × 0.36 m) grilles • Supply discharge temperature, 67.5°F (19.7°C), set such
that the exhaust air temperature was 72°F (22.2°C)
Exhaust
• Four exhaust grilles each extracting 375 cfm (0.17 m3/s) • 24 in. × 14 in. (0.61 m × 0.36 m) grilles
Heat Sources
• Heat sources were those that could be considered con-
stant, not intermittent, sources • Total cooling load, 2166W (see Table 1)
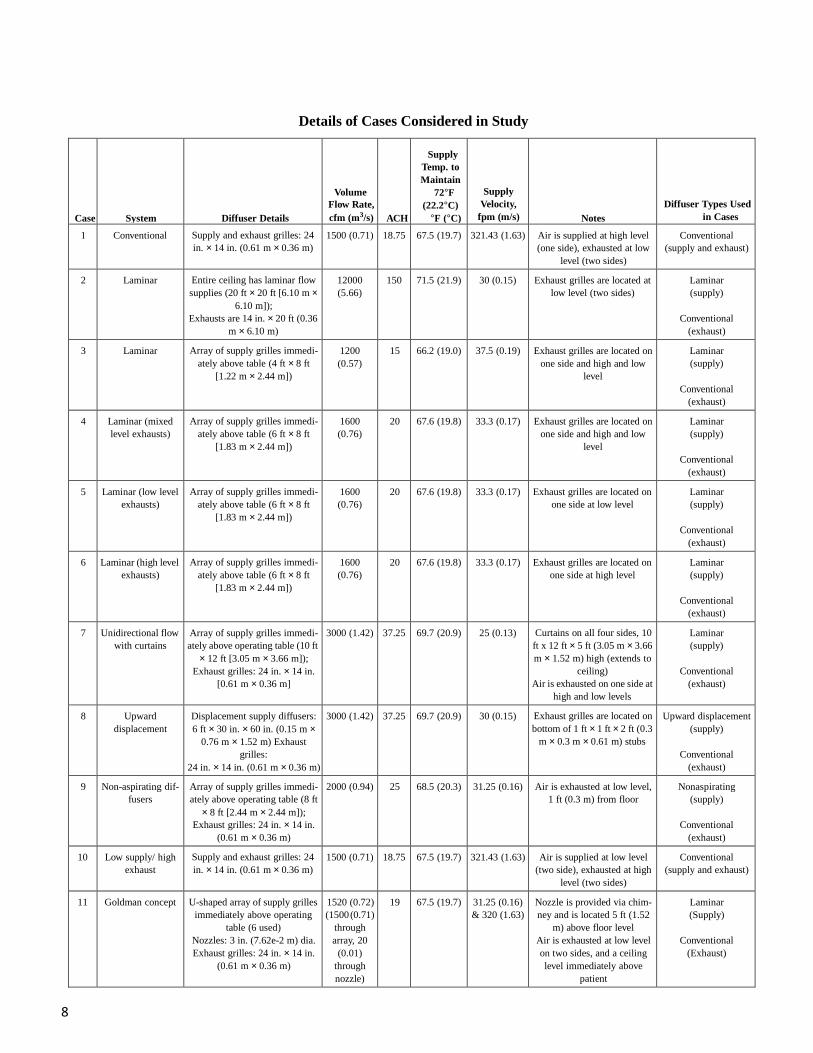
Model Considerations
Several different ventilation systems were considered in this study. The different ventilation systems considered, which are listed in Table 2, are intended to replicate approximately those outlined in Schmidt (1987). Cases 1 and 10 use conven- tional grilles as the basis of the ventilation system, which provide jets at a (relatively) high velocity at discrete locations in the room. Cases 2, 3, 4, 5, 6, 7, and 9 all provide variations on a laminar flow type ventilation system, which aim to provide vertically downward flow conditions. The changes between the cases are typically associated with differences in diffuser array size. The systems in these cases avoided the higher velocities typically associated with them, namely, 90 fpm (0.45 m/s) to determine if the laminar flow concept could
be made to work practically. Further, Cases 3 and 4 are based on the DIN 1946/4 (1999) standard, while Cases 5 and 6 consider low level only and high level only exhaust systems, respectively. Case 8 considered upward displacement units, which aim to provide low-velocity flow at low level, with exhausts placed at high level. Finally, Case 11 was suggested by Milton Goldman, who presented a summary of operating room contamination issues at a recent ASHRAE meeting (Goldman 2000). In this concept, a U-shaped array of laminar flow diffusers above the table was used in combination with a nozzle that provides air horizontally along the length of the table toward the anesthesia screen. The intention of the nozzle flow is to sweep away contaminants from the surgical site up toward an exhaust located in the ceiling.
The various diffuser types considered in this project were all modeled using a combination of several boundary condi- tions, which were validated prior to the room parametric study. Great care was taken with regard to the correct representation of the diffusers in the room, as well as the numerical grid used. The numerical diffuser models were validated against avail- able manufacturers’ data to ensure that throw characteristics were matched accurately. This was performed for all the diffuser types (conventional grille, laminar flow, nonaspirat- ing, displacement) and for an appropriate range of flow rates.
The number of grid cells used in these cases was of the order of 600,000 cells. Grid dependency tests were performed to ensure that the results were appropriate and would not vary on increasing the grid density. In particular, attention in the tests was directed at the areas containing the main flow or heat sources in the room, for example, the diffusers and close to the surgical site and back table. Grid was added appropriately in these regions and their surroundings until grid independence was achieved.
8
Details of Cases Considered in Study
Case System Diffuser Details
Volume Flow Rate, cfm (m3/s) ACH
Supply Temp. to Maintain
72°F (22.2°C)
°F (°C)
Supply Velocity,
fpm (m/s) Notes Diffuser Types Used
in Cases
1 Conventional Supply and exhaust grilles: 24 in. × 14 in. (0.61 m × 0.36 m)
1500 (0.71) 18.75 67.5 (19.7) 321.43 (1.63) Air is supplied at high level (one side), exhausted at low
level (two sides)
Conventional (supply and exhaust)
2 Laminar Entire ceiling has laminar flow supplies (20 ft × 20 ft [6.10 m ×
6.10 m]); Exhausts are 14 in. × 20 ft (0.36
m × 6.10 m)
12000 (5.66)
150 71.5 (21.9) 30 (0.15) Exhaust grilles are located at low level (two sides)
Laminar (supply)
Conventional
(exhaust)
3 Laminar Array of supply grilles immedi- ately above table (4 ft × 8 ft
[1.22 m × 2.44 m])
1200 (0.57)
15 66.2 (19.0) 37.5 (0.19) Exhaust grilles are located on one side and high and low
level
Laminar (supply)
Conventional
(exhaust)
4 Laminar (mixed level exhausts)
Array of supply grilles immedi- ately above table (6 ft × 8 ft
[1.83 m × 2.44 m])
1600 (0.76)
20 67.6 (19.8) 33.3 (0.17) Exhaust grilles are located on one side and high and low
level
Laminar (supply)
Conventional
(exhaust)
5 Laminar (low level exhausts)
Array of supply grilles immedi- ately above table (6 ft × 8 ft
[1.83 m × 2.44 m])
1600 (0.76)
20 67.6 (19.8) 33.3 (0.17) Exhaust grilles are located on one side at low level
Laminar (supply)
Conventional
(exhaust)
6 Laminar (high level exhausts)
Array of supply grilles immedi- ately above table (6 ft × 8 ft
[1.83 m × 2.44 m])
1600 (0.76)
20 67.6 (19.8) 33.3 (0.17) Exhaust grilles are located on one side at high level
Laminar (supply)
Conventional
(exhaust)
7 Unidirectional flow with curtains
Array of supply grilles immedi- ately above operating table (10 ft
× 12 ft [3.05 m × 3.66 m]); Exhaust grilles: 24 in. × 14 in.
[0.61 m × 0.36 m]
3000 (1.42) 37.25 69.7 (20.9) 25 (0.13) Curtains on all four sides, 10 ft x 12 ft × 5 ft (3.05 m × 3.66 m × 1.52 m) high (extends to
ceiling) Air is exhausted on one side at
high and low levels
Laminar (supply)
Conventional
(exhaust)
8 Upward displacement
Displacement supply diffusers: 6 ft × 30 in. × 60 in. (0.15 m ×
0.76 m × 1.52 m) Exhaust grilles:
24 in. × 14 in. (0.61 m × 0.36 m)
3000 (1.42) 37.25 69.7 (20.9) 30 (0.15) Exhaust grilles are located on bottom of 1 ft × 1 ft × 2 ft (0.3
m × 0.3 m × 0.61 m) stubs
Upward displacement (supply)
Conventional
(exhaust)
9 Non-aspirating dif- fusers
Array of supply grilles immedi- ately above operating table (8 ft
× 8 ft [2.44 m × 2.44 m]); Exhaust grilles: 24 in. × 14 in.
(0.61 m × 0.36 m)
2000 (0.94) 25 68.5 (20.3) 31.25 (0.16) Air is exhausted at low level, 1 ft (0.3 m) from floor
Nonaspirating (supply)
Conventional
(exhaust)
10 Low supply/ high exhaust
Supply and exhaust grilles: 24 in. × 14 in. (0.61 m × 0.36 m)
1500 (0.71) 18.75 67.5 (19.7) 321.43 (1.63) Air is supplied at low level (two side), exhausted at high
level (two sides)
Conventional (supply and exhaust)
11 Goldman concept U-shaped array of supply grilles immediately above operating
table (6 used) Nozzles: 3 in. (7.62e-2 m) dia. Exhaust grilles: 24 in. × 14 in.
(0.61 m × 0.36 m)
1520 (0.72) (1500 (0.71)
through array, 20
(0.01) through nozzle)
19 67.5 (19.7) 31.25 (0.16) & 320 (1.63)
Nozzle is provided via chim- ney and is located 5 ft (1.52
m) above floor level Air is exhausted at low level on two sides, and a ceiling level immediately above
patient
Laminar (Supply)
Conventional
(Exhaust)
9
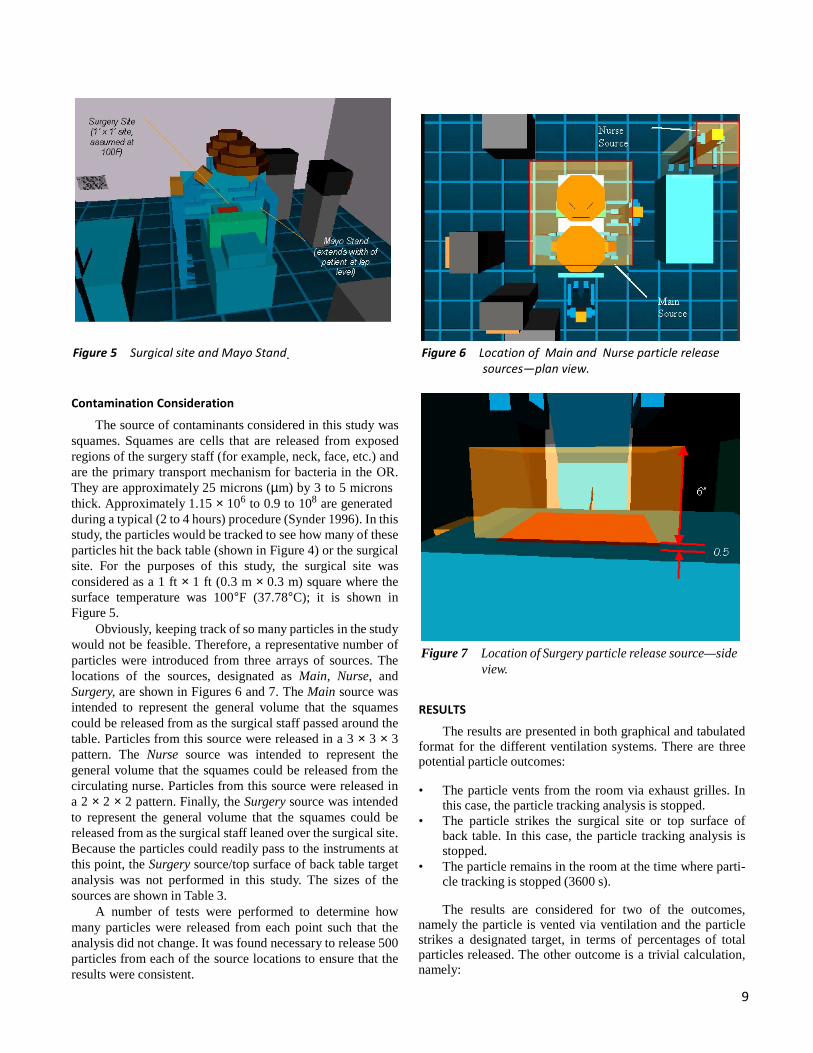
Figure 5 Surgical site and Mayo Stand. Figure 6 Location of Main and Nurse particle release sources—plan view.
Contamination Consideration
The source of contaminants considered in this study was squames. Squames are cells that are released from exposed regions of the surgery staff (for example, neck, face, etc.) and are the primary transport mechanism for bacteria in the OR. They are approximately 25 microns (µm) by 3 to 5 microns thick. Approximately 1.15 × 10⁶ to 0.9 to 108 are generated during a typical (2 to 4 hours) procedure (Synder 1996). In this study, the particles would be tracked to see how many of these particles hit the back table (shown in Figure 4) or the surgical site. For the purposes of this study, the surgical site was considered as a 1 ft × 1 ft (0.3 m × 0.3 m) square where the surface temperature was 100°F (37.78°C); it is shown in Figure 5.
Obviously, keeping track of so many particles in the study would not be feasible. Therefore, a representative number of particles were introduced from three arrays of sources. The locations of the sources, designated as Main, Nurse, and Surgery, are shown in Figures 6 and 7. The Main source was intended to represent the general volume that the squames could be released from as the surgical staff passed around the table. Particles from this source were released in a 3 × 3 × 3 pattern. The Nurse source was intended to represent the general volume that the squames could be released from the circulating nurse. Particles from this source were released in a 2 × 2 × 2 pattern. Finally, the Surgery source was intended to represent the general volume that the squames could be released from as the surgical staff leaned over the surgical site. Because the particles could readily pass to the instruments at this point, the Surgery source/top surface of back table target analysis was not performed in this study. The sizes of the sources are shown in Table 3.
A number of tests were performed to determine how many particles were released from each point such that the analysis did not change. It was found necessary to release 500 particles from each of the source locations to ensure that the results were consistent.
Figure 7 Location of Surgery particle release source—side view.
RESULTS
The results are presented in both graphical and tabulated format for the different ventilation systems. There are three potential particle outcomes: • The particle vents from the room via exhaust grilles. In
this case, the particle tracking analysis is stopped. • The particle strikes the surgical site or top surface of
back table. In this case, the particle tracking analysis is stopped.
• The particle remains in the room at the time where parti- cle tracking is stopped (3600 s).
The results are considered for two of the outcomes,
namely the particle is vented via ventilation and the particle strikes a designated target, in terms of percentages of total particles released. The other outcome is a trivial calculation, namely:
10
TABLE 3 Details of Particle Sources
Source Physical Size Particle Array Position
Main 54 in. × 58 in. × 24 in. (1.37 m × 1.47 m × 0.61 m)
3 × 3 × 3 (13500 particles)
Centered over bed Extends from anesthesia screen to end of bed
Begins at 4 ft (1.22 m AFF)
Nurse 24 in. × 24 in. × 72 in. (0.61 m × 0.61 m × 0.83 m)
2 × 2 × 2 (4000 particles)
Centered over circulating nurse Begins at floor level
Surgery 14 in. × 14 in. × 6 in. (0.36 m × 0.36 m × 0.15 m)
3 × 3 × 3 (13500 particles)
Centered over surgery site Begins at 0.5 in. (1.27e-2 m) above surgery site
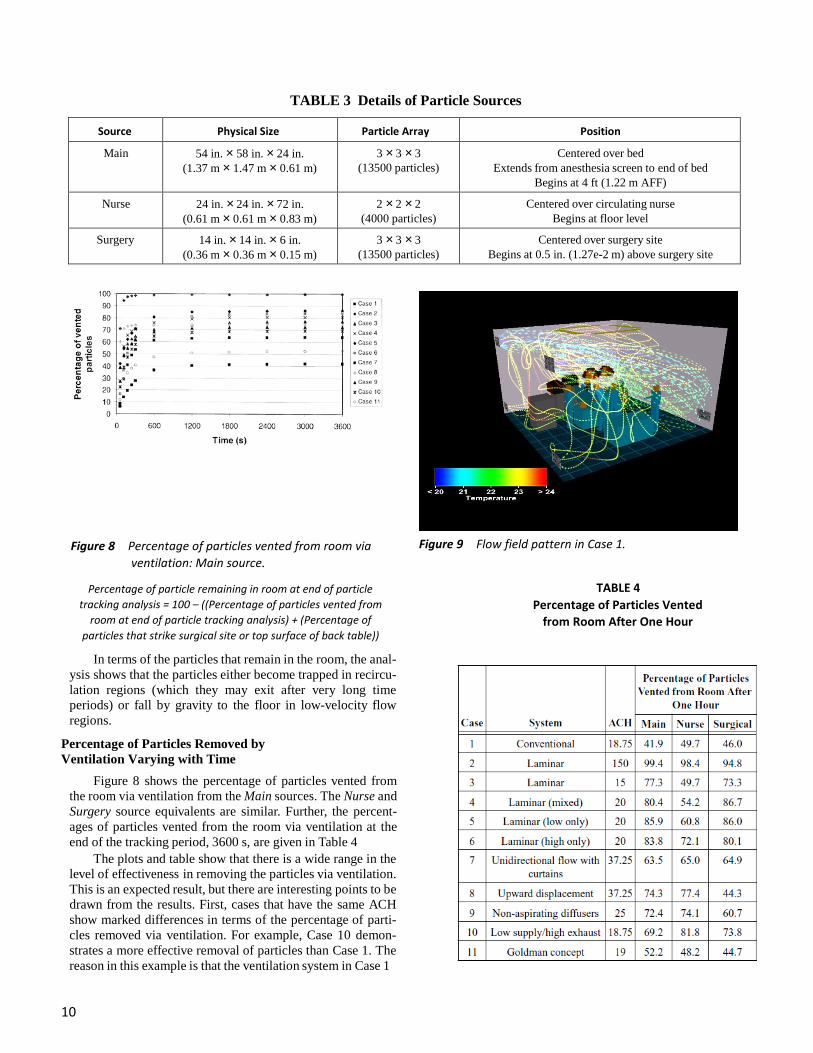
Figure 8 Percentage of particles vented from room via
ventilation: Main source. Figure 9 Flow field pattern in Case 1.
Percentage of particle remaining in room at end of particle tracking analysis = 100 – ((Percentage of particles vented from
room at end of particle tracking analysis) + (Percentage of particles that strike surgical site or top surface of back table))
TABLE 4 Percentage of Particles Vented
from Room After One Hour
In terms of the particles that remain in the room, the anal- ysis shows that the particles either become trapped in recircu- lation regions (which they may exit after very long time periods) or fall by gravity to the floor in low-velocity flow regions.
Percentage of Particles Removed by Ventilation Varying with Time
Figure 8 shows the percentage of particles vented from the room via ventilation from the Main sources. The Nurse and Surgery source equivalents are similar. Further, the percent- ages of particles vented from the room via ventilation at the end of the tracking period, 3600 s, are given in Table 4
The plots and table show that there is a wide range in the level of effectiveness in removing the particles via ventilation. This is an expected result, but there are interesting points to be drawn from the results. First, cases that have the same ACH show marked differences in terms of the percentage of parti- cles removed via ventilation. For example, Case 10 demon- strates a more effective removal of particles than Case 1. The reason in this example is that the ventilation system in Case 1
11
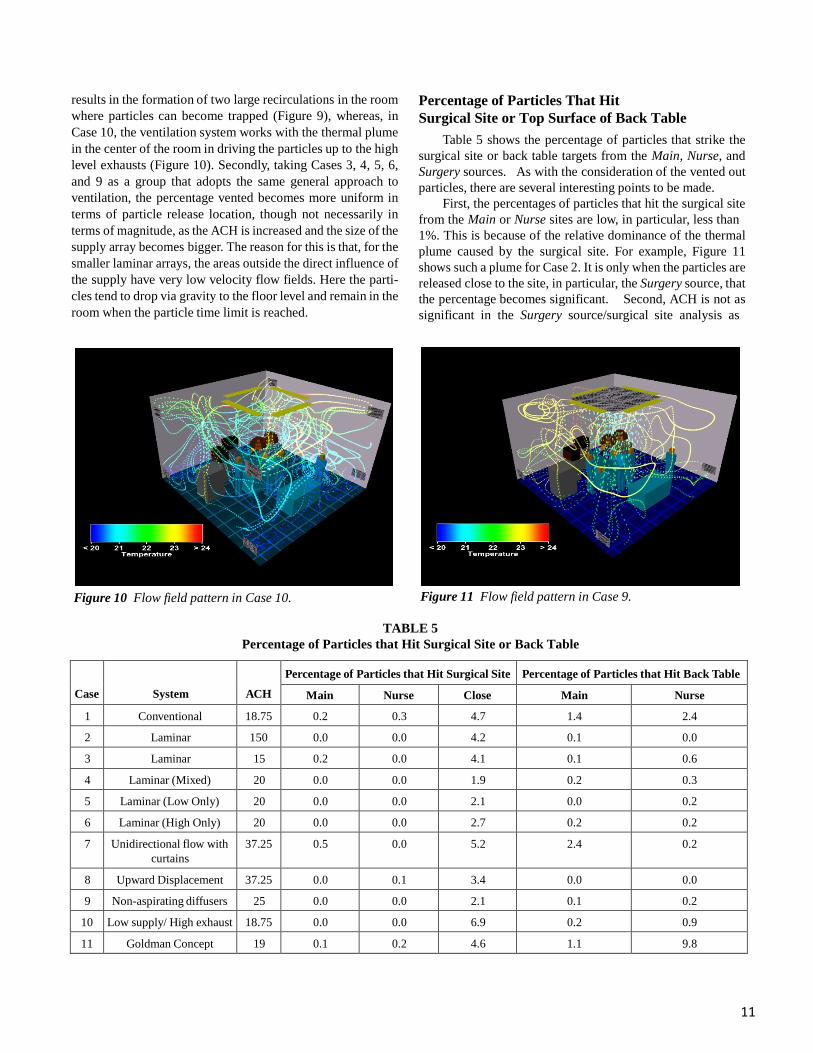
results in the formation of two large recirculations in the room where particles can become trapped (Figure 9), whereas, in Case 10, the ventilation system works with the thermal plume in the center of the room in driving the particles up to the high level exhausts (Figure 10). Secondly, taking Cases 3, 4, 5, 6, and 9 as a group that adopts the same general approach to ventilation, the percentage vented becomes more uniform in terms of particle release location, though not necessarily in terms of magnitude, as the ACH is increased and the size of the supply array becomes bigger. The reason for this is that, for the smaller laminar arrays, the areas outside the direct influence of the supply have very low velocity flow fields. Here the parti- cles tend to drop via gravity to the floor level and remain in the room when the particle time limit is reached.
Percentage of Particles That Hit Surgical Site or Top Surface of Back Table
Table 5 shows the percentage of particles that strike the surgical site or back table targets from the Main, Nurse, and Surgery sources. As with the consideration of the vented out particles, there are several interesting points to be made.
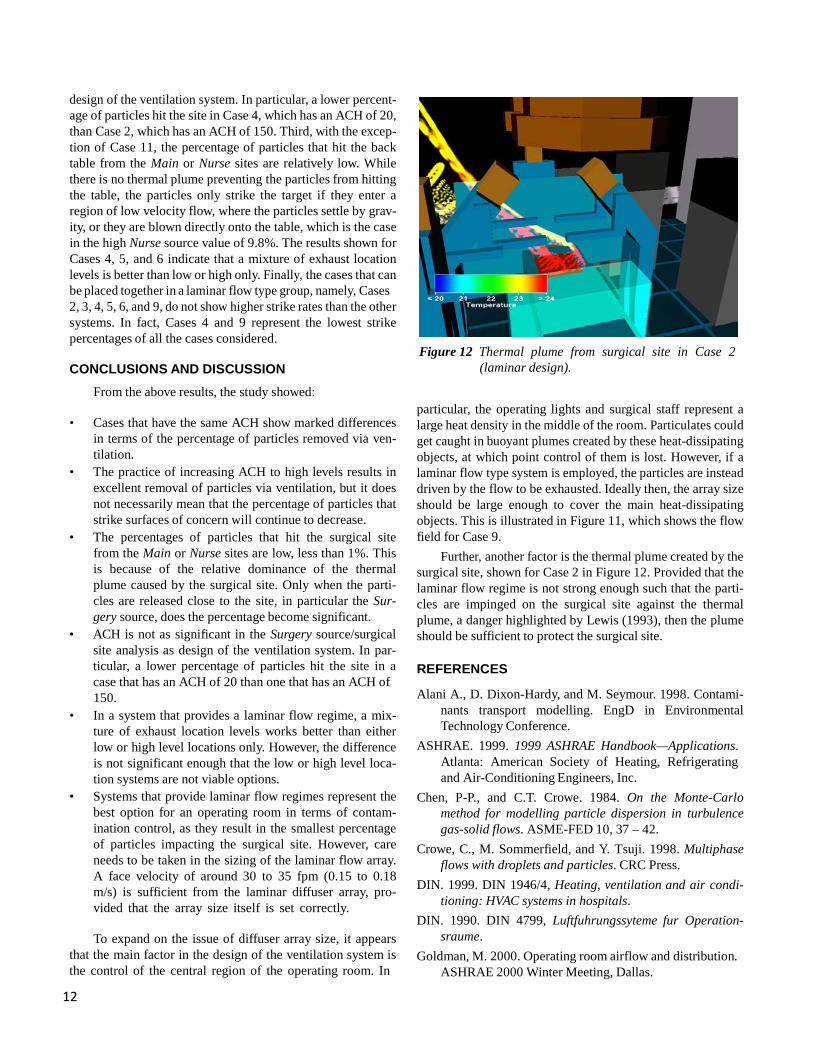
First, the percentages of particles that hit the surgical site from the Main or Nurse sites are low, in particular, less than 1%. This is because of the relative dominance of the thermal plume caused by the surgical site. For example, Figure 11 shows such a plume for Case 2. It is only when the particles are released close to the site, in particular, the Surgery source, that the percentage becomes significant. Second, ACH is not as significant in the Surgery source/surgical site analysis as
Figure 10 Flow field pattern in Case 10. Figure 11 Flow field pattern in Case 9.
TABLE 5
Percentage of Particles that Hit Surgical Site or Back Table
Case
System
ACH
Percentage of Particles that Hit Surgical Site Percentage of Particles that Hit Back Table
Main Nurse Close Main Nurse
1 Conventional 18.75 0.2 0.3 4.7 1.4 2.4
2 Laminar 150 0.0 0.0 4.2 0.1 0.0
3 Laminar 15 0.2 0.0 4.1 0.1 0.6
4 Laminar (Mixed) 20 0.0 0.0 1.9 0.2 0.3
5 Laminar (Low Only) 20 0.0 0.0 2.1 0.0 0.2
6 Laminar (High Only) 20 0.0 0.0 2.7 0.2 0.2
7 Unidirectional flow with curtains
37.25 0.5 0.0 5.2 2.4 0.2
8 Upward Displacement 37.25 0.0 0.1 3.4 0.0 0.0
9 Non-aspirating diffusers 25 0.0 0.0 2.1 0.1 0.2
10 Low supply/ High exhaust 18.75 0.0 0.0 6.9 0.2 0.9
11 Goldman Concept 19 0.1 0.2 4.6 1.1 9.8
12
design of the ventilation system. In particular, a lower percent- age of particles hit the site in Case 4, which has an ACH of 20, than Case 2, which has an ACH of 150. Third, with the excep- tion of Case 11, the percentage of particles that hit the back table from the Main or Nurse sites are relatively low. While there is no thermal plume preventing the particles from hitting the table, the particles only strike the target if they enter a region of low velocity flow, where the particles settle by grav- ity, or they are blown directly onto the table, which is the case in the high Nurse source value of 9.8%. The results shown for Cases 4, 5, and 6 indicate that a mixture of exhaust location levels is better than low or high only. Finally, the cases that can be placed together in a laminar flow type group, namely, Cases 2, 3, 4, 5, 6, and 9, do not show higher strike rates than the other systems. In fact, Cases 4 and 9 represent the lowest strike percentages of all the cases considered.
CONCLUSIONS AND DISCUSSION
From the above results, the study showed:
• Cases that have the same ACH show marked differences in terms of the percentage of particles removed via ven- tilation.
• The practice of increasing ACH to high levels results in excellent removal of particles via ventilation, but it does not necessarily mean that the percentage of particles that strike surfaces of concern will continue to decrease.
• The percentages of particles that hit the surgical site from the Main or Nurse sites are low, less than 1%. This is because of the relative dominance of the thermal plume caused by the surgical site. Only when the parti- cles are released close to the site, in particular the Sur- gery source, does the percentage become significant.
• ACH is not as significant in the Surgery source/surgical site analysis as design of the ventilation system. In par- ticular, a lower percentage of particles hit the site in a case that has an ACH of 20 than one that has an ACH of 150.
• In a system that provides a laminar flow regime, a mix- ture of exhaust location levels works better than either low or high level locations only. However, the difference is not significant enough that the low or high level loca- tion systems are not viable options.
• Systems that provide laminar flow regimes represent the best option for an operating room in terms of contam- ination control, as they result in the smallest percentage of particles impacting the surgical site. However, care needs to be taken in the sizing of the laminar flow array. A face velocity of around 30 to 35 fpm (0.15 to 0.18 m/s) is sufficient from the laminar diffuser array, pro- vided that the array size itself is set correctly.
To expand on the issue of diffuser array size, it appears
that the main factor in the design of the ventilation system is the control of the central region of the operating room. In
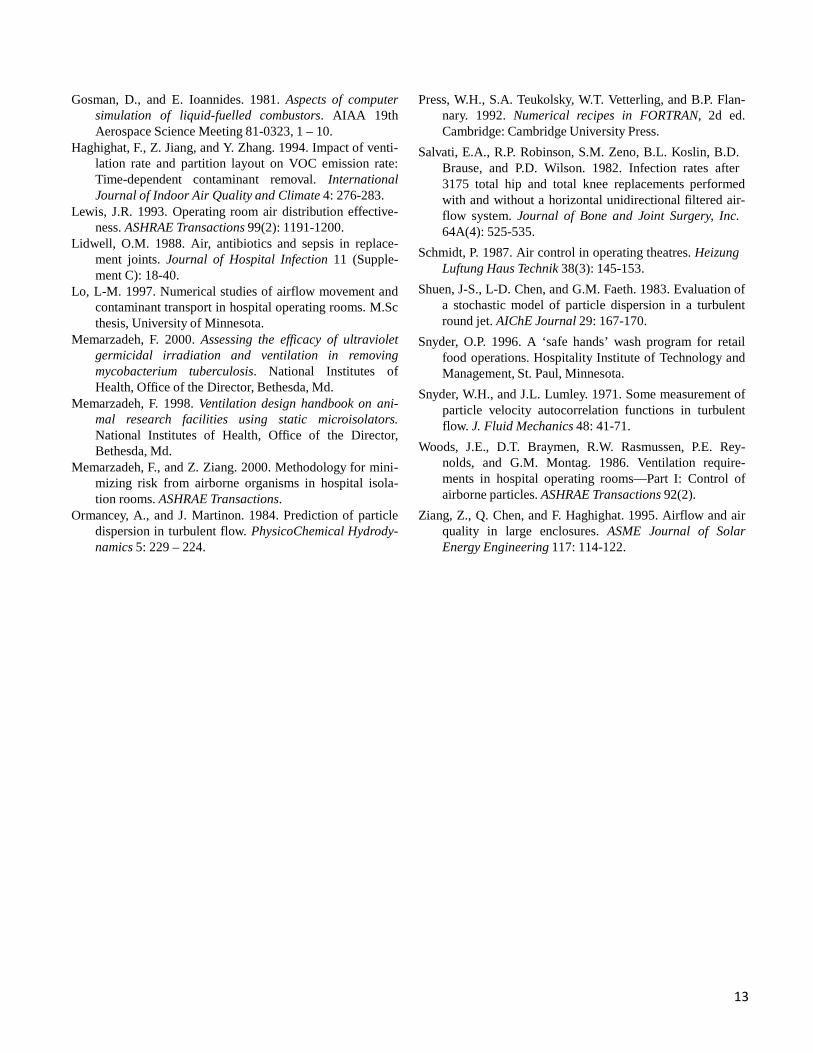
Figure 12 Thermal plume from surgical site in Case 2
(laminar design). particular, the operating lights and surgical staff represent a large heat density in the middle of the room. Particulates could get caught in buoyant plumes created by these heat-dissipating objects, at which point control of them is lost. However, if a laminar flow type system is employed, the particles are instead driven by the flow to be exhausted. Ideally then, the array size should be large enough to cover the main heat-dissipating objects. This is illustrated in Figure 11, which shows the flow field for Case 9.
Further, another factor is the thermal plume created by the surgical site, shown for Case 2 in Figure 12. Provided that the laminar flow regime is not strong enough such that the parti- cles are impinged on the surgical site against the thermal plume, a danger highlighted by Lewis (1993), then the plume should be sufficient to protect the surgical site. REFERENCES Alani A., D. Dixon-Hardy, and M. Seymour. 1998. Contami-
nants transport modelling. EngD in Environmental Technology Conference.
ASHRAE. 1999. 1999 ASHRAE Handbook—Applications. Atlanta: American Society of Heating, Refrigerating and Air-Conditioning Engineers, Inc.
Chen, P-P., and C.T. Crowe. 1984. On the Monte-Carlo method for modelling particle dispersion in turbulence gas-solid flows. ASME-FED 10, 37 – 42.
Crowe, C., M. Sommerfield, and Y. Tsuji. 1998. Multiphase flows with droplets and particles. CRC Press.
DIN. 1999. DIN 1946/4, Heating, ventilation and air condi- tioning: HVAC systems in hospitals.
DIN. 1990. DIN 4799, Luftfuhrungssyteme fur Operation- sraume.
Goldman, M. 2000. Operating room airflow and distribution. ASHRAE 2000 Winter Meeting, Dallas.
13
Gosman, D., and E. Ioannides. 1981. Aspects of computer simulation of liquid-fuelled combustors. AIAA 19th Aerospace Science Meeting 81-0323, 1 – 10.
Haghighat, F., Z. Jiang, and Y. Zhang. 1994. Impact of venti- lation rate and partition layout on VOC emission rate: Time-dependent contaminant removal. International Journal of Indoor Air Quality and Climate 4: 276-283.
Lewis, J.R. 1993. Operating room air distribution effective- ness. ASHRAE Transactions 99(2): 1191-1200.
Lidwell, O.M. 1988. Air, antibiotics and sepsis in replace- ment joints. Journal of Hospital Infection 11 (Supple- ment C): 18-40.
Lo, L-M. 1997. Numerical studies of airflow movement and contaminant transport in hospital operating rooms. M.Sc thesis, University of Minnesota.
Memarzadeh, F. 2000. Assessing the efficacy of ultraviolet germicidal irradiation and ventilation in removing mycobacterium tuberculosis. National Institutes of Health, Office of the Director, Bethesda, Md.
Memarzadeh, F. 1998. Ventilation design handbook on ani- mal research facilities using static microisolators. National Institutes of Health, Office of the Director, Bethesda, Md.
Memarzadeh, F., and Z. Ziang. 2000. Methodology for mini- mizing risk from airborne organisms in hospital isola- tion rooms. ASHRAE Transactions.
Ormancey, A., and J. Martinon. 1984. Prediction of particle dispersion in turbulent flow. PhysicoChemical Hydrody- namics 5: 229 – 224.
Press, W.H., S.A. Teukolsky, W.T. Vetterling, and B.P. Flan- nary. 1992. Numerical recipes in FORTRAN, 2d ed. Cambridge: Cambridge University Press.
Salvati, E.A., R.P. Robinson, S.M. Zeno, B.L. Koslin, B.D. Brause, and P.D. Wilson. 1982. Infection rates after 3175 total hip and total knee replacements performed with and without a horizontal unidirectional filtered air- flow system. Journal of Bone and Joint Surgery, Inc. 64A(4): 525-535.
Schmidt, P. 1987. Air control in operating theatres. Heizung Luftung Haus Technik 38(3): 145-153.
Shuen, J-S., L-D. Chen, and G.M. Faeth. 1983. Evaluation of a stochastic model of particle dispersion in a turbulent round jet. AIChE Journal 29: 167-170.
Snyder, O.P. 1996. A ‘safe hands’ wash program for retail food operations. Hospitality Institute of Technology and Management, St. Paul, Minnesota.
Snyder, W.H., and J.L. Lumley. 1971. Some measurement of particle velocity autocorrelation functions in turbulent flow. J. Fluid Mechanics 48: 41-71.
Woods, J.E., D.T. Braymen, R.W. Rasmussen, P.E. Rey- nolds, and G.M. Montag. 1986. Ventilation require- ments in hospital operating rooms—Part I: Control of airborne particles. ASHRAE Transactions 92(2).
Ziang, Z., Q. Chen, and F. Haghighat. 1995. Airflow and air quality in large enclosures. ASME Journal of Solar Energy Engineering 117: 114-122.