Embed Size (px)
Citation preview

Cp
SKa
b
c
d
a
AA
KQPSGLMF
1
em
D
4
S
0d
Journal of Chromatography A, 1217 (2010) 2548–2560
Contents lists available at ScienceDirect
Journal of Chromatography A
journa l homepage: www.e lsev ier .com/ locate /chroma
omparison of QuEChERS sample preparation methods for the analysis ofesticide residues in fruits and vegetables�
teven J. Lehotaya,∗, Kyung Ae Sonb, Hyeyoung Kwonb, Urairat Koesukwiwata,c, Wusheng Fud,aterina Mastovskaa,1, Eunha Hoha,2, Natchanun Leepipatpiboonc
US Department of Agriculture, Agricultural Research Service, Eastern Regional Research Center, 600 East Mermaid Ln., Wyndmoor, PA 19038, USARural Development Administration, National Academy of Agricultural Science, 249 Seodun-dong, Gweonsun-gu, Suwon 441-707, South KoreaChromatography and Separation Research Unit, Department of Chemistry, Faculty of Science, Chulalongkorn University, Bangkok 10330, ThailandFujian Center for Disease Control and Prevention, 76 Jin Tai Rd., Fuzhou 350001, China
r t i c l e i n f o
rticle history:vailable online 22 January 2010
eywords:uEChERSesticide residue analysisample preparationas chromatographyiquid chromatographyass spectrometry
ruits and vegetables
a b s t r a c t
This article describes the comparison of different versions of an easy, rapid and low-cost sample prepa-ration approach for the determination of pesticide residues in fruits and vegetables by concurrent useof gas and liquid chromatography (GC and LC) coupled to mass spectrometry (MS) for detection. Thesample preparation approach is known as QuEChERS, which stands for “quick, easy, cheap, effective,rugged and safe”. The three compared versions were based on the original unbuffered method, whichwas first published in 2003, and two interlaboratory validated versions: AOAC Official Method 2007.01,which uses acetate buffering, and European Committee for Standardization (CEN) Standard Method EN15662, which calls for citrate buffering. LC–MS/MS and GC–MS analyses using each method were testedfrom 50 to 1000 ng/g in apple–blueberry sauce, peas and limes spiked with 32 representative pesticides.As expected, the results were excellent (overall average of 98% recoveries with 10% RSD) using all 3versions, except the unbuffered method gave somewhat lower recoveries for the few pH-dependent pes-ticides. The different methods worked equally well for all matrices tested with equivalent amounts ofmatrix co-extractives measured, matrix effects on quantification and chemical noise from matrix in thechromatographic backgrounds. The acetate-buffered version gave higher and more consistent recover-ies for pymetrozine than the other versions in all 3 matrices and for thiabendazole in limes. None of
the versions consistently worked well for chlorothalonil, folpet or tolylfluanid in peas, but the acetate-buffered method gave better results for screening of those pesticides. Also, due to the recent shortage inacetonitrile (MeCN), ethyl acetate (EtOAc) was evaluated as a substitute solvent in the acetate-bufferedQuEChERS version, but it generally led to less clean extracts and lower recoveries of pymetrozine, thi-abendazole, acephate, methamidophos, omethoate and dimethoate. In summary, the acetate-bufferedversion of QuEChERS using MeCN exhibited advantages compared to the other tested methods in thestudy.. Introduction
In 2003, Anastassiades et al. described the “quick, easy, cheap,ffective, rugged and safe” (QuEChERS) method for the multiclass,ultiresidue analysis of pesticides in fruits and vegetables [1]. The
� Mention of brand or firm name does not constitute an endorsement by the U.S.epartment of Agriculture above others of a similar nature not mentioned.∗ Corresponding author. Tel.: +1 215 233 6433; fax: +1 215 233 6642.
E-mail address: [email protected] (S.J. Lehotay).1 Current address: Covance Laboratories, 671 South Meridian Rd., Greenfield, IN
6140, USA.2 Current address: Graduate School of Public Health, San Diego State University,
an Diego, CA 92182, USA.
021-9673/$ – see front matter. Published by Elsevier B.V.oi:10.1016/j.chroma.2010.01.044
Published by Elsevier B.V.
authors questioned the typical conditions previously used for pes-ticide residue analysis, and through extensive experimentation andnovel use of MgSO4 for salting out extraction/partitioning and dis-persive solid-phase extraction (d-SPE) for cleanup, they deviseda highly streamlined sample preparation method with excellentresults for a wide range of pesticide analytes in many types offoods [1]. Unlike many previous methods developed for traditionalchromatographic detection systems (e.g. UV/vis absorbance, flu-orescence, element-selective detectors), the QuEChERS approach
takes advantage of the wide analytical scope and high degree ofselectivity and sensitivity provided by gas and liquid chromatogra-phy (GC and LC) coupled to mass spectrometry (MS) for detection.GC–MS and LC–MS(/MS) have become the main analytical tools inmost pesticide monitoring laboratories to meet world standards,
atogr.
trcgata
tdisoEgii[awBooectoOnM
pclbeaQnmtmrct
[frivihmuct
sfipctacE
S.J. Lehotay et al. / J. Chrom
hus the streamlined features, practical benefits and excellentesults provided by the QuEChERS sample preparation approachombined with GC–MS and LC–MS/MS have helped lead to thereat popularity of QuEChERS concepts. At the time of writing, therere more than 10 companies marketing QuEChERS products andhe original paper [1] has been cited in the literature >210 timesccording to the ISI Web of Knowledge citation index [2].
A limited number of GC-amenable pesticides was evaluated inhe original QuEChERS study and although this version has beenemonstrated to yield excellent results for hundreds of pesticides
n dozens of commodities [1,3–5], subsequent experiments showedome pesticides gave lower stability and/or recoveries dependingn pH of the matrix [3,6,7]. The original authors of the QuECh-RS approach realized that buffering at pH-5 during extractionave the optimum balance to achieve acceptably high recover-es (>70%) for certain pH-dependent pesticides (e.g. pymetrozine,mazalil, thiabendazole) independent of the fruit/vegetable matrix6,7]. Lehotay et al. modified the method to use relatively strongcetate buffering conditions [6] and Anastassiades et al. chose to useeaker citrate buffering conditions [7] in terms of ionic strength.oth versions of these methods went through extensive interlab-ratory trials entailing ≈50,000–100,000 data points for dozensf pesticides at fortified and incurred at different levels in differ-nt matrices and using different types of GC–MS and LC–MS/MSonditions and instruments. Both methods successfully met statis-ical criteria for acceptability from independent scientific standardsrganizations, with the acetate-buffering version becoming AOACfficial Method 2007.01 [8] and the citrate-buffering version beingamed European Committee for Standardization (CEN) Standardethod EN 15662 [9].The QuEChERS approach is very flexible and it serves as a tem-
late for modification depending on the analyte properties, matrixomposition, equipment and analytical technique available in theab. The template is also very rugged in that high recoveries wille achieved for many pesticides in many matrices even if differ-nt ratios and types of sample size, solvent, salts and sorbentsre used in modifications. The ruggedness characteristics of theuEChERS approach have been thoroughly evaluated in the origi-al [1] and subsequent publications by the originators [3–18]. Inulticlass, multiresidue pesticide analysis, the sample prepara-
ion method inherently necessitates broad analytical scope whichakes it impossible to obtain a high degree of cleanup without
educing recoveries for some pesticides. However, greater cleanupan be achieved by using different sorbents in d-SPE if the applica-ion has reduced analytical scope.
Reviews of QuEChERS are starting to appear in the literature15,19] and the original method has evolved into a flexible templateor modification in several applications. In addition to pesticideesidue analysis in foods [1,3–76], QuEChERS concepts (includ-ng d-SPE) have been used for acrylamide [77,78], clinical [79,80],eterinary drug residue [81–90], food quality [91], supplement test-ng [92], perfluorinated compounds [93,94], polycyclic aromaticydrocarbons [95], alkaloids [96], environmental [97–100] andycotoxin [101] analytical applications. Mol et al. developed a
niversal sample preparation approach for all kinds of chemicalontaminants in foods and feeds and QuEChERS concepts con-ributed to their proposed approach [102].
Due to the great flexibility of the QuEChERS approach, there areo many permutations that vendors of QuEChERS products have dif-culties in providing products to meet all the demands (weighingowders in the lab is time-consuming and has higher potential for
ontamination). The primary application of QuEChERS is for mul-iclass, multiresidue analysis of pesticides in fruits and vegetablesnd as part of a training exercise in the USDA lab, we decided toonduct a comparison study to determine if one of the three QuECh-RS approaches that have been evaluated among multiple labsA 1217 (2010) 2548–2560 2549
[3,8,9] gave more suitable performance for the food commoditiesin this study. Not only would we compare trueness and precisionof results, but also evaluate analyst performance and matrix co-extractives in terms of their amount, effects on quantification andanalyte detection interferences. Due to a recent worldwide short-age of acetonitrile [103], we also decided to conduct additionalexperiments to ascertain if ethyl acetate could be substituted with-out other changes in the method.
2. Experimental
2.1. Materials
The selected representative matrices consisted ofapple–blueberry sauce (a mix of common fruits), peas (a greenvegetable) and limes (a citrus fruit), which we purchased froma local organic food store. The 32 representative pesticides forstudy consisted of acephate, atrazine, azoxystrobin, carbaryl,cis-chlordane, chlorothalonil, chlorpyrifos, chlorpyrifos-methyl,coumaphos, cyprodinil, diazinon, dichlorvos, dimethoate, endo-sulfan sulfate, ethoprop, folpet, heptachlor, imazalil, imidacloprid,linuron, methamidophos, methomyl, mevinphos, omethoate,permethrin, phosalone, phosmet, procymidone, pymetrozine,tebuconazole, thiabendazole and tolylfluanid. The analytes havediverse properties and several of them are particularly challengingto analyse (e.g. chlorothalonil, folpet, tolylfluanid). The tebucona-zole was added during sample comminution in the chopper toevaluate subsampling homogeneity. The internal standards (addedprior to extraction) used for QuEChERS sample preparation wereatrazine, diazinon and procymidone. Triphenylphosphate (TPP)was added to all final extracts as a quality control measure for theGC–MS and LC–MS/MS analytical steps.
All pesticide standards were high purity obtained from theEnvironmental Protection Agency’s National Pesticide Repository(Fort Meade, MD, USA), Chemservice (West Chester, PA, USA), orDr. Ehrenstorfer GmbH (Augsburg, Germany). Stock solutions of2000 ng/�L were prepared in acetonitrile (MeCN) containing 0.1%acetic acid (HOAc) or toluene. MeCN and ethyl acetate (EtOAc) wereobtained from Burdick & Jackson (Muskegon, MI, USA) and toluenefrom Sigma–Aldrich (St. Louis, MO, USA), were all HPLC-grade orbetter quality. Ultrapure water from a Barnstead (Dubuque, IA, USA)water purification system was used for preparing the LC mobilephase and other aqueous solutions. Glacial HOAc (ACS reagentgrade) and double distilled formic acid (88% purity) were obtainedfrom J.T. Baker (Phillipsburg, NJ, USA) and GFS Chemicals (Colum-bus, OH, USA), respectively. The purity was not taken into accountwhen making acid solutions, thus the % indicates the volume frac-tions of acid solutions (e.g. 1% HOAc in MeCN was prepared bymixing 10 mL glacial HOAc with 990 mL MeCN). We prepared 5Nsodium hydroxide (NaOH) solution for use with the limes in CENmethod EN 15662.
QuEChERS materials were obtained from commercial suppli-ers. For the initial extraction step, we used Restek (Bellfonte,PA, USA) RESPREP Q150 for the acetate-buffered version, whichconsisted of 50 mL plastic centrifuge tubes containing 6 g anh. mag-nesium sulfate (MgSO4) plus 1.5 g anh. sodium acetate (NaOAc).Restek RESPREP Q110 for CEN Standard Method EN 15662 con-sisted of 50 mL plastic centrifuge tubes containing 4 g anh.MgSO4, 1 g sodium chloride (NaCl), 1 g trisodium citrate dihydrate(Na3Cit·2H2O) and 0.5 g disodium hydrogencitrate sesquihydrate
(Na2HCit·1.5H2O). For the original method, we used UCT (Bristol,PA, USA) product ECMSSC which consisted of 50 mL plastic cen-trifuge tubes containing 4 g anh. MgSO4 and 1 g NaCl.For cleanup of pea and lime extracts in the citrate-bufferedversion, we used Restek Resprep Q213, which consisted of 2 mL
2 atogr.
mmbmu1
(rwMi1
a2a52a2a0t5caiiFf
2
(UOil0ufisuetcT8Auotgrw2ceos
A(i
550 S.J. Lehotay et al. / J. Chrom
ini-centrifuge tubes containing 150 mg anh. MgSO4, 25 mg pri-ary secondary amine (PSA) sorbent and 7.5 mg graphitized carbon
lack (GCB). For apple–blueberry sauce in all methods and for allatrices with the unbuffered and acetate-buffered versions, we
sed Restek Resprep Q251 (2 mL mini-centrifuge tubes containing50 mg anh. MgSO4, 50 mg PSA and 50 mg C18).
For the experiment to compare the use of MeCN with EtOAcboth containing 1% HOAc) in the acetate-buffered method, weepeated the full experiment using both solvents for the 3 matricesith 4 replicates each at 3 spiking levels, but used Waters (Milford,A, USA) DisQuE product, which consisted of 50 mL tubes contain-
ng 6 g anh. MgSO4 plus 1.5 g anh. NaOAc and 2 mL tubes containing50 mg anh. MgSO4 plus 50 mg PSA sorbent for d-SPE cleanup.
We prepared standard solutions of 2 ng/�L TPP in 0.5% formiccid in MeCN (quality control spike for the analytical step);00 ng/�L tebuconazole in MeCN (subsample homogeneity spike);nd spiking solutions of 5 ng/�L, 25 ng/�L and 100 ng/�L for the0 ng/g, 250 ng/g and 100 ng/g sample spikes, respectively, of the8 pesticide analytes in MeCN plus a constant 20 ng/�L each oftrazine, diazinon and procymidone (internal standards) to yield00 ng/g. Calibration spike solutions were prepared in 0.05% formiccid in MeCN to each contain 2 ng/�L of the internal standards plus.25 ng/�L, 0.5 ng/�L, 2.5 ng/�L and 10 ng/�L of the other 29 pes-icides (including tebuconazole). These solutions yielded 25 ng/g,0 ng/g, 250 ng/g and 1000 ng/g equivalent concentrations in thealibration standards in matrix and solvent-only for both GC–MSnd LC–MS/MS, with 200 ng/g equivalent concentrations of thenternal standards. The formic acid in the MeCN solutions wasncluded to improve stability of base-sensitive pesticides [103].urthermore, all solutions were stored in dark glass vials in thereezer when not in use.
.2. Apparatus and conditions
For GC–MS, a Leco (St. Joseph, MI, USA) Pegasus time-of-flightTOF) MS instrument coupled with an Agilent (Wilmington, DE,SA) 6890 GC was used. An Atas (Veldhoven, The Netherlands)ptic 3 programmable temperature vaporizer served as the GC
njector for 10 �L injection of the final extracts into sintered glassiners. A 5 m integrated guard column was coupled to the 20 m,.25 mm i.d., 0.25 �m film thickness Restek Rtx 5-MS analytical col-mn and as the transfer line, we used a 1.5 m, 0.1 mm i.d., 0.1 �mlm thickness Restek CLP-Pesticides2 column (the instrumentalet-up was capable of 2-dimensional GC, but this feature was notsed in this study). The Leco ChromaTOF software (version 3.22)nabled instrument control and data processing, including a featureo calculate the equivalent column dimensions for constant flowontrol when the columns of different dimensions were coupled.he injector program started at 75 ◦C for 18 s, which was ramped at◦C/s to 280 ◦C where it was held for 8 min (and then set at 250 ◦C).pressure pulse of 3 mL/min with split vent closed for 2 min was
sed and then column flow was 1.5 mL/min (the split vent waspened at 50:1 split ratio for 2 min and then 20:1) until the end ofhe run. Ultrahigh purity He was the carrier gas. The GC oven pro-ram was 60 ◦C initial oven temperature for 2 min, 20 ◦C/min rampate–180 ◦C, 5 ◦C/min–230 ◦C, 20 ◦C/min–280 ◦C, 40 ◦C/min–300 ◦Chere it was held for 12 min. The transfer line temperature was
80 ◦C; 250 ◦C ion source; −70 eV filament setting; 10 spectra/s dataollection; 390 s filament delay. The same GC–MS conditions weremployed whether MeCN or EtOAc extracts were injected. A tablef GC–MS retention times and the quantitation ions are given in
upplementary information.For LC–MS/MS, an Applied Biosystems (Toronto, ON, Canada)PI-3000 triple quadrupole MS/MS with electrospray ionization
ESI) in the positive mode coupled to an Agilent 1100 LC, whichncludes a binary pump, column temperature control and autosam-
A 1217 (2010) 2548–2560
pler, were used in the study. Applied Biosystems Analyst 1.5software provided instrument control and data collection. The ana-lytical column was a Phenomenex (Torrance, CA, USA) ProdigyODS-3, 5 �m particles, 150 mm long and 3 mm i.d., which was inte-grated with a 4 mm long and 3 mm i.d. Security Guard ODS C18column (kept at 30 ◦C in the method). Injection volume was 20 �Land flow rate was 0.3 mL/min. Mobile phase A was 0.1% formic acidin water and mobile phase B was 0.1% formic acid in MeCN. Thegradient program was 70% A from the start ramped to 100% B overthe course of 8 min and held until 13.5 min. A Valco (Houston, TX,USA) Model EHMA solenoid-driven divert valve was used beforethe MS to avoid introduction of the early (<1.4 min) and late-eluting(>13 min) non-analyte components into the detector.
The MS/MS conditions were optimized using direct infusion intothe ESI source in positive mode to provide highest signal/noise ratiofor the quantification ion of each analyte. A second MS/MS transi-tion was made in case chemical interferences were observed inthe quantitation ion chromatogram and for qualitative purposes.The source temperature was 550 ◦C, ion spray potential was 4500 Vand entrance potential was 10 V. All transitions had dwell times of50 ms in the method. A table of LC–MS/MS retention times and iontransitions is given in supplementary information.
A Robotcoupe (Ridgeland, MS, USA) RSI 2Y1 chopper wasused to comminute samples and a Sorvall® Legend RT (Kendro,Osterode, Germany) was used for centrifugation. Other itemsneeded for experiments included analytical and top-loading bal-ances, a freezer, pipettes, solvent dispensers, graduated cylinders,spatulas, funnels, 50 mL polypropylene centrifuge tubes, gloves,beakers, filters and vials.
2.3. Methods
We prepared 750 g each of apple–blueberry sauce, limes andpeas separately in the chopper on the first day of experiments witheach commodity. The apple–blueberry sauce was mixed at roomtemperature, the peas were homogenized while frozen (no dryice added) and the limes were cut into quarters, frozen and thencomminuted using dry ice. To measure processing recovery andsubsample homogeneity, 0.75 mL of 200 ng/�L tebuconazole wasadded to the samples during the comminution step. Approximately250 g were transferred to 3 sealable containers (bags or bottles) foreach sample type. One subsample was used for extraction on thesame day and the other two were stored in the freezer until theywere extracted by the different method versions 1–2 days later.
The experiments were done in the following order: Days1–3: apple–blueberry sauce by the unbuffered, citrate-bufferedand acetated-buffered versions of QuEChERS, respectively; Days4–6: peas by the acetate-buffered, citrate-buffered and unbufferedQuEChERS methods, respectively; and Days 7–10: limes by thecitrate-buffered, acetate-buffered and unbuffered versions, respec-tively. The GC–MS and LC–MS/MS analyses were conductedconcurrently overnight on each day of sample preparation proce-dures.
In the study, 4 replicate spikes each at 50 ng/g, 250 ng/g, and1000 ng/g were made (each trainee chemist was responsible forone spike at each level) and 1 mL extracts were taken for d-SPE inall cases. Calibration stds in solvent-only solutions and in blankmatrix extracts were prepared at 25 ng/g, 50 ng/g, 250 ng/g and1000 ng/g equivalents for analysis. The sequence of samples foreach instrument and day was as follows: (1) 25 ng/g std in solvent,(2) 25 ng/g std in matrix, (3–6) 50 ng/g spikes A–D, (7) 50 ng/g std
in matrix, (8) 50 ng/g std in solvent, (9) 250 ng/g std in solvent, (10)250 ng/g std in matrix, (11–14) 250 ng/g spikes D–A, (15) matrixblank, (16–19) 1000 ng/g spikes A–D, (20) 1000 ng/g std in matrix,(21) 1000 ng/g std in solvent and (22) reagent blank. The first injec-tion in each sequence also served as a system suitability check and
atogr.
ifLmf
2
((
(
(
(
(
S.J. Lehotay et al. / J. Chrom
nstrument maintenance (changing of the liner and cutting 50 cmrom the guard column in GC–MS and rinsing the shield plate inC–MS/MS) was conducted before the first sequence of each newatrix. The last injection was used to check for analyte carry-over
rom the high standard injection.
.3.1. QuEChERS methods protocols
(1) Appropriately label all tubes and vials needed for the analysis:matrix and reagent blanks, 50 ng/g, 250 ng/g and 1000 ng/gspikes (4 replicates each) and 4 extra d-SPE tubes andautosampler vials for calibration standards in matrix andMeCN-only (25 ng/g, 50 ng/g, 250 ng/g and 1000 ng/g equiv-alents for both GC–MS and LC–MS/MS analyses).
(2) Place an empty, uncapped 50 mL polypropylene centrifugetube in a styrofoam rack on a top-loading balance.
(3) For citrate-buffered and unbuffered versions, add 10.0 ± 0.1 gof thoroughly comminuted sample into the labeled centrifugetube. For limes with the citrate-buffered method, add 0.6 mLof 5 N NaOH aqueous solution. For the acetate-buffered ver-sion, add 15.0 ± 0.1 g. For reagent blanks, use 10 mL or 15 mLultrapure water as the sample.
(4) Add 100 �L (citrate-buffered and unbuffered) or 150 �L(acetate-buffered) of the appropriate spiking solutions to thesamples. Add 100 �L or 150 �L MeCN to the blanks. Cap thetubes well and vortex for 1 min. Allow 15 min to let the pesti-cides better integrate into the samples.
(5) For the citrate-buffered and unbuffered versions, add 10 mLMeCN to each sample in the tubes. For the acetate-bufferedversion, add 15 mL of 1% HOAc in MeCN. Cap the tubes welland shake vigorously by hand for 30 s.
(6) Pour the mixed extract to the appropriate tube contain-ing 4 g anh. MgSO4 + 1 g NaCl (unbuffered version); 6 g anh.MgSO4 + 1.5 g NaOAc (acetate-buffered version); or 4 g anh.MgSO4 + 1 g NaCl + 1 g Na3Cit·2H2O + 0.5 g Na2HCit·1.5H2O(citrate-buffered version).
(7) Seal all the tubes well and shake the tubes vigorously by handfor 1 min ensuring that the solvent interacts well with theentire sample and that crystalline agglomerates are brokenup sufficiently during shaking.
(8) Centrifuge the tubes at 3450 rcf for 2 min at room temperature.For the lime samples in the citrate-buffered method, place thetubes in the −20 ◦C freezer for 1 h, then remove the top layerof “oil/wax” with a Pasteur pipet. Let the extract reach roomtemperature.
(9) Transfer 1 mL of the extracts (upper layer) to the appropri-ate d-SPE tubes. For all apple–blueberry extracts and for peasand limes in the unbuffered and acetate-buffered versions, use50 mg PSA + 50 mg C18 + 150 mg anh. MgSO4. For the citrate-buffered version for peas and limes, use 25 mg PSA + 7.5 mgGCB + 150 mg anh. MgSO4. For matrix blanks, transfer five 1 mLaliquots to 5 different d-SPE tubes (matrix blank plus 4 matrix-matched calibration standards).
10) Seal the tubes well and shake vigorously or vortex for 30 s.11) Centrifuge the d-SPE tubes at 3450 rcf for 2 min at room tem-
perature.12) Transfer 0.5 mL of extracts to the autosampler vials, except
for the matrix blanks, which are first combined into a smallbeaker and then 0.5 mL aliquots are transferred to vials.
13) Transfer 0.5 mL of MeCN to 4 vials for the solvent-only cali-bration standards.
14) Add 50 �L of 2 ng/�L TPP in 0.5% formic acid in MeCN solutionto all vials.
15) Add 50 �L of calibration standard spiking solutions to theappropriate vials for matrix-matched and solvent-only stan-dards.
A 1217 (2010) 2548–2560 2551
(16) Add 50 �L of MeCN to the spiked sample extracts and matrixand reagent blanks.
(17) Cap all vials and shake thoroughly to mix.(18) Transfer 200 �L of each solution to a 2nd set of appropriately-
labeled vials with low-volume inserts for GC–MS analysis.(19) Add 1 mL of 0.1% formic acid solution in water to the 0.4 mL
extract remaining in the 1st set of vials for LC–MS/MS analysis.
Note: for the limes in all cases and peas in the citrate-bufferedmethod, a precipitate appeared in the LC extracts after the 0.1%formic acid solution was added. The lime extracts were fil-tered through 0.45 �m PVDF filters (Mini-UniPrep vials, Whatman,Florham Park, NJ, USA), and centrifugation was able to remove theprecipitate in the case of peas.
For the EtOAc comparison experiments, we first repeated theMeCN (containing 1% HOAc) extractions for all 3 matrices andreplicates as before, but used Waters DisQuE products. Then, werepeated the full experiment again except substituted MeCN withEtOAc (including 1% HOAc) in the acetate-buffered method. ForLC–MS/MS, the 0.4 mL EtOAc extract in the vial was evaporatedwith nitrogen to just dryness and then 1.4 mL of mobile phase Asolution was added.
A detailed Excel spreadsheet template was prepared in whichthe integrated peak areas were cut and pasted into the appropri-ate cells from the instrument data files. The recoveries with andwithout use of an internal standard (diazinon) were calculatedby direct proportional comparison with the matrix-matched cal-ibration standard at the given spiking level (50 ng/g, 250 ng/g and1000 ng/g). Least linear squared calibration plots were also cal-culated in matrix and solvent-only to determine matrix effects.All results were compiled through linkage to a second Excelspreadsheet file, in which the recoveries were split into differentcategories depending on method, matrix, spiking level and analyst.No results were removed from the data compilation even if statis-tical outliers may have occurred (certain pesticides in limes couldnot be analysed by GC–MS).
3. Results and discussion
Analytical chemists have a common saying that, “Analyticalmethods are like toothbrushes, everybody uses their own.” Asevidenced in the literature [1–101], there are many different per-mutations of the QuEChERS approach, some of which serve a usefulpurpose to improve results or practical efficiency for the given ana-lyte(s)/matrix(es) applications, but some others have differencesonly due to personal preferences. The 3 versions of QuEChERS wecompare in this study particularly stand out because they have beenextensively evaluated in many labs for a wide range of pesticidesin many fruits and vegetables [1,3–9]. Commercial products fromat least 10 vendors are available for these 3 different versions, tofurther simplify use of the approach in routine practice.
In this study, the 3 versions of QuEChERS were compared as partof a training course to demonstrate the differences in the methodsand to answer the simple question: “Which version is better?” Itadds to the interest of the participants (and instructors) and valueof the training program to perform useful experiments at the sametime as provide training. In a previous training course, the host labo-ratory conducted QuEChERS experiments for participant-requestedpesticide/matrix combinations in which different ways to addressLC–MS/MS matrix effects were also investigated [18]. To ensure
validity of the comparison in the current study, the experimentswere planned and conducted carefully, systematically and consis-tently. To help ensure high quality results, the 4 analyst traineescompeted for a reward to the person who achieved the highestaccuracy. Peak integrations in GC–MS and LC–MS/MS were done
2552 S.J. Lehotay et al. / J. Chromatogr. A 1217 (2010) 2548–2560
Table 1Compilation of average pesticide recovery results in LC–MS/MS and GC–MS for the 3 versions of QuEChERS spiked at 50 ng/g, 250 ng/g and 1000 ng/g (4 replicates, one peranalyst, at each level) in apple–blueberry sauce, peas, and limes.
Pesticide Ave. %recovery (n = 36) %RSD (n = 36) Analyst %RSD (n = 9)
Original CEN AOAC Original CEN AOAC A B C D
Acephate LC 87 90 94 8 7 7 10 8 6 7Acephatea GC 86 92 92 14 8 18 17 12 11 14Atrazineb LC 94 90 96 10 7 13 n/a n/a n/a n/aAtrazineb GC 89 89 88 13 7 5 n/a n/a n/a n/aAzoxystrobin LC 104 103 112 8 7 11 10 10 11 7Azoxystrobina GC 105 104 106 10 14 16 13 19 10 10Carbaryl LC 102 100 105 6 5 9 9 8 6 6Carbaryl GC 109 101 102 14 12 18 19 13 15 12Chlorothalonil GC 73 61 91 56 64 57 72 59 56 50Chlorpyrifos LC 98 100 100 9 16 16 15 14 15 10Chlorpyrifos GC 101 99 98 9 8 6 8 9 8 6Chlorpyrifos-Methyl LC 95 102 107 10 9 15 13 13 12 11Chlorpyrifos-methyl GC 103 100 101 9 6 4 7 7 7 5Cis-chlordane GC 97 97 93 9 8 7 8 10 8 7Coumaphos GC 110 104 104 15 11 11 10 15 12 15Cyprodinil LC 98 93 100 6 9 8 7 6 10 10Cyprodinil GC 102 96 95 12 9 9 10 11 10 10Diazinonb LC 92 97 87 6 6 9 n/a n/a n/a n/aDiazinonb GC 103 111 102 15 19 16 n/a n/a n/a n/aDichlorvos LC 100 99 104 8 5 7 9 8 6 5Dichlorvos GC 98 96 106 16 19 12 17 19 12 15Dimethoate LC 101 99 104 7 5 8 8 8 7 4Dimethoate GC 104 103 100 12 8 12 12 9 12 9Endosulfan sulfate GC 106 102 103 14 12 13 13 14 11 14Ethoprop LC 99 101 104 7 7 9 9 9 8 5Ethoprop GC 102 100 100 6 6 4 7 6 5 4Folpet GC 66 63 69 72 82 56 75 79 61 68Heptachlor GC 95 96 94 9 7 5 8 8 8 5Imazalil LC 95 92 92 9 12 9 11 11 9 10Imazalila GC 91 96 86 17 12 12 12 16 16 13Imidacloprid LC 98 99 103 6 6 7 8 8 7 5Linuron LC 100 101 104 6 6 8 8 8 7 5Methamidophos LC 80 85 88 8 10 8 9 14 9 8Methamidophosa GC 80 83 85 10 10 11 14 9 8 11Methomyl LC 100 100 101 6 6 8 8 8 7 5Mevinphos GC 111 99 100 21 13 18 16 22 13 20Omethoate LC 91 90 92 10 6 7 10 8 7 6Omethoatea GC 90 100 94 12 13 25 24 18 15 15Permethrin GC 102 101 95 14 13 9 11 15 11 11Phosalone GC 109 105 103 13 13 12 12 15 12 11Phosmet LC 103 100 107 5 5 7 7 6 7 5Phosmet GC 110 106 103 13 12 16 12 14 13 15Procymidoneb GC 99 98 98 7 10 5 n/a n/a n/a n/aPymetrozine LC 31 34 82 100 51 7 65 63 65 62Tebuconazolec LC 102 8 n/a n/a n/a n/aTebuconazolec GC 88 13 n/a n/a n/a n/aThiabendazole LC 84 78 85 24 19 16 20 19 24 18Thiabendazolea GC 89 91 94 13 15 16 12 16 16 15Tolylfluanid LC 63 60 76 69 71 50 67 65 63 58Tolylfluanid GC 71 63 66 70 70 57 68 68 61 68TPPd LC n/a 8 n/a n/a n/a n/aTPPd GC n/a 12 n/a n/a n/a n/aOverall average 97.9 97.4 98.3 10.6 9.7 10.9 11.5 11.7 10.3 9.5Average LC 95.8 95.8 99.2 8.4 8.1 9.6 10.1 9.7 9.2 7.4Average GC 99.6 98.8 97.6 12.4 11.0 11.6 12.6 13.2 11.1 11.3
n/a = not applicable.Diazinon was used as the internal standard in both LC–MS/MS and GC–MS. The combined %RSD results are also given for each analyst, which were averaged excluding valuesin bold text (recoveries that varied depending on matrix).
a GC results for limes were excluded (n = 24).
ppingtep (n
aor
iea
b Internal standard recovery at 200 ng/g not corrected for diazinon.c Combined result for tebuconazole, which was added at 200 ng/g during the chod TPP was added at 200 ng/g to all standards and extracts prior to the analytical s
lternately by the trainees paired in groups and Excel spreadsheetsf calculations and compiled results were shared with input and
eview by all involved.The different versions were compared through different empir-cal means. The main test of accuracy in the residue analysisntailed measurement of trueness through recovery experimentsnd precision from replication (intraday and interday). Other
step (n = 108).= 153).
aspects included analytical scope and concentration range, whichwere assessed by the range of analytes and matrices included in
spikes at different concentration levels. Practical issues of sam-ple throughput, ease of performance, costs, safety and wastegenerated were evaluated by the analysts. Ruggedness was deter-mined by measuring matrix effects and instrument performanceover time. Analyst performance was done by verifying that the
S.J. Lehotay et al. / J. Chromatogr. A 1217 (2010) 2548–2560 2553
F ifferenr
dm
eeQdRpsltsat
ig. 1. Average recoveries (and standard deviations) of pesticides that showed deplicates each at 50 ng/g, 250 ng/g and 1000 ng/g spiking levels, n = 12).
ifferent chemists could all achieve acceptable results with theethods.Ideally, limits of quantification (LOQs) would also be determined
mpirically to find the lowest spiking level that can be recov-red with consistent signal/noise >10. The LOQs of the differentuEChERS versions have been assessed previously to be <10 ng/g,epending on the analytical instrumentation and conditions used.esults at the LOQ tend to be variable independent of the samplereparation method, thus we chose to avoid this complication bypiking well above the LOQs with 50 ng/g being the lowest spiking
evel. The final sample amount to extract volume ratios were allhe same in each method (1 g/mL), and matrix-matched calibrationlopes and S/N ratios for the pesticide analytes were much the samemong the 3 versions for any given concentration, which indicatedhat the LOQs were the same in the different methods.ces among the different matrices using the 3 different versions of QuEChERS (4
3.1. Results from spiking recovery experiments
The descriptions of the experiments are given in detail in Experi-mental. Table 1 lists the recoveries and variabilities for the differentQuEChERS versions averaged from the 36 spikes (4 replicates by4 analysts at 3 levels in 3 matrices over 9 days). The diazinon-normalized recoveries were exceptional (98% on average with 10%RSD) and they were only slightly lower and more variable whenan internal standard was not used (the uncorrected recoveries aregiven for diazinon, atrazine and procymidone). As observable from
the typically very low %RSD values, there were few differencesamong recoveries in the different matrices and levels. The %RSDsof results per pesticide for each analyst are also given in the tableand their performances were essentially the same (10–12% RSD onaverage).
2 atogr. A 1217 (2010) 2548–2560
tmpgcnvet
(kpfb
3
ebttadnpdt
sapcsabrsa
muT(taeQseagovcp
utvcfvf
554 S.J. Lehotay et al. / J. Chrom
The recovery of the quality control spike (tebuconazole) forhe sample homogenization step was between 88 and 102% in the
ethod with 8–13% RSD (LC–MS/MS results were somewhat morerecise than GC–MS for tebuconazole). No real differences in homo-eneity results were noted among the different matrices, but it waslear that apple–blueberry sauce and peas were easy to homoge-ize and dry ice was needed to properly comminute the limes. Theariability of tebuconazole when using a 10 g or 15 g subsample forxtraction were also similar, which was limited by the analysis, nothe sample processing procedure.
The variability of the quality control spike for the analytical stepTPP) was 8% RSD in LC–MS/MS and 12% RSD in GC–MS. This is ineeping with the average variabilities in the results of most of theesticides in the study. The relative ease or difficulty in the analysisor each analyte and analytical method (LC or GC) can be assessedy comparing the individual results to the overall averages.
.2. pH-dependent pesticides
In agreement with earlier results, nearly all pesticides gavexceptionally good results overall, except for those appearing inold text in Table 1, which include chlorothalonil, folpet andolylfluanid. These pesticides are known to be base-sensitive andhey are unstable and problematic in pesticide residue analysis byny current multiresidue method [104]. Pymetrozine also showedifferences, but only for reasons of pH during the extraction step,ot degradation [6]. Fig. 1 shows the recoveries of the highlightedesticides and other analytes of interest that showed smallerifferences (acephate, methamidophos, omethoate, imazalil andhiabendazole) with respect to matrix and method.
As Fig. 1 results demonstrate, the QuEChERS version using thetrong acetate buffering at pH-4.8 [6] more often gave highernd more consistent recoveries for the problematic, pH-dependentesticides than the unbuffered method (as expected) and theitrate-buffered version, which uses citrate buffering of weakertrength and slightly higher pH of 5–5.5 [7]. Tolylfluanid, folpetnd chlorothalonil mostly degraded in the peas prior to extraction,ut the use of the strong acetate buffering led to somewhat higherecoveries in the green vegetable. This can be helpful at least tocreen for these fungicides, which are registered for application inwide range of commodities [105].
The most striking example of recovery differences between theatrices and methods is pymetrozine, which is also registered for
se in a wide range of commodities including citrus fruits [105].hus, it is important to achieve high recoveries for pymetrozineand the other common pesticides) independent of matrix. In par-icular, the situation with low recoveries of pymetrozine in citrusnd highly variable recoveries for pH-dependent pesticides in gen-ral, was the impetus that Lehotay et al. modified the originaluEChERS method to use buffering in the first place [3,6,8]. As
hown in Table 1 and Fig. 1, pymetrozine gave 82% average recov-ry with 7% RSD using the acetate-buffered QuEChERS versionmong all 3 commodities, whereas the citrate-buffered versionave overall recovery of ≈30% (same as unbuffered version) withnly somewhat better consistency (51% RSD) than the unbufferedersion (100% RSD). However, the lower recovery of this pesti-ide using the citrate-buffered method is sufficient for screeningurpose [7,106].
Shia [107] conducted a similar comparison study of recoveriessing the 3 different QuEChERS methods for a diverse range of pes-icides (including chlorothalonil, tolylfluanid and pymetrozine) in a
ariety of commodities (grapes, oats, oranges and avocadoes). In allases, the AOAC (acetate buffering) version gave higher recoveriesor the pH-dependent pesticides than the CEN (citrate-buffering)ersion, confirming the results obtained in this study. As we alsoound, Shia’s study did not show notable differences between theFig. 2. Amount of co-extractives as determined by weight differences of QuEChERSfinal extracts taken to dryness (2 replicates each of 5 g sample equivalents). Theunbuffered version gave 0% measured co-extractives in the case of apple–blueberryand pea.
different method results for all other pesticides spiked into thedifferent matrices.
A clear conclusion can be made that the acetate-bufferedversion achieves higher and more consistent recoveries for thepH-dependent pesticides in fruit and vegetable matrices. Bothbuffering versions, as well as the original method and other less-extensively-studied modified versions, achieve equally high qualityresults for many common pesticides applied to agricultural com-modities.
3.3. Co-extracted matrix components
Anastassiades et al. chose to use citrate buffering ratherthan acetate buffering for reasons described in ref. [7]. For one,they asserted that the use of the more concentrated acetatebuffer system resulted in “visibly worse cleanup results com-pared to the original QuEChERS method.” In our comparison,visual observations of the initial and final extracts indeed showedslight differences in color and color intensity in the differentextracts (see Supplementary data, Fig. I), but it was not possi-ble to determine that one extract was actually “cleaner” thananother just by looking at them. Therefore, we also assessed thedegree of cleanup in the extracts in the same empirical manneras done before [1,6,7,10,11,13,18] through gravimetric measure-ments, chromatography and determination of matrix effects onquantitation . Anastassiades et al. found that the CEN QuEChERSversion gave 0.1% co-extractives in red currant whereas the AOACversion gave 0.25% co-extractives [7].
In the gravimetric measurements, we combined the excess ini-tial sample extracts for each method/matrix pair (only 1 mL of the10–15 mL extract was taken for d-SPE cleanup). We transferredduplicate 5 mL portions (5 g equivalent) to pre-weighed glass testtubes (the moisture had been removed by heating the tubes for1 h at 110 ◦C prior to weighing). Similarly, we scaled up the d-SPEcleanup steps 10-fold by adding 10 mL extract and the contentsof 10 d-SPE tubes to 15 mL centrifuge tubes (in duplicate for eachmatrix/method). Then, 5 mL (5 g equivalent) of each extract aftercleanup was transferred to additional pre-weighed test tubes. Allextracts in the tubes were taken to dryness using nitrogen streamevaporation and the tubes were again heated at 110 ◦C for 1 h toremove moisture from the glass prior to weighing on a calibratedanalytical balance. The weight difference was recorded to estimate
the amount of co-extracted matrix in the initial and final extracts.Fig. 2 give the results from the experiment for the final extracts.In the case of apple–blueberry sauce, the initial QuECh-ERS extracts contained ≈0.2% of matrix components(unbuffered = 0.23%, citrate-buffered = 0.17% and acetate-

atogr.
bart(fthws0dOoua[mpi
apstsSGSfGt
aQt0bgriWfitds
raccmfasiatetp0bi0n
S.J. Lehotay et al. / J. Chrom
uffered = 0.13%). The use of 50 mg PSA + 50 mg C18 + 150 mgnh. MgSO4 per mL extract for d-SPE in all 3 versions essentiallyemoved the apple–blueberry co-extractives to the extent thathey could no longer be measured by the gravimetric approachas shown in Fig. 2). The inclusion of C18 in this step is a deviationrom all 3 original published versions, but it has been shownhat the C18 has no effect on recoveries and can only help, notarm, the d-SPE performance [1,7,10–15,107]. The measuredeight of the apple-blueberry co-extracts in the final extracts
trictly using acetate-buffered method was 0.05% rather than.01% when the C18 was also used. It is regrettable that Lehotayid not include the C18 in d-SPE as part of the protocol in AOACfficial Method 2007.01 [8,15]. In order to isolate only the effectf citrate vs. acetate buffering in this matrix comparison, we alsosed twice as much PSA for the apple–blueberry as the originalnd CEN QuEChERS versions called for in the published protocols1,3–5,7,14]. The QuEChERS approach is very flexible and such
inor adjustments in these sorbent amounts have little impact onesticide recoveries (unlike pH and solvent which can have major
mpact on pH-dependent pesticides).The amount of GCB in d-SPE can have a significant effect on the
mount of chlorophyll removed and on recoveries of structurallylanar pesticides [1,7,11,14,15]. In the case of peas, we used theame d-SPE sorbent combination as in apple–blueberry sauce forhe unbuffered and acetate-buffered versions, which had only alight effect in reducing the green color of the pea extracts (seeupplementary data, Fig. I). However, we used 25 mg PSA + 7.5 mgCB + 150 mg anh. MgSO4 per mL extract, which was the exact d-PE sorbent amounts called for in CEN Standard Method EN 15662or dark green vegetables (technically, we should have used 2.5 mgCB for the lighter green peas, but we preferred to test the method
hat provided greater cleanup).Despite the slightly darker green color of the unbuffered and
cetate-buffered pea extracts, Fig. 2 shows that those modifieduEChERS versions gave somewhat cleaner extracts by weight
han the citrate-buffered version. The initial pea extracts gave.14–0.17% co-extractive amounts in all 3 methods, but the citrate-uffered d-SPE version left 0.07% of co-extractives whereas thereater amount of PSA and use of C18 in the other d-SPE stepemoved the matrix components to the same extent in peas asn apple–blueberry sauce (≈90% of measurable amount removed).
ithout the inclusion of C18 in the acetate-buffered d-SPE step,nal co-extracted amount of peas was 0.06% rather than 0.02%,hus C18 appeared to have a greater impact than PSA in the cleanupifferences between the citrate-buffered and acetate-buffered ver-ions.
Citrus fruits are notoriously difficult matrices for pesticideesidue analysis. The acidity is more intense than in other fruitsnd the peel is full of pectin and complex aromatic compounds thatause precipitation in final extracts, higher matrix effects, morehromatographic interferences and greater need for instrumentaintenance. In our experiment to weigh matrix co-extractives
rom the different methods, limes gave 1.4% initial co-extractedmount in the unbuffered method and 0.6% in the buffered ver-ions, which are 3–7 times greater than in the other 2 matrices. Thiss in agreement with previous results for orange juice, red currantsnd lemons [6,7]. All extracts had been stored for multiple days inhe freezer prior to the experiment and the very top layer of thextracts were not used in case of lime oil had separated out. Usinghe same d-SPE sorbents in each QuEChERS version as done witheas, the co-extracted amounts in the final extracts became 0.37%,
.18% and 0.25% for the unbuffered, citrate-buffered and acetate-uffered versions, respectively, as shown in Fig. 2. Without the C18n the acetate-buffered version, the final amount of co-extracts was.32%. In strict accordance with the EN 15662 protocol, we shouldot have included 7.5 mg GCB in d-SPE for limes, but doing so led
A 1217 (2010) 2548–2560 2555
to less green color in the extracts (see Supplementary data, Fig. I)and a smaller amount of matrix co-extractives even when less PSAand no C18 were used.
The freeze-out step for limes may have reduced the amountof co-extractives in the initial lime extracts [7], but ultimately,the extra PSA and C18 in the subsequent d-SPE cleanup step dothe same job faster and easier [13]. According to the gravimet-ric experiment and recovery results, the use of 50 mg PSA + 50 mgC18 + 7.5 mg GCB + 150 mg MgSO4 per mL extract would providegreater extent of d-SPE cleanup for all matrices than the exact pub-lished protocols without unacceptably affecting recoveries, evenfor structurally planar pesticides. For example, the planar pesti-cide, cyprodinil, gave high recoveries in peas and limes with theCEN method using 7.5 mg GCB per mL in d-SPE. Other planar pes-ticides, chlorothalonil and thiabendazole gave only slightly lowerrecoveries in those cases, but their results are more complicatedto interpret because they are also affected by pH. The use of thissorbent combination will be studied further in the future.
3.4. Matrix effects
Matrix effects are known to be problematic in pesticide residueanalysis using LC–MS/MS and GC–MS [108]. In the former, ion sup-pression can occur in the ion source to cause a reduced signal whenmatrix co-elutes with the analyte peaks and in GC, the matrix-induced chromatographic response enhancement effect can occurwhen co-extractives fill active sites in the chromatographic system,which causes higher analyte transfer efficiency, thus greater sig-nal in the presence of matrix [109]. Because alternatives are eitherless practical or effective, the most common way to avoid matrixeffects in both LC–MS/MS and GC–MS is to use matrix-matchedcalibration standards [18]. In this study involving spiked samples,we had the luxury to use final extracts of the exact same matrixto perfectly match the sample extracts and achieve highly accurateresults. In routine analysis, it is unlikely to find perfectly match-ing blank matrices and compensation for matrix effects will notnecessarily be as accurate.
Ideally, the injected extracts will be sufficiently clean so thatno matrix effects will occur in the first place. The extent of matrixeffects can be measured in each analytical sequence by comparingcalibration standards of the same concentrations in solvent-onlyvs. those in matrix extracts. This was done in every sequence in ourexperiments and the differences in the best-fit calibration slopesfor LC–MS/MS are presented in Fig. 3. We did not use an internalstandard in this approach because it can also undergo matrix effectsand could give misleading conclusions.
As Fig. 3 shows, none of the QuEChERS versions gave signifi-cantly different matrix effects from each other with the instrumentand conditions we used. In fact, the patterns observed tracked verywell together with respect to matrix, method and pesticide. In thecase of apple–blueberry, none of the analytes gave more than 16%differences, which may have been unrelated to matrix effects at all.We do not know why azoxystrobin in all 3 methods or pymetrozinewith the citrate-buffered version gave a sensitivity enhancement inthe matrix, but the effects were small in any case. Peas gave evenless intense (<12%) and more consistent sensitivity differences inmatrix than apple–blueberry sauce except for thiabendazole andpymetrozine (the first two analytes to elute from the LC column).In the case of limes, clear matrix suppression effects occurred for allof the pesticides in the LC–MS/MS analyses from 12% (dichlorvos)to 80% (imazalil). Observed differences for each pesticide are too
small to tell if one method gave more or less matrix effects thananother in limes, or any of the matrices.In the case of GC–MS, the integrated peak data were treatedin the same way as in LC–MS/MS, but signal enhancements weremuch too variable to make valid comparisons. Without use of the

2556 S.J. Lehotay et al. / J. Chromatogr. A 1217 (2010) 2548–2560
F fferen( rds in
ifmwmatiictstmwmciadm
3
dm
ig. 3. Comparison of LC–MS/MS matrix effects in the different methods for the diwithout use of the internal standard) from matrix-matching vs. those from standa
nternal standard, the results were not consistent enough for dif-erent pesticides even within the same sequence and day-to-day
atrix effect differences were too large even if the same extractsere re-injected. This is because the GC–MS matrix effects wereore dependent on the condition of the instrument (inlet liner
nd retention gap) moreso than on the method or matrix. Also,he volatilization injection process in GC is less precise than liquidnjection in LC and the use of the triple quadrupole MS/MS approachn LC provided more selectivity and easier peak integration in theomplex extracts than full spectrum TOF data acquisition. Fur-hermore, a combination of matrix enhancement for pesticidesusceptible to degradation on active sites occurs in GC at the sameime as matrix diminishment effects due to build-up of non-volatile
aterials in the inlet. These are reasons why analyte protectants,hich are substance added to all injected samples in a sequence toaximize matrix enhancement and reduce diminishment effects,
an provide valuable advantages in GC–MS [1,110,111], particularlyn selected ion monitoring and MS/MS modes. Unfortunately, thenalyte protectants complicate full spectrum MS analysis, and weid not use them in this study, in part because we wished to assessatrix effect differences without them.
.5. Chromatographic interferences
Another way to compare and assess matrix co-extractives in theifferent methods is to check for chemical interferences in the chro-atograms. In LC–MS/MS, there were no chromatographic peaks
t commodities as measured by the %differences in slopes of the calibration curvessolvent-only.
that could be mistaken for the analytes even in the lime extracts.The pesticide peaks were easy to integrate and data processing wasfast and simple using LC–MS/MS. However, the situation was not sosimple in the GC–MS analysis and more care was needed to conductanalyte peak integrations, even when using mass spectral decon-volution and reconstructed selected ion chromatograms for eachpesticide. However, direct chemical interferences >25 ng/g equiva-lent concentrations did not occur in the analyses except for certainpesticides in lime extracts for all 3 methods.
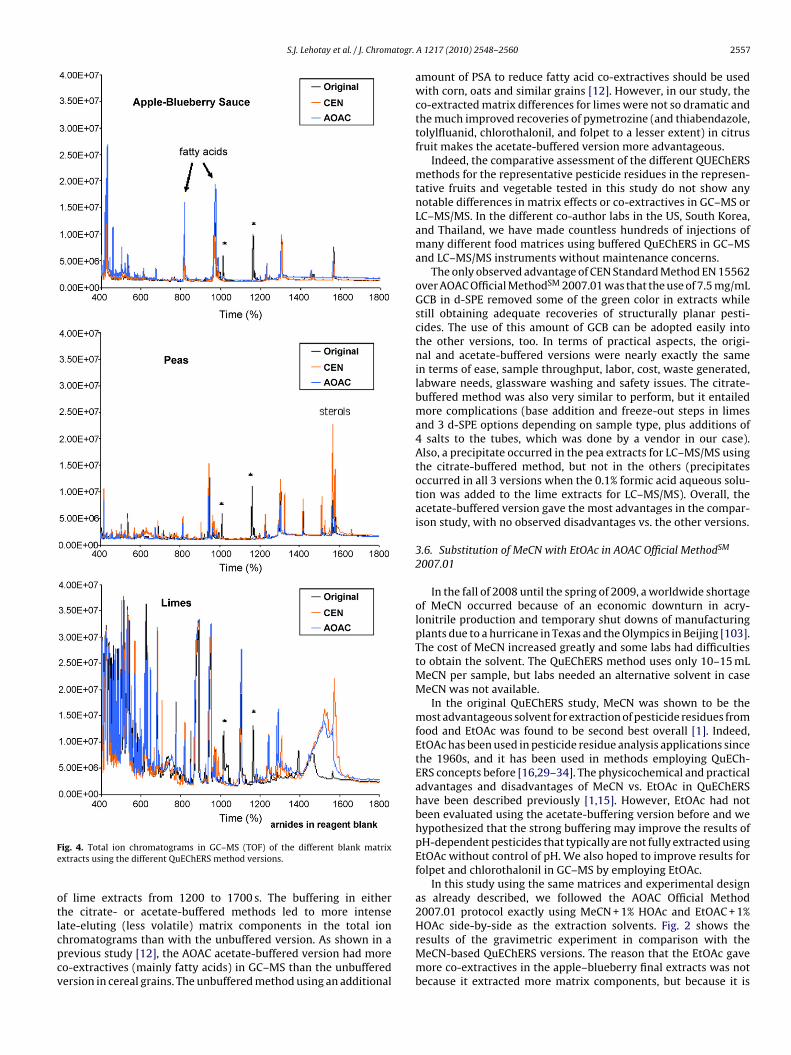
Fig. 4 shows the GC–MS total ion chromatograms of the matrixblank extracts for each commodity from the different methods; thechromatograms were very similar within each sample type for all 3methods. All of the same chromatographic peaks occurred for eachmatrix with only small intensity differences. Two prominent peaksof amides that appeared in the unbuffered method in all 3 matri-ces were traced to the reagent blanks, as indicated by asterisks inFig. 4. Otherwise, the peaks appearing in the reagent blanks weremuch fewer and less intense than those in the sample extracts. Asshown in Fig. 4, some prominent peaks from fatty acids appearedin the apple–blueberry extracts and some sterols appeared in peaextracts, but these did pose problems in the pesticide analyses.However, some pesticides were very difficult to integrate due to
the complexity of the matrix background in the case of limes andthe GC–MS results for those analytes in limes were excluded fromthe recovery compilation, as noted in Table 1.The only observable differences among the unbuffered andbuffered QuEChERS versions occurred in the chromatograms
S.J. Lehotay et al. / J. Chromatogr.
Fe
otlcpcv
HOAc side-by-side as the extraction solvents. Fig. 2 shows the
ig. 4. Total ion chromatograms in GC–MS (TOF) of the different blank matrixxtracts using the different QuEChERS method versions.
f lime extracts from 1200 to 1700 s. The buffering in eitherhe citrate- or acetate-buffered methods led to more intenseate-eluting (less volatile) matrix components in the total ion
hromatograms than with the unbuffered version. As shown in arevious study [12], the AOAC acetate-buffered version had moreo-extractives (mainly fatty acids) in GC–MS than the unbufferedersion in cereal grains. The unbuffered method using an additionalA 1217 (2010) 2548–2560 2557
amount of PSA to reduce fatty acid co-extractives should be usedwith corn, oats and similar grains [12]. However, in our study, theco-extracted matrix differences for limes were not so dramatic andthe much improved recoveries of pymetrozine (and thiabendazole,tolylfluanid, chlorothalonil, and folpet to a lesser extent) in citrusfruit makes the acetate-buffered version more advantageous.
Indeed, the comparative assessment of the different QUEChERSmethods for the representative pesticide residues in the represen-tative fruits and vegetable tested in this study do not show anynotable differences in matrix effects or co-extractives in GC–MS orLC–MS/MS. In the different co-author labs in the US, South Korea,and Thailand, we have made countless hundreds of injections ofmany different food matrices using buffered QuEChERS in GC–MSand LC–MS/MS instruments without maintenance concerns.
The only observed advantage of CEN Standard Method EN 15562over AOAC Official MethodSM 2007.01 was that the use of 7.5 mg/mLGCB in d-SPE removed some of the green color in extracts whilestill obtaining adequate recoveries of structurally planar pesti-cides. The use of this amount of GCB can be adopted easily intothe other versions, too. In terms of practical aspects, the origi-nal and acetate-buffered versions were nearly exactly the samein terms of ease, sample throughput, labor, cost, waste generated,labware needs, glassware washing and safety issues. The citrate-buffered method was also very similar to perform, but it entailedmore complications (base addition and freeze-out steps in limesand 3 d-SPE options depending on sample type, plus additions of4 salts to the tubes, which was done by a vendor in our case).Also, a precipitate occurred in the pea extracts for LC–MS/MS usingthe citrate-buffered method, but not in the others (precipitatesoccurred in all 3 versions when the 0.1% formic acid aqueous solu-tion was added to the lime extracts for LC–MS/MS). Overall, theacetate-buffered version gave the most advantages in the compar-ison study, with no observed disadvantages vs. the other versions.
3.6. Substitution of MeCN with EtOAc in AOAC Official MethodSM
2007.01
In the fall of 2008 until the spring of 2009, a worldwide shortageof MeCN occurred because of an economic downturn in acry-lonitrile production and temporary shut downs of manufacturingplants due to a hurricane in Texas and the Olympics in Beijing [103].The cost of MeCN increased greatly and some labs had difficultiesto obtain the solvent. The QuEChERS method uses only 10–15 mLMeCN per sample, but labs needed an alternative solvent in caseMeCN was not available.
In the original QuEChERS study, MeCN was shown to be themost advantageous solvent for extraction of pesticide residues fromfood and EtOAc was found to be second best overall [1]. Indeed,EtOAc has been used in pesticide residue analysis applications sincethe 1960s, and it has been used in methods employing QuECh-ERS concepts before [16,29–34]. The physicochemical and practicaladvantages and disadvantages of MeCN vs. EtOAc in QuEChERShave been described previously [1,15]. However, EtOAc had notbeen evaluated using the acetate-buffering version before and wehypothesized that the strong buffering may improve the results ofpH-dependent pesticides that typically are not fully extracted usingEtOAc without control of pH. We also hoped to improve results forfolpet and chlorothalonil in GC–MS by employing EtOAc.
In this study using the same matrices and experimental designas already described, we followed the AOAC Official Method2007.01 protocol exactly using MeCN + 1% HOAc and EtOAC + 1%
results of the gravimetric experiment in comparison with theMeCN-based QuEChERS versions. The reason that the EtOAc gavemore co-extractives in the apple–blueberry final extracts was notbecause it extracted more matrix components, but because it is
2558 S.J. Lehotay et al. / J. Chromatogr. A 1217 (2010) 2548–2560
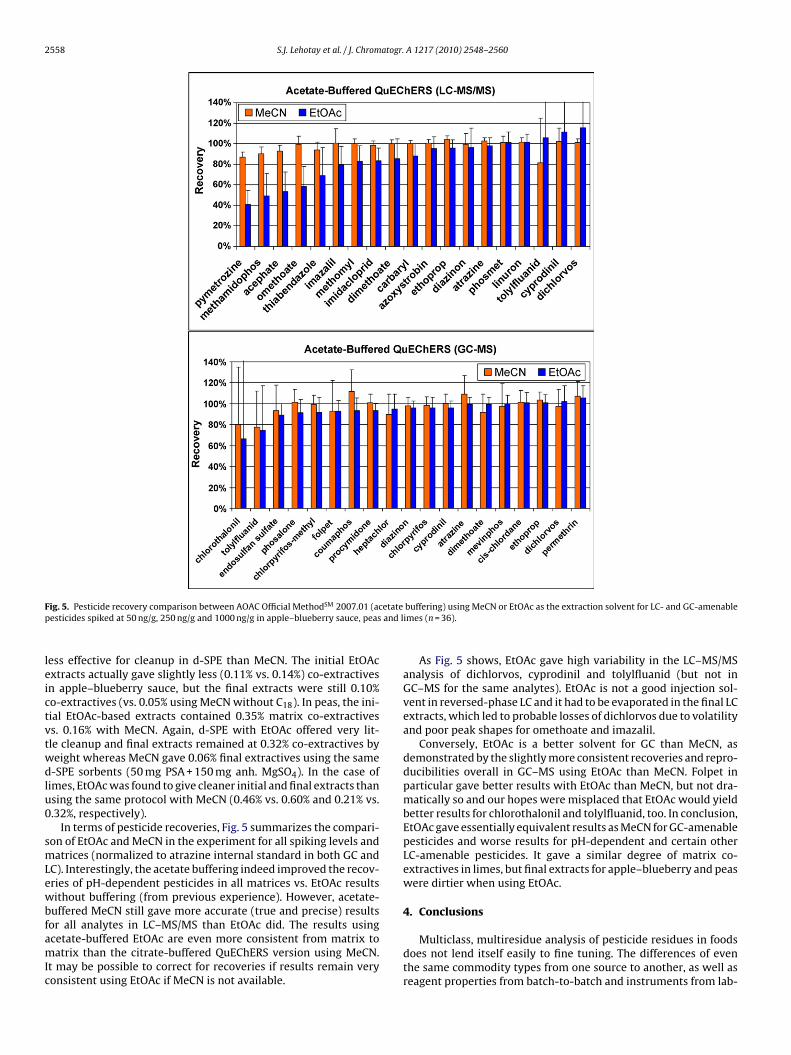
F etatep and l
leictvtwdlu0
smLewbfamIc
ig. 5. Pesticide recovery comparison between AOAC Official MethodSM 2007.01 (acesticides spiked at 50 ng/g, 250 ng/g and 1000 ng/g in apple–blueberry sauce, peas
ess effective for cleanup in d-SPE than MeCN. The initial EtOAcxtracts actually gave slightly less (0.11% vs. 0.14%) co-extractivesn apple–blueberry sauce, but the final extracts were still 0.10%o-extractives (vs. 0.05% using MeCN without C18). In peas, the ini-ial EtOAc-based extracts contained 0.35% matrix co-extractivess. 0.16% with MeCN. Again, d-SPE with EtOAc offered very lit-le cleanup and final extracts remained at 0.32% co-extractives byeight whereas MeCN gave 0.06% final extractives using the same-SPE sorbents (50 mg PSA + 150 mg anh. MgSO4). In the case of
imes, EtOAc was found to give cleaner initial and final extracts thansing the same protocol with MeCN (0.46% vs. 0.60% and 0.21% vs..32%, respectively).
In terms of pesticide recoveries, Fig. 5 summarizes the compari-on of EtOAc and MeCN in the experiment for all spiking levels andatrices (normalized to atrazine internal standard in both GC and
C). Interestingly, the acetate buffering indeed improved the recov-ries of pH-dependent pesticides in all matrices vs. EtOAc resultsithout buffering (from previous experience). However, acetate-
uffered MeCN still gave more accurate (true and precise) results
or all analytes in LC–MS/MS than EtOAc did. The results usingcetate-buffered EtOAc are even more consistent from matrix toatrix than the citrate-buffered QuEChERS version using MeCN.t may be possible to correct for recoveries if results remain veryonsistent using EtOAc if MeCN is not available.
buffering) using MeCN or EtOAc as the extraction solvent for LC- and GC-amenableimes (n = 36).
As Fig. 5 shows, EtOAc gave high variability in the LC–MS/MSanalysis of dichlorvos, cyprodinil and tolylfluanid (but not inGC–MS for the same analytes). EtOAc is not a good injection sol-vent in reversed-phase LC and it had to be evaporated in the final LCextracts, which led to probable losses of dichlorvos due to volatilityand poor peak shapes for omethoate and imazalil.
Conversely, EtOAc is a better solvent for GC than MeCN, asdemonstrated by the slightly more consistent recoveries and repro-ducibilities overall in GC–MS using EtOAc than MeCN. Folpet inparticular gave better results with EtOAc than MeCN, but not dra-matically so and our hopes were misplaced that EtOAc would yieldbetter results for chlorothalonil and tolylfluanid, too. In conclusion,EtOAc gave essentially equivalent results as MeCN for GC-amenablepesticides and worse results for pH-dependent and certain otherLC-amenable pesticides. It gave a similar degree of matrix co-extractives in limes, but final extracts for apple–blueberry and peaswere dirtier when using EtOAc.
4. Conclusions
Multiclass, multiresidue analysis of pesticide residues in foodsdoes not lend itself easily to fine tuning. The differences of eventhe same commodity types from one source to another, as well asreagent properties from batch-to-batch and instruments from lab-
atogr.
tpihra
tsawruacbfou
drfptSav[espi
A
t
R
S.J. Lehotay et al. / J. Chrom
o-lab make sensitive optimizations to fine tune matrix effects vs.esticide recoveries a continual, complicated pursuit. Just as build-
ngs and bridges require extra strength to withstand anomalies ofigh winds and other stresses, it is better to devise sample prepa-ation conditions to provide high recoveries of as many pesticidess feasible in as many matrices as possible.
The QuEChERS approach is so flexible and rugged that most pes-icides give excellent results when different amounts and types ofolvents and salts are used for extraction and different sorbentsnd amounts are used in d-SPE. There could be dozens of protocolsith slight modifications that achieve high recoveries, but with no
eal advantages over each other depending on the matrices. These of a single protocol with a single set of reagents is much easiernd more efficient than using different methods for the same appli-ation. Our study showed that protocol subtleties with respect toase additions, different amounts of d-SPE sorbents and use of areeze-out step provided no observed benefit. In fact, such stepsnly add to the time, complication and cost of the method, whichndermines the QuEChERS concept.
Only a few pesticides are problematic with the approach,epending on matrix and buffering is essential to improve theesults for pH-dependent pesticides. It is only for those pesticidesor which buffering is needed, therefore, and the results for thoseesticides must not be compromised or sacrificed by trying to “fineune” the protocol. The use of weak citrate buffering as in CENtandard Method EN 15662 does not meet the need to achievecceptably high recoveries of pymetrozine in different matricess. the previously-developed acetate-buffered QuEChERS method6,8]. In d-SPE, the use of 7.5 mg GCB with 50 mg (or possibly more)ach of PSA and C18 and 150 mg MgSO4 per mL extract provideslightly better cleanup of food extracts without severely affectingesticide recoveries. A final QuEChERS protocol may be harmonized
n this way after further assessments and interlaboratory trials.
ppendix A. Supplementary data
Supplementary data associated with this article can be found, inhe online version, at doi:10.1016/j.chroma.2010.01.044.
eferences
[1] M. Anastassiades, S.J. Lehotay, D. Stajnbaher, F.J. Schenck, J. AOAC Int. 86(2003) 412.
[2] www.isiknowledge.com.[3] S.J. Lehotay, M. Hiemstra, P. van Bodegraven, A. de Kok, J. AOAC Int. 88 (2005)
595.[4] www.quechers.com.[5] P. Payá, M. Anastassiades, D. Mack, I. Sigalova, B. Tasdelen, J. Oliva, A. Barba,
Anal. Bioanal. Chem. 389 (1697) (2007) 1714.[6] S.J. Lehotay, K. Mastovská, A.R. Lightfield, J. AOAC Int. 88 (2005), 615–629 &
60A.[7] M. Anastassiades, E. Scherbaum, B. Tasdelen, D. Stajnbaher, in: H. Ohkawa,
H. Miyagawa, P.W. Lee (Eds.), Crop Protection, Public Health, EnvironmentalSafety, Wiley-VCH, Weinheim, Germany, 2007, p. 439.
[8] S.J. Lehotay, J. AOAC Int. 90 (2007) 485.[9] www.cen.eu.
[10] S.J. Lehotay, K. Mastovská, S.J. Yun, J. AOAC Int. 88 (2005) 630.[11] S.C. Cunha, S.J. Lehotay, K. Mastovska, J.O. Fernandes, B.M.P.P. Oliveira, J. Sep.
Sci. 30 (2007) 620.[12] K. Mastovska, K.J. Dorweiler, S.J. Lehotay, J.S. Wegscheid, K.A. Szpylka, J. Agric.
Food Chem. (2010) (doi:10.1021/jf9029892).[13] U. Koesukwiwat, S.J. Lehotay, K. Mastovska, K.J. Dorweiler, N. Leepipatpiboon,
J. Agric. Food Chem. (2010) (doi:10.1021/jf902988b).[14] S.J. Lehotay, in: J.L. Martinez Vidal, A. Garrido Frenich (Eds.), Pesticide Proto-
cols, Methods in Biotechnology Series #19, Humana Press, Totowa, NJ, USA,2006, p. 239.
[15] S.J. Lehotay, in: J. Zweigenbaum (Ed.), Pesticide Protocols, Methods in Biotech-
nology Series, Humana Press, Totowa, NJ, USA, 2010.[16] P. Aysal, A. Ambrus, S.J. Lehotay, A. Cannavan, Am. J. Environ. Sci. Health B 42(2007) 481.
[17] F.J. Schenck, J.E. Hobbs, Bull. Environ. Contam. Toxicol. 73 (2004) 24.[18] S.J. Lehotay, K. Mastovska, A.R. Lightfield, R.A. Gates, J. AOAC Int. 93 (2010).[19] A. Beyer, M. Biziuk, Food Chem. 108 (2008) 669.
A 1217 (2010) 2548–2560 2559
[20] B. Kmellár, L. Abrankó, P. Fodor, S.J. Lehotay, Food Addit. Contam., submittedfor publication.
[21] T. Cajka, K. Mastovská, S.J. Lehotay, J. Hajslová, J. Sep. Sci. 28 (2005) 1048.[22] T. Cajka, J. Hajslova, O. Lacina, K. Mastovska, S.J. Lehotay, J. Chromatogr. A
1186 (2008) 281.[23] F.J. Schenck, A.N. Brown, L.V. Podhorniak, A. Parker, M. Reliford, J.W. Wong, J.
AOAC Int. 91 (2008) 422.[24] K. Zhang, J.W. Wong, D.G. Hayward, P. Sheladia, A.J. Krynitsky, F.J. Schenck,
M.G. Webster, J.A. Ammann, S.E. Ebeler, J. Agric. Food. Chem. 57 (2009) 4019.[25] T. Kovalczuk, O. Lacina, M. Jech, J. Poustka, J. Hajslová, Food Addit. Contam. A
25 (2008) 444.[26] S.C. Cunha, J.O. Fernandes, A. Alves, M.B. Oliveira, J. Chromatogr. A 1216 (2009)
119.[27] U. Koesukwiwat, K. Sanguankaew, N. Leepipatpiboon, Anal. Chim. Acta 626
(2008) 10.[28] C. Díez, W.A. Traag, P. Zommer, P. Marinero, J. Atienza, J. Chromatogr. A 1131
(2006) 11.[29] H.G. Mol, A. Rooseboom, R. van Dam, M. Roding, K. Arondeus, S. Sunarto, Anal.
Bioanal. Chem. 389 (2007) 1715.[30] M.K. van der Lee, G. van der Weg, W.A. Traag, H.G. Mol, J. Chromatogr. A 1186
(2008) 325.[31] K. Banerjee, D.P. Oulkar, S. Dasgupta, S.B. Patil, S.H. Patil, R. Savant, P.G. Adsule,
J. Chromatogr. A 1173 (2007) 98.[32] K. Banerjee, D.P. Oulkar, S.B. Patil, M.R. Jadhav, S. Dasgupta, S.H. Patil, S. Bal,
P.G. Adsule, J. Agric. Food Chem. 57 (2009) 4068.[33] S.H. Patil, K. Banerjee, S. Dasgupta, D.P. Oulkar, S.B. Patil, M.R. Jadhav, R.H.
Savant, P.G. Adsule, M.B. Deshmukh, J. Chromatogr. A 1216 (2009) 2307.[34] K. Banerjee, D.P. Oulkar, S.B. Patil, S.H. Patil, S. Dasgupta, R. Savant, P.G. Adsule,
J. AOAC Int. 91 (2008) 1435.[35] C.C. Leandro, P. Hancock, R.J. Fussell, B.J. Keely, J. Chromatogr. A 1166 (2007)
152.[36] C.C. Leandro, P. Hancock, R.J. Fussell, B.J. Keely, J. Chromatogr. A 1144 (2007)
161.[37] C.C. Leandro, R.J. Fussell, B.J. Keely, J. Chromatogr. A 1085 (2005) 207.[38] C.C. Leandro, P. Hancock, R.J. Fussell, B.J. Keely, J. Chromatogr. A 1103 (2006)
94.[39] S. Walorczyk, J. Chromatogr. A 1165 (2007) 200.[40] S. Walorczyk, J. Chromatogr. A 1208 (2008) 202.[41] S. Walorczyk, Rapid Commun. Mass Spectrom. 22 (2008) 3791.[42] T.D. Nguyen, B.S. Lee, B.R. Lee, D.M. Lee, G.H. Lee, Rapid Commun. Mass Spec-
trom. 21 (2007) 3115.[43] T.D. Nguyen, E.M. Han, M.S. Seo, S.R. Kim, M.Y. Yun, D.M. Lee, G.H. Lee, Anal.
Chim. Acta 619 (2008) 67.[44] F. Ji, L. Zhao, W. Yan, Q. Feng, J.M. Lin, J. Sep. Sci. 31 (2008) 961.[45] L. Li, Y. Xu, C. Pan, Z. Zhou, S. Jianc, F. Liu, J. AOAC Int. 90 (2007) 1387.[46] L. Li, H. Zhang, C. Pan, Z. Zhou, S. Jiang, F. Liu, J. Sep. Sci. 30 (2007) 2097.[47] J.M. Lee, J.W. Park, G.C. Jang, K.J. Hwang, J. Chromatogr. A 1187 (2008) 25.[48] J. Hu, Y. Sheng, Z. Fang, J. Jin, K. He, Se Pu 25 (2007) 441.[49] W. Shen, H. Lin, Z. Zhao, T. Ding, J. Xu, C. Shen, Se Pu 26 (2008) 515.[50] T. Hayama, M. Takada, Anal. Bioanal. Chem. 392 (2008) 969.[51] M.M. Galera, M.D. García, R.S. Valverde, Talanta 76 (2008) 815.[52] T. Dagnac, M. Garcia-Chao, P. Pulleiro, C. Garcia-Jares, M. Llompart, J. Chro-
matogr. A 1216 (2009) 3702.[53] R. Romero-González, A. Garrido-Frenich, J.L. Martínez-Vidal, Talanta 76
(2008) 211.[54] A. Garrido-Frenich, J.L. Martínez-Vidal, E. Pastor-Montoro, R. Romero-
González, Anal. Bioanal. Chem. 390 (2008) 947.[55] J.L. Fernández-Moreno, A. Garrido-Frenich, P. Plaza-Bolanos, J.L. Martínez-
Vidal, J. Mass Spectrom. 43 (2008) 1235.[56] P.P. Bolanos, J.L. Moreno, D.D. Shtereva, A. Garrido-Frenich, J.L. Martínez-
Vidal, Rapid Commun. Mass Spectrom. 21 (2007) 2282.[57] B. Gilbert-López, J.F. García-Reyes, P. Ortega-Barrales, A. Molina-Díaz, A.R.
Fernández-Alba, Rapid Commun. Mass Spectrom. 21 (2007) 2059.[58] M. Mezcua, C. Ferrer, J.F. García-Reyes, M.J. Martínez-Bueno, M. Albarracín, M.
Claret, A.R. Fernández-Alba, Rapid Commun. Mass Spectrom. 22 (2008) 1384.[59] B. Kmellár, P. Fodor, L. Pareja, C. Ferrer, M.A. Martínez-Uroz, A. Valverde, A.R.
Fernandez-Alba, J. Chromatogr. A 1215 (2008) 37.[60] M. Kirchner, R. Húsková, E. Matisová, J. Mocák, J. Chromatogr. A 1186 (2008)
271.[61] A. Hercegová, M. Dömötörová, D. Kruzlicová, E. Matisová, J. Sep. Sci. 29 (2006)
1102.[62] A. Hercegová, M. Dömötörová, E. Matisová, J. Chromatogr. A 1153 (2007) 54.[63] M. Liu, Y. Hashi, Y. Song, J.M. Lin, J. Chromatogr. A 1097 (2005) 183.[64] K. Kawata, T. Asada, K. Oikawa, J. Chromatogr. A 1090 (2005) 10.[65] A. Kruve, A. Künnapas, K. Herodes, I. Leito, J. Chromatogr. A 1187 (2008) 58.[66] J. Wang, D. Leung, J. AOAC Int. 92 (2009) 279.[67] J. Wang, D. Leung, J. Agric. Food Chem. 57 (2009) 2162.[68] I. Walz, W. Schwack, J. Agric. Food Chem. 55 (2007) 10563.[69] L. Li, W. Li, D. Qin, S. Jiang, F. Liu, J. AOAC Int. 92 (2009) 538.[70] F. Schenck, J. Wong, C. Lu, J. Li, J.R. Holcomb, L.M. Mitchell, J. AOAC Int. 92
(2009) 561.[71] C. Shi, W. Gui, J. Chen, G. Zhu, Bull. Environ. Contam. Toxicol. 84 (2010) 236.[72] R. Húsková, E. Matisová, S. Hrouzková, L. Svorc, J. Chromatogr. A 1216 (2009)
6326.[73] R. Húsková, E. Matisová, L. Svorc, J. Mocák, M. Kirchner, J. Chromatogr. A 1216
(2009) 4927.
2 atogr.
[108] J. Hajslová, J. Zrostlíková, J. Chromatogr. A 1000 (2003) 181.
560 S.J. Lehotay et al. / J. Chrom
[74] Y. Jiang, X. Li, J. Xu, C. Pan, J. Zhang, W. Niu, Food Addit. Contam. A 26 (2009)859.
[75] C. Przybylski, C. Segard, J. Sep. Sci. 32 (2009) 1858.[76] S. Walorczyk, B. Gnusowski, J. Chromatogr. A 1216 (2009) 6522.[77] K. Mastovska, S.J. Lehotay, J. Agric. Food Chem. 54 (2006) 7001.[78] L. Dunovská, T. Cajka, J. Hajslová, K. Holadová, Anal. Chim. Acta 578 (2006)
234.[79] F. Plössl, M. Giera, F. Bracher, J. Chromatogr. A 1135 (2006) 19.[80] M. Giera, F. Plössl, F. Bracher, Steroids 72 (2007) 633.[81] C.K. Fagerquist, A.R. Lightfield, S.J. Lehotay, Anal. Chem. 77 (2005) 1473.[82] K. Mastovska, A.R. Lightfield, J. Chromatogr. A 1202 (2008) 118.[83] B. Kinsella, S.J. Lehotay, K. Mastovska, A.R. Lightfield, A. Furey, M. Danaher,
Anal. Chim. Acta 637 (2009) 196.[84] M.J. Schneider, K. Mastovska, S.J. Lehotay, A.R. Lightfield, B. Kinsella, C.E.
Shultz, Anal. Chim. Acta 637 (2009) 290.[85] M.M. Aguilera-Luiz, J.L. Martínez-Vidal, R. Romero-González, A. Garrido-
Frenich, J. Chromatogr. A 1205 (2008) 10.[86] G. Stubbings, T. Bigwood, Anal. Chim. Acta 637 (2009) 68.[87] R.M. Costain, A.C. Fesser, D. McKenzie, M. Mizuno, J.D. Macneil, Food Addit.
Contam. 21 (2008) 1.[88] W.H. Tsai, T.C. Huang, J.J. Huang, Y.H. Hsue, H.Y. Chuang, J. Chromatogr. A 1216
(2009) 2263.[89] A. Posyniak, J. Zmudzki, K. Mitrowska, J. Chromatogr. A 1087 (2005) 259.
[90] S.E. McMullen, F.J. Schenck, V.A. Vega, J. AOAC Int. 92 (2009) 1233.[91] M.C. Alcudia-León, R. Lucena, S. Cárdenas, M. Valcárcel, Anal. Chem. 81 (2009)1184.[92] R. Stepan, P. Cuhra, S. Barsova, Food Addit. Contam. A 25 (2008) 557.[93] C.R. Powley, S.W. George, T.W. Ryan, R.C. Buck, Anal. Chem. 77 (2005) 6353.[94] S.P. van Leeuwen, J. de Boer, J. Chromatogr. A 1153 (2007) 172.
A 1217 (2010) 2548–2560
[95] M. João Ramalhosa, P. Paíga, S. Morais, C. Delerue-Matos, M.B.P.P. Oliveira, J.Sep. Sci. 32 (2009) 3529.
[96] R. Krska, G. Stubbings, R. Macarthur, C. Crews, Anal. Bioanal. Chem. 391 (2008)563.
[97] C. Lesueur, M. Gartner, A. Mentler, M. Fuerhacker, Talanta 75 (2008) 284.[98] L. Chen, X.S. Li, Z.Q. Wang, C.P. Pan, R.C. Jin, Ecotoxicol. Environ. Saf. 73 (2010)
73.[99] Q. Wu, C. Wang, Z. Liu, C. Wu, X. Zeng, J. Wen, Z. Wang, J. Chromatogr. A 1216
(2009) 5504.[100] D. Drozdzynski, J. Kowalska, Anal. Bioanal. Chem. 394 (2009) 2241.[101] I.R. Pizzutti, A. de Kok, M. Hiemstra, C. Wickert, O.D. Prestes, J. Chromatogr. A
1216 (2009) 4539.[102] H.G. Mol, P. Plaza-Bolanos, P. Zomer, T.C. de Rijk, A.A. Stolker, P.P. Mulder,
Anal. Chem. 80 (2008) 9450.[103] C&E News, Nov. 24, 2008, p. 27.[104] K. Mastovská, S.J. Lehotay, J. Chromatogr. A 1040 (2004) 259.[105] European Commission, EU Pesticides Database of MRLs, Regulation (EC) No.
396/2005 (http://ec.europa.eu/sanco pesticides/public/index.cfm).[106] www.pesticides-online.com.[107] J. Shia, Florida Pesticide Residue Workshop, St. Pete Beach, FL,
USA, 2009, July 19–22 (www.flworkshop.com/09documents/2009-Presentations/12 Shia.pdf).
[109] D.R. Erney, A.M. Gillespie, D.M. Gilvydis, C.F. Poole, J. Chromatogr. 638 (1993)57.
[110] M. Anastassiades, K. Mastovská, S.J. Lehotay, J. Chromatogr. A 1015 (2003)163.
[111] K. Mastovská, S.J. Lehotay, Anal. Chem. 77 (2005) 8129.