Embed Size (px)
Citation preview
ILASS Americas, 24th Annual Conference on Liquid Atomization and Spray Systems, San Antonio, TX, May 2012
Comparison of RANS and LES Turbulence Models against Constant Volume Diesel Exper-
iments
S. Som*1
, P.K. Senecal2, and E. Pomraning
2
1Energy Systems Division, Argonne National Laboratory, Argonne, IL-60439, USA
2Convergent Science Inc., Middleton, WI-53562, USA
Abstract
Under modern direct injection diesel engine conditions, the spray and combustion processes are known to be mixing
controlled. Large eddy simulations (LES) can potentially improve the predictive capability by better capturing the
large scale mixing of ambient air with the fuel vapor. In the present study, a Smagorinsky based LES model is im-
plemented in the commercial code called CONVERGE. The LES model is compared against a standard Reynolds-
averaged Navier-Stokes (RANS) based RNG k-ε model which is routinely used for engine simulations. Validations
are performed against experimental data from Sandia National Laboratories in a constant volume combustion cham-
ber using diesel surrogates i.e., n-heptane and n-dodecane under both non-reacting and reacting conditions. Using
adaptive grid resolution, minimum grid sizes of 250 µm and 125 µm were obtained for the RANS and LES cases
respectively. Under non-reacting conditions, global spray characteristics are well predicted by both the turbulence
models. However, the LES model clearly improves qualitatively the instantaneous fuel vapor distribution. Under
reacting conditions, the Smagorinsky based LES model better predicts the ignition delay characteristics compared to
the RANS model. Flame stabilization phenomenon is also qualitatively accurately predicted with the LES model.
However, these improved predictions come at an increased in computational cost. Sensitivity analysis was also per-
formed to the LES model constants.
*Corresponding author: [email protected]
2
INTRODUCTION
Combustion in direct-injection diesel engines
occurs in a lifted, turbulent diffusion flame mode.
Numerous studies indicate that the combustion and
emissions in such engines are strongly influenced by
the lifted flame characteristics, which are in turn de-
termined by fuel and air mixing in the upstream re-
gion of the lifted flame, and consequently by the liq-
uid breakup and spray development processes [1-5].
They involve transient, two-phase turbulent flows
with elevated pressures, and a wide range of temporal
and spatial scales. These processes clearly play a crit-
ical role in determining the engine combustion and
emission characteristics. For instance, correlation was
observed between the soot distribution and lift-off
length (LOL) for diesel jets in the recent experiments
by Pickett and Siebers [6,7]. Consequently, the ex-
perimental, theoretical, and computational studies of
these flows have been challenging. From a numerical
standpoint, these spray combustion processes depend
heavily on the choice of underlying spray, combus-
tion, and turbulence models.
Fuel air mixing is non-uniform mainly due to the
transient turbulent nature of the flow inside the com-
bustion chamber. Subsequently, local inhomogeneity
in equivalence ratio can result in varied ignition and
emission characteristics [8]. Direct Numerical Simu-
lations (DNS) offer potential to completely resolve
all the relevant flow scales, however, the computa-
tional cost associated is not practical for engine stud-
ies [9]. Reynolds Averaged Navier Stokes (RANS)
and more recently Large Eddy Simulation (LES)
based approaches are typically employed for engine
simulations. RANS approach is based on ensemble
averaged governing equations, hence, cannot predict
the local unsteadiness in the flow. LES approach
which is based on spatially filtered governing equa-
tions can capture the large scale flow structures based
on the filter size. However, the unresolved small
scale structures are still modeled. Since LES can cap-
ture local unsteadiness and is computationally more
tractable than a DNS based approach, it has received
significant attention in the past decade, especially for
simulation of internal combustion engines. An excel-
lent review of different LES modeling approaches
can be found in literature by Pope [10].
Our literature study reveals several groups using
a RANS based approach [4,11-17]. In general, the
global flow characteristics such as spray and vapor
penetration, liquid length, ignition delay, flame lift-
off length, heat release rates, and pressure traces etc.,
can be fairly well predicted by a RANS approach.
This is not surprising since these global experimental
parameters are reported in an ensemble averaged
fashion [1,2,3]. More recently different flavors of
LES models have been applied; an excellent reviews
can be found in literature by Rutland [18]. Broadly
they can be classified as viscosity and non-viscosity
based. Pomraning [19,20] implemented a one equa-
tion non-viscosity dynamic structure model since it is
known to be less dissipative compared to the viscosi-
ty based models, especially for coarse grids. Banerjee
et al. [21], applied this model together with a sub-grid
mixing model to predict the combustion characteris-
tics under low-temperature conditions.
While different flavors of LES models have been
used for predicting combustion and emission charac-
teristics their ability to predict LOLs and ignition
delays in constant volume combustion vessels has not
been adequately assessed. Since diesel spray combus-
tion processes are mixing controlled, improvements
in predicting LOLs and ignition delays may be
achieved with a LES model. This potential is the ba-
sis for the present numerical study, the primary ob-
jectives of which are to (1) Implement a Smagorinsky
[22] based LES model in the commercial code
CONVERGE (2) compare the RANS and LES ap-
proaches under both non-reacting and reacting condi-
tions for qualitatively and quantitatively predicting
the spray and flame structures. Another objective of
this study is to assess the computational cost associ-
ated with running high resolution LES model. Sma-
gorinsky based LES model is a viscosity based ap-
proach hence, is expected to be diffusive in nature on
coarse grids. This drawback is partially circumvented
by using grid sizes in the order of nozzle diameter.
Another weakness of this model is that it is purely
dissipative and does not allow for energy transfer
from the sub-grid to the resolved scales. The authors
intend to test the simplest implementation of an LES
model before testing more advanced approaches.
Hence the Smagorinsky based approach is selected
for this computational study.
In the past decade, several studies were per-
formed by researchers at Sandia National Laborato-
ries to provide high-fidelity measurements of pa-
rameters such as spray penetration, liquid length,
vapor penetration, mixture-fraction [23,24,25], igni-
tion delay, LOL, and soot emissions for a range of
ambient and injection conditions, in a constant vol-
ume combustion vessel. A variety of fuels and fuel
surrogates, such as diesel #2, biodiesel, NHPT, and
n-dodecane, were studied in these experiments, and
the resulting dataset can be accessed through the En-
gine Combustion Network [26]. Only recently, this
high-fidelity dataset has been used for spray combus-
tion model development and validation. Of specific
interest for the current study is the instantaneous fuel
and temperature distribution measurements per-
3
formed by Idicheria et al. [23,24], since it provides
more realistic information for LES model validation.
The paper is organized in the following way.
First a brief introduction is provided for the spray and
combustion models used followed by the governing
equations for the Smagorinsky based LES model.
The experimental dataset from Sandia National La-
boratory which is extensively used for validation
purposes is discussed next. The results and discussion
section is mainly divided into non-reacting and react-
ing spray conditions. Robust validation of the Sma-
gorinsky based LES model is provided and compared
with predictions by the RANS model. The computa-
tional cost associated with standard RANS and high
resolution LES approaches is also highlighted in this
section. Finally, conclusions are presented.
PHYSICAL-COMPUTATIONAL MODEL
Fuel spray and combustion simulations were per-
formed using the Eulerian-Lagrangian approach in
the computational fluid dynamics software CON-
VERGE [4,27,28]. It incorporates state-of-the-art
models for spray injection, atomization and breakup,
turbulence, droplet collision, and coalescence. The
gas-phase flow field is described by using either the
Favre-Averaged Navier-Stokes equations in conjunc-
tion with the RNG k-ε or the LES based turbulence
model, which includes source terms for the effects of
dispersed phase on gas-phase turbulence. These equa-
tions are solved by using a finite volume solver. The
details of these models can be found in previous pub-
lications [29], so only a brief description is provided
here.
The Kelvin-Helmholtz (KH) and Rayleigh-
Taylor (RT) models are used to predict the subse-
quent secondary droplet breakup [30,31]. Droplet
collisions are modeled with no time counter algo-
rithm [32]. Once a collision occurs, the outcomes of
the collision are predicted as bouncing, stretching,
reflexive separation, or coalescence [33]. A droplet
evaporation model based on the Frossling correlation
is used. Also used is a dynamic drag model based on
the postulation that the drag coefficient depends on
the shape of the droplet, which can vary between a
sphere and a disk. The effects of turbulence on the
droplet are accounted for using a turbulent dispersion
model. It should be noted that for both RANS and
LES based turbulence models, same set of spray con-
stants was selected for validation purposes.
Detailed kinetic modeling is performed using the
SAGE chemical kinetic solver [11,27,28] directly
coupled with the gas-phase calculations using a well-
stirred reactor model. The NHPT chemical kinetic
mechanism used in the current study is from Lu and
Law [34] consisting of 68 species and 283 elemen-
tary reactions. Several research groups are simultane-
ously working towards improving different aspects of
turbulent spray combustion modeling. Our specific
focus in this study is to improve the turbulence mod-
eling by implementing a Smagorinsky based LES
turbulence model. The authors are keenly following
the developments in the field of turbulence chemistry
interactions (TCI) modeling by Haworth et al. [35].
To the best of our knowledge this is the only group
pursuing developments in TCI modeling for spray
combustion applications. In a recent study by Ha-
worth and co-workers [36], qualitative differences in
the flame structure were observed between simula-
tions accounting for TCI vs. not accounting for TCI.
However, the reaction mechanisms chosen were that
of n-heptane consisting of 29 and 34 species while
the grid size was of the order of 1mm. The reaction
mechanism used in the current study is two times
higher in terms of number of species, the minimum
grid size being 0.125mm. PDF based TCI modeling
together with the large reaction mechanism and fine
grid sizes used in the current study would be compu-
tationally too expensive and beyond the scope of the
current study.
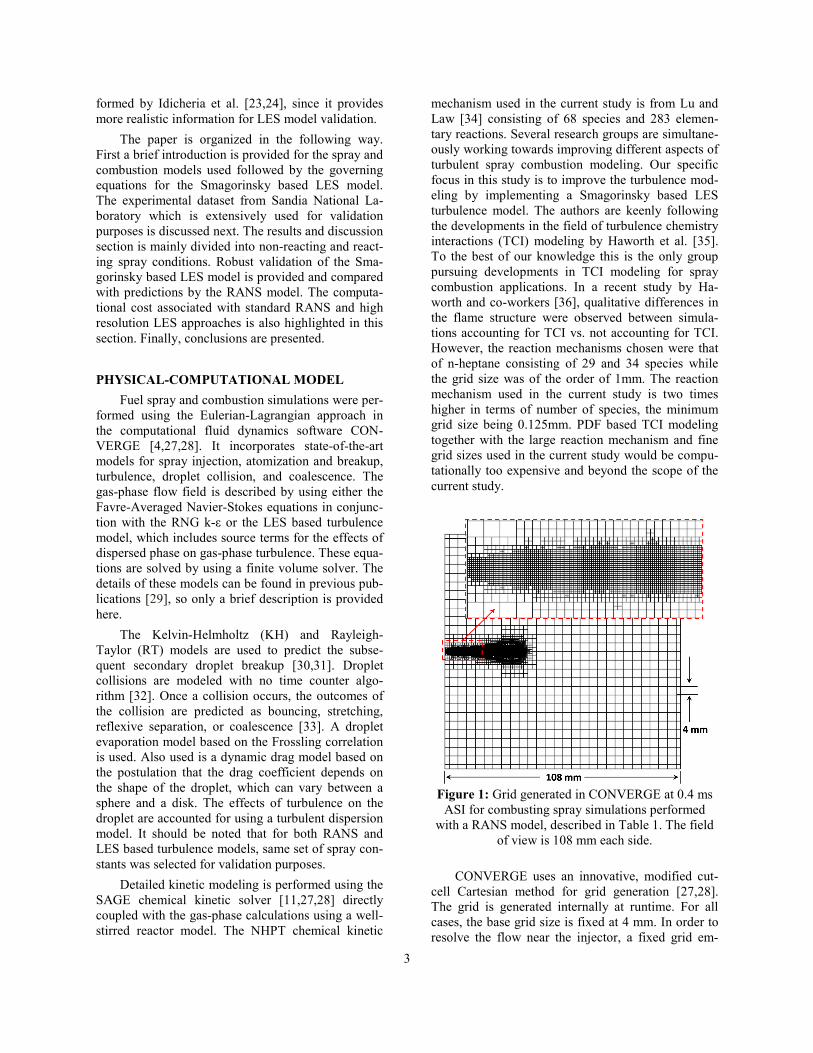
Figure 1: Grid generated in CONVERGE at 0.4 ms
ASI for combusting spray simulations performed
with a RANS model, described in Table 1. The field
of view is 108 mm each side.
CONVERGE uses an innovative, modified cut-
cell Cartesian method for grid generation [27,28].
The grid is generated internally at runtime. For all
cases, the base grid size is fixed at 4 mm. In order to
resolve the flow near the injector, a fixed grid em-
4
bedding is employed such that the minimum grid size
is 0.25 mm for RANS and 0.125 mm for LES simula-
tions. Apart from this region, it is rather difficult to
determine a priori where a refined grid is needed.
Hence, different levels of adaptive mesh refinement
are employed for the velocity field. To match the
combustion chamber geometry used in the experi-
mental study, a cubical geometry of 108 mm on each
side is generated (cf. Fig. 1). The zoomed-in view of
the fixed embedding region is also shown. As men-
tioned earlier, the overall objective is to compare a
standard RANS simulation against a higher-fidelity
LES based approach under non-reacting and reacting
conditions. The standard modeling approach consists
of using a coarser minimum grid size with RANS
based models (similar to studies reported in literature
[4,11,12,14]), whereas, the high-fidelity approach
consists of using a finer mesh (such as 0.125mm)
with LES models. Smaller grid sizes were necessary
with the LES model for two reasons: (1) since a zero-
equation Smagorinsky model is being used, it is de-
sirable that the sub-grid scale modeling is reduced,
and (2) the possibility of accurately capturing the
large-scale flow structures is higher with a finer grid.
LES – Smagorinsky Based Turbulence Model
Velocity and other thermodynamic variables are
expressed in Favre form, whereas density and pres-
sure are expressed in Reynolds form. The density-
weighted LES spatial-filtering operation on the Na-
vier-Stokes equation results in the filtered momentum
equation:
i
j
i
jj
ij
ij
jii Fx
u
xx
T
x
P
x
uu
t
u−
∂∂
∂∂
+∂
∂−
∂∂
−=∂
∂+
∂∂
~~~~
µρρρ (1)
where the LES sub-grid scale tensor:
−=
~~~
jijiij uuuuT
(2)
is modeled using a Smagorinsky-based model:
kkijijsij TSSCT δ
3
12 2 +∆−=
(3)
where ijij SSS 2=
, 31
cellV=∆ (4)
and
∂
∂+
∂∂
=i
j
j
iij
x
u
x
uS
2
1
The spray models require a turbulent kinetic energy
for closure. For the Smagorinsky model, the sub-grid
turbulent kinetic energy is not readily available.
Hence, the following expression is used for closure:
j
i
j
iles
x
u
x
uCk
∂∂
∂∂∆
≅24
2
(5)
The influence of the two model constants Cs and Cles
is investigated.
Experimental Data for Validation
Experimental data to use for comparison are ob-
tained from Sandia National Laboratories, where a
constant-volume, quiescent, pre-burn-type combus-
tion vessel is used to generate high-temperature and
high-pressure gases. A premixed combustible mix-
ture is spark-ignited. The combustion products cool
over a long time. Once the desired pressure and tem-
perature are reached, the diesel fuel injector is trig-
gered and fuel injection occurs. The conditions for
both diesel fuel surrogates n-heptane and n-dodecane
are noted in Table 1. The measured rate of injection
(ROI) profile is top-hot for both the fuels and the
total mass injected is also mentioned in the table. The
liquid and vapor penetration versus time, liquid
length, ignition delay and pressure-rise rate, LOL,
and quantitative soot volume fraction, and various
high-speed movies of combustion data are available
to validate the spray and combustion models [1-3,5-
7,23-26].
Fuel Conditions n-Heptane n-Dodecane Ambient temperature (K) 800–1300 900
Ambient density (kg/m3) 14.8 22.8
Composition
Non-reacting: 0%
O2
Reacting: 10–21%
O2
Non-reacting: 0%
O2
Injection pressure (bar) 1500 1500
Fuel temperature (K) 373 363
Nozzle diameter (µm) 100 90
Duration of injection (ms) 6.8 1.5
Total mass injected (mg) 17.8 3.5
Fuel Density (kg/m3) 700 750
Table 1: Range of conditions for the combusting
spray experiments at Sandia National Laboratories
[1-3,5-7,24-27,40] with n-heptane and n-dodecane.
Results and Discussion
Liquid penetration, vapor penetration, LOL, and
ignition delay data will be used for validation of the
turbulence models; hence, these parameters will be
first defined, consistent with our previous investiga-
tions [4,29]. Liquid penetration is defined as the axial
location encompassing 97% of the injected mass at
that instant of time. Vapor penetration at any time is
determined from the farthest downstream location of
5
0.05% fuel mass-fraction contour. Flame LOL is de-
termined by the nearest upstream location of tem-
perature ≥ 2200 K contour. Ignition delay is defined
as the time from start of injection to the time when
temperatures above 2000K are first observed in any
computational cell.
Non-reacting Simulations
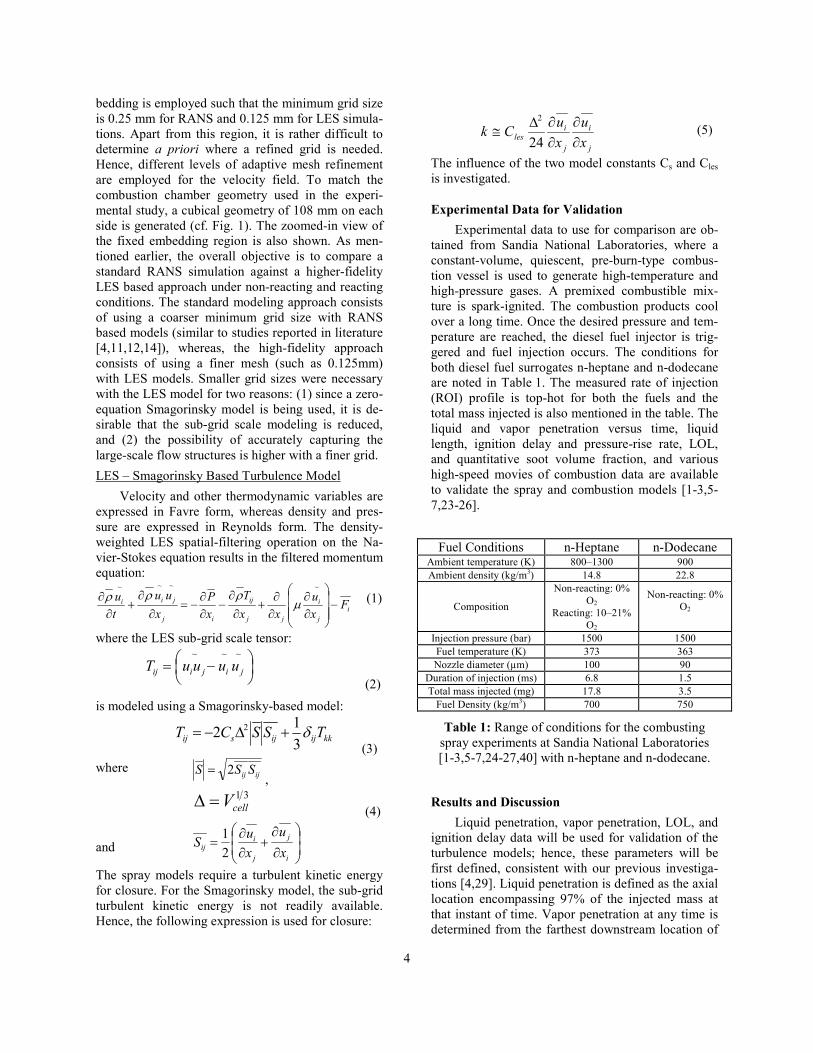
Figure 2: Measured [26,27] and predicted liquid
penetration and vapor penetration vs. time for n-
dodecane calculated by using RANS and LES turbu-
lence models.
First, the non-reacting data-set is used for
benchmarking the simulations to ensure that the fuel-
air distribution is accurately predicted by the turbu-
lence models. The reason for this is the fact that the
fuel distribution (equivalence ratio) needs to be accu-
rately predicted before combustion characteristics are
validated. Figure 2 presents predicted and measured
liquid spray and fuel vapor penetration at different
times after start of injection (ASI) under non-reacting
conditions for n-dodecane at an ambient temperature
of 900K. The experimental conditions are listed in
Table 1. The liquid and vapor penetration are better
captured in the early stages (< 0.1 ms) by the LES
model. However, the liquid length and vapor penetra-
tion is fairly well predicted by both the turbulence
models. It should be noted that similar trends for liq-
uid length and vapor penetration were also observed
for n-heptane sprays, hence are not shown here. It can
be concluded that global spray characteristics are
well captured by both RANS and LES models.
The wall-clock time and maximum number of
computational cells for RANS simulation are 2 hours
and 150,000 cells respectively. The corresponding
numbers for LES simulation are 20 hours and 2.1
million cells respectively. Both RANS and LES sim-
ulations were performed on 16 processors. Clearly,
the increase in computational cost is significant for
LES simulations. However, it should be noted that
the main reason for this increase is the enhanced
resolution of the flow field with 0.125 mm grid sizes
using LES.
Further validation is performed against instanta-
neous contours of fuel distribution data for n-heptane
fuel at an ambient temperature of 1000K [23,24]. The
instantaneous experimental images obtained using
Rayleigh scattering imaging are shown on the left
along with the time ASI and the axial length scale (cf.
Figs. 3 and 4). The field of view is 40 mm x 20 mm
in the axial and transverse directions respectively.
Note that the experimental contours pertain to a ratio
between fuel-air number densities (Nf/Na) and fuel-
ambient air mixture temperature. Simulations plot the
fuel mass-fractions and ambient gas temperatures
respectively. Fuel vapor penetration and dispersion
can be clearly seen from the experimental and simu-
lation plots. Both RANS and LES simulations predict
the vapor penetration fairly well. However, marked
differences in the spray structure are clearly observed
between RANS and LES cases. While RANS pre-
dicts smooth, averaged profiles, the LES simulation
is able to capture the instantaneous structure well.
However, the initiation of instabilities on the surface
seems to be occurring further downstream in the case
of LES compared to the experiments. Spray disper-
sion seems to be marginally underpredicted by the
LES model. Early initiation of instabilities results in
an early jet breakup which can enhance the spray and
vapor dispersion as well. The vapor distribution also
seems to be narrower for the LES model between the
axial distances of 15 to 25 mm compared to the
RANS model.
0
2
4
6
8
10
12
0 0.25 0.5 0.75 1 1.25 1.5
Liq
uid
Pe
ne
tra
tio
n (
mm
)
Time ASI (ms)
Sandia Data
RANS
LES(a)
0
10
20
30
40
50
60
0 0.25 0.5 0.75 1 1.25 1.5
Va
po
r P
en
etr
ati
on
(m
m)
Time ASI (ms)
Sandia Data
RANS
LES(b)
6
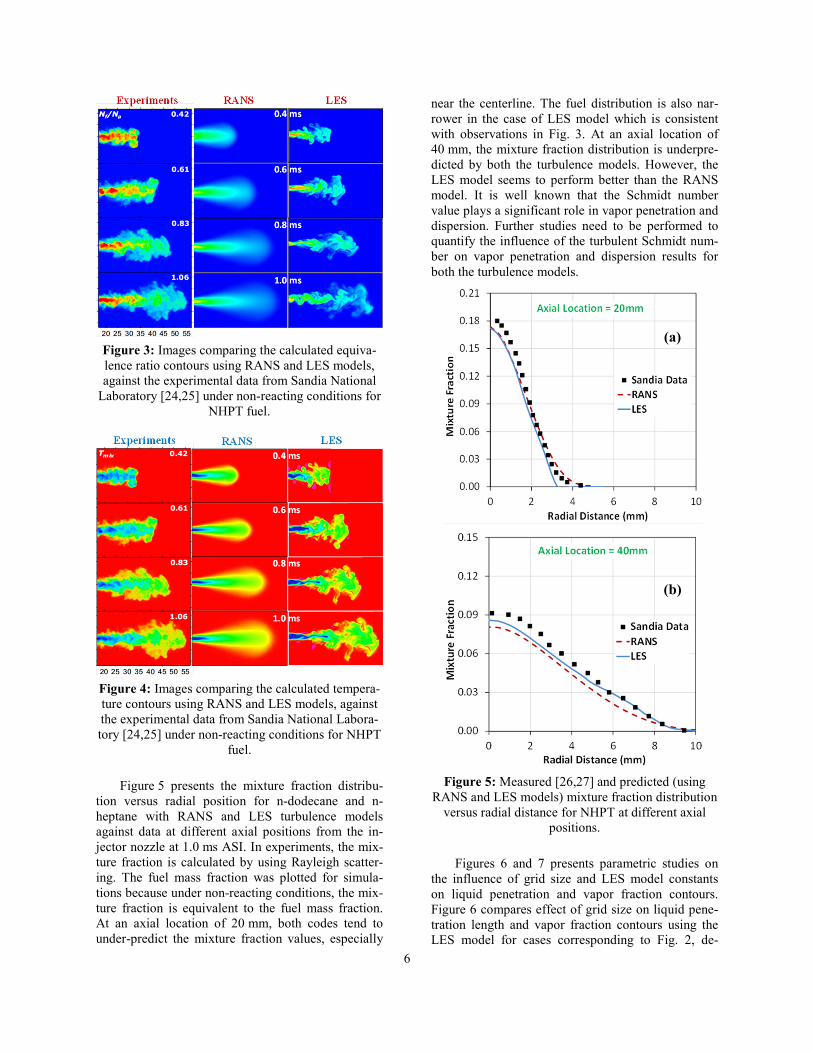
Figure 3: Images comparing the calculated equiva-
lence ratio contours using RANS and LES models,
against the experimental data from Sandia National
Laboratory [24,25] under non-reacting conditions for
NHPT fuel.
Figure 4: Images comparing the calculated tempera-
ture contours using RANS and LES models, against
the experimental data from Sandia National Labora-
tory [24,25] under non-reacting conditions for NHPT
fuel.
Figure 5 presents the mixture fraction distribu-
tion versus radial position for n-dodecane and n-
heptane with RANS and LES turbulence models
against data at different axial positions from the in-
jector nozzle at 1.0 ms ASI. In experiments, the mix-
ture fraction is calculated by using Rayleigh scatter-
ing. The fuel mass fraction was plotted for simula-
tions because under non-reacting conditions, the mix-
ture fraction is equivalent to the fuel mass fraction.
At an axial location of 20 mm, both codes tend to
under-predict the mixture fraction values, especially
near the centerline. The fuel distribution is also nar-
rower in the case of LES model which is consistent
with observations in Fig. 3. At an axial location of
40 mm, the mixture fraction distribution is underpre-
dicted by both the turbulence models. However, the
LES model seems to perform better than the RANS
model. It is well known that the Schmidt number
value plays a significant role in vapor penetration and
dispersion. Further studies need to be performed to
quantify the influence of the turbulent Schmidt num-
ber on vapor penetration and dispersion results for
both the turbulence models.
Figure 5: Measured [26,27] and predicted (using
RANS and LES models) mixture fraction distribution
versus radial distance for NHPT at different axial
positions.
Figures 6 and 7 presents parametric studies on
the influence of grid size and LES model constants
on liquid penetration and vapor fraction contours.
Figure 6 compares effect of grid size on liquid pene-
tration length and vapor fraction contours using the
LES model for cases corresponding to Fig. 2, de-
(a)
(b)
7
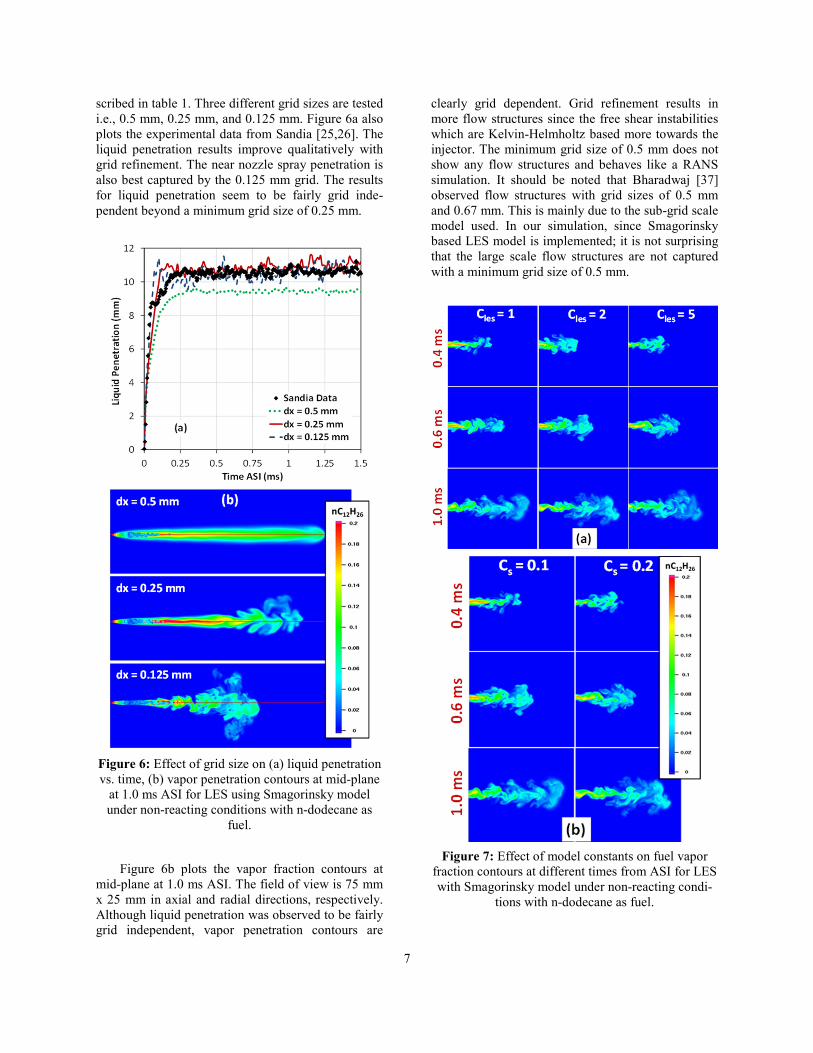
scribed in table 1. Three different grid sizes are tested
i.e., 0.5 mm, 0.25 mm, and 0.125 mm. Figure 6a also
plots the experimental data from Sandia [25,26]. The
liquid penetration results improve qualitatively with
grid refinement. The near nozzle spray penetration is
also best captured by the 0.125 mm grid. The results
for liquid penetration seem to be fairly grid inde-
pendent beyond a minimum grid size of 0.25 mm.
Figure 6: Effect of grid size on (a) liquid penetration
vs. time, (b) vapor penetration contours at mid-plane
at 1.0 ms ASI for LES using Smagorinsky model
under non-reacting conditions with n-dodecane as
fuel.
Figure 6b plots the vapor fraction contours at
mid-plane at 1.0 ms ASI. The field of view is 75 mm
x 25 mm in axial and radial directions, respectively.
Although liquid penetration was observed to be fairly
grid independent, vapor penetration contours are
clearly grid dependent. Grid refinement results in
more flow structures since the free shear instabilities
which are Kelvin-Helmholtz based more towards the
injector. The minimum grid size of 0.5 mm does not
show any flow structures and behaves like a RANS
simulation. It should be noted that Bharadwaj [37]
observed flow structures with grid sizes of 0.5 mm
and 0.67 mm. This is mainly due to the sub-grid scale
model used. In our simulation, since Smagorinsky
based LES model is implemented; it is not surprising
that the large scale flow structures are not captured
with a minimum grid size of 0.5 mm.
Figure 7: Effect of model constants on fuel vapor
fraction contours at different times from ASI for LES
with Smagorinsky model under non-reacting condi-
tions with n-dodecane as fuel.
8
Figure 7 presents the influence of Cs and Cles,
i.e., Smagorinsky based LES model constants on
spray characteristics for cases discussed in the con-
text of Figs. 2 and 6, with a minimum grid size of
0.125 mm. The vapor fraction contours are plotted at
0.4 ms, 0.6 ms, and 1 ms ASI. The field of view is 50
mm x 40 mm in axial and radial directions, respec-
tively. Three different Cles values were tested, i.e., 1,
2, 5; and 2 different Cs values were evaluated i.e.,
0.1, and 0.2. In general, for the range variation in Cs
and Cles, liquid and vapor penetration lengths, liquid
length results did not change appreciably (not plotted
here). Vapor fraction contours also look quite similar
as seen in Fig. 7.
Reacting Simulations
With the qualitative validation under non-
reacting conditions, RANS and LES models are now
compared under reacting conditions for NHPT. The
test conditions simulated are shown in Table 1. Fig-
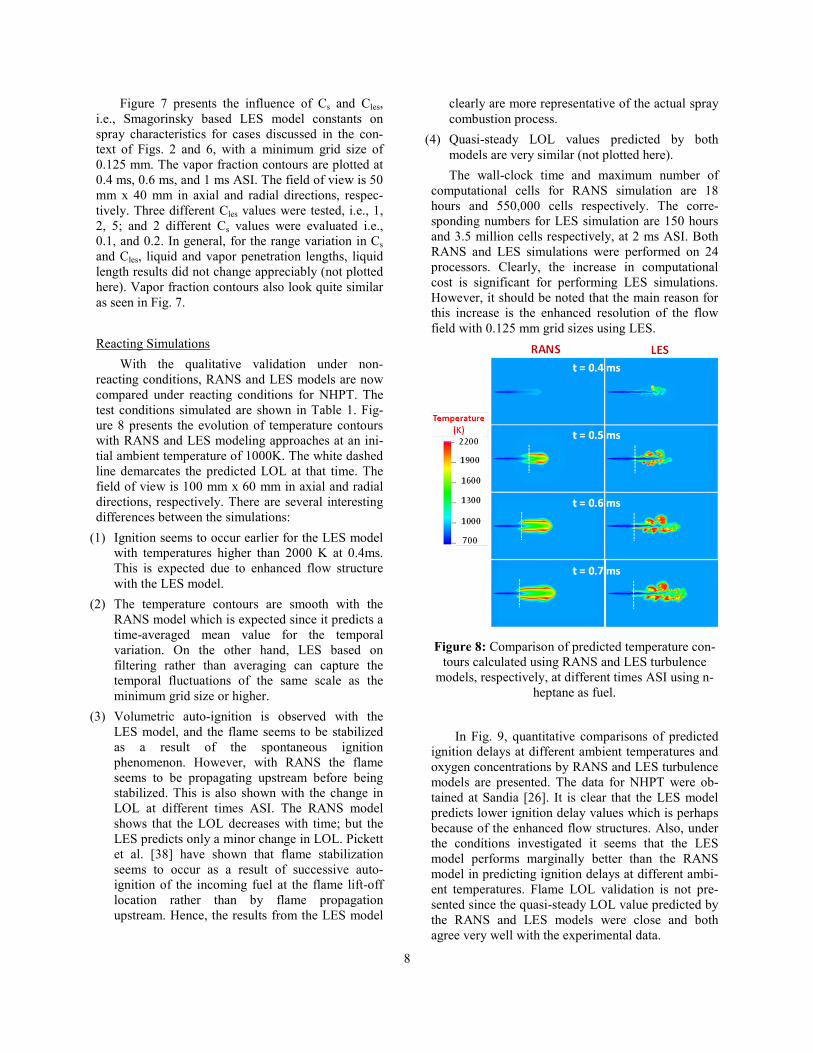
ure 8 presents the evolution of temperature contours
with RANS and LES modeling approaches at an ini-
tial ambient temperature of 1000K. The white dashed
line demarcates the predicted LOL at that time. The
field of view is 100 mm x 60 mm in axial and radial
directions, respectively. There are several interesting
differences between the simulations:
(1) Ignition seems to occur earlier for the LES model
with temperatures higher than 2000 K at 0.4ms.
This is expected due to enhanced flow structure
with the LES model.
(2) The temperature contours are smooth with the
RANS model which is expected since it predicts a
time-averaged mean value for the temporal
variation. On the other hand, LES based on
filtering rather than averaging can capture the
temporal fluctuations of the same scale as the
minimum grid size or higher.
(3) Volumetric auto-ignition is observed with the
LES model, and the flame seems to be stabilized
as a result of the spontaneous ignition
phenomenon. However, with RANS the flame
seems to be propagating upstream before being
stabilized. This is also shown with the change in
LOL at different times ASI. The RANS model
shows that the LOL decreases with time; but the
LES predicts only a minor change in LOL. Pickett
et al. [38] have shown that flame stabilization
seems to occur as a result of successive auto-
ignition of the incoming fuel at the flame lift-off
location rather than by flame propagation
upstream. Hence, the results from the LES model
clearly are more representative of the actual spray
combustion process.
(4) Quasi-steady LOL values predicted by both
models are very similar (not plotted here).
The wall-clock time and maximum number of
computational cells for RANS simulation are 18
hours and 550,000 cells respectively. The corre-
sponding numbers for LES simulation are 150 hours
and 3.5 million cells respectively, at 2 ms ASI. Both
RANS and LES simulations were performed on 24
processors. Clearly, the increase in computational
cost is significant for performing LES simulations.
However, it should be noted that the main reason for
this increase is the enhanced resolution of the flow
field with 0.125 mm grid sizes using LES.
Figure 8: Comparison of predicted temperature con-
tours calculated using RANS and LES turbulence
models, respectively, at different times ASI using n-
heptane as fuel.
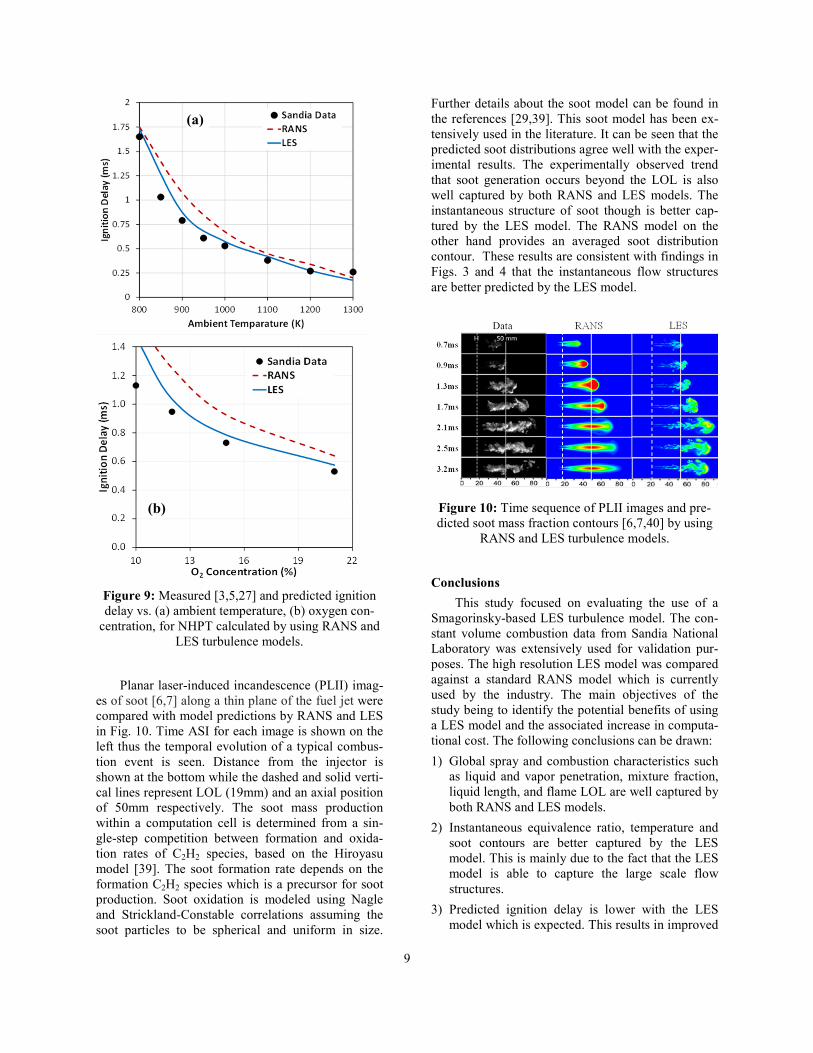
In Fig. 9, quantitative comparisons of predicted
ignition delays at different ambient temperatures and
oxygen concentrations by RANS and LES turbulence
models are presented. The data for NHPT were ob-
tained at Sandia [26]. It is clear that the LES model
predicts lower ignition delay values which is perhaps
because of the enhanced flow structures. Also, under
the conditions investigated it seems that the LES
model performs marginally better than the RANS
model in predicting ignition delays at different ambi-
ent temperatures. Flame LOL validation is not pre-
sented since the quasi-steady LOL value predicted by
the RANS and LES models were close and both
agree very well with the experimental data.
9
Figure 9: Measured [3,5,27] and predicted ignition
delay vs. (a) ambient temperature, (b) oxygen con-
centration, for NHPT calculated by using RANS and
LES turbulence models.
Planar laser-induced incandescence (PLII) imag-
es of soot [6,7] along a thin plane of the fuel jet were
compared with model predictions by RANS and LES
in Fig. 10. Time ASI for each image is shown on the
left thus the temporal evolution of a typical combus-
tion event is seen. Distance from the injector is
shown at the bottom while the dashed and solid verti-
cal lines represent LOL (19mm) and an axial position
of 50mm respectively. The soot mass production
within a computation cell is determined from a sin-
gle-step competition between formation and oxida-
tion rates of C2H2 species, based on the Hiroyasu
model [39]. The soot formation rate depends on the
formation C2H2 species which is a precursor for soot
production. Soot oxidation is modeled using Nagle
and Strickland-Constable correlations assuming the
soot particles to be spherical and uniform in size.
Further details about the soot model can be found in
the references [29,39]. This soot model has been ex-
tensively used in the literature. It can be seen that the
predicted soot distributions agree well with the exper-
imental results. The experimentally observed trend
that soot generation occurs beyond the LOL is also
well captured by both RANS and LES models. The
instantaneous structure of soot though is better cap-
tured by the LES model. The RANS model on the
other hand provides an averaged soot distribution
contour. These results are consistent with findings in
Figs. 3 and 4 that the instantaneous flow structures
are better predicted by the LES model.
Figure 10: Time sequence of PLII images and pre-
dicted soot mass fraction contours [6,7,40] by using
RANS and LES turbulence models.
Conclusions
This study focused on evaluating the use of a
Smagorinsky-based LES turbulence model. The con-
stant volume combustion data from Sandia National
Laboratory was extensively used for validation pur-
poses. The high resolution LES model was compared
against a standard RANS model which is currently
used by the industry. The main objectives of the
study being to identify the potential benefits of using
a LES model and the associated increase in computa-
tional cost. The following conclusions can be drawn:
1) Global spray and combustion characteristics such
as liquid and vapor penetration, mixture fraction,
liquid length, and flame LOL are well captured by
both RANS and LES models.
2) Instantaneous equivalence ratio, temperature and
soot contours are better captured by the LES
model. This is mainly due to the fact that the LES
model is able to capture the large scale flow
structures.
3) Predicted ignition delay is lower with the LES
model which is expected. This results in improved
(b)
(a)
10
agreement with experimental data from Sandia
National Laboratory for NHPT fuel.
4) Under certain conditions investigated the LES
model provides improved qualitative and
quantitative predictions. However these are
associated with a significant increase in
computational cost. This increase is mainly
attributed to the need for higher resolution with a
Smagorinsky based LES model.
5) The grid size has a significant influence on vapor
fraction contours; however, liquid penetration
seems to be fairly grid independent. Other LES
model constants do not influence the spray
characteristics appreciably.
6) The LES model also predicts volumetric auto-
ignition and a fairly stabilized LOL, which is
more realistic under the conditions investigated.
In contrast, the RANS model predicts ignition
kernels moving upstream, which is inconsistent
with the experimental results from Sandia.
ACKNOWLEDGMENTS
The submitted manuscript has been created by
UChicago Argonne, LLC, operator of Argonne Na-
tional Laboratory (Argonne). Argonne, a U.S. De-
partment of Energy Office of Science laboratory, is
operated under Contract No. DE-AC02-06CH11357.
The U.S. Government retains for itself, and others
acting on its behalf, a paid-up, nonexclusive, irrevo-
cable worldwide license in said article to reproduce,
prepare derivative works, distribute copies to the
public, and perform publicly and display publicly, by
or on behalf of the Government.
NOMENCLATURE
Cs Smagorinsky model constant (= 0.1-0.2)
Cles LES Model constant (= 1-5)
Fi Source term due to drag on droplets [Pa]
P Pressure of gas mixture [Pa]
Sij Symmetric stress tensor [m2/s
2]
Tij LES sub-grid scale tensor [m2/s
2]
Vcell Cell volume [m3]
u Gas velocity [m/s]
∆ Filter size [m]
δ Kronecker delta
k Sub-grid turbulent kinetic energy [m2/s
2]
µ Dynamic Viscosity [Pa.s]
ρ Density of the gas mixture [kg/m3]
ABBREVIATION
ASI After start of injection
LES Large eddy simulation
LOL Lift-off length
PLII Planar laser-induced incandescence
RANS Reynolds-averaged Navier-Stokes
REFERENCE
1. Naber, J.D., Siebers, D.L., 1996, “Effects of gas
density and vaporization on penetration and
dispersion of diesel sprays”, SAE Paper No.
960034.
2. Higgins, B.S., Siebers, D.E., 2001,
“Measurement of the Flame Lift-off Location on
DI Diesel Sprays Using OH
Chemiluminescence”, SAE Paper No. 2001-01-
0918.
3. Siebers, D.L., Higgins, B.S., “Flame Lift-off on
Direct-Injection Diesel Sprays under Quiescent
Conditions”, SAE Paper No. 2001-01-0530.
4. Som, S., Aggarwal, S.K., 2010, “Effects of
primary breakup modeling on spray and
combustion characteristics of compression
ignition engines”, Combustion and Flame, Vol.
157, pp.1179-1193.
5. Siebers, D.L., 1998, “Liquid-phase fuel
penetration in diesel sprays”, SAE Paper No.
980809.
6. Pickett, L.M., Siebers, D.L., 2004, “Soot in
diesel fuel jets: effects of ambient temperature,
ambient density, and injection pressure”,
Combustion and Flame, Vol. 138, pp. 114-135.
7. Pickett, L.M., Siebers, D.L., 2002, “An
investigation of diesel soot formation processes
using micro-orifices”, Proceedings of the
Combustion Institute, Vol. 29, pp. 655-662.
8. Faeth, G.M., 1987, “Mixing, transport and com-
bustion in sprays”, Progress in Energy and Com-
bustion Science, Vol. 13 (4), pp. 293-345.
9. Sirignano, W.A., 2005, “Volume averaging for
the analysis of turbulent spray flows”, Interna-
tional Journal of Multiphase flow, Vol. 31 (6),
675-705.
10. Pope, S.B., 2000, “Turbulent Flows”, Cambridge
University Press.
11. Senecal, P.K., Pomraning, E., Richards, K.J.,
2003, “Multi-Dimensional Modeling of Direct-
Injection Diesel Spray Liquid Length and Flame
Lift-off Length using CFD and Parallel Detailed
Chemistry”, SAE Paper No. 2003-01-1043.
12. Kong, S.C., Sun, Y., Reitz, R.D., 2007,
“Modeling Diesel Spray Flame Lift-off, Sooting
Tendency, and NOx Emissions Using Detailed
Chemistry with Phenomenological Soot Model”,
Journal of Gas Turbine and Power, Vol. 129, pp.
245-251.
11
13. Som, S., Ramirez, A.I., Aggarwal, S.K.,
Kastengren, A.L., El-Hannouny, E.M.,
Longman, D.E., Powell, C.F., Senecal, P.K.,
2009, “Development and Validation of a Primary
Breakup Model for Diesel Engine Applications”,
SAE Paper No. 2009-01-0838.
14. Lucchini, T., D’Errico, G.D., Ettore, D., Ferrari,
G., 2009, “Numerical investigation of non-
reacting and reacting diesel sprays in constant-
volume vessels”, SAE Paper No. 2009-01-1971.
15. Azimov, U., Kawahara, N., Tomita, E., Tsuiboi,
K., 2010, “Evaluation of the flame lift-off length
in diesel spray combustion based on flame
extinction”, Journal of Thermal Science and
Technology, Vol. 5 (2), pp. 238-251.
16. Venugopal, R., Abraham, J., 2007, “A numerical
investigation of flame lift-off in diesel jets”,
Combustion science and technology, Vol. 179,
pp. 2599-2618.
17. Karrholm, F.P., Tao, F., Nordin, N., 2008,
“Three-Dimensional Simulation of Diesel Spray
Ignition and Flame Lift-off Using OpenFOAM
and KIVA-3V CFD Codes”, SAE Paper No.
2008-01-0961.
18. Rutland, C.J., 2011, “Large-eddy simulations for
internal combustion engines – a review”, Interna-
tional Journal of Engine Research, Vol. 12 (5),
pp. 421-451.
19. Pomraning, E., 2000, “Development of large
eddy simulation turbulence models”, Ph.D. the-
sis, University of Wisconsin - Madison.
20. Pomraning, E., Rutland, C.J., 2002, “Dynamic
one-equation non viscosity large-eddy simulation
model”, AIAA Journal, 40(4), pp. 689-701.
21. Banerjee, S., Liang, T., Rutland, C., Hu, B.,
2010, “Validation of an LES multi model com-
bustion model for diesel combustion”, SAE
Paper No. 2010-01-0361.
22. Smagorinsky, J., 1963, “General circulation ex-
periments with the primitive equations”, Month-
ly Weather Review.
23. Idicheria, C.A., Pickett, L.M., 2007, “Effect of
EGR on diesel premixed-burn equivalence
ratio”, Proceedings of the Combustion Institute,
Vol. 31, pp. 2931-2938.
24. Idicheria, C.A., Pickett, L.M., 2007,
“Quantitative mixing measurements in a
vaporizing diesel spray by Rayleigh imaging”,
SAE Paper No. 2007-01-0647.
25. Pickett, L.M., Manin, J., Genzale, C.L., Siebers,
D.L., Musculus, M.P.B., Idicheria, C.A., 2011,
“Relationship between diesel fuel spray vapor
penetration/dispersion and local fuel mixture
fraction”, SAE Paper No. 2011-01-0686.
26. http://www.sandia.gov/ecn/
27. Senecal, P.K., Richards, K.J., Pomraning, E.,
Yang, T., Dai, M.Z., McDavid, R.M., Patterson,
M.A., Hou, S., Sethaji, T., 2007, “A new parallel
cut-cell Cartesian CFD code for rapid grid
generation applied to in-cylinder diesel engine
simulations”, SAE Paper No. 2007-01-0159.
28. Richards, K.J., Senecal, P.K., Pomraning, E.,
2008, CONVERGETM
(Version 1.2) Manual,
Convergent Science, Inc., Middleton, WI.
29. Som, S., 2009, “Development and Validation of
Spray Models for Investigating Diesel Engine
Combustion and Emissions;” PhD thesis,
University of Illinois at Chicago.
30. Reitz, R.D., 1987, “Modeling Atomization Pro-
cesses in High Pressure Vaporizing Sprays”, At-
omization and Spray Technology, Vol. 3, pp.
309-337.
31. Patterson, M.A., Reitz, R.D., 1998, “Modeling
the Effects of Fuel Spray Characteristics on Die-
sel Engine Combustion and Emissions”, SAE
Paper No. 980131.
32. Schmidt, D.P., Rutland, C.J., 2000, “A New
Droplet Collision Algorithm”, Journal of
Computational Physics, Vol. 164, pp. 62-80.
33. Post, S.L., Abraham, J., 2002, “Modeling the
outcome of drop-drop collisions in diesel
sprays”, International Journal of Multiphase
Flow, Vol. 28, pp. 997-1019.
34. Lu, T. F., Law, C.K., Yoo, C.S., Chen J.H.,
2009, "Dynamic Stiffness Removal for Direct
Numerical Simulations", Combustion and Flame,
Vol. 156 (8), pp.1542-1551.
35. Haworth, D.C., 2010, “Progress in probability
density function methods for turbulent reacting
flows”, Progress in Energy and Combustion Sci-
ence, Vol. 36, pp. 168-259.
36. S. Bhattacharjee, J. Jaishree, V. Raj Mohan, H.
Zhang, Haworth, D.C., 2011, “PDF-based simu-
lations of turbulent spray combustion in a con-
stant-volume chamber”, Eastern States Section
of the Combustion Institute, University of Con-
necticutm Storrs, October 2011.
37. Bharadwaj, N., 2010, “Large eddy simulation
turbulence modeling of spray flows”. Ph.D. the-
sis, University of Wisconsin-Madison.
38. Pickett, L.M., Kook, S., Persson, H., Andersson,
O., 2009, “Diesel fuel jet lift-off stabilization in
the presence of laser-induced plasma ignition”,
Proceedings of the Combustion Institute, Vol.
32, pp. 2793-2800.
39. Heywood, J.B., 1998, “Internal Combustion
Engine Fundamentals”. McGraw-Hill, Inc.