Embed Size (px)
Citation preview
COMPARISON OF SATELLITE EQUIPMENT RESPONSES INDUCED BY ACOUSTICAND RANDOM VIBRATION TESTS
Bertrand BREVART1, Alice PRADINES2
1. ALCATEL SPACE26, avenue J.-F. Champollion
B.P. 118731037 Toulouse Cedex 1
FRANCETél : 33 (0)5.34.35.36.37, Fax : 33 (0)5.34.35.62.40
e-mail : [email protected]
2. Centre National d’Etudes Spatiales18, avenue Edouard Belin31401 Toulouse Cedex 4
Tél : 05 61 28 29 06, Fax : 05 61 27 33 14e-mail : [email protected]
ABSTRACT: Specifications for random vibration tests of telecommunication satelliteequipment are derived from accelerations measured during satellite acoustic tests at systemlevel. They are expressed in terms of acceleration PSD (in g2/Hz), from 20 to 2000 Hz, at theinterface, in each direction of excitation. The associated vibration tests are thus “naturally”performed by means of on an electrodynamic shaker.However, in many ways random vibration tests at unit level are not much representative of themechanical stress occurring during acoustics at system level. First, standard specificationlevels for a given satellite panel are derived from the PSD envelope of various measurementson the panel. The reason is, the equipment must be qualified whatever the payloadarchitecture on the panel. Then, simplification of the PSD envelope cutout and possible safetyfactors yield an overall RMS vibration level of the specification that exceeds by far all RMSaccelerations measured during acoustics. In addition, the base acceleration during randomvibrations is applied on each axis separately, with all interface points in phase and hardmounted boundary conditions. During acoustics, the equipment is excited in all directionssimultaneously, it is fully coupled to the lightweight supporting structure and in phase I/Facceleration is a matter of low frequency exception. Moreover, as some equipment boxes getlarger, they may be excited by direct acoustic waves whereas random vibration specificationsdo not address such a behaviour. Finally, the acoustic field is excited by a true white noise ineach octave frequency band, i.e. peak values may reach 5 times the RMS acceleration,whereas peak random vibrations are limited to 3σ.As a result of the listed differences between random vibrations and satellite acoustics at unitlevel, vibration overtesting on H/W is current and significant. Specific tests with acomprehensive instrumentation have been conducted in order to identify and quantify theovertesting on an antenna feed and a digital equipment with racked vertical PCBs. Thisinvestigation shows that random vibrations are at least 3 times more severe than the acoustictest they are derived from, both for robustness (internal responses as well as I/F forces) andfatigue of the equipment.

1 INTRODUCTION
Various approaches1 may be followed to specify random vibration tests for satellite payload orservice module units, in order to cover the acoustic test stresses at system level. The objective is toprovide a simple specification that is representative of the real environment. But today, manyauthors agree to state that simplicity has come too far, to the detriment of representativeness,yielding recurrent and significant overtesting on H/W. Among them, Sharton2 has established aglobal approach to limit interface forces during random vibrations. It consists in real time notchingof the global interface force measured with PZT cells whose outputs are summed. He proposesdifferent methods to derive realistic force specifications. Ceresetti3,4 has recently dealt with theproblem and proposed a corrective approach that uses the RMS response of the equipment as acriteria for off-line notching. To reach the objective, he has investigated Limit Load Factor Curves.
Before other corrective actions can be proposed, the objective of the present investigation is tofurther detail and quantify all the aspects of the random vibration problem. To do so, specificacoustic and random vibration tests have been conducted on payload H/W.
2 ACOUSTIC TEST BENCH
FIG. 1. Acoustic test bench
A supporting structure (Fig. 1) has been designed to be dynamically representative of N/Ssatellite panels. It is made of a honeycomb panel (1x1 m2) as can be found on SPACEBUS satellitefamily. It is bounded by four small lateral panels of the same consistency, whose height has beencalculated to achieve around 10g (RMS) accelerations in plane during the acoustic test. The panelsare fixed together and supported in the corners by an aluminum truss structure fixed on a thick
Y X
Z

interface plate. The investigated units, i.e. an antenna feed and a digital equipment made of rackedvertical PCBs (Fig. 2), are fixed to inserts in the main panel. The stiffness of the truss structure hasbeen adjusted for the test bench to have lateral modes around 20 Hz.
FIG. 2. Test units (antenna feed and digital equipment)
In the z-direction, the loaded structure has a first resonant frequency at 58 Hz. The associated modeshape, obtained by experimental modal analysis, is illustrated Fig. 3. First frequencies and modeshapes of the test structure are representative of a satellite panel (N/S) behaviour.
FIG. 3. Experimental mode shape of the test structure (first mode in Z direction)
3 UNIT SPECIFICATIONS OF RANDOM VIBRATIONS
The test bench described in chapter 2 was submitted to Ariane 5 acoustic levels, as indicatedin Table 1. On the panel interfacing the units, 13 accelerometers (2 in each of the X and Ydirections, 9 in Z direction) measured the induced vibrations around the units.
At this point, it should be noted that the acoustic field is excited by a true white noise in eachoctave frequency band. Over 2 minutes test duration, it resulted in peak values that reached 5 timesthe RMS acceleration (5σ) on the histogram of the measurements.
The specifications have been derived from the PSD envelope of all the measurements in eachdirection. In order to be reproduced on electrodynamic shakers, the envelope cutout has then beensimplified, locally allowing 3 dB passing over the whole frequency band. The cutout was refineduntil the ratio between the specification and the envelope was well below 2. Figure 4 shows the PSDenvelope of the measurements in each direction and the resulting specification.

OCTAVE BANDCENTER FREQUENCY (Hz)
LEVEL(dB)
TEST TOLERANCE(dB)
31.5 132.0 -2, +463 134.0 -1, +3
125 139.0 -1, +3250 143.0 -1, +3500 138.0 -1, +3
1000 132.0 -1, +32000 128.0 -1, +3
OVERALL LEVEL 146 -1, +3
TEST DURATION 2 minutes
(ref : 2 x 10⁻⁵ Pa)TABLE 1. Acoustic levels (qualification AR5)
Parallel to the mounting plane(X)
Range (Hz) PSD Level20 – 100100 –200200 – 250250 – 350350 – 450450 – 500
500 – 2000
+ 6 dB/oct0.1 g²/Hz
0.35 g²/Hz-38 dB/oct0.005 g²/Hz
+65.5 dB/oct0.05 g²/Hz
Global : 10.7g RMS
Parallel to the mating plane(Y)
Range (Hz) PSD Level20 – 5050 – 6060 – 70
70 – 100100 –150150 – 200200 – 250250 – 270270 – 310310 – 330330 – 420420 – 450
450 – 2000
+ 9.8 dB/oct0.02 g²/Hz- 58 dB/oct0.001 g²/Hz+44 dB/oct0.4 g²/Hz0.01 g²/Hz+90 dB/oct0.1 g²/Hz
-143.7 dB/oct0.005 g²/Hz+100 dB/oct0.05 g²/Hz
Global : 10.4 g RMS
Perpendicular to the mating plane(Z)
Range (Hz) PSD Level20 – 5050 – 6060 – 7070 – 100100 – 120120 - 150150 – 330330 – 350350 – 400400 – 450450 – 550550 – 600600 - 800
800 – 2000
+ 24 dB/oct1.5 g²/Hz
- 76 dB/oct0.03 g²/Hz+69 dB/oct
2 g²/Hz1 g²/Hz
-117 dB/oct0.1 g²/Hz
+63 dB/oct1.2 g²/Hz
-38 dB/oct0.4 g²/Hz-3 dB/oct
Global : 29 g RMS
FIG. 4. Random vibration specifications (X, Y, Z axes)

Table 2 summarizes the RMS levels of both envelope and specification, and indicates the ratiobetween the two. Fig. 5 shows the PSD envelope of the measurements on the test bench in the z-direction w.r.t. a measurement on STENTOR N/S wall. They are similar up to 400 Hz, accouting forthe difference in frequency resolution (8 Hz and 1 Hz) that brings out the 58 Hz resonance on thetest bench. Above 400 Hz, the test bench yields higher accelerations. Specifications in plane are alsorepresentative, reaching 10 g RMS with a PSD below 0.1g2/Hz over a large frequency band.
Axe Enveloppe(gRMS)
Spécification(gRMS)
RatioSpec./Envelop.
X 7.02 10.7 1.52Y 7.4 10.4 1.41Z 22 29 1.32
TABLE 2. Global levels of the specifications w.r.t. the envelopes
FIG. 5. Envelope on test bench versus STENTOR measurements (Z axis)
The above defined levels of random vibrations have been applied to the two units as usual, bymeans of an electrodynamic shaker, on each axis separately, with a rigid interface.
4 ACOUSTICS VERSUS RANDOM VIBRATIONS
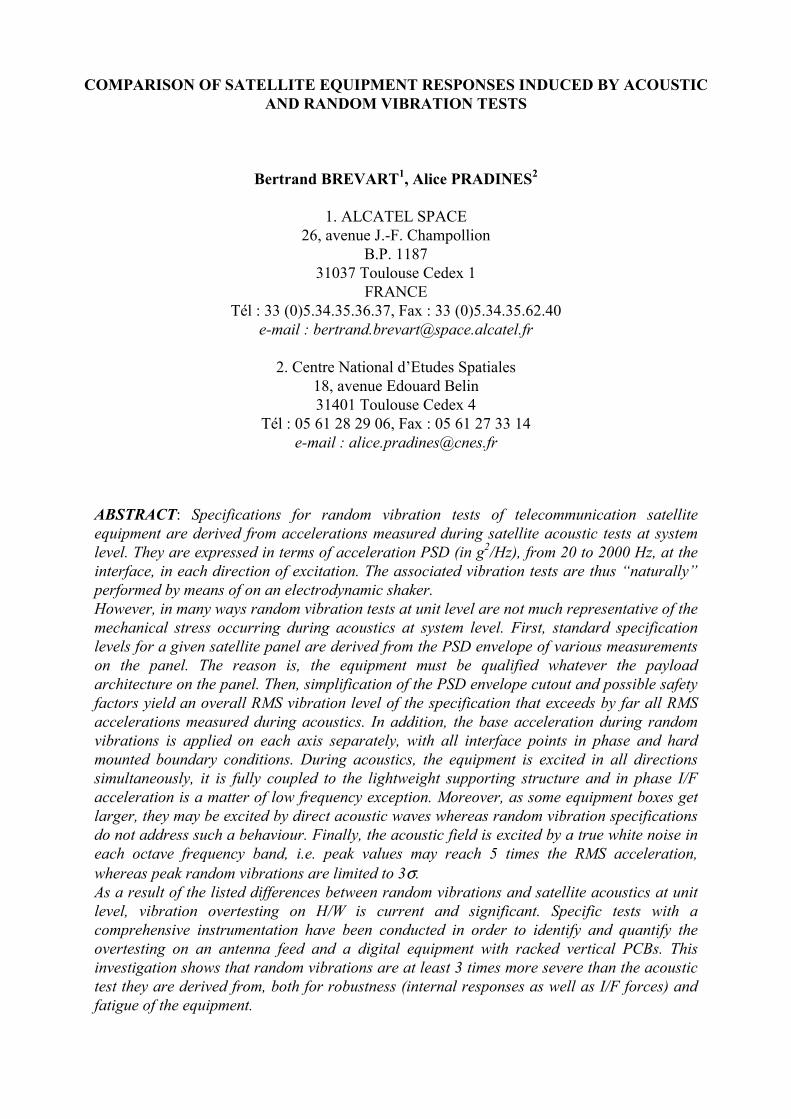
4.1 Results on antenna feedThe response of the antenna feed has been monitored by the same set of sensors during
acoustics and random vibrations, i.e. 7 accelerometers and 8 tri-axial force cells, at locationsindicated on Figure 6. The results are first summarised in table 3, in terms of max. PSD and RMSlevels (the worst of the 3 random vibration axes is given). The ratio between max. PSD is given indB and the ratio between RMS levels is given as is and corrected by the ratios in Table 3. It appearsthat all PSD ratios are positive and that all RMS corrected ratios are above 1. This means that evenif a specification was perfectly cut out, i.e. as close as possible to the envelope of the measurementson the panel during acoustics, it would induce larger responses of the test unit (accelerations andinterface forces) during random vibrations.Figure 7 shows the PSD of the acceleration at location 13Y measured during the acoustic test on onehand, and the envelope of the 3 accelerations measured during random vibrations (X, Y, Z)corrected at each frequency by the difference between the specification and the envelope of themeasurements on the panel. Note that the PSD of a measurement after this correction is the response
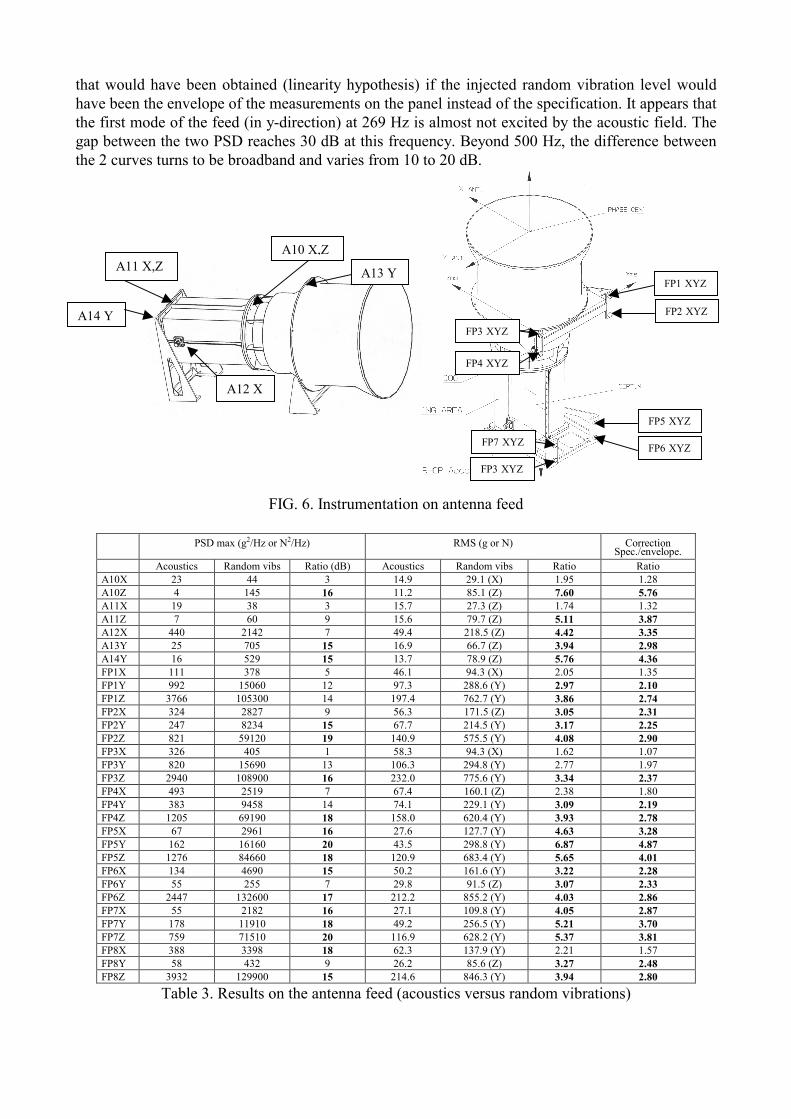
that would have been obtained (linearity hypothesis) if the injected random vibration level wouldhave been the envelope of the measurements on the panel instead of the specification. It appears thatthe first mode of the feed (in y-direction) at 269 Hz is almost not excited by the acoustic field. Thegap between the two PSD reaches 30 dB at this frequency. Beyond 500 Hz, the difference betweenthe 2 curves turns to be broadband and varies from 10 to 20 dB.
PSD max (g2/Hz o
Acoustics Random vibA10X 23 44A10Z 4 145A11X 19 38A11Z 7 60A12X 440 2142A13Y 25 705A14Y 16 529FP1X 111 378FP1Y 992 15060FP1Z 3766 105300FP2X 324 2827FP2Y 247 8234FP2Z 821 59120FP3X 326 405FP3Y 820 15690FP3Z 2940 108900FP4X 493 2519FP4Y 383 9458FP4Z 1205 69190FP5X 67 2961FP5Y 162 16160FP5Z 1276 84660FP6X 134 4690FP6Y 55 255FP6Z 2447 132600FP7X 55 2182FP7Y 178 11910FP7Z 759 71510FP8X 388 3398FP8Y 58 432FP8Z 3932 129900
Table 3. Results o
Z
A12 X
A11 X,Z
F
A10 X,
r N2/Hz)
s Ratio (dB)316397
15155
12149
15191
13167
1418162018157
17161820189
15
n the antenn
IG. 6. Instru
A13 Y
FP1 XYZFP2 XYZ
A14 YRMS (g or N) Correction
Acoustics Random vibs Ratio Ratio14.9 29.1 (X) 1.95 1.2811.2 85.1 (Z) 7.60 5.7615.7 27.3 (Z) 1.74 1.3215.6 79.7 (Z) 5.11 3.8749.4 218.5 (Z) 4.42 3.3516.9 66.7 (Z) 3.94 2.9813.7 78.9 (Z) 5.76 4.3646.1 94.3 (X) 2.05 1.3597.3 288.6 (Y) 2.97 2.10
197.4 762.7 (Y) 3.86 2.7456.3 171.5 (Z) 3.05 2.3167.7 214.5 (Y) 3.17 2.25
140.9 575.5 (Y) 4.08 2.9058.3 94.3 (X) 1.62 1.07
106.3 294.8 (Y) 2.77 1.97232.0 775.6 (Y) 3.34 2.3767.4 160.1 (Z) 2.38 1.8074.1 229.1 (Y) 3.09 2.19
158.0 620.4 (Y) 3.93 2.7827.6 127.7 (Y) 4.63 3.2843.5 298.8 (Y) 6.87 4.87
120.9 683.4 (Y) 5.65 4.0150.2 161.6 (Y) 3.22 2.2829.8 91.5 (Z) 3.07 2.33
212.2 855.2 (Y) 4.03 2.8627.1 109.8 (Y) 4.05 2.8749.2 256.5 (Y) 5.21 3.70
116.9 628.2 (Y) 5.37 3.8162.3 137.9 (Y) 2.21 1.5726.2 85.6 (Z) 3.27 2.48
214.6 846.3 (Y) 3.94 2.80
a feed (acoustics versus random vibrations)
FP5 XYZ
FP6 XYZ
FP3 XYZ
FP4 XYZ
FP7 XYZ
FP3 XYZ
mentation on antenna feed
Spec./envelope.

FIG. 7. PSD of the accelerations at point 13Y; acoustics (red) versus envelope of random vibrations(blue) (injected level corrected axis by axis)
Figure 8 shows the results at point 10 in X and Z directions. Once again, it appears that the firstmode of the feed in each direction, at 377 Hz and 645 Hz respectively, is not excited by the acousticfield, resulting in 30 dB difference at these frequencies.This phenomenon can be similarly noticed on the interface forces. For example, figure 9 shows theresults at FP8Z. More than 20 dB difference appears at each of the resonant frequencies and the gapturns to be broadband, varying from 10 to 30 dB, above 1000 Hz.Regarding RMS ratios in Table 3, after correction the order of magnitude varies from 3 to 4 on largevalue measurements.
FIG. 8. PSD of the accelerations at point 10 (X, Z); acoustics versus envelope of random vibrations(injected level corrected axis by axis)
FIG. 9. PSD of the force at point FP8Z; acoustics versus envelope of random vibrations(injected level corrected axis by axis)

4.2 Results on digital equipmentThe response of the digital equipment has been monitored by the same set of sensors duringacoustics and random vibrations, i.e. 11 accelerometers among which 5 were on a printed circuitboard. Sensor locations are indicated on Fig. 10. The results are summarised in Table 4.
Mesure
A15XA15YA15ZA16XA17YA18ZA19XA20XA21XA22XA23XA24Z
T
It appears thawas located oeven if a spemeasurementsboard in parti
Z Z
A15 X,Y,FIG
PSD max (
Acoustics Random3.12 43.77.60 4.512.40 2.22238 1642.24 2.152.13 7.760.69 11.40.15 8.550.80 40.62.15 64.21.43 66.52.07 9.46
able 4. Results on
t all RMS ratios an the flange of thcification was p on the panel dur
cular, during rand
A24
. 10.
g2/Hz)
vibs
dig
fter e unerfecing aom v
A16 X
A17 YInstrumentation on digital equipment
RMS (g)
Ratio (dB) Acoustics Random vibs12 7.4 34.3 (X)-2 6.4 23.7 (Y)0 6.7 31.8 (Z)-2 64.8 73.1 (X)0 4.3 18.6 (Y)6 5.2 51.6 (Z)
12 7.0 26.8 (Z)18 5.0 28.0 (Z)15 8.7 41.8 (X)15 9.1 51.1 (X)17 9.0 44.3 (X)7 5.1 55.9 (Z)
ital equipment (acoustics versus rando
correction are above 2.6 except at poinit that is directly sensitive to the acoutly cut out, i.e. as close as possiblcoustics, it would induce larger responibrations.
A18 Z
CorrectionSpec./envelope
Ratio Ratio4.63 3.053.70 2.634.75 3.601.13 0.744.33 3.079.92 7.523.83 2.905.60 4.244.80 3.165.62 3.694.92 3.2411.0 8.3
m vibrations)
t 16X. This accelerometerstic field. This means thate to the envelope of theses of the test unit, of the

The ratios are particularly high in the plane of the boards (A18Z and A24Z), yielding critical levels(above 50g RMS), during random vibrations. To reach such RMS ratios, it appears on Fig. 11 thatthe gap between the acceleration PSD measured in acoustics and the envelope of the 3 axes ofrandom vibrations (after correction for the injected level) is broadband beyond 400 Hz., varyingfrom 20 to 30 dB. Since the equipment is much stiffer than the honeycomb panel, structuralvibrations of the panel induced by the acoustic field can not be transmitted to the equipment. Theopposite behaviour occurs with a rigid interface since vibrations can only be transmitted to theequipment.
FIG. 11. PSD of the accelerations at point 24Z; acoustics versus envelope of random vibrations(injected level corrected axis by axis)
On the printed circuit board, corrected RMS ratios are all above 2.9. In terms of PSD, as illustratedby Fig. 12, it appears that the gap is important at the resonant frequency of the board, around 240Hz, varying from 14 dB on the edge of the board to 28 dB in the middle. Beyond 700 Hz, 10 to 20dB difference broadband is noticed.
FIG. 12. PSD of the accelerations at point 20X; acoustics versus envelope of random vibrations(injected level corrected axis by axis)
5 FURTHER EXPLANATIONS ON THE OVERTESTING NATURE
Of interest is the phase between the 9 accelerations measured during the acoustic test. Thus, thetransfer functions between all the accelerations and A1Z have been calculated using Hn estimator.The coherence between these data is shown on Fig. 12. Two frequency band can be distinguished.Afirst one, below 300 Hz, where the coherence functions are relatively high (> 0.5); this is thestructural zone where the vibrations at one point influence the vibrations at another point throughthe modes of the supporting panel. In the second frequency band, beyond 300 Hz, the coherencefunctions are low or very low; this is the acoustic zone where the vibrations at one point are largely

due to the surrounding acoustic field that is diffuse, and thus not coherent. Fig. 12 also shows thetransfer functions in the coherent zone. It appears that the 9 accelerations are only in phase between35 and 80 Hz, i.e. around the first mode of the panel. Therefore, in phase accelerations at theinterface points of a unit is a matter of exception during the acoustic test.
FIG. 12. Coherence and transfer functions between Z accelerations on the panel and A1Z
A 3D experimental modal analysis of the test bench has been performed up to 500 Hz. It first showsthat among the 17 modes analysed, only 4 do not deform the supporting panel. All the others arecoupled, with or without deformation of the units. Besides, on the acoustic data, the first rigidinterface mode of the antenna feed, at 269 Hz (Y), does not appear. Instead, the response of the feedin y-direction is dominated by a mode at 197 Hz whose shape is illustrated in Fig. 13. Because ofthe coupling with the panel, the effective amplification of this mode at point 13Y for example, w.r.t.the structure is around 10. During random vibrations, the effective Qeff at 269 Hz is around 70 !The low impedance of the panel yields low effective amplifications.The first mode of the digital unit appearing during the acoustic test is around 220 Hz. The modeshape is illustrated Fig. 13.Even though the frequency is very close to the rigid interface one, theeffective transmissibility of each mode is different. The amplification is only 3 during the acoustictest at point 15X whereas it reaches 15 in random vibrations. On the PCB, this mode does notappear during the acoustic test but the effective amplification at rigid interface is around 17 at point22X for example.
FIG. 13. Mode shapes of test bench at 197 Hz and 221 Hz
6 CONCLUSIONS
We have shown that satellite acoustics and random vibrations largely differ at unit level. First,an envelope of measurements is used to specify the equipment. Then, simplified cutouts raise theRMS level of the specifications, by introducing too much high frequencies in particular. It has

appeared that a ratio of 1.4 between specification and envelope is difficult to achieve. In practice,this ratio is often close to 2.The different nature of the two environments has been discussed. On one side, the equipment iscoupled to a lightweight structure, it is excited in all directions simultaneously by out of phase orincoherent accelerations at the interface points. On the other side, the acceleration is applied on eachaxis separately, with all interface points in phase and hard mounted boundary conditions. Theimpedance mismatch results in a minimum 14 dB overtesting at the unit resonant frequencies. Athigher frequencies, vibration overtesting is broadband, larger than 10 dB. In terms of RMS levels,the ratio is larger than 2.5 even with a specification matching the envelope.Since overtesting is larger than 14 dB at resonance and larger than 3.5 (2.5x1.4) in terms of RMS,even if a 5σ/3σ correction on extreme values is integrated, the investigation shows that randomvibrations are at least 3 times more severe than the acoustic test they are derived from, both forrobustness (internal responses as well as I/F forces) and fatigue of the equipment.
BIBLIOGRAPHY
[1] C. Lalanne 1999 Vibrations et Chocs Mécaniques (tome 5) - Elaboration des Spécifications.Paris : Hermès.
[2] T.D. Scharton 1997 NASA Reference Publication RP-1403. Force Limited Vibration TestingMonograph.
[3] A. Ceresetti, M. Cotterchio and R. Ruotolo 2000 European Conference on SpacecraftStructures, Materials, and Mechanical Testing, Noordwijk, NL, Nov.29–Dec.1, 2000. AComparison of Different Approaches to Determine the Acceleration of Components due to RandomVibration Loads.
[4] A. Ceresetti 2000 European Conference on Spacecraft Structures, Materials, and MechanicalTesting, Noordwijk, NL, Nov.29–Dec.1, 2000. Vibration Overtesting on Space H/W due to ShakerMechanical Impedance.
GENERAL SUMMARY SESSION SUMMARY▲ ▲
▲