Embed Size (px)
Citation preview
McatagpdeHPjHpsnif
cdge
Sa
S
0d
Comparison of Serum Lipid Values in Subjects With and Withoutthe Metabolic Syndrome
Alberto Cordero, PhDa,*, Martín Laclaustra, PhDb, Montserrat León, PhDc,José A. Casasnovas, PhDc, Alberto Grima, PhDd, Emilio Luengo, PhDc, Beatriz Ordoñez, PhDc,
Clara Bergua, PhDc, María Besc, Isaac Pascual, MDc, and Eduardo Alegría, PhD,e on behalf of theMESYAS Registry Investigators
Insulin resistance is supposed to be the basis of metabolic syndrome (MS), although it isdifficult to measure. The ratio of triglyceride (TG) to high-density lipoprotein (HDL) hasbeen proposed as a surrogate marker of insulin resistance in overweight subjects. The aimof the present study was to assess the accuracy of the TG/HDL ratio for the diagnosis ofMS. Data of 18,778 active workers (77.6% men) enrolled in 3 insurance companies in Spainwere collected from their annual health examinations. Mean age was 42.2 � 10.7 years. MSwas assessed according to modified Adult Treatment Panel III criteria. Prevalences of MSwere 18.8% in men and 6.1% in women. Mean value of the TG/HDL ratio was 2.50 � 2.2and increased in parallel to the number of MS components present. Subjects with MS hada ratio that was 2 times higher compared with those without (5.10 vs 2.03, p <0.001).Receiver operating characteristic curves were performed to assess the capability of theTG/HDL ratio to contribute to a diagnosis of MS and 80% sensitivity and 78% specificitywere obtained for values >2.75 in men and >1.65 in women. In conclusion, the TG/HDLratio is a feasible and accurate measurement for assessment of MS in healthy subjects. Wepropose cut-off values of 2.75 for men and 1.65 for women for a diagnosis of MS. © 2008
Elsevier Inc. All rights reserved. (Am J Cardiol 2008;102:424–428)M
T2fcpewaictMteb
Anpgipi
5Ik�
etabolic syndrome (MS) is an independent risk factor forardiovascular disease and mortality.1–4 A diagnosis of MSggregates different combinations of traits that may bringogether subjects with different prognoses,5,6 with the dis-dvantage of arbitrary criteria and threshold selection. Tri-lycerides (TGs) have a wide range of distribution in theopulation without a normal distribution in contrast to high-ensity lipoprotein (HDL). This reasoning prompted us tovaluate an isolated and comprehensive parameter, TG/DL ratio, for its ability to detect other criteria of MS.revious results of the Metabolic Syndrome in Active Sub-
ects (MESYAS) registry have demonstrated that the TG/DL ratio is significantly higher in subjects with near hy-ertension compared with those with normotension7 and inubjects with mild renal dysfunction.8 The aim of this suba-alysis was to describe the distribution of the TG/HDL ration a large population of active workers and test its accuracyor assessment of MS.
aDepartment of Cardiology, Hospital Universitario de San Juan, Ali-ante, bCentro Nacional de Investigaciones Cardiovasculares (CNIC), Ma-rid, cCardiovascular Research Unit, Hospital Clínico Universitario, Zara-oza, dDepartment of Preventive Cardiology, Asepeyo, Valencia, andDepartment of Cardiology, Clinica Universitaria de Navarra, Pamplona,pain. Manuscript received February 4, 2008; manuscript received andccepted March 24, 2008.
Dr. Laclaustra was supported by the Research Program of Instituto dealud “Carlos III,” Formación Sanitaria Especializada, Madrid, Spain.
*Corresponding author: Tel: 34-965-938-730; fax: 34-965-938-652.
�E-mail address: [email protected] (A. Cordero).002-9149/08/$ – see front matter © 2008 Elsevier Inc. All rights reserved. oi:10.1016/j.amjcard.2008.03.079
ethods
he MESYAS study is a nationwide project, launched in003, with the aim of analyzing the prevalence and clinicaleatures of MS in a large working population in Spain. Theomplete design and first results of the registry have beenublished previously.7–9 Briefly, data from annual healthxaminations of workers from 3 different Spanish cohortsere collected: a large department store (n � 1,901, 10%),car factory (n � 5,357, 28.1%), and a national work
nsurance company (n � 11,783, 61.9%). All subjects in-luded were Caucasians. The only exclusion criterion forhis survey was a lack of any of the 5 data needed to assess
S; therefore, a total of 18,778 subjects were included inhe present analysis. The protocol was approved by thethics committee of the Preventive Cardiology and Reha-ilitation Section, Spanish Society of Cardiology.
Data from the 3 cohorts were unified in a single database.nonymity was preserved by the assignation of a workerumber by the medical unit of each company without anyossibility of externally relating this number to demo-raphic or clinical data. Informed consent was not obtainedndividually, but rather for each physician or medical de-artment. Workers and syndicates are aware and annuallynformed about the results and utilization of their data.
Assessment of MS was based on the presence of 3 of itscomponents according to modified Adult Treatment Panel
II (ATP III) guidelines: body mass index (BMI) �28.8g/m2, blood pressure �130/85 mm Hg, serum TG level150 mg/dl, HDL cholesterol levels �40 mg/dl in men and
50 mg/dl in women, and fasting glycemia level �110www.AJConline.org
mwcsnlmwgwa
dmpaa
daAmospccpsS
R
A
Ft
TG
V
ABSDGHTTLTTLT
s
425Preventive Cardiology/Triglyceride-to-HDL and Metabolic Syndrome
g/dl or diabetes mellitus previously diagnosed. Obesityas evaluated using a BMI �28.8 kg/m2, instead of waist
ircumference, a modification previously validated in largetudies.1–4 All analytic samples were obtained after an over-ight fast of �12 hours and were processed in 3 differentaboratories. According to ATP III recommendations,10 nor-
oglycemia was considered when the fasting glucose levelas �110 mg/dl, impaired fasting glucose when the fastinglucose level was 110 to 125 mg/dl, and diabetes mellitushen the fasting glucose level was �126 or �200 mg/dl
fter an oral glucose test.11
SPSS 15.0 (SPSS, Inc., Chicago, Illinois) was used forata processing. Quantitative variables are presented asean � SD. All variables had normal distributions and are
resented as mean � SD, except TGs, which are presenteds median (interquartile range). One-way analysis of vari-
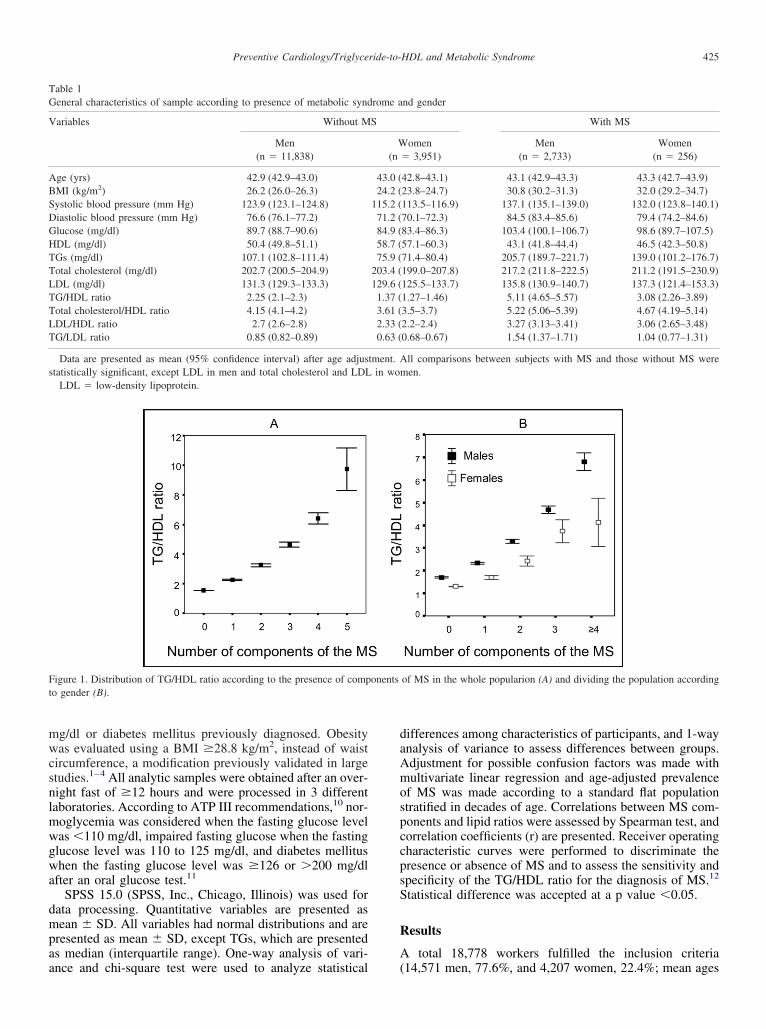
igure 1. Distribution of TG/HDL ratio according to the presence of compo gender (B).
able 1eneral characteristics of sample according to presence of metabolic synd
ariables Without M
Men(n � 11,838)
ge (yrs) 42.9 (42.9–43.0)MI (kg/m2) 26.2 (26.0–26.3)ystolic blood pressure (mm Hg) 123.9 (123.1–124.8)iastolic blood pressure (mm Hg) 76.6 (76.1–77.2)lucose (mg/dl) 89.7 (88.7–90.6)DL (mg/dl) 50.4 (49.8–51.1)Gs (mg/dl) 107.1 (102.8–111.4)otal cholesterol (mg/dl) 202.7 (200.5–204.9)DL (mg/dl) 131.3 (129.3–133.3)G/HDL ratio 2.25 (2.1–2.3)otal cholesterol/HDL ratio 4.15 (4.1–4.2)DL/HDL ratio 2.7 (2.6–2.8)G/LDL ratio 0.85 (0.82–0.89)
Data are presented as mean (95% confidence interval) after age adjustatistically significant, except LDL in men and total cholesterol and LDL
LDL � low-density lipoprotein.
nce and chi-square test were used to analyze statistical (
ifferences among characteristics of participants, and 1-waynalysis of variance to assess differences between groups.djustment for possible confusion factors was made withultivariate linear regression and age-adjusted prevalence
f MS was made according to a standard flat populationtratified in decades of age. Correlations between MS com-onents and lipid ratios were assessed by Spearman test, andorrelation coefficients (r) are presented. Receiver operatingharacteristic curves were performed to discriminate theresence or absence of MS and to assess the sensitivity andpecificity of the TG/HDL ratio for the diagnosis of MS.12
tatistical difference was accepted at a p value �0.05.
esults
total 18,778 workers fulfilled the inclusion criteria
of MS in the whole popularion (A) and dividing the population according
nd gender
With MS
omen Men Women� 3,951) (n � 2,733) (n � 256)
42.8–43.1) 43.1 (42.9–43.3) 43.3 (42.7–43.9)23.8–24.7) 30.8 (30.2–31.3) 32.0 (29.2–34.7)113.5–116.9) 137.1 (135.1–139.0) 132.0 (123.8–140.1)70.1–72.3) 84.5 (83.4–85.6) 79.4 (74.2–84.6)83.4–86.3) 103.4 (100.1–106.7) 98.6 (89.7–107.5)57.1–60.3) 43.1 (41.8–44.4) 46.5 (42.3–50.8)71.4–80.4) 205.7 (189.7–221.7) 139.0 (101.2–176.7)199.0–207.8) 217.2 (211.8–222.5) 211.2 (191.5–230.9)125.5–133.7) 135.8 (130.9–140.7) 137.3 (121.4–153.3)1.27–1.46) 5.11 (4.65–5.57) 3.08 (2.26–3.89)3.5–3.7) 5.22 (5.06–5.39) 4.67 (4.19–5.14)2.2–2.4) 3.27 (3.13–3.41) 3.06 (2.65–3.48)0.68–0.67) 1.54 (1.37–1.71) 1.04 (0.77–1.31)
ll comparisons between subjects with MS and those without MS wereen.
onents
rome a
S
W(n
43.0 (24.2 (
115.2 (71.2 (84.9 (58.7 (75.9 (
203.4 (129.6 (1.37 (3.61 (2.33 (0.63 (
tment. Ain wom
14,571 men, 77.6%, and 4,207 women, 22.4%; mean ages

4r((ce1oclvwGpefa
cs
sr
Fc
of the
TVts
M
W
p
426 The American Journal of Cardiology (www.AJConline.org)
1.1 � 10.8 and 38.6 � 9.9 years for men and women,espectively). Age-adjusted prevalences of MS were 21.1%95% confidence interval 18.8 to 21.4) for men and 11.3%95% confidence interval 11.0 to 11.6) for women. Allriteria of MS were significantly more prevalent in men,xcept low HDL, which was higher in women (34.0% vs8.1%). As expected, subjects with MS were significantlylder and had higher values for BMI, blood pressure, totalholesterol, TGs, and uric acid and lower HDL cholesterolevels compared with subjects without MS (Table 1). Meanalue of the TG/HDL ratio was �2 times higher in subjectsith MS than in those without MS (5.18 vs 2.15, p �0.001).lobally, men had a statistically higher TG/HDL ratio com-ared with women (2.84 � 2.7 vs 1.46 � 0.8). All differ-nces remained significant after adjusting for possible con-ounding variables (age, blood pressure, fasting glucose,nd BMI).
The TG/HDL ratio increased in parallel to the number ofomponents of MS present (Figure 1); because men had
igure 2. Distribution of TG/HDL ratio in men (left) and women (right)onfidence interval.
Figure 3. Receiver operating characteristic curves evaluating the accuracy
tatistically higher values, further analysis was performed y
eparately in men and women. Differences in the TG/HDLatio between subjects with and without MS were larger in
black squares) and without (white squares) MS according to age. CI �
TG/HDL ratio for the diagnosis of MS in men (left) and women (right).
able 2alues obtained in receiver operating characteristic curves for accuracy of
riglyceride/high-density lipoprotein ratio in the diagnosis of metabolicyndrome
Value Sensitivity Specificity PPV NPV GPV
enRejecting �1.5 94% 40% 30% 96% 51%Accepting �5.0 37% 95% 66% 85% 83%Eclectic �2.75 78% 77% 48% 93% 77%omen
Rejecting �1.0 95% 45% 18% 99% 51%Accepting �2.5 56% 94% 54% 94% 90%Eclectic �1.65 80% 79% 33% 97% 79%
GPV � global predictive value; NPV � negative predictive value; PPV �ositive predictive value.
with (
oung and middle-aged men (Figure 2). Distribution of the
TtoHfitasedw
TprrtHtii�mra
wc1mqs
km
D
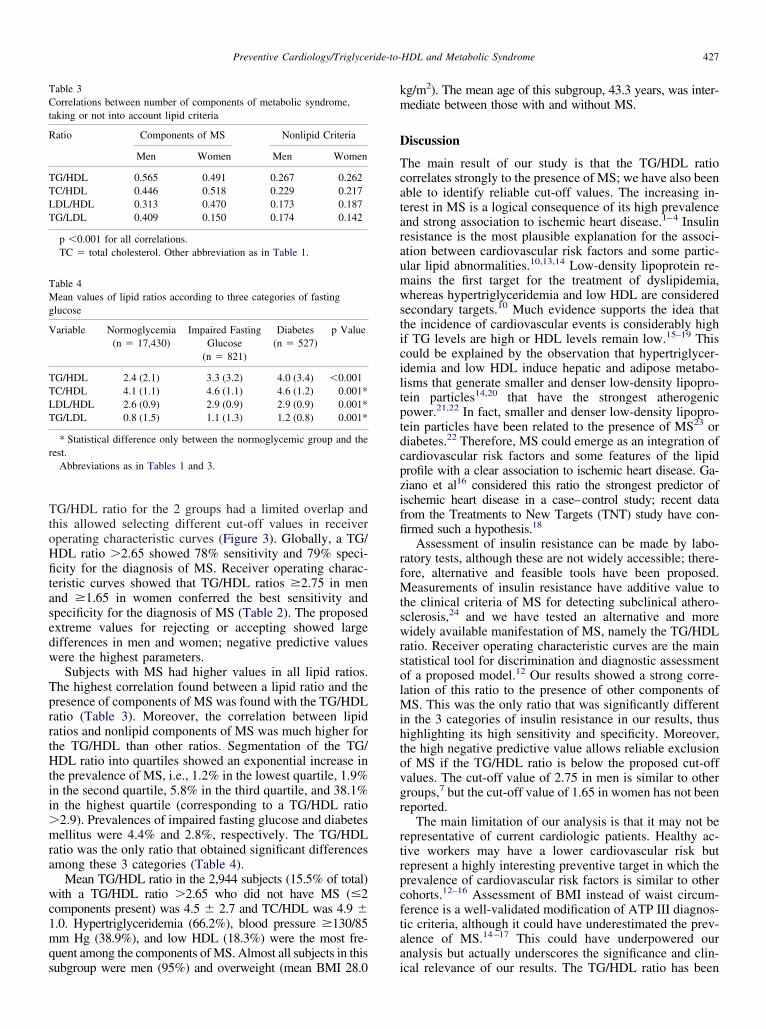
Tcataraumwsticiltptdcpziffi
rfMtswrsolMihtovgr
rtrpcftaa
TCt
R
TTLT
TMg
V
TTLT
r
427Preventive Cardiology/Triglyceride-to-HDL and Metabolic Syndrome
G/HDL ratio for the 2 groups had a limited overlap andhis allowed selecting different cut-off values in receiverperating characteristic curves (Figure 3). Globally, a TG/DL ratio �2.65 showed 78% sensitivity and 79% speci-city for the diagnosis of MS. Receiver operating charac-
eristic curves showed that TG/HDL ratios �2.75 in mennd �1.65 in women conferred the best sensitivity andpecificity for the diagnosis of MS (Table 2). The proposedxtreme values for rejecting or accepting showed largeifferences in men and women; negative predictive valuesere the highest parameters.Subjects with MS had higher values in all lipid ratios.
he highest correlation found between a lipid ratio and theresence of components of MS was found with the TG/HDLatio (Table 3). Moreover, the correlation between lipidatios and nonlipid components of MS was much higher forhe TG/HDL than other ratios. Segmentation of the TG/DL ratio into quartiles showed an exponential increase in
he prevalence of MS, i.e., 1.2% in the lowest quartile, 1.9%n the second quartile, 5.8% in the third quartile, and 38.1%n the highest quartile (corresponding to a TG/HDL ratio
2.9). Prevalences of impaired fasting glucose and diabetesellitus were 4.4% and 2.8%, respectively. The TG/HDL
atio was the only ratio that obtained significant differencesmong these 3 categories (Table 4).
Mean TG/HDL ratio in the 2,944 subjects (15.5% of total)ith a TG/HDL ratio �2.65 who did not have MS (�2
omponents present) was 4.5 � 2.7 and TC/HDL was 4.9 �.0. Hypertriglyceridemia (66.2%), blood pressure �130/85m Hg (38.9%), and low HDL (18.3%) were the most fre-
uent among the components of MS. Almost all subjects in this
able 3orrelations between number of components of metabolic syndrome,
aking or not into account lipid criteria
atio Components of MS Nonlipid Criteria
Men Women Men Women
G/HDL 0.565 0.491 0.267 0.262C/HDL 0.446 0.518 0.229 0.217DL/HDL 0.313 0.470 0.173 0.187G/LDL 0.409 0.150 0.174 0.142
p �0.001 for all correlations.TC � total cholesterol. Other abbreviation as in Table 1.
able 4ean values of lipid ratios according to three categories of fasting
lucose
ariable Normoglycemia(n � 17,430)
Impaired FastingGlucose
(n � 821)
Diabetes(n � 527)
p Value
G/HDL 2.4 (2.1) 3.3 (3.2) 4.0 (3.4) �0.001C/HDL 4.1 (1.1) 4.6 (1.1) 4.6 (1.2) 0.001*DL/HDL 2.6 (0.9) 2.9 (0.9) 2.9 (0.9) 0.001*G/LDL 0.8 (1.5) 1.1 (1.3) 1.2 (0.8) 0.001*
* Statistical difference only between the normoglycemic group and theest.
Abbreviations as in Tables 1 and 3.
ubgroup were men (95%) and overweight (mean BMI 28.0 i
g/m2). The mean age of this subgroup, 43.3 years, was inter-ediate between those with and without MS.
iscussion
he main result of our study is that the TG/HDL ratioorrelates strongly to the presence of MS; we have also beenble to identify reliable cut-off values. The increasing in-erest in MS is a logical consequence of its high prevalencend strong association to ischemic heart disease.1–4 Insulinesistance is the most plausible explanation for the associ-tion between cardiovascular risk factors and some partic-lar lipid abnormalities.10,13,14 Low-density lipoprotein re-ains the first target for the treatment of dyslipidemia,hereas hypertriglyceridemia and low HDL are considered
econdary targets.10 Much evidence supports the idea thathe incidence of cardiovascular events is considerably highf TG levels are high or HDL levels remain low.15–19 Thisould be explained by the observation that hypertriglycer-demia and low HDL induce hepatic and adipose metabo-isms that generate smaller and denser low-density lipopro-ein particles14,20 that have the strongest atherogenicower.21,22 In fact, smaller and denser low-density lipopro-ein particles have been related to the presence of MS23 oriabetes.22 Therefore, MS could emerge as an integration ofardiovascular risk factors and some features of the lipidrofile with a clear association to ischemic heart disease. Ga-iano et al16 considered this ratio the strongest predictor ofschemic heart disease in a case–control study; recent datarom the Treatments to New Targets (TNT) study have con-rmed such a hypothesis.18
Assessment of insulin resistance can be made by labo-atory tests, although these are not widely accessible; there-ore, alternative and feasible tools have been proposed.
easurements of insulin resistance have additive value tohe clinical criteria of MS for detecting subclinical athero-clerosis,24 and we have tested an alternative and moreidely available manifestation of MS, namely the TG/HDL
atio. Receiver operating characteristic curves are the maintatistical tool for discrimination and diagnostic assessmentf a proposed model.12 Our results showed a strong corre-ation of this ratio to the presence of other components of
S. This was the only ratio that was significantly differentn the 3 categories of insulin resistance in our results, thusighlighting its high sensitivity and specificity. Moreover,he high negative predictive value allows reliable exclusionf MS if the TG/HDL ratio is below the proposed cut-offalues. The cut-off value of 2.75 in men is similar to otherroups,7 but the cut-off value of 1.65 in women has not beeneported.
The main limitation of our analysis is that it may not beepresentative of current cardiologic patients. Healthy ac-ive workers may have a lower cardiovascular risk butepresent a highly interesting preventive target in which therevalence of cardiovascular risk factors is similar to otherohorts.12–16 Assessment of BMI instead of waist circum-erence is a well-validated modification of ATP III diagnos-ic criteria, although it could have underestimated the prev-lence of MS.14–17 This could have underpowered ournalysis but actually underscores the significance and clin-
cal relevance of our results. The TG/HDL ratio has been
rir
AJMMcABBSA
1
1
1
1
1
1
1
1
1
1
2
2
2
2
2
2
428 The American Journal of Cardiology (www.AJConline.org)
ecently debated as an accurate marker of insulin resistancen black people,25 but all subjects included in the MESYASegistry are Caucasian.
cknowledgment: We thank Luis Francisco Camisaiménez, MD, Eva María Costa Morant, MD, Eugenia delar, MD, Garcia-Vilanova Comas, MD, and Joaquin Antoniartínez, MD, Medical Department, Corte Ingles, Valen-
ia; and Francisco Orts Suarez, MD, Francisco Iñiguezlbort, MD, Jose Cruz Gisbert, MD, Manuel Puchadesuendía, MD, Concepcion Benaches Carcel, MD, Agustinaldovi Vercher, MD, Jorge Grau Carmen, MD, and Jorgeanchís Botella, MD, Medical Department, Ford Factory,lmussafes, Valencia, Spain.
1. Sattar N, Gaw A, Scherbakova O, Ford I, O’Reilly DS, Haffner SM,Isles C, Macfarlane PW, Packard CJ, Cobbe SM, Shepherd J. Meta-bolic syndrome with and without C-reactive protein as a predictor ofcoronary heart disease and diabetes in the West of Scotland CoronaryPrevention Study. Circulation 2003;108:414–419.
2. Ridker PM, Buring JE, Cook NR, Rifai N. C-reactive protein, themetabolic syndrome, and risk of incident cardiovascular events: an8-year follow-up of 14 719 initially healthy American women. Circu-lation 2003;107:391–397.
3. Levantesi G, Macchia A, Marfisi R, Franzosi MG, Maggioni AP,Nicolosi GL, Schweiger C, Tavazzi L, Tognoni G, Valagussa F,Marchioli R. Metabolic syndrome and risk of cardiovascular eventsafter myocardial infarction. J Am Coll Cardiol 2005;46:277–283.
4. Gami AS, Witt BJ, Howard DE, Erwin PJ, Gami LA, Somers VK,Montori VM. Metabolic syndrome and risk of incident cardiovascularevents and death: a systematic review and meta-analysis of longitudi-nal studies. J Am Coll Cardiol 2007;49:403–414.
5. Golden SH, Folsom AR, Coresh J, Sharrett AR, Szklo M, Brancati F.Risk factor groupings related to insulin resistance and their synergisticeffects on subclinical atherosclerosis: the atherosclerosis risk in com-munities study. Diabetes 2002;51:3069–3076.
6. Deedwania P, Barter P, Carmena R, Fruchart JC, Grundy SM, HaffnerS, Kastelein JJ, LaRosa JC, Schachner H, Shepherd J, Waters DD.Reduction of low-density lipoprotein cholesterol in patients with cor-onary heart disease and metabolic syndrome: analysis of the Treatingto New Targets study. Lancet 2006;368:919–928.
7. Cordero A, Laclaustra M, Leon M, Grima A, Casasnovas JA, LuengoE, Del Rio A, Ferreira I, Alegria E. Prehypertension is associated withinsulin resistance state and not with an initial renal function impair-ment. A Metabolic Syndrome in Active Subjects in Spain (MESYAS)registry substudy. Am J Hypertens 2006;19:189–196.
8. Cordero A, Laclaustra M, Leon M, Casasnovas JA, Grima A, Najar M,Luengo E, Del Rio A, Ferreira I, Alegria E. Cardiovascular risk factorsand metabolic syndrome associated with subclinical renal failure. MedClin (Barc) 2005;125:653–658.
9. Alegria E, Cordero A, Laclaustra M, Grima A, Leon M, CasasnovasJA, Luengo E, Del Rio A, Ferreira I. Prevalence of metabolic syn-drome in the Spanish working population: MESYAS registry. Rev Esp
Cardiol 2005;58:797–806.0. Executive Summary of the Third Report of the National CholesterolEducation Program (NCEP) expert panel on detection, evaluation, andtreatment of high blood cholesterol in adults (Adult Treatment PanelIII). JAMA 2001;285:2486–2497.
1. Grundy SM, Howard B, Smith S, Eckel R, Redberg R, Bonow RO.Prevention conference VI: diabetes and cardiovascular disease: exec-utive summary: conference proceeding for healthcare professionalsfrom a special writing group of the American Heart Association.Circulation 2002;105:2231–2239.
2. Cook NR. Use and misuse of the receiver operating characteristiccurve in risk prediction. Circulation 2007;115:928–935.
3. Reaven GM. Banting lecture 1988. Role of insulin resistance in humandisease. Diabetes 1988;37:1595–1607.
4. Eckel RH, Grundy SM, Zimmet PZ. The metabolic syndrome. Lancet2005;365:1415–1428.
5. Criqui MH, Heiss G, Cohn R, Cowan LD, Suchindran CM, Bangdi-wala S, Kritchevsky S, Jacobs DR, O’Grady HK, Davis CE. Plasmatriglyceride level and mortality from coronary heart disease. N EnglJ Med 1993;328:1220–1225.
6. Gaziano JM, Hennekens CH, O’Donnell CJ, Breslow JL, Buring JE.Fasting triglycerides, high-density lipoprotein, and risk of myocardialinfarction. Circulation 1997;96:2520–2525.
7. Jeppesen J, Hein HO, Suadicani P, Gyntelberg F. Low triglycerides-high high-density lipoprotein cholesterol and risk of ischemic heartdisease. Arch Intern Med 2001;161:361–366.
8. Barter P, Gotto AM, LaRosa JC, Maroni J, Szarek M, Grundy SM,Kastelein JJ, Bittner V, Fruchart JC. HDL cholesterol, very low levelsof LDL cholesterol, and cardiovascular events. N Engl J Med 2007;357:1301–1310.
9. deGoma EM, Leeper NJ, Heidenreich PA. Clinical significance ofhigh-density lipoprotein cholesterol in patients with low low-densitylipoprotein cholesterol. J Am Coll Cardiol 2008;51:49–55.
0. Laclaustra M, Corella D, Ordovas JM. Metabolic syndrome patho-physiology: the role of adipose tissue. Nutr Metab Cardiovasc Dis2007;17:125–139.
1. Lamarche B, Tchernof A, Moorjani S, Cantin B, Dagenais GR, LupienPJ, Despres JP. Small, dense low-density lipoprotein particles as apredictor of the risk of ischemic heart disease in men. Prospectiveresults from the Quebec Cardiovascular Study. Circulation 1997;95:69–75.
2. Hayashi Y, Okumura K, Matsui H, Imamura A, Miura M, TakahashiR, Murakami R, Ogawa Y, Numaguchi Y, Murohara T. Impact oflow-density lipoprotein particle size on carotid intima-media thicknessin patients with type 2 diabetes mellitus. Metabolism 2007;56:608–613.
3. Hulthe J, Bokemark L, Wikstrand J, Fagerberg B. The metabolicsyndrome, LDL particle size, and atherosclerosis: the Atherosclerosisand Insulin Resistance (AIR) study. Arterioscler Thromb Vasc Biol2000;20:2140–2147.
4. Reilly MP, Wolfe ML, Rhodes T, Girman C, Mehta N, Rader DJ.Measures of insulin resistance add incremental value to the clinicaldiagnosis of metabolic syndrome in association with coronary athero-sclerosis. Circulation 2004;110:803–809.
5. Sumner AE, Finley KB, Genovese DJ, Criqui MH, Boston RC. Fastingtriglyceride and the triglyceride–HDL cholesterol ratio are not markersof insulin resistance in African Americans. Arch Intern Med 2005;
165:1395–1400.