Embed Size (px)
Citation preview
1
Vol.:(0123456789)
Scientific Reports | (2021) 11:14955 | https://doi.org/10.1038/s41598-021-87768-w
www.nature.com/scientificreports
PET/MRI of glucose metabolic rate, lipid content and perfusion in human brown adipose tissueElin Lundström1*, Jonathan Andersson1, Mathias Engström2, Mark Lubberink1,3, Robin Strand1,4, Håkan Ahlström1,5 & Joel Kullberg1,5
This study evaluated the MRI-derived fat fraction (FF), from a Cooling-reheating protocol, for estimating the cold-induced brown adipose tissue (BAT) metabolic rate of glucose (MRglu) and changes in lipid content, perfusion and arterial blood volume (VA) within cervical-supraclavicular fat (sBAT). Twelve volunteers underwent PET/MRI at baseline, during cold exposure and reheating. For each temperature condition, perfusion and VA were quantified with dynamic [15O]water-PET, and FF, with water-fat MRI. MRglu was assessed with dynamic [18F]fluorodeoxyglucose-PET during cold exposure. sBAT was defined using anatomical criteria, and its subregion sBATHI, by MRglu > 11 μmol/100 cm3/min. For all temperature conditions, sBAT-FF correlated negatively with sBAT-MRglu (ρ ≤ − 0.87). After 3 h of cold, sBAT-FF decreased (− 2.13 percentage points) but tended to normalize during reheating although sBATHI-FF remained low. sBAT-perfusion and sBAT-VA increased during cold exposure (perfusion: + 5.2 ml/100 cm3/min, VA: + 4.0 ml/100 cm3). sBAT-perfusion remained elevated and sBAT-VA normalized during reheating. Regardless of temperature condition during the Cooling-reheating protocol, sBAT-FF could predict the cold-induced sBAT-MRglu. The FF decreases observed after reheating were mainly due to lipid consumption, but could potentially be underestimated due to intracellular lipid replenishment. The influence of perfusion and VA, on the changes in FF observed during cold exposure, could not be ruled out.
The main function of white adipose tissue (WAT) is to store energy in the form of intracellular lipids (fat). Brown adipose tissue (BAT), however, uses substrates such as lipids and glucose to generate heat in a process called non-shivering thermogenesis (NST), upon metabolic activation e.g. by cold exposure1,2. Negative associa-tions between adiposity and cold-induced [18F]fluorodeoxyglucose ([18F]FDG) uptake, assessed with positron emission tomography (PET)3,4, and positive effects on glucose metabolism in subjects exhibiting visible BAT in PET examinations during 5–8 h cold exposure5, indicate BAT as a possible target for treatment of obesity and diabetes. This therapeutic potential has made BAT focus of a large research interest but to determine its capacity, safe methods providing reliable estimations of BAT amount and metabolic activity are needed. Currently, there is no non-invasive approach for estimating BAT amount in terms of brown adipocyte quantity6. In-vivo, BAT metabolic activity is typically studied with respect to glucose metabolism using [18F]FDG-PET combined with computed tomography ([18F]FDG-PET/CT)6, which yields either the physiologically semi-quantitative stand-ard uptake value (SUV) from conventional static acquisition or quantitative estimates, e.g. the metabolic rate of glucose (MRglu), from dynamic acquisition. Quantitative estimates are generally preferable when comparing glucose metabolism between subjects with different body composition7 as SUV overestimates the assessment in overweight/obese subjects. Imaging is conducted during warm and/or cold conditions, with the latter promot-ing increased [18F]FDG uptake, assumed to be accompanied by an overall increase in BAT metabolic activity and NST. Previous studies have reported higher CT Hounsfield units (HUs) of adipose tissue regions with high [18F]FDG uptake compared to low [18F]FDG uptake8,9. In addition, the CT HUs of supraclavicular BAT have been observed to increase during 3 h of cold exposure, interpreted as a result of lipid consumption in BAT dur-ing NST10. Water-fat MRI, introduced as a non-ionizing imaging alternative for BAT, has been used to quantify a corresponding cold-induced decrease in fat fraction (FF) within the cervical-supraclavicular fat depot11–13, with FF calculated as the MR signal from fat divided by the total signal from water and fat. In these studies, PET
OPEN
1Department of Surgical Sciences, Section of Radiology, Uppsala University, Uppsala, Sweden. 2GE Healthcare, Waukesha, WI, USA. 3Medical Physics, Uppsala University Hospital, Uppsala, Sweden. 4Department of Information Technology, Uppsala University, Uppsala, Sweden. 5Antaros Medical, BioVenture Hub, Mölndal, Sweden. *email: [email protected]
2
Vol:.(1234567890)
Scientific Reports | (2021) 11:14955 | https://doi.org/10.1038/s41598-021-87768-w
www.nature.com/scientificreports/
reference measurements of BAT were lacking, and as a result, the association between e.g. [18F]FDG uptake and changes in FF could not be determined. Another study, performed with PET/CT and MRI of supraclavicular adipose tissue, failed to show a significant relationship between cold-induced [18F]FDG-SUV and changes in FF between baseline and cold exposure14. Whether a more quantitative PET approach would discern such an association has not yet been studied. Dynamic [15O]water-PET studies have reported increased BAT perfusion during cold exposure15–17 and a cold-induced increase in BAT water content due to increased tissue arterial blood volume (VA)17 that incorrectly might be interpreted as a decrease in absolute fat content in the FF meas-urements. We have previously proposed a Cooling-reheating protocol, involving MRI at baseline, during cold exposure and during reheating, for isolating the contribution of lipid consumption (i.e. decrease in absolute fat content) to the cold-induced decrease in FF11. The protocol concept was based on assumptions that cold-induced increases in perfusion (and blood volume) would normalize relatively fast during subsequent reheating whereas cold-induced decreases in lipid content would remain low11. When applying the Cooling-reheating protocol, a sustained low FF at the end of 30 min of reheating was observed, indicating lipid consumption, rather than altered perfusion, as the primary cause of the preceding cold-induced decrease in FF11. However, verification of perfusion as a fast-regulated process, e.g. with reference perfusion measurements from PET, has not yet been performed. In a previous PET/CT study, peak radioactivity from [11C]acetate in BAT was used as index of perfu-sion and BAT CT HUs were used to indicate lipid content in subjects exposed to 3 h of cold exposure during two separate visits. One of the visits involved ingestion of nicotinic acid for inhibition of intracellular triglyceride lipolysis and the other visit served as control18. The results indicated cold-induced increases in BAT CT HUs to mainly be due to lipid consumption and not to increased perfusion, which is in line with our previous study11. However, quantification of the effects of cold exposure on BAT perfusion and lipid content, using gold-standard procedures ([15O]water-PET and water-fat MRI, respectively), would strengthen previous studies and deepen our knowledge of BAT physiology.
Unlike PET and CT, MRI does not expose the subjects to ionizing radiation and could therefore be of particu-lar use in BAT studies including repeated imaging and/or imaging of children. Water-fat MRI has been used for characterizing BAT and distinguishing it from WAT (typically represented by subcutaneous adipose tissue, SAT), based on its presumed higher intracellular water content and richer vascularization19,20. Numerous studies have investigated the association between FF and BAT glucose metabolism (assessed from either static or dynamic [18F]FDG-PET) and/or the difference in FF between subjects/scans/regions exhibiting high and low BAT-related [18F]FDG uptake14,20–27. Supraclavicular-FF, estimated with MRI or magnetic resonance spectroscopy (MRS) during warm23,24 and cold23,26 conditions, has shown a negative correlation with cold-induced [18F]FDG-SUV26 and MRglu
23,24, indicating FF as suitable for BAT assessment regardless of the tissue glucose metabolic status. Imaging during warm and cold conditions were performed at separate visits23 and changes in FF per se could therefore not be investigated. Studies targeting the differences in FF between cervical-supraclavicular regions of high and low BAT glucose metabolism are few, whereof one has reported lower FF in regions of higher [18F]FDG-SUV27, and another, no general difference except for in subjects with low body mass index (BMI)25. Such regional differences have not yet been targeted with a more quantitative (dynamic) PET approach.
This study aimed to evaluate: 1) The degree to which FF in cervical-supraclavicular fat (i.e. suspected BAT, hereafter denoted sBAT), measured during a Cooling-reheating protocol, is associated with the cold-induced BAT metabolic rate of glucose (MRglu), assessed with dynamic [18F]FDG-PET. 2) Whether FF measurements from the Cooling-reheating protocol can be used for detecting changes in lipid content and perfusion (including arterial blood volume, VA) related to cold-induced MRglu in BAT, using [15O]water-PET to obtain reference measure-ments of perfusion and VA.
Materials and methodsSubjects. After study approval by the Regional Ethical Review Board in Uppsala and the Radiation Protec-tion Committee in Uppsala, twelve adult volunteers were recruited, mainly through advertisement. Informed written consent was obtained at the beginning of the study and all methods were carried out in accordance with the relevant guidelines and regulations. Subject characteristics: 7 males, age 27.4 ± 6.1 (21–42) years, weight 72.3 ± 16.1 (54.6–108.0) kg, BMI 23.5 ± 4.1 (18.0–34.2) kg/m2, waist circumference 81.6 ± 12.4 (61.5–102.0) cm; mean ± standard deviation (range). Participants were screened for exclusion criteria according to brown adi-pose reporting criteria in imaging studies (BARCIST) 1.028 (i.e. the use of β-blockers and β-adrenergic agonists, weight change of > 5% within 3 months, habitual tobacco use, habitual excessive alcohol use, pregnancy and plasma glucose > 11 mM). In addition, subjects otherwise unsuited for PET/MRI and/or with self-reported ten-dency of impaired blood circulation in extremities during cold conditions were excluded. In line with BARCIST 1.028, subjects were instructed to refrain from high-fat food and caffeine 24 h prior to the study visits, to fast over night from 22:00 the preceding evening and to avoid intense physical activity 48 h before each visit. They were also instructed to refrain from donating blood within one month of the study, to avoid cold exposure before the investigations (e.g. during the journey to the hospital) and to drink 0.5 l of water in the morning of the investi-gations (to decrease the biological half-life of [18F]FDG). For subjects with a suspected on-going infection, the investigations were postponed.
Preparation and basic body measurements. Initial preparations included information to the sub-ject, verification of subject preparations, ruling out of exclusion criteria, obtaining of informed written consent, interviewing of subject, dressing in standardized clothing and conduction of basic body measurements (weight, height and waist circumference). A heat fan was used to maintain a comfortable ambient temperature during these preparations. Throughout the study visits, the subjects were dressed in standardized clothing consisting of underwear, socks and patient gown. Subject weight and height were obtained with scales and stadiometers,
3
Vol.:(0123456789)
Scientific Reports | (2021) 11:14955 | https://doi.org/10.1038/s41598-021-87768-w
www.nature.com/scientificreports/
respectively. Waist circumference was measured midway between the lowest rib and the superior border of the iliac crest on a standing subject. The body mass index (BMI) was calculated according to BMI = weight/height2.
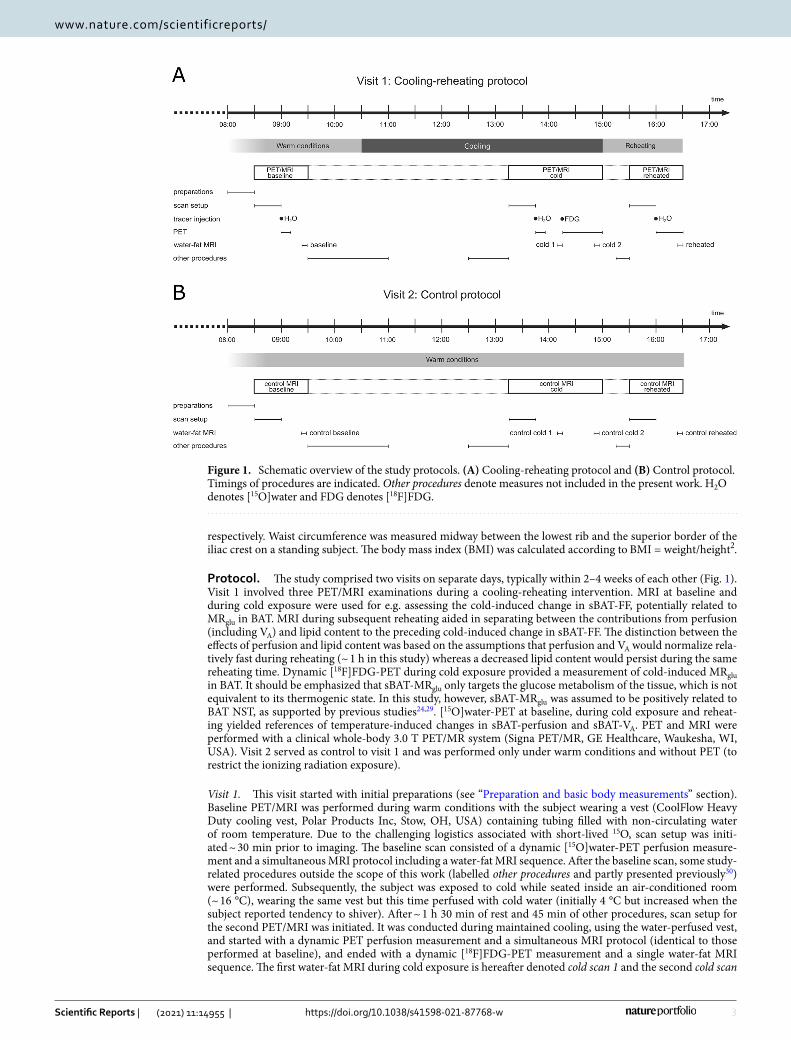
Protocol. The study comprised two visits on separate days, typically within 2–4 weeks of each other (Fig. 1). Visit 1 involved three PET/MRI examinations during a cooling-reheating intervention. MRI at baseline and during cold exposure were used for e.g. assessing the cold-induced change in sBAT-FF, potentially related to MRglu in BAT. MRI during subsequent reheating aided in separating between the contributions from perfusion (including VA) and lipid content to the preceding cold-induced change in sBAT-FF. The distinction between the effects of perfusion and lipid content was based on the assumptions that perfusion and VA would normalize rela-tively fast during reheating (~ 1 h in this study) whereas a decreased lipid content would persist during the same reheating time. Dynamic [18F]FDG-PET during cold exposure provided a measurement of cold-induced MRglu in BAT. It should be emphasized that sBAT-MRglu only targets the glucose metabolism of the tissue, which is not equivalent to its thermogenic state. In this study, however, sBAT-MRglu was assumed to be positively related to BAT NST, as supported by previous studies24,29. [15O]water-PET at baseline, during cold exposure and reheat-ing yielded references of temperature-induced changes in sBAT-perfusion and sBAT-VA. PET and MRI were performed with a clinical whole-body 3.0 T PET/MR system (Signa PET/MR, GE Healthcare, Waukesha, WI, USA). Visit 2 served as control to visit 1 and was performed only under warm conditions and without PET (to restrict the ionizing radiation exposure).
Visit 1. This visit started with initial preparations (see “Preparation and basic body measurements” section). Baseline PET/MRI was performed during warm conditions with the subject wearing a vest (CoolFlow Heavy Duty cooling vest, Polar Products Inc, Stow, OH, USA) containing tubing filled with non-circulating water of room temperature. Due to the challenging logistics associated with short-lived 15O, scan setup was initi-ated ~ 30 min prior to imaging. The baseline scan consisted of a dynamic [15O]water-PET perfusion measure-ment and a simultaneous MRI protocol including a water-fat MRI sequence. After the baseline scan, some study-related procedures outside the scope of this work (labelled other procedures and partly presented previously30) were performed. Subsequently, the subject was exposed to cold while seated inside an air-conditioned room (~ 16 °C), wearing the same vest but this time perfused with cold water (initially 4 °C but increased when the subject reported tendency to shiver). After ~ 1 h 30 min of rest and 45 min of other procedures, scan setup for the second PET/MRI was initiated. It was conducted during maintained cooling, using the water-perfused vest, and started with a dynamic PET perfusion measurement and a simultaneous MRI protocol (identical to those performed at baseline), and ended with a dynamic [18F]FDG-PET measurement and a single water-fat MRI sequence. The first water-fat MRI during cold exposure is hereafter denoted cold scan 1 and the second cold scan
Figure 1. Schematic overview of the study protocols. (A) Cooling-reheating protocol and (B) Control protocol. Timings of procedures are indicated. Other procedures denote measures not included in the present work. H2O denotes [15O]water and FDG denotes [18F]FDG.
4
Vol:.(1234567890)
Scientific Reports | (2021) 11:14955 | https://doi.org/10.1038/s41598-021-87768-w
www.nature.com/scientificreports/
2. After PET/MRI during cold exposure, the subject was reheated while seated during ~ 30 min in a dedicated room, using a heating fan, a ceiling-mounted heater, the water-perfused vest (warm water) and four heating pads. The last ~ 15 min of reheating were devoted to other procedures and subsequently, the subject underwent the last PET/MRI during maintained reheating (vest, four heating pads placed at groin). The reheated scan consisted of a PET perfusion measurement with a prolonged acquisition (see “Image acquisition” section). The additional data acquired were used during post-processing for removal of residual [18F]FDG in the perfusion compartment modelling. The MRI protocol was identical to that performed at baseline. The water-fat MRI data of visit 1 of the first subject were acquired with a pilot sequence (see “Image acquisition” section).
Visit 2. This visit was very similar to visit 1 (Fig. 1), except for the absence of radiotracer administration, PET and cooling-reheating intervention. Care was taken to match the MRI acquisition time points of visit 2 to those from visit 1.
Image acquisition. For each PET/MRI, care was taken to position the subject straight with symmetrical shoulders, for more consistent image coverage in all examinations.
PET. The venous whole-blood glucose level ( CWBglu ) was measured using Contour XT (Bayer Healthcare, Basel,
Switzerland) before and after PET/MRI during cold exposure. A typical mean plasma-to-whole-blood ratio of 1.1 was used to convert CWB
glu to plasma glucose level ( CPglu)31. In addition, venous blood was sampled prior
to the PET/MRI during cold exposure and analysed with respect to plasma glucose level ( CP2glu ) using stand-
ard operating procedures at the central laboratory of the hospital. The PET field of view (FOV) was along the superior-inferior direction centred on the supraclavicular fat depot. The perfusion measurements included an intravenous injection of 600 MBq of [15O]water at the start of a 10 min dynamic scan with time frames 1 × 10, 8 × 5, 4 × 10, 2 × 15, 3 × 20, 2 × 30 and 6 × 60 s. During reheating, an additional 60 s frame was acquired immedi-ately prior to injection and another 60 s frame was acquired 20 min after injection. These two 60 s frames were used for subtracting the residual [18F]FDG radioactivity from the dynamic [15O]water images. Three approaches to [18F]FDG background subtraction were investigated, assuming either constant [18F]FDG, a linearly changing [18F]FDG, or an exponentially changing [18F]FDG contribution during the [15O]water scan.
The MRglu measurement included the intravenous injection of 3 MBq/kg [18F]FDG simultaneously with the start of a 45 min dynamic scan with time frames 1 × 10, 8 × 5, 4 × 10, 2 × 15, 3 × 20, 2 × 30, 6 × 60, 4 × 150 and 5 × 300 s. All radioactivity injections were performed with a contrast medium injector as a fast bolus (10 ml at 1 ml/s followed by 30 ml saline at 2 ml/s). Images were reconstructed into a 128 × 128 × 89 matrix with 500 mm transaxial FOV using time-of-flight ordered subset expectation maximization (3 iterations, 28 subsets) includ-ing point spread function recovery, all appropriate corrections for randoms, scatter etc. and a 5 mm Gaussian post-filter. Attenuation correction was based on a built-in dual-echo water-fat MRI sequence.
MRI. The MRI protocol consisted of a series of sequences acquired using a 19-element head-neck unit (HNU) receive coil (GE Healthcare). The sequence used in this work was a 4 min 52 s multi-echo 3D gradient echo sequence acquired in free breathing. To reduce respiratory artefacts, the subjects were instructed to breathe shal-lowly. Scan parameters: axial acquisition, repetition time/echo time 1/echo time spacing = 13.8/1.70/0.65 ms, 15 unipolar echoes acquired as five consecutive time-shifted readouts of echo train length 3, flip angle = 4°, receive bandwidth = ± 142.86 kHz, parallel imaging acceleration = 1.5 (ARC) in anterior–posterior and superior-inferior direction, FOV (right-left × anterior–posterior × feet-head) = 480 × 202 × 76 mm3, acquired/reconstructed voxel size = 1.0 × 1.0 × 2.0 mm3/0.94 × 0.94 × 2.0 mm3, 38 slices, number of signal acquisitions = 1. The flip angle was chosen small to reduce T1-weighting. No MRI contrast agents were administered. The first individual investi-gated was a pilot subject. After visit 1 of this subject, the water-fat MRI sequence was slightly adjusted. To be able to compare the pilot sequence with the new sequence, this subject was imaged using both sequences during visit 2. The scan parameters of the pilot sequence differed from the new according to: repetition time/echo time 1/echo time spacing = 22.5/2.06/1.07 ms, 15 unipolar echoes acquired as three consecutive time-shifted readouts of echo train length 5, flip angle = 7°, field of view (right-left × anterior–posterior × feet-head) = 480 × 202 × 56 mm3, 28 slices.
Image post-processing. PET − Input curves. In both the [15O]water and [18F]FDG images, a nearly cir-cular region of interest (ROI) of diameter ~ 1 cm was manually outlined using Voiager (GE Healthcare), over the ascending aorta in 5–10 consecutive image slices in the frame in which the first pass of the radioactivity bolus was best visible. These ROIs were combined into a volume of interest (VOI) and projected onto all other frames of the dynamic scans to obtain whole-blood time-activity curves (TACs). For [18F]FDG, a plasma input curve was computed by multiplying the whole-blood TAC by a typical mean plasma-to-whole-blood ratio of 1.1.31.
PET − Perfusion. The dynamic [15O]water images were projected onto the sBAT VOIs, obtained from MRI (see Supplemental material), resulting in one TAC for each VOI. Perfusion, distribution volume (VT) and VA were estimated using non-linear regression of the operational equation of the standard single-tissue compartment model to the first three minutes of the PET data. In addition to these parameters, the model included a fitted parameter accounting for delay of the input function before arrival in the sBAT VOI. Fits were performed using in-house developed software in MATLAB (MathWorks).

5
Vol.:(0123456789)
Scientific Reports | (2021) 11:14955 | https://doi.org/10.1038/s41598-021-87768-w
www.nature.com/scientificreports/
PET − Metabolic rate of glucose. Net uptake rate (Ki) images of [18F]FDG were computed using a basis function implementation of the irreversible two-tissue compartment model, employing one irreversible basis function and 50 basis functions with logarithmically spaced clearance rates (between 0.02 and 1.0 min−1). Parametric Ki images were computed using in-house developed software in MATLAB. Thereafter, MRglu maps were calculated according to
where CPglu corresponds to mean CP
glu obtained before and after the PET/MRI during cold exposure. LC corre-sponds to the lumped constant, relating [18F]FDG kinetics to glucose kinetics, here assumed to be 1. The MRglu maps were projected onto the sBAT VOIs obtained from MRI (see Supplemental material) and mean MRglu in each VOI was calculated. Due to motion during image acquisition, the dynamic data of one of the subjects were corrected for motion, using rigid image registration, before the MRglu map was estimated. For eight subjects, the MRglu map was spatially registered to the MRI fat signal image, using rigid image registration, for improved spatial correspondence.
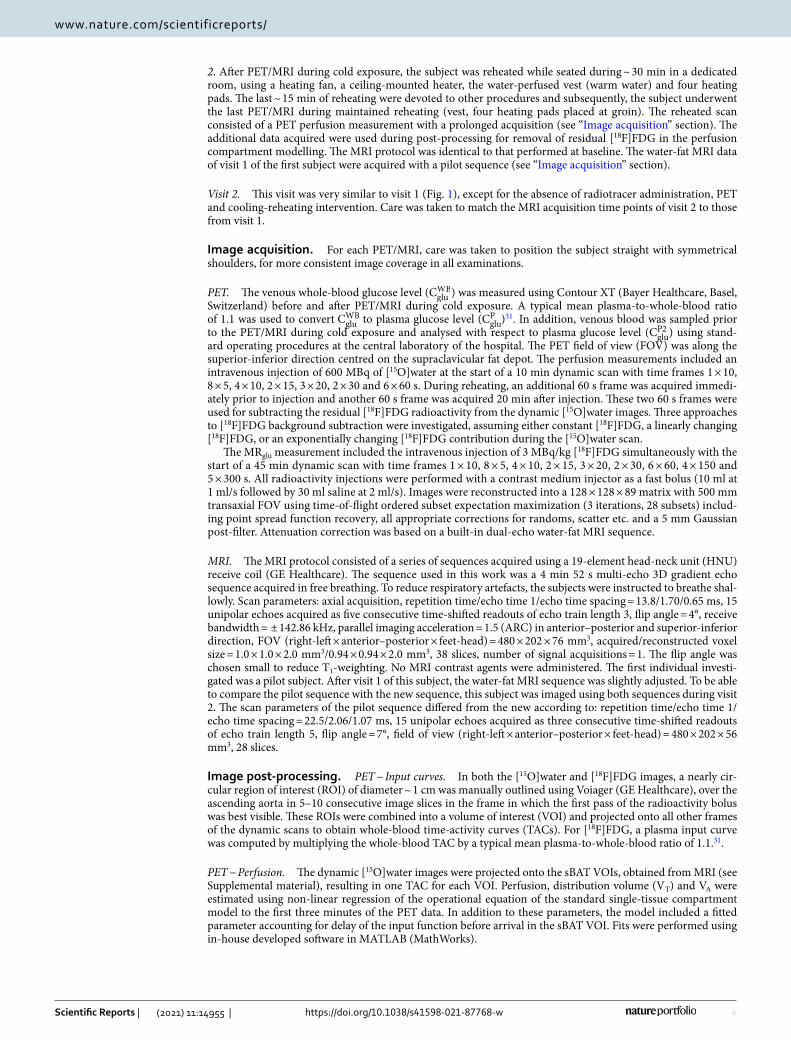
Water‑fat MRI. Reconstruction of water-fat MRI data was carried out using in-house MATLAB software, according to a previously described method32. Mean sBAT-FF, sBAT-MRglu, sBAT-perfusion and sBAT-VA were obtained from atlas-based segmentation (based on a previously presented method33), and mean SAT-FF and SAT-MRglu from automated segmentation with manual corrections (see Supplemental material). Within each sBAT and SAT segmentation, two regions corresponding to high and low MRglu (sBATHI, sBATLO, SATHI and SATLO) were identified. sBATHI and SATHI included voxels with MRglu > 11 μmol/100 cm3/min, and sBATLO and SATLO included voxels with MRglu ≤ 11 μmol/100 cm3/min (see Supplemental material and segmentation examples in Fig. 2).
FF, MRglu, perfusion and VA estimates. Mean FF and mean MRglu were estimated in sBAT, sBATHI, sBATLO, SAT, SATHI and SATLO. For comparison, CP2
glu , acquired during cold exposure and measured by the central laboratory of the hospital, was used in Eq. 1 for assessing an alternative MRglu measurement (MRglu2) within sBAT and SAT (see Supplemental material). Mean perfusion and VA were only estimated in sBAT. Results related to VT were not included in this work due to the difficulty in reliably estimating VT at low perfusion values, due to the lack of clear patterns in VT with respect to cooling and reheating in initial analyses, and also in order to restrain the content of the manuscript. Mean FF estimates from the pilot water-fat MRI sequence (subject 1 during visit 1) were corrected in order to be comparable to the mean FF of other subjects. The correction was accomplished according to
where the value 3.9 pp corresponds to the difference in mean sBAT-FF between the two water-fat MRI sequences of visit 2, averaged over the four scans.
Missing data. Due to protocol development and image quality issues, there were some missing data in this study. Cold scan 2 was not part of the initial protocol and therefore not performed for the first pilot subject. For another subject, the Control protocol was not performed. In addition, the FF map from cold scan 1 of one individual, from cold scan 2 of another individual and from the control baseline scan of a third individual were excluded due to poor image quality. Using an acceptance limit of 100% of the coefficient of variation of the perfu-sion and VA estimates, perfusion measurements from all three time points (baseline, cold exposure and reheat-ing) were successfully obtained for all twelve subjects whereas the VA measurement from baseline of one subject and reheating of another subject were excluded. The venous blood sampling during cold exposure failed for one of the subjects leading to a missing MRglu2 data point (see Supplemental material).
(1)MRglu = CPglu · Ki
/
LC,
(2)mean FFcorrected = mean FFpilot−3.9,
Figure 2. Example of an axial FF map (greyscale) overlaid with the corresponding MRglu map (heat colour scale) and segmentations representing sBATHI (blue contour) and sBATLO (green contour).
6
Vol:.(1234567890)
Scientific Reports | (2021) 11:14955 | https://doi.org/10.1038/s41598-021-87768-w
www.nature.com/scientificreports/
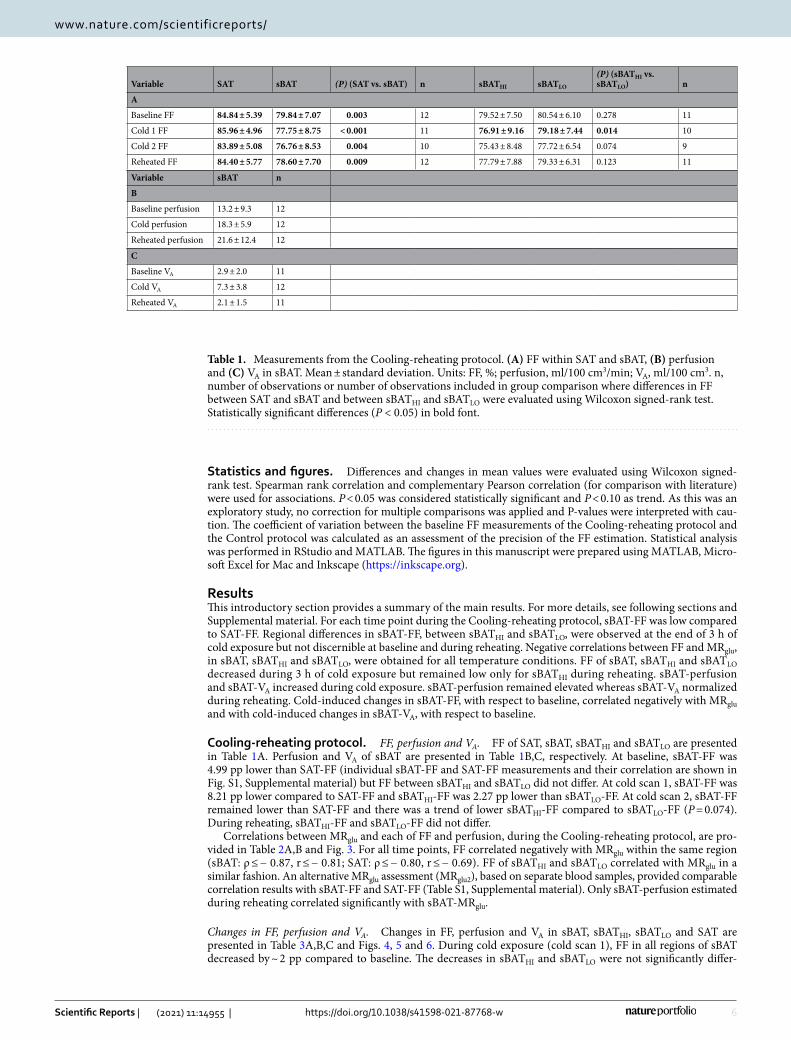
Statistics and figures. Differences and changes in mean values were evaluated using Wilcoxon signed-rank test. Spearman rank correlation and complementary Pearson correlation (for comparison with literature) were used for associations. P < 0.05 was considered statistically significant and P < 0.10 as trend. As this was an exploratory study, no correction for multiple comparisons was applied and P-values were interpreted with cau-tion. The coefficient of variation between the baseline FF measurements of the Cooling-reheating protocol and the Control protocol was calculated as an assessment of the precision of the FF estimation. Statistical analysis was performed in RStudio and MATLAB. The figures in this manuscript were prepared using MATLAB, Micro-soft Excel for Mac and Inkscape (https:// inksc ape. org).
ResultsThis introductory section provides a summary of the main results. For more details, see following sections and Supplemental material. For each time point during the Cooling-reheating protocol, sBAT-FF was low compared to SAT-FF. Regional differences in sBAT-FF, between sBATHI and sBATLO, were observed at the end of 3 h of cold exposure but not discernible at baseline and during reheating. Negative correlations between FF and MRglu, in sBAT, sBATHI and sBATLO, were obtained for all temperature conditions. FF of sBAT, sBATHI and sBATLO decreased during 3 h of cold exposure but remained low only for sBATHI during reheating. sBAT-perfusion and sBAT-VA increased during cold exposure. sBAT-perfusion remained elevated whereas sBAT-VA normalized during reheating. Cold-induced changes in sBAT-FF, with respect to baseline, correlated negatively with MRglu and with cold-induced changes in sBAT-VA, with respect to baseline.
Cooling-reheating protocol. FF, perfusion and VA. FF of SAT, sBAT, sBATHI and sBATLO are presented in Table 1A. Perfusion and VA of sBAT are presented in Table 1B,C, respectively. At baseline, sBAT-FF was 4.99 pp lower than SAT-FF (individual sBAT-FF and SAT-FF measurements and their correlation are shown in Fig. S1, Supplemental material) but FF between sBATHI and sBATLO did not differ. At cold scan 1, sBAT-FF was 8.21 pp lower compared to SAT-FF and sBATHI-FF was 2.27 pp lower than sBATLO-FF. At cold scan 2, sBAT-FF remained lower than SAT-FF and there was a trend of lower sBATHI-FF compared to sBATLO-FF (P = 0.074). During reheating, sBATHI-FF and sBATLO-FF did not differ.
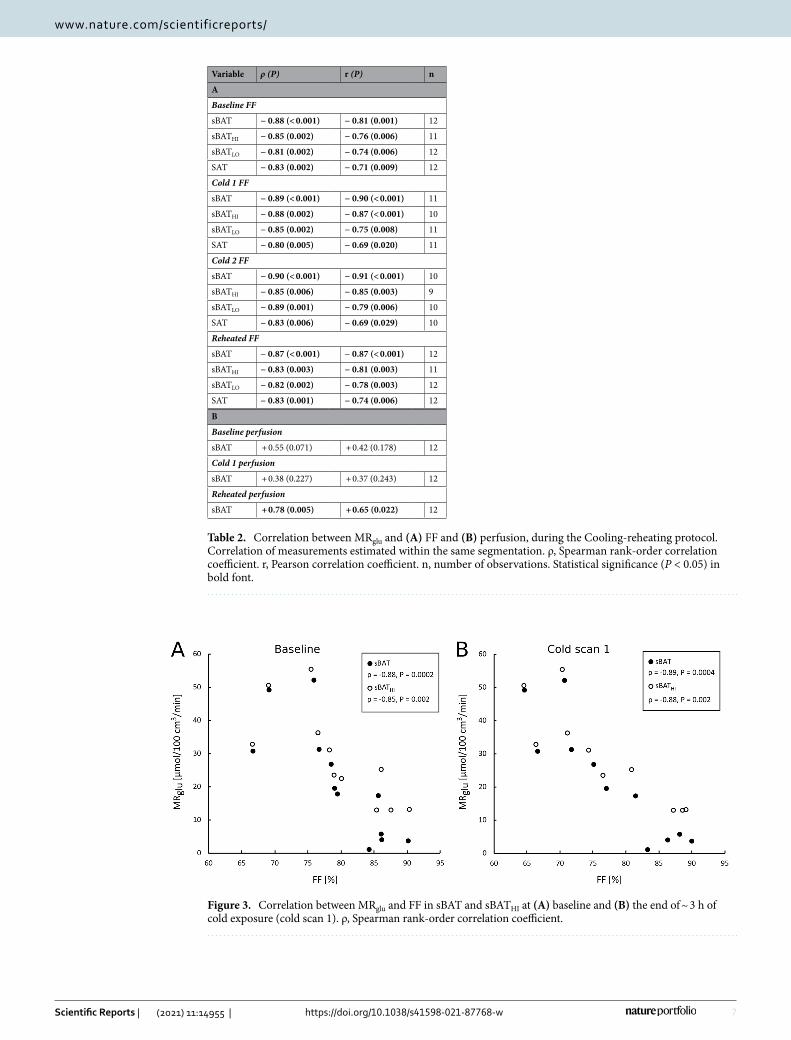
Correlations between MRglu and each of FF and perfusion, during the Cooling-reheating protocol, are pro-vided in Table 2A,B and Fig. 3. For all time points, FF correlated negatively with MRglu within the same region (sBAT: ρ ≤ − 0.87, r ≤ − 0.81; SAT: ρ ≤ − 0.80, r ≤ − 0.69). FF of sBATHI and sBATLO correlated with MRglu in a similar fashion. An alternative MRglu assessment (MRglu2), based on separate blood samples, provided comparable correlation results with sBAT-FF and SAT-FF (Table S1, Supplemental material). Only sBAT-perfusion estimated during reheating correlated significantly with sBAT-MRglu.
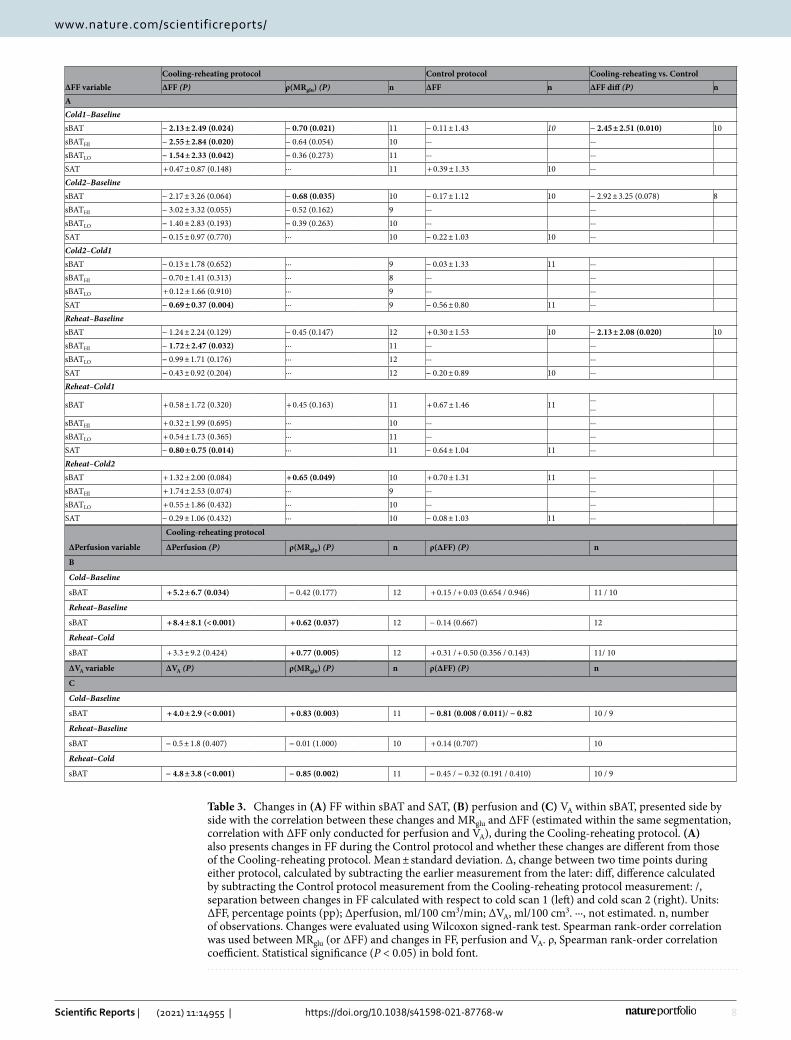
Changes in FF, perfusion and VA. Changes in FF, perfusion and VA in sBAT, sBATHI, sBATLO and SAT are presented in Table 3A,B,C and Figs. 4, 5 and 6. During cold exposure (cold scan 1), FF in all regions of sBAT decreased by ~ 2 pp compared to baseline. The decreases in sBATHI and sBATLO were not significantly differ-
Table 1. Measurements from the Cooling-reheating protocol. (A) FF within SAT and sBAT, (B) perfusion and (C) VA in sBAT. Mean ± standard deviation. Units: FF, %; perfusion, ml/100 cm3/min; VA, ml/100 cm3. n, number of observations or number of observations included in group comparison where differences in FF between SAT and sBAT and between sBATHI and sBATLO were evaluated using Wilcoxon signed-rank test. Statistically significant differences (P < 0.05) in bold font.
Variable SAT sBAT (P) (SAT vs. sBAT) n sBATHI sBATLO
(P) (sBATHI vs. sBATLO) n
A
Baseline FF 84.84 ± 5.39 79.84 ± 7.07 0.003 12 79.52 ± 7.50 80.54 ± 6.10 0.278 11
Cold 1 FF 85.96 ± 4.96 77.75 ± 8.75 < 0.001 11 76.91 ± 9.16 79.18 ± 7.44 0.014 10
Cold 2 FF 83.89 ± 5.08 76.76 ± 8.53 0.004 10 75.43 ± 8.48 77.72 ± 6.54 0.074 9
Reheated FF 84.40 ± 5.77 78.60 ± 7.70 0.009 12 77.79 ± 7.88 79.33 ± 6.31 0.123 11
Variable sBAT n
B
Baseline perfusion 13.2 ± 9.3 12
Cold perfusion 18.3 ± 5.9 12
Reheated perfusion 21.6 ± 12.4 12
C
Baseline VA 2.9 ± 2.0 11
Cold VA 7.3 ± 3.8 12
Reheated VA 2.1 ± 1.5 11
7
Vol.:(0123456789)
Scientific Reports | (2021) 11:14955 | https://doi.org/10.1038/s41598-021-87768-w
www.nature.com/scientificreports/
Table 2. Correlation between MRglu and (A) FF and (B) perfusion, during the Cooling-reheating protocol. Correlation of measurements estimated within the same segmentation. ρ, Spearman rank-order correlation coefficient. r, Pearson correlation coefficient. n, number of observations. Statistical significance (P < 0.05) in bold font.
Variable ρ (P) r (P) n
A
Baseline FF
sBAT − 0.88 (< 0.001) − 0.81 (0.001) 12
sBATHI − 0.85 (0.002) − 0.76 (0.006) 11
sBATLO − 0.81 (0.002) − 0.74 (0.006) 12
SAT − 0.83 (0.002) − 0.71 (0.009) 12
Cold 1 FF
sBAT − 0.89 (< 0.001) − 0.90 (< 0.001) 11
sBATHI − 0.88 (0.002) − 0.87 (< 0.001) 10
sBATLO − 0.85 (0.002) − 0.75 (0.008) 11
SAT − 0.80 (0.005) − 0.69 (0.020) 11
Cold 2 FF
sBAT − 0.90 (< 0.001) − 0.91 (< 0.001) 10
sBATHI − 0.85 (0.006) − 0.85 (0.003) 9
sBATLO − 0.89 (0.001) − 0.79 (0.006) 10
SAT − 0.83 (0.006) − 0.69 (0.029) 10
Reheated FF
sBAT − 0.87 (< 0.001) − 0.87 (< 0.001) 12
sBATHI − 0.83 (0.003) − 0.81 (0.003) 11
sBATLO − 0.82 (0.002) − 0.78 (0.003) 12
SAT − 0.83 (0.001) − 0.74 (0.006) 12
B
Baseline perfusion
sBAT + 0.55 (0.071) + 0.42 (0.178) 12
Cold 1 perfusion
sBAT + 0.38 (0.227) + 0.37 (0.243) 12
Reheated perfusion
sBAT + 0.78 (0.005) + 0.65 (0.022) 12
Figure 3. Correlation between MRglu and FF in sBAT and sBATHI at (A) baseline and (B) the end of ~ 3 h of cold exposure (cold scan 1). ρ, Spearman rank-order correlation coefficient.
8
Vol:.(1234567890)
Scientific Reports | (2021) 11:14955 | https://doi.org/10.1038/s41598-021-87768-w
www.nature.com/scientificreports/
Table 3. Changes in (A) FF within sBAT and SAT, (B) perfusion and (C) VA within sBAT, presented side by side with the correlation between these changes and MRglu and ΔFF (estimated within the same segmentation, correlation with ΔFF only conducted for perfusion and VA), during the Cooling-reheating protocol. (A) also presents changes in FF during the Control protocol and whether these changes are different from those of the Cooling-reheating protocol. Mean ± standard deviation. Δ, change between two time points during either protocol, calculated by subtracting the earlier measurement from the later: diff, difference calculated by subtracting the Control protocol measurement from the Cooling-reheating protocol measurement: /, separation between changes in FF calculated with respect to cold scan 1 (left) and cold scan 2 (right). Units: ΔFF, percentage points (pp); Δperfusion, ml/100 cm3/min; ΔVA, ml/100 cm3. ···, not estimated. n, number of observations. Changes were evaluated using Wilcoxon signed-rank test. Spearman rank-order correlation was used between MRglu (or ΔFF) and changes in FF, perfusion and VA. ρ, Spearman rank-order correlation coefficient. Statistical significance (P < 0.05) in bold font.
ΔFF variableCooling-reheating protocol Control protocol Cooling-reheating vs. ControlΔFF (P) ρ(MRglu) (P) n ΔFF n ΔFF diff (P) n
ACold1–BaselinesBAT − 2.13 ± 2.49 (0.024) − 0.70 (0.021) 11 − 0.11 ± 1.43 10 − 2.45 ± 2.51 (0.010) 10sBATHI − 2.55 ± 2.84 (0.020) − 0.64 (0.054) 10 ··· ···sBATLO − 1.54 ± 2.33 (0.042) − 0.36 (0.273) 11 ··· ···SAT + 0.47 ± 0.87 (0.148) ··· 11 + 0.39 ± 1.33 10 ···Cold2–BaselinesBAT − 2.17 ± 3.26 (0.064) − 0.68 (0.035) 10 − 0.17 ± 1.12 10 − 2.92 ± 3.25 (0.078) 8sBATHI − 3.02 ± 3.32 (0.055) − 0.52 (0.162) 9 ··· ···sBATLO − 1.40 ± 2.83 (0.193) − 0.39 (0.263) 10 ··· ···SAT − 0.15 ± 0.97 (0.770) ··· 10 − 0.22 ± 1.03 10 ···Cold2–Cold1sBAT − 0.13 ± 1.78 (0.652) ··· 9 − 0.03 ± 1.33 11 ···sBATHI − 0.70 ± 1.41 (0.313) ··· 8 ··· ···sBATLO + 0.12 ± 1.66 (0.910) ··· 9 ··· ···SAT − 0.69 ± 0.37 (0.004) ··· 9 − 0.56 ± 0.80 11 ···Reheat–BaselinesBAT − 1.24 ± 2.24 (0.129) − 0.45 (0.147) 12 + 0.30 ± 1.53 10 − 2.13 ± 2.08 (0.020) 10sBATHI − 1.72 ± 2.47 (0.032) ··· 11 ··· ···sBATLO − 0.99 ± 1.71 (0.176) ··· 12 ··· ···SAT − 0.43 ± 0.92 (0.204) ··· 12 − 0.20 ± 0.89 10 ···Reheat–Cold1
sBAT + 0.58 ± 1.72 (0.320) + 0.45 (0.163) 11 + 0.67 ± 1.46 11 ······
sBATHI + 0.32 ± 1.99 (0.695) ··· 10 ··· ···sBATLO + 0.54 ± 1.73 (0.365) ··· 11 ··· ···SAT − 0.80 ± 0.75 (0.014) ··· 11 − 0.64 ± 1.04 11 ···Reheat–Cold2sBAT + 1.32 ± 2.00 (0.084) + 0.65 (0.049) 10 + 0.70 ± 1.31 11 ···sBATHI + 1.74 ± 2.53 (0.074) ··· 9 ··· ···sBATLO + 0.55 ± 1.86 (0.432) ··· 10 ··· ···SAT − 0.29 ± 1.06 (0.432) ··· 10 − 0.08 ± 1.03 11 ···
ΔPerfusion variable
Cooling-reheating protocol
ΔPerfusion (P) ρ(MRglu) (P) n ρ(ΔFF) (P) n
B
Cold–Baseline
sBAT + 5.2 ± 6.7 (0.034) − 0.42 (0.177) 12 + 0.15 / + 0.03 (0.654 / 0.946) 11 / 10
Reheat–Baseline
sBAT + 8.4 ± 8.1 (< 0.001) + 0.62 (0.037) 12 − 0.14 (0.667) 12
Reheat–Cold
sBAT + 3.3 ± 9.2 (0.424) + 0.77 (0.005) 12 + 0.31 / + 0.50 (0.356 / 0.143) 11/ 10
ΔVA variable ΔVA (P) ρ(MRglu) (P) n ρ(ΔFF) (P) n
C
Cold–Baseline
sBAT + 4.0 ± 2.9 (< 0.001) + 0.83 (0.003) 11 − 0.81 (0.008 / 0.011)/ − 0.82 10 / 9
Reheat–Baseline
sBAT − 0.5 ± 1.8 (0.407) − 0.01 (1.000) 10 + 0.14 (0.707) 10
Reheat–Cold
sBAT − 4.8 ± 3.8 (< 0.001) − 0.85 (0.002) 11 − 0.45 / − 0.32 (0.191 / 0.410) 10 / 9
9
Vol.:(0123456789)
Scientific Reports | (2021) 11:14955 | https://doi.org/10.1038/s41598-021-87768-w
www.nature.com/scientificreports/
ent from each other (P = 0.105). In SAT, there was no observable change in FF. sBAT-perfusion increased by 5.2 ml/100 cm3/min and VA by 4.0 ml/100 cm3 during cold exposure.
During prolonged cold exposure (cold scan 2), there was a trend of decreased sBAT-FF relative to baseline (− 2.17 pp, P = 0.064). In sBATHI, the trend was strong (− 3.02 pp, P = 0.055) and significantly different from that in sBATLO, which was non-significant (P = 0.039 between changes in sBATHI and sBATLO). SAT-FF did not change between baseline and cold scan 2. Between cold scan 1 and 2, the only significant change observed in FF was a decrease in SAT-FF (− 0.69 pp).
During reheating, sBAT-FF tended to normalize compared to during cold exposure (P = 0.129 vs. baseline; P = 0.320 vs. cold scan 1; P = 0.084 vs. cold scan 2) (Fig. 4A). sBATHI-FF remained low (− 1.72 pp, P = 0.032 vs. baseline; + 0.32 pp, P = 0.695 vs. cold scan 1) despite a trend of normalization between prolonged cold exposure and reheating (+ 1.74 pp, P = 0.074 vs. cold scan 2). sBATLO-FF did not change significantly relative to previous time points. The only change in SAT-FF between reheating and previous time points was a 0.80 pp decrease with respect to cold scan 1. sBAT-perfusion remained elevated during reheating (+ 8.4 ml/100 cm3/min, P < 0.001 vs. baseline; + 3.3 ml/100 cm3/min, P = 0.424 vs. cold exposure). sBAT-VA normalized during reheating (− 0.5 ml/100 cm3, P = 0.407 vs. baseline; − 4.8 ml/100 cm3, P < 0.001 vs. cold exposure).
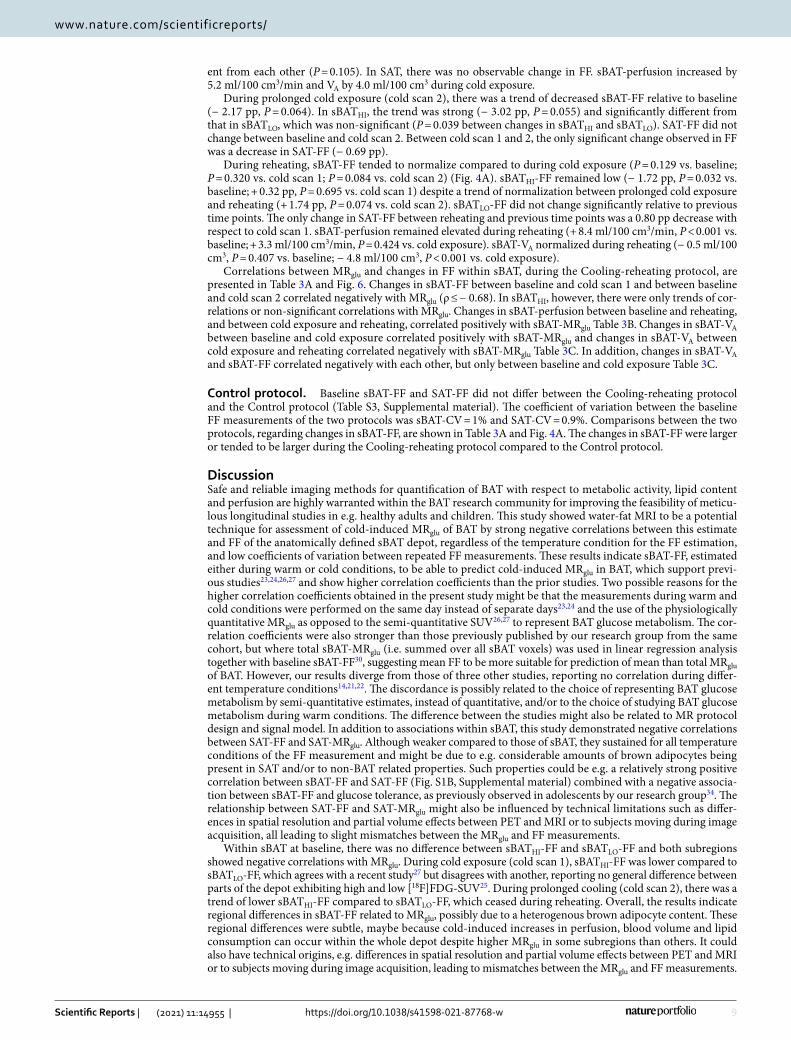
Correlations between MRglu and changes in FF within sBAT, during the Cooling-reheating protocol, are presented in Table 3A and Fig. 6. Changes in sBAT-FF between baseline and cold scan 1 and between baseline and cold scan 2 correlated negatively with MRglu (ρ ≤ − 0.68). In sBATHI, however, there were only trends of cor-relations or non-significant correlations with MRglu. Changes in sBAT-perfusion between baseline and reheating, and between cold exposure and reheating, correlated positively with sBAT-MRglu Table 3B. Changes in sBAT-VA between baseline and cold exposure correlated positively with sBAT-MRglu and changes in sBAT-VA between cold exposure and reheating correlated negatively with sBAT-MRglu Table 3C. In addition, changes in sBAT-VA and sBAT-FF correlated negatively with each other, but only between baseline and cold exposure Table 3C.
Control protocol. Baseline sBAT-FF and SAT-FF did not differ between the Cooling-reheating protocol and the Control protocol (Table S3, Supplemental material). The coefficient of variation between the baseline FF measurements of the two protocols was sBAT-CV = 1% and SAT-CV = 0.9%. Comparisons between the two protocols, regarding changes in sBAT-FF, are shown in Table 3A and Fig. 4A. The changes in sBAT-FF were larger or tended to be larger during the Cooling-reheating protocol compared to the Control protocol.
DiscussionSafe and reliable imaging methods for quantification of BAT with respect to metabolic activity, lipid content and perfusion are highly warranted within the BAT research community for improving the feasibility of meticu-lous longitudinal studies in e.g. healthy adults and children. This study showed water-fat MRI to be a potential technique for assessment of cold-induced MRglu of BAT by strong negative correlations between this estimate and FF of the anatomically defined sBAT depot, regardless of the temperature condition for the FF estimation, and low coefficients of variation between repeated FF measurements. These results indicate sBAT-FF, estimated either during warm or cold conditions, to be able to predict cold-induced MRglu in BAT, which support previ-ous studies23,24,26,27 and show higher correlation coefficients than the prior studies. Two possible reasons for the higher correlation coefficients obtained in the present study might be that the measurements during warm and cold conditions were performed on the same day instead of separate days23,24 and the use of the physiologically quantitative MRglu as opposed to the semi-quantitative SUV26,27 to represent BAT glucose metabolism. The cor-relation coefficients were also stronger than those previously published by our research group from the same cohort, but where total sBAT-MRglu (i.e. summed over all sBAT voxels) was used in linear regression analysis together with baseline sBAT-FF30, suggesting mean FF to be more suitable for prediction of mean than total MRglu of BAT. However, our results diverge from those of three other studies, reporting no correlation during differ-ent temperature conditions14,21,22. The discordance is possibly related to the choice of representing BAT glucose metabolism by semi-quantitative estimates, instead of quantitative, and/or to the choice of studying BAT glucose metabolism during warm conditions. The difference between the studies might also be related to MR protocol design and signal model. In addition to associations within sBAT, this study demonstrated negative correlations between SAT-FF and SAT-MRglu. Although weaker compared to those of sBAT, they sustained for all temperature conditions of the FF measurement and might be due to e.g. considerable amounts of brown adipocytes being present in SAT and/or to non-BAT related properties. Such properties could be e.g. a relatively strong positive correlation between sBAT-FF and SAT-FF (Fig. S1B, Supplemental material) combined with a negative associa-tion between sBAT-FF and glucose tolerance, as previously observed in adolescents by our research group34. The relationship between SAT-FF and SAT-MRglu might also be influenced by technical limitations such as differ-ences in spatial resolution and partial volume effects between PET and MRI or to subjects moving during image acquisition, all leading to slight mismatches between the MRglu and FF measurements.
Within sBAT at baseline, there was no difference between sBATHI-FF and sBATLO-FF and both subregions showed negative correlations with MRglu. During cold exposure (cold scan 1), sBATHI-FF was lower compared to sBATLO-FF, which agrees with a recent study27 but disagrees with another, reporting no general difference between parts of the depot exhibiting high and low [18F]FDG-SUV25. During prolonged cooling (cold scan 2), there was a trend of lower sBATHI-FF compared to sBATLO-FF, which ceased during reheating. Overall, the results indicate regional differences in sBAT-FF related to MRglu, possibly due to a heterogenous brown adipocyte content. These regional differences were subtle, maybe because cold-induced increases in perfusion, blood volume and lipid consumption can occur within the whole depot despite higher MRglu in some subregions than others. It could also have technical origins, e.g. differences in spatial resolution and partial volume effects between PET and MRI or to subjects moving during image acquisition, leading to mismatches between the MRglu and FF measurements.
10
Vol:.(1234567890)
Scientific Reports | (2021) 11:14955 | https://doi.org/10.1038/s41598-021-87768-w
www.nature.com/scientificreports/
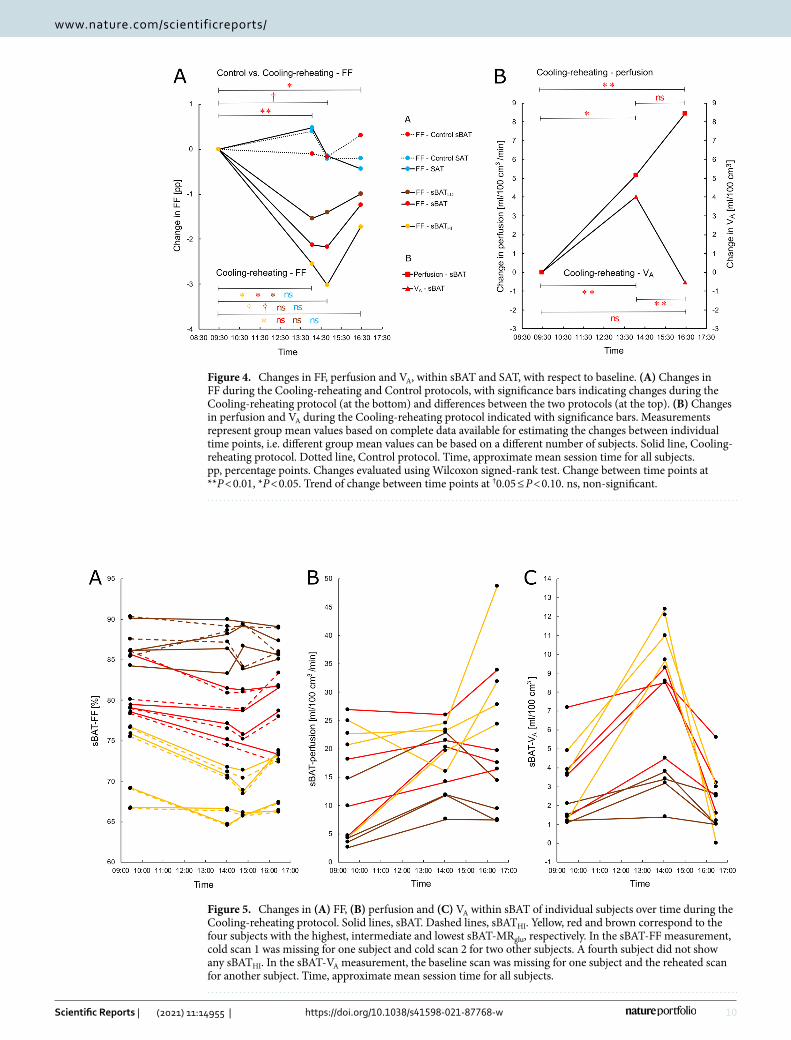
Figure 4. Changes in FF, perfusion and VA, within sBAT and SAT, with respect to baseline. (A) Changes in FF during the Cooling-reheating and Control protocols, with significance bars indicating changes during the Cooling-reheating protocol (at the bottom) and differences between the two protocols (at the top). (B) Changes in perfusion and VA during the Cooling-reheating protocol indicated with significance bars. Measurements represent group mean values based on complete data available for estimating the changes between individual time points, i.e. different group mean values can be based on a different number of subjects. Solid line, Cooling-reheating protocol. Dotted line, Control protocol. Time, approximate mean session time for all subjects. pp, percentage points. Changes evaluated using Wilcoxon signed-rank test. Change between time points at **P < 0.01, *P < 0.05. Trend of change between time points at †0.05 ≤ P < 0.10. ns, non-significant.
Figure 5. Changes in (A) FF, (B) perfusion and (C) VA within sBAT of individual subjects over time during the Cooling-reheating protocol. Solid lines, sBAT. Dashed lines, sBATHI. Yellow, red and brown correspond to the four subjects with the highest, intermediate and lowest sBAT-MRglu, respectively. In the sBAT-FF measurement, cold scan 1 was missing for one subject and cold scan 2 for two other subjects. A fourth subject did not show any sBATHI. In the sBAT-VA measurement, the baseline scan was missing for one subject and the reheated scan for another subject. Time, approximate mean session time for all subjects.
11
Vol.:(0123456789)
Scientific Reports | (2021) 11:14955 | https://doi.org/10.1038/s41598-021-87768-w
www.nature.com/scientificreports/
The inconsistent results between our study and the previous PET/MRI study25 might be technology-related, e.g. due to the use of MRglu vs. [18F]FDG-SUV and/or to differences in MRI protocol parameters.
At the end of ~ 3 h of cold exposure, a decrease in sBAT-FF was observed. This agrees with a previous 1.5 T MRI-only study by our research group, based on a similar cohort and Cooling-reheating protocol11, but more modest than other past work (− 2.9 pp/h12, − 4.7 pp/h13). The discrepancies could be related to differences in image acquisition, segmentation and/or cooling protocol. The decrease in sBATHI-FF did not differ from that in sBATLO-FF. sBAT-perfusion increased by ~ 40% and sBAT-VA by ~ 150% during cold exposure, from initial low values. Increases in perfusion of up to ~ 110%15–17 and in VA of ~ 70–210%17 have previously been observed by other groups. These increases reflect elevated blood supply by an increase in arterial blood volume possibly accompanied by an increase in blood flow velocity. During prolonged cold exposure (cold scan 2 in the present study), there was only a trend of decreased sBAT-FF compared to baseline, which was strong in sBATHI but negligible in sBATLO. The change in sBATHI was larger than in sBATLO. Some trends and non-significant results obtained during prolonged cold exposure seemingly contradicted those during initial cold exposure. However, inconsistencies could have resulted from the limited statistical power obtained from studying only 12 individu-als. Overall, the results at least indicate a larger cold-induced decrease in sBATHI-FF compared to sBATLO-FF. During reheating, the cold-induced decrease in sBAT-FF tended to normalize. This observation differs from that of our previous 1.5 T MRI-only study, where a sustained low sBAT-FF was obtained during reheating11. The reasons for the discrepancy are not known. One hypothesis is that the longer reheating time in the present study (~ 1 h 20 min) was sufficient for enabling a noticeable replenishment of intracellular lipids in BAT and, as a con-sequence, an underestimation of lipid consumption compared to the previous study (reheating time ~ 30 min). To date, the knowledge of the time frame for intracellular lipid replenishment in human brown adipocytes dur-ing warm conditions, after cold expose, is very limited. Dedicated studies using fatty acid tracers undergoing esterification in the brown adipocytes, e.g. [11C]palmitate, could elucidate this research question. An alternative hypothesis is that the shorter reheating time of the previous study was too brief for normalization of the cold-induced increase in water content, related to increased arterial blood volume, as opposed to the present study.
The Cooling-reheating protocol is based on the following assumptions11: 1) BAT perfusion (and associated blood volume) is relatively rapidly regulated and therefore likely to regress by short reheating after cold exposure. 2) Lipid content is relatively slowly regulated and therefore not regressing during the same reheating time. The first assumption of fast normalization of perfusion was not supported by the present study as sBAT-perfusion remained elevated during reheating. However, sBAT-VA, a parameter more directly related to sBAT water content and sBAT-FF than sBAT-perfusion, normalized during the same conditions (note the longer reheating time in the present vs. the original study11). In the present study, there was no significant decrease in sBAT-FF between baseline and reheating. However, this result was based on subjects with a relatively large spread of mean sBAT-MRglu. When considering sBATHI only, the decrease between baseline and reheating was significant. Altogether, these results indicated the decrease in sBATHI-FF, observed during reheating (vs. baseline), to likely be due to lipid consumption. However, the influence of perfusion and blood volume, on the changes in FF observed during cold exposure, could not be ruled out. These conclusions were supported by a significant negative correlation between the changes in sBAT-VA and sBAT-FF, measured between baseline and cold exposure, but not between the changes measured between baseline and reheating or between cold exposure and reheating. To our knowl-edge, this study is the first to apply repeated PET perfusion measurements during a Cooling-reheating protocol for determining the changes in FF as being related to perfusion (and blood volume) or lipid consumption. The reason for the contradictory pattern of sustained high sBAT-perfusion and normalized sBAT-VA during reheat-ing is not known. The observation could reflect a normalization of the number of blood-supplying arterioles
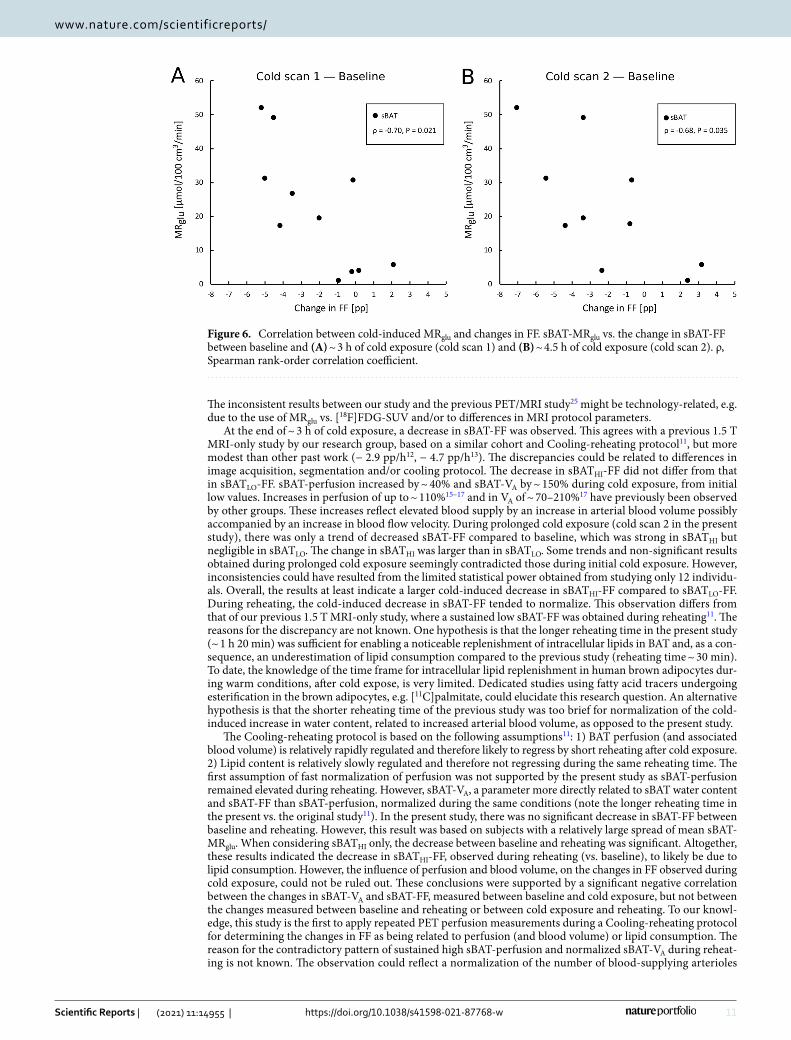
Figure 6. Correlation between cold-induced MRglu and changes in FF. sBAT-MRglu vs. the change in sBAT-FF between baseline and (A) ~ 3 h of cold exposure (cold scan 1) and (B) ~ 4.5 h of cold exposure (cold scan 2). ρ, Spearman rank-order correlation coefficient.
12
Vol:.(1234567890)
Scientific Reports | (2021) 11:14955 | https://doi.org/10.1038/s41598-021-87768-w
www.nature.com/scientificreports/
and capillaries in sBAT concomitant with an increase in blood flow velocity in remaining vessels, representing a residual effect of the cold-induced increase in metabolic turnover.
Between the time points of baseline and each of the succeeding three scans, the changes in sBAT-FF were significantly larger, or tended to be larger, during the Cooling-reheating protocol compared to the Control pro-tocol. This supports the notion that the changes, observed during the temperature intervention, were associated with cold-induced BAT MRglu and not with other study-related procedures, e.g. the length of fasting.
In both warm and cold conditions, sBAT-FF was lower compared to SAT-FF, which agrees with the literature20,21,23,35. SAT-FF did not change between baseline and cold exposure but decreased between cold scan 1 and 2, likely due to the supine position of the subjects in-between the two scans as described previously11. It can be concluded that SAT-FF exhibits a different pattern than sBAT-FF during cooling and reheating, which is visible in Fig. 4A. The difference is probably related to the tissue contents of brown adipocytes but might also be non-BAT-related, e.g. due to the study procedure involving a supine position of the subjects during scanning. The present study showed slightly higher estimates of perfusion but similar estimates of VA as previous studies15–17 but a lack of association between perfusion and MRglu during cold exposure, as opposed to one of these previ-ous studies15. The reason for this disparity is not known. sBAT-perfusion and sBAT-VA during reheating were estimated approximately one half-life of 18F after the administration of [18F]FDG. However, residual [18F]FDG is not expected to have influenced the perfusion and VA results considerably as this was corrected for.
This study has some shortcomings. The small cohort led to limited statistical power, possibly causing type II errors. Such errors could be responsible for some seemingly ambiguous results, e.g. sBAT-FF decreased between baseline and cold scan 1 (− 2.13 pp, P = 0.024, n = 11) but only tended to decrease between baseline and cold scan 2 (− 2.17 pp, P = 0.064, n = 10). Another related limitation was that of missing data, which resulted in statisti-cal analyses based on different subjects at different time points. The cooling protocol aimed at similar cooling conditions in all individuals, at a level slightly above the self-reported limit of shivering. However, as shivering was only subjectively assessed and as shivering in e.g. deep muscles can be difficult or impossible to perceive, an inter-subject variability in the cold stimulus directly affecting MRglu was likely to have occurred, which is a limitation that needs to be emphasized. An individualized cooling protocol, standardized with respect to objective measurements of heat loss (by e.g. skin temperature) and heat production (by e.g. indirect calorimetry), could more reliably have ensured an adequate level of cold stimulation of BAT in each individual and more equal and repeatable cooling conditions of the subjects. Moreover, reheating was performed according to a fixed procedure, without attempts of individual adaption and without objective measurements, also leading to inter-subject dif-ferences in the amount of reheating experienced. Although more objective and personalized settings would have been preferred, they were considered as difficult to fit into the already comprehensive study protocol and were therefore omitted. The glucose analogue tracer [18F]FDG is well-established for in vivo imaging of human BAT, with previous studies indicating positive relationships between cold-induced glucose metabolism and NST in BAT24,29. Such relationships are exemplified by e.g. a positive correlation between cold-induced BAT [18F]FDG-SUVmax and the cold-induced increase in energy expenditure29, a lower cold-induced decrease in supraclavicular skin temperature of subjects with visually detectable compared to non-detectable BAT (from [18F]FDG-PET)29, and a positive correlation between the difference in cold-induced MRglu between BAT and WAT and the cold-induced temperature increase in BAT (assessed with MRS)24. Despite these relationships, [18F]FDG does not explicitly measure the thermogenic state of BAT (i.e. NST), for which oxidative metabolism tracers such as [15O]O2 and [11C]acetate could be suitable alternatives. However, logistic and technical challenges associated with these tracers make them difficult to use in already complex and lengthy protocols such as in this study. No correction for multiple comparison was applied to the results, which might have led to type I errors. However, when mul-tiple tests were performed on similar variables and their results pointed to the same conclusions and/or were in line with the literature, the results were considered as complementary rather than as probable random findings.
A strength of this study was the possibility of simultaneous MRI and PET within a single session. Despite this opportunity, the entire study protocol was long and challenging for the subjects, which likely influenced study compliance. Slight misalignments between MRI and PET within one session were observed and reduced by rigid image registration (see “Image post-processing” section). Another strength of this study was the inclu-sion of a control protocol, which enabled the changes in FF to be determined as being induced by temperature and not by other study-related procedures. As measurements during warm and cold conditions were performed within the same day in the present study, potential influence from day-to-day or long-term alterations in BAT could be avoided.
ConclusionMean FF of the anatomically defined sBAT depot could be used to predict its cold-induced BAT metabolic rate of glucose, regardless of temperature condition preceding the FF estimation. The Cooling-reheating protocol was shown useful for studying changes in the lipid concentration biomarker sBAT-FF, related to warm and cold conditions. The FF decreases observed at the end of reheating were mainly due to lipid consumption, but could potentially be underestimated due to intracellular lipid replenishment. The influence of perfusion and blood volume, on the changes in FF observed during cold exposure, could not be ruled out.
Data availabilityThe data sets generated and analysed during the current study are available from the corresponding author at reasonable request, unless the requested sharing is conflicting with the approved ethics application.
Received: 4 June 2020; Accepted: 15 March 2021
13
Vol.:(0123456789)
Scientific Reports | (2021) 11:14955 | https://doi.org/10.1038/s41598-021-87768-w
www.nature.com/scientificreports/
References 1. Cypess, A. M. & Kahn, C. R. Brown fat as a therapy for obesity and diabetes. Curr. Opin. Endocrinol. Diabetes Obes. 17, 143–149.
https:// doi. org/ 10. 1097/ MED. 0b013 e3283 37a81f (2010). 2. Wu, J., Cohen, P. & Spiegelman, B. M. Adaptive thermogenesis in adipocytes: is beige the new brown?. Genes Dev. 27, 234–250.
https:// doi. org/ 10. 1101/ gad. 211649. 112 (2013). 3. Saito, M. et al. High incidence of metabolically active brown adipose tissue in healthy adult humans: effects of cold exposure and
adiposity. Diabetes 58, 1526–1531. https:// doi. org/ 10. 2337/ db09- 0530 (2009). 4. Vijgen, G. H. et al. Brown adipose tissue in morbidly obese subjects. PLoS ONE 6, e17247. https:// doi. org/ 10. 1371/ journ al. pone.
00172 47 (2011). 5. Chondronikola, M. et al. Brown adipose tissue improves whole-body glucose homeostasis and insulin sensitivity in humans.
Diabetes 63, 4089–4099. https:// doi. org/ 10. 2337/ db14- 0746 (2014). 6. Chen, K. Y. et al. Brown Adipose reporting criteria in imaging STUDIES (BARCIST 10): recommendations for standardized
FDG-PET/CT Experiments In Humans. Cell Metab. 24, 210–222. https:// doi. org/ 10. 1016/j. cmet. 2016. 07. 014(2016) (2016). 7. Borga, M. et al. Brown adipose tissue in humans: detection and functional analysis using PET (positron emission tomography),
MRI (magnetic resonance imaging), and DECT (dual energy computed tomography). Methods Enzymol. 537, 141–159. https:// doi. org/ 10. 1016/ B978-0- 12- 411619- 1. 00008-2 (2014).
8. Baba, S., Jacene, H. A., Engles, J. M., Honda, H. & Wahl, R. L. CT Hounsfield units of brown adipose tissue increase with activa-tion: preclinical and clinical studies. J. Nuclear Med. Off. Publ. Soc. Nuclear Med. 51, 246–250. https:// doi. org/ 10. 2967/ jnumed. 109. 068775 (2010).
9. Hu, H. H., Chung, S. A., Nayak, K. S., Jackson, H. A. & Gilsanz, V. Differential computed tomographic attenuation of metabolically active and inactive adipose tissues: preliminary findings. J. Comput. Assist. Tomogr. 35, 65–71. https:// doi. org/ 10. 1097/ RCT. 0b013 e3181 fc2150 (2011).
10. Ouellet, V. et al. Brown adipose tissue oxidative metabolism contributes to energy expenditure during acute cold exposure in humans. J. Clin. Investig. 122, 545–552. https:// doi. org/ 10. 1172/ JCI60 433 (2012).
11. Lundström, E. et al. Magnetic resonance imaging cooling-reheating protocol indicates decreased fat fraction via lipid consumption in suspected brown adipose tissue. PLoS ONE 10, e0126705. https:// doi. org/ 10. 1371/ journ al. pone. 01267 05 (2015).
12. Stahl, V. et al. In vivo assessment of cold stimulation effects on the fat fraction of brown adipose tissue using DIXON MRI. JMRI 45, 369–380. https:// doi. org/ 10. 1002/ jmri. 25364 (2017).
13. Coolbaugh, C. L., Damon, B. M., Bush, E. C., Welch, E. B. & Towse, T. F. Cold exposure induces dynamic, heterogeneous alterations in human brown adipose tissue lipid content. Sci. Rep. 9, 13600. https:// doi. org/ 10. 1038/ s41598- 019- 49936-x (2019).
14. Deng, J. et al. MRI characterization of brown adipose tissue under thermal challenges in normal weight, overweight, and obese young men. JMRI 47, 936–947. https:// doi. org/ 10. 1002/ jmri. 25836 (2018).
15. Orava, J. et al. Different metabolic responses of human brown adipose tissue to activation by cold and insulin. Cell Metab. 14, 272–279. https:// doi. org/ 10. 1016/j. cmet. 2011. 06. 012 (2011).
16. Muzik, O. et al. 15O PET measurement of blood flow and oxygen consumption in cold-activated human brown fat. J. Nuclear Med. Off. Publ. Soc. Nuclear Med. 54, 523–531. https:// doi. org/ 10. 2967/ jnumed. 112. 111336 (2013).
17. Din, M. et al. Human brown fat radiodensity indicates underlying tissue composition and systemic metabolic health. J. Clin. Endocrinol. Metab. 102, 2258–2267. https:// doi. org/ 10. 1210/ jc. 2016- 2698 (2017).
18. Blondin, D. P. et al. Inhibition of intracellular triglyceride lipolysis suppresses cold-induced brown adipose tissue metabolism and increases shivering in humans. Cell Metab. 25, 438–447. https:// doi. org/ 10. 1016/j. cmet. 2016. 12. 005 (2017).
19. Hu, H. H., Perkins, T. G., Chia, J. M. & Gilsanz, V. Characterization of human brown adipose tissue by chemical-shift water-fat MRI. AJR 200, 177–183. https:// doi. org/ 10. 2214/ ajr. 12. 8996 (2013).
20. Gifford, A., Towse, T. F., Walker, R. C., Avison, M. J. & Welch, E. B. Characterizing active and inactive brown adipose tissue in adult humans using PET-CT and MR imaging. Am. J. Physiol. Endocrinol. Metab. 311, E95–E104. https:// doi. org/ 10. 1152/ ajpen do. 00482. 2015 (2016).
21. van Rooijen, B. D. et al. Imaging cold-activated brown adipose tissue using dynamic T2*-weighted magnetic resonance imaging and 2-deoxy-2-[18F]fluoro-D-glucose positron emission tomography. Invest. Radiol. 48, 708–714. https:// doi. org/ 10. 1097/ RLI. 0b013 e3182 9363b8 (2013).
22. Franz, D. et al. Discrimination between brown and white adipose tissue using a 2-point dixon water-fat separation method in simultaneous PET/MRI. J. Nuclear Med. Off. Publ. Soc. Nuclear Med. 56, 1742–1747. https:// doi. org/ 10. 2967/ jnumed. 115. 160770 (2015).
23. Holstila, M. et al. MR signal-fat-fraction analysis and T2* weighted imaging measure BAT reliably on humans without cold expo-sure. Metabolism: clinical and experimental 70, 23–30, doi:https:// doi. org/ 10. 1016/j. metab ol. 2017. 02. 001 (2017).
24. Koskensalo, K. et al. Human Brown Adipose Tissue Temperature and Fat Fraction Are Related to Its Metabolic Activity. J. Clin. Endocrinol. Metab. 102, 1200–1207. https:// doi. org/ 10. 1210/ jc. 2016- 3086 (2017).
25. McCallister, A., Zhang, L., Burant, A., Katz, L. & Branca, R. T. A pilot study on the correlation between fat fraction values and glucose uptake values in supraclavicular fat by simultaneous PET/MRI. Magn. Reson. Med. 78, 1922–1932. https:// doi. org/ 10. 1002/ mrm. 26589 (2017).
26. Sun, L. et al. Brown Adipose Tissue: Multimodality Evaluation by PET, MRI, Infrared Thermography, and Whole-Body Calorimetry (TACTICAL-II). Obesity (Silver Spring, Md.) 27, 1434–1442, https:// doi. org/ 10. 1002/ oby. 22560 (2019).
27. Fischer, J. G. W. et al. Comparison of [(18)F]FDG PET/CT with magnetic resonance imaging for the assessment of human brown adipose tissue activity. EJNMMI Res. 10, 85. https:// doi. org/ 10. 1186/ s13550- 020- 00665-7 (2020).
28. Chen, K. Y. et al. Brown Adipose Reporting Criteria in Imaging STudies (BARCIST 1.0): Recommendations for Standardized FDG-PET/CT Experiments in Humans. Cell Metab. 24, 210–222. https:// doi. org/ 10. 1016/j. cmet. 2016. 07. 014 (2016).
29. Yoneshiro, T. et al. Brown adipose tissue, whole-body energy expenditure, and thermogenesis in healthy adult men. Obesity (Silver Spring, Md.) 19, 13–16, https:// doi. org/ 10. 1038/ oby. 2010. 105 (2011).
30. Andersson, J. et al. Estimating the cold-induced brown adipose tissue glucose uptake rate measured by (18)F-FDG PET using infrared thermography and water-fat separated MRI. Sci. Rep. 9, 12358. https:// doi. org/ 10. 1038/ s41598- 019- 48879-7 (2019).
31. Ohtake, T. et al. Noninvasive method to obtain input function for measuring tissue glucose utilization of thoracic and abdominal organs. J. Nuclear Med. Off. Publ. Soc. Nuclear Med. 32, 1432–1438 (1991).
32. Berglund, J. & Kullberg, J. Three-dimensional water/fat separation and T2* estimation based on whole-image optimization-application in breathhold liver imaging at 1.5 T. Magn. Reson. Med. 67, 1684–1693, https:// doi. org/ 10. 1002/ mrm. 23185 (2012).
33. Lundström, E. et al. Automated segmentation of human cervical-supraclavicular adipose tissue in magnetic resonance images. Sci. Rep. 7, 3064. https:// doi. org/ 10. 1038/ s41598- 017- 01586-7 (2017).
34. Lundström, E. et al. Brown adipose tissue estimated with the magnetic resonance imaging fat fraction is associated with glucose metabolism in adolescents. Pediatr. Obes. 14, e12531. https:// doi. org/ 10. 1111/ ijpo. 12531 (2019).
35. Franz, D. et al. Differentiating supraclavicular from gluteal adipose tissue based on simultaneous PDFF and T2 * mapping using a 20-echo gradient-echo acquisition. JMRI 50, 424–434. https:// doi. org/ 10. 1002/ jmri. 26661 (2019).
14
Vol:.(1234567890)
Scientific Reports | (2021) 11:14955 | https://doi.org/10.1038/s41598-021-87768-w
www.nature.com/scientificreports/
AcknowledgementsThis study was funded by the Swedish Research Council (2016-01040), the Swedish Heart-Lung Foundation (2170492), Excellence of diabetes research in Sweden (Exodiab) and Agreement on medical education and research (ALF). We gratefully acknowledge the willingness of the volunteers to participate. At Uppsala University Hospital, we thank Gunnar Antoni and Uppsala PET Centre for providing [15O]water, and the Department of Radiology and Uppsala PET Centre for the cooperation during the study. At Uppsala University we thank nurses and PET/MR operators for their contribution to this study.
Author contributionsE.L., J.A., M.L., H.A and J.K. participated in the study design. M.E. assisted in MRI protocol design. E.L., J.A. and J.K. participated in data acquisition. E.L and J.A. developed the methods and software for MR image analysis. R.S. assisted in development of the image analysis methods. M.L. performed compartment modelling of the PET data. H.A. helped in interpretation of the images. E.L. performed the statistical analysis and drafted most of the manuscript. All authors critically reviewed and approved the final manuscript.
FundingOpen access funding provided by Uppsala University.
Competing interests J.K. and H.A., cofounders and stockholders of Antaros Medical where they are also employed part-time. M.E., employed by GE Healthcare. M.L., cofounder of and employed part-time by Medtrace Pharma AS. M.L. and H.A. have received speaking fees and research support from GE Healthcare. J.K. has received speaking fees from Philips Healthcare. Remaining authors, no conflicts of interest.
Additional informationSupplementary Information The online version contains supplementary material available at https:// doi. org/ 10. 1038/ s41598- 021- 87768-w.
Correspondence and requests for materials should be addressed to E.L.
Reprints and permissions information is available at www.nature.com/reprints.
Publisher’s note Springer Nature remains neutral with regard to jurisdictional claims in published maps and institutional affiliations.
Open Access This article is licensed under a Creative Commons Attribution 4.0 International License, which permits use, sharing, adaptation, distribution and reproduction in any medium or
format, as long as you give appropriate credit to the original author(s) and the source, provide a link to the Creative Commons licence, and indicate if changes were made. The images or other third party material in this article are included in the article’s Creative Commons licence, unless indicated otherwise in a credit line to the material. If material is not included in the article’s Creative Commons licence and your intended use is not permitted by statutory regulation or exceeds the permitted use, you will need to obtain permission directly from the copyright holder. To view a copy of this licence, visit http:// creat iveco mmons. org/ licen ses/ by/4. 0/.
© The Author(s) 2021