Embed Size (px)
Citation preview
Comparison of the combined placido disc-Scheimpflug
and the Scheimpflug-only imaging systems for the
assessment of anterior segment
Yakov Goldich MD, Reut Singer MD, Cornelius Nasser MD,David Zadok MD, Isaac Avni MD
Department of Ophthalmology Assaf Harofeh Medical Center
Israel
The authors have no conflicts of interest and no financial interest in the article’s subject matter or methods mentioned.

Background
•Corneal topography and thickness are important in diagnosing and evaluating progression of corneal ectatic disorders.
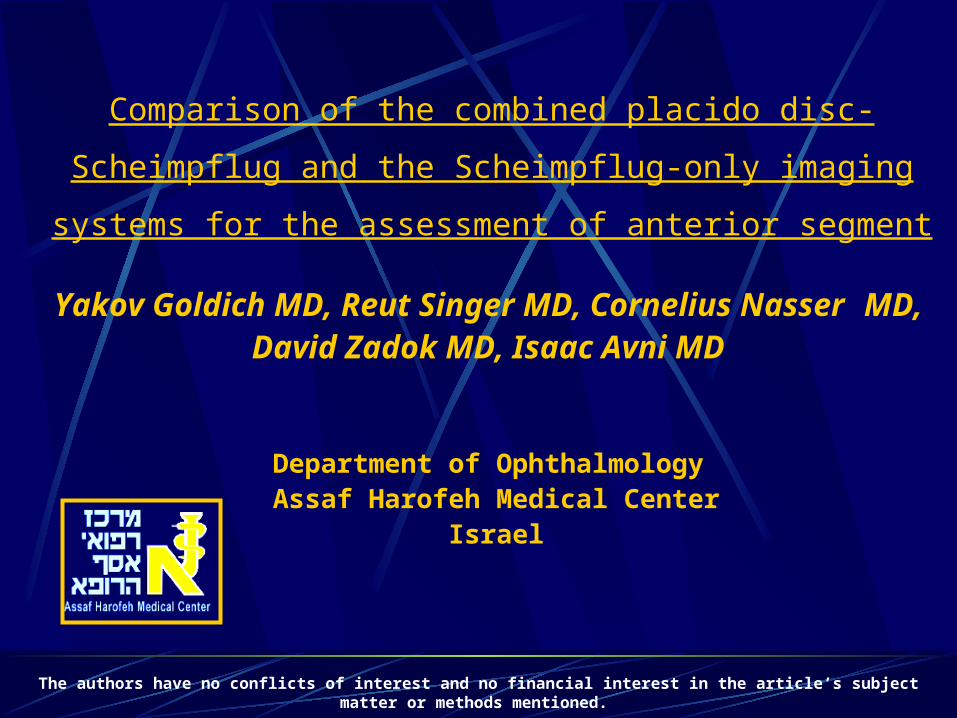
Background• The Sirius topography system
(CSO, Italy) is a new device that uses the combination of two, 360-degree rotating Scheimpflug cameras and a Placido disk principles.
• It provides, in a single scan, anterior segment imaging and measurements, anterior and posterior corneal topography, complete corneal pachymetry and wavefront analysis.
Purpose
• The purpose of this study was to report our initial experience with the Sirius topography system, to assess repeatability of its measurements and to assess the agreement with Pentacam's (Oculus, Germany) measurements.
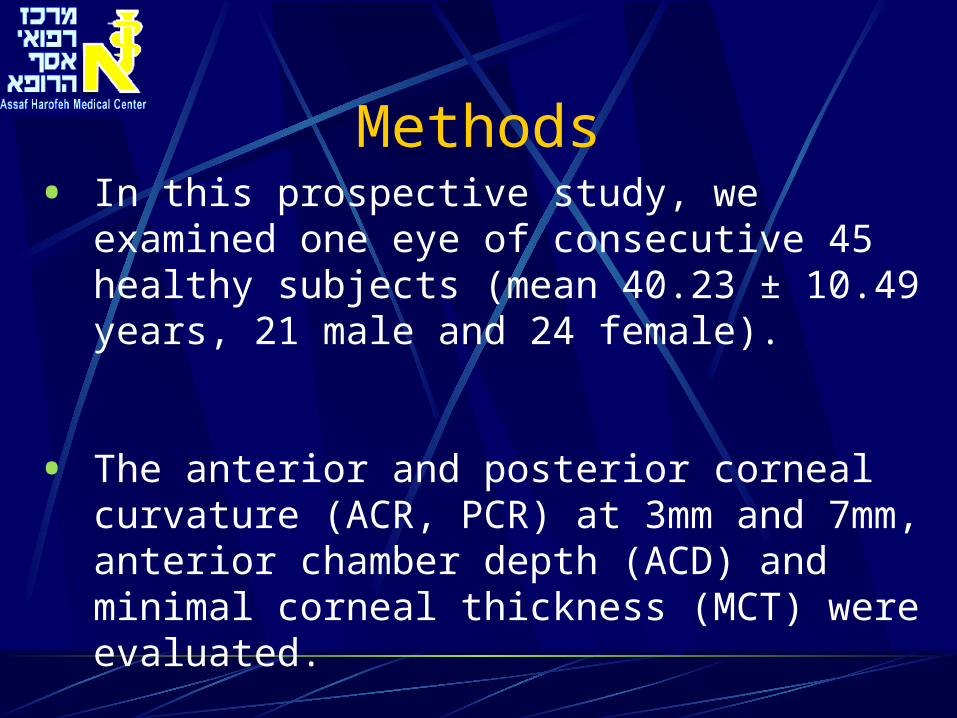
Methods• In this prospective study, we examined one
eye of consecutive 45 healthy subjects (mean 40.23 ± 10.49 years, 21 male and 24 female).
• The anterior and posterior corneal curvature (ACR, PCR) at 3mm and 7mm, anterior chamber depth (ACD) and minimal corneal thickness (MCT) were evaluated.

Methods
• Evaluation of the repeatability of the Sirius was performed by calculating the coefficient of variation (CV).
CV was defined as the SD of the difference from the mean of the repeat measurements divided by the mean response.
For each measured parameter we calculated the coefficients of variation of each one of the subjects.
The mean of these coefficients of variation was defined as the mean coefficient of variation of the specific parameter.
• Assessment of the agreement between the Sirius and the Pentacam was performed by calculating the 95% limits of agreement (LoA) and plotting Bland-Altman graphs.
Results
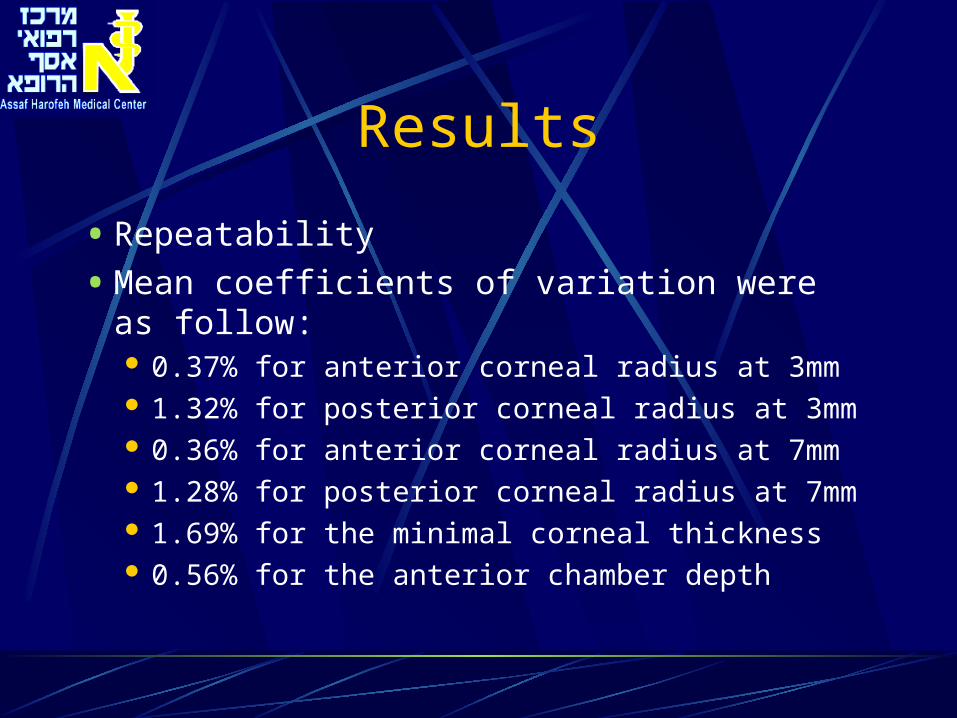
• Repeatability
• Mean coefficients of variation were as follow: 0.37% for anterior corneal radius at 3mm 1.32% for posterior corneal radius at 3mm 0.36% for anterior corneal radius at 7mm 1.28% for posterior corneal radius at 7mm 1.69% for the minimal corneal thickness 0.56% for the anterior chamber depth
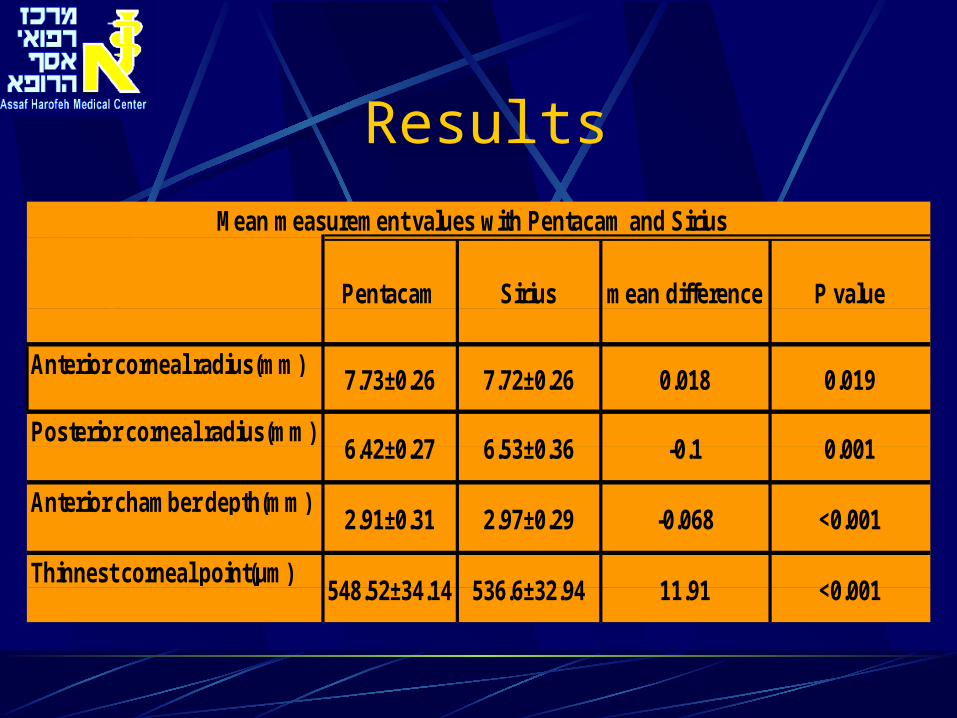
ResultsMean measurement values with Pentacam and Sirius
P valuemean differenceSiriusPentacam
Anterior corneal radius(mm)
Posterior corneal radius(mm)
Anterior chamber depth(mm)
Thinnest corneal point(µm)
6.53±0.36
2.97±0.29
536.6±32.94
7.73±0.26
6.42±0.27
2.91±0.31
548.52±34.14
0.019
0.001
<0.001
<0.001
0.018
-0.1
-0.068
11.91
7.72±0.26
Results
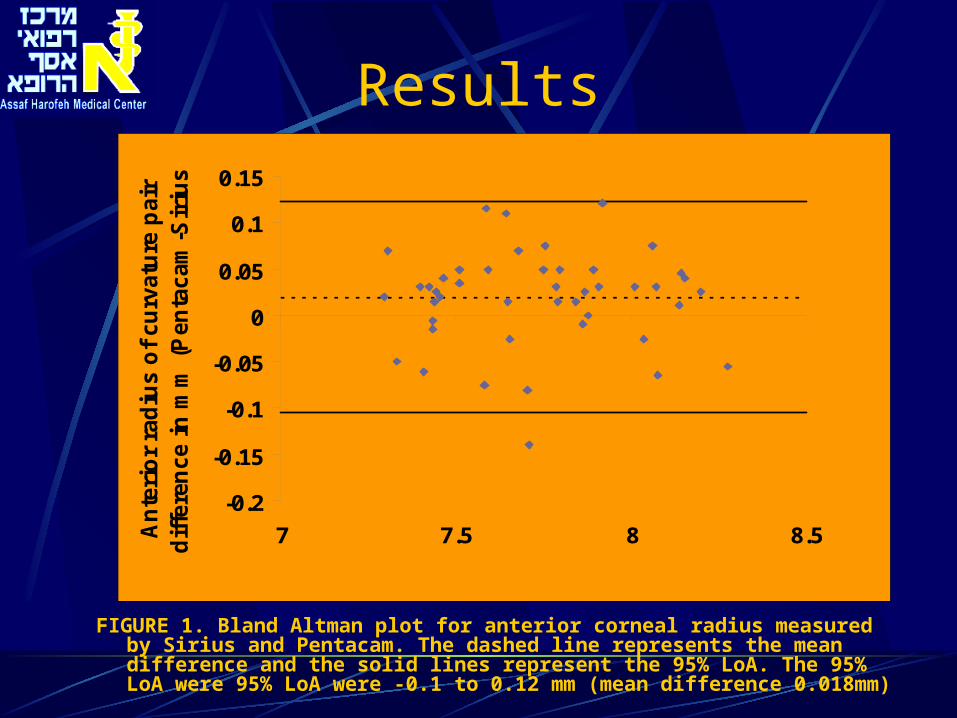
FIGURE 1. Bland Altman plot for anterior corneal radius measured by Sirius and Pentacam. The dashed line represents the mean difference and the solid lines represent the 95% LoA. The 95% LoA were 95% LoA were -0.1 to 0.12 mm (mean difference 0.018mm)
-0.2
-0.15
-0.1
-0.05
0
0.05
0.1
0.15
7 7.5 8 8.5An
teri
or
rad
ius o
f cu
rvatu
re p
air
d
iffe
ren
ce i
n m
m (
Pen
tacam
-Sir
ius)
Mean of Pentacam and Sirius (mm)
Results
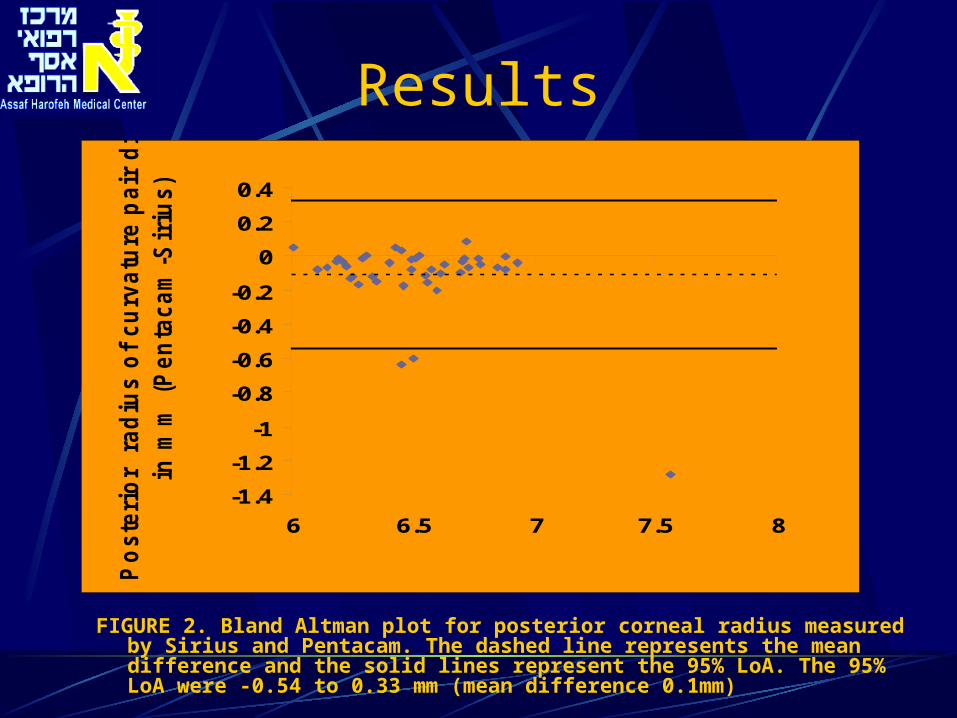
FIGURE 2. Bland Altman plot for posterior corneal radius measured by Sirius and Pentacam. The dashed line represents the mean difference and the solid lines represent the 95% LoA. The 95% LoA were -0.54 to 0.33 mm (mean difference 0.1mm)
-1.4
-1.2
-1
-0.8
-0.6
-0.4
-0.2
0
0.2
0.4
6 6.5 7 7.5 8
Po
ste
rio
r r
ad
ius o
f cu
rvatu
re p
air
dif
fere
nce
in m
m (
Pen
tacam
-Sir
ius)
Mean of Pentacam and Sirius (mm)
Results
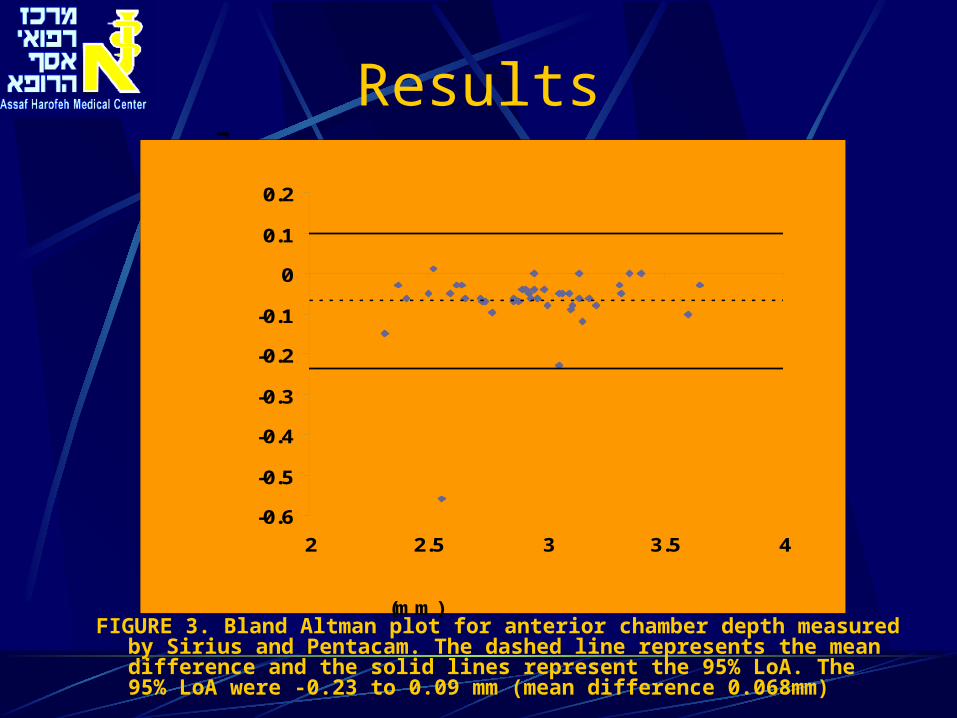
FIGURE 3. Bland Altman plot for anterior chamber depth measured by Sirius and Pentacam. The dashed line represents the mean difference and the solid lines represent the 95% LoA. The 95% LoA were -0.23 to 0.09 mm (mean difference 0.068mm)
-0.6
-0.5
-0.4
-0.3
-0.2
-0.1
0
0.1
0.2
2 2.5 3 3.5 4
Mean of Pentacam and Sirius (mm)
An
teri
or
ch
am
ber
dep
th p
air
dif
fere
nce
in m
m (
Pen
tacam
- S
iriu
s )

Results
FIGURE 4. Bland Altman plot for thinnest corneal point measured by Sirius and Pentacam. The dashed line represents the mean difference and the solid lines represent the 95% LoA. The 95% LoA were -9.61 to 33.44 µm (mean difference 11.91µm)
-20
-10
0
10
20
30
40
50
60
400 500 600 700
Min
imal
co
rnea
l th
ickn
ess
pai
r d
iffe
ren
ce i
n µ
m (
Pen
taca
m-
Sir
ius)
Mean of Pentacam and Sirius (µm)

Conclusions
• The Sirius showed good to excellent repeatability for all measured parameters.
• The observed agreement with Pentacam for each parameter should be considered for each particular clinical application.
• The clinician should determine whether the difference between the two devices is clinically significant.
• We recommend these devices should not be used interchangeably.
Correspondence: Yakov Goldich MD, E-mail: [email protected]