Embed Size (px)
Citation preview
Faculty of engineering
Department of chemical engineering
De Croylaan 46, B-3001 Heverlee, Belgium
Comparison of the environmental impact of
the incineration of calorific industrial waste
in a rotary kiln and a cement kiln in view of
fuel substitution.
Isabel Vermeulen
Jo van Caneghem
Chantal Block
Carlo Vandecasteele
Study conducted by order of
EURITS
December 2009
1
Management summary
Introduction
This project compares from an environmental point of view, the incineration of industrial
waste (mainly high calorific, but also medium calorific waste) in a specialised waste
incinerator (rotary kiln) and the co-incineration in a cement kiln (dry process). In both cases,
the objective is substitution of fuel by calorific waste, in order to avoid resource depletion and
to save costs. The comparative study can help to decide in which type of installation, cement
kiln or rotary kiln, a given amount of industrial calorific waste can best be incinerated from an
environmental point of view.
The study starts from the (obvious) viewpoint that the function of a specialised rotary kiln
incinerator is to incinerate difficult industrial waste (mainly toxic, medical, hazardous, and
otherwise difficult to treat industrial waste) in the best environmental conditions. Moreover, it
generates steam or electricity as a by-product. The function of a cement kiln, on the other
hand, is to produce clinker, in the best possible process conditions. Both processes need large
amounts of fuel to obtain the high temperatures required. Substitution of fuel in a rotary kiln
by calorific industrial waste is considered comparable to substitution of fuel in a cement kiln,
despite intrinsic differences between both processes.
The functional unit of the study is the incineration of 1 ton of industrial high or medium
calorific waste, which substitutes an equivalent energetic amount of fossil fuel. Three types of
industrial calorific waste are considered: industrial sludge, automotive shredder residue and
high calorific solvents. All three are currently used as fuel substitutes in both rotary kilns and
cement kilns in Belgium and cover different calorific ranges and toxicity levels.
Methodology
In order to help judging in which type of installation a specific high or medium calorific
industrial waste can best be incinerated from an environmental point of view, we consider the
following 2 questions:
1. What is the absolute environmental impact due to emissions (and avoided emissions)
related to the incineration of 1 ton of such waste in a cement kiln and in a rotary kiln
incinerator?
The outcome of this comparison reflects the effectiveness of the flue gas cleaning
system, the capability of trapping heavy metals and SO2 (in the clinker or the ashes)
and the energy efficiency of the incinerator.
2
2. When 1 ton of high or medium calorific waste replaces in each process an equivalent
energetic amount of fossil fuel, how does the environmental impact of each process
changes?
This problem is in the first place investigated for the current situation in Belgium: the
actually used fuels, fuel oil (recycled oil to be precise) for rotary kilns and petcokes for
cement kilns, are (partially) substituted by calorific waste. This approach is, however,
biased: there is no guarantee that the actually used fuel is optimal from an
environmental point of view, usually it has merely been selected based on price and
availability. Therefore, in addition, the change of environmental impact when other
types of fossil fuel would have been substituted is estimated.
As both processes have a different function, a simplified model is used to study the
environmental impact of the emissions related to the incineration of 1 ton calorific waste in
both kilns. Both processes are characterised by a main function or product (destruction of
hazardous waste for the rotary kiln and clinker production for the cement kiln); due to these
activities pollutants are emitted and by-products (heat and solid residues) are formed
Emissions due to the collection and transport of waste, investments in buildings, equipment or
flue gas cleaning systems and pre-treatment of the waste were not taken into the scope of the
study. Discharges of waste water were estimated; they are negligible compared to the impact
of air emissions. The environmental impact of the landfill of the solid residues of both
processes is not taken into account, as it is difficult to estimate it accurately.
The study was thus limited to the investigation of the environmental impact of direct
emissions of the process and indirect emissions related to the production of by-products
(steam and electricity).
The following 8 environmental impact categories were considered:
� global warming
� acidification
� photochemical ozone creation
� eutrophication
� human toxicity
� fresh water toxicity
� sea water toxicity
� terrestrial toxicity
Resource depletion as impact category was not studied, since the substitution and thus the
saving of fossil fuels is equal for both processes.
3
The most important emissions to air and the corresponding impact categories are:
� CO2 ~> global warming
� SO2 ~> acidification and photochemical ozone creation
� Fuel NOx ~> acidification, photochemical ozone creation and
eutrophication
• Heavy metals ~> human toxicity, fresh water toxicity, sea water toxicity and
terrestrial toxicity
The input specific emissions were estimated by the use of (linear) transfer coefficients, which
give the ratio of the emissions of an element in one specific output flow, relative to the total
amount of that element in the input. For the rotary kiln these transfer coefficients were
deduced from online and offline measurements, performed at the rotary kiln of Indaver,
Antwerp. These were subsequently compared with literature data, in order to ensure an
accurate and robust set of transfer coefficients. For the cement kiln an extensive literature
search was conducted in order to obtain the transfer coefficients. The transfer coefficients
from different sources agreed satisfactorily, so that the average values could be used. To
estimate fuel-NOx a semi-empirical model was used.
The environmental impact was subsequently deduced from the emissions using the
characterisation factors from the CML-database.
Results
As an answer to question 1, the results showed that for 7 out of 8 of the considered impact
categories, the absolute environmental impact of emissions due to the incineration of
calorific waste in the rotary kiln is considerably smaller than this of emissions due to
incineration of the same waste in a cement kiln. This can be attributed to the better flue gas
cleaning of the specialised incinerator and also to some extent to the avoided emissions due to
steam and electricity production in the specialised incinerator.
As to the change of the environmental impact (question 2): when the actually used fossil fuels
in Belgium are substituted by calorific waste, both systems show in general comparable
changes. When, however, the same reference fuels are (hypothetically) substituted in both
installations, substitution of fuel by calorific waste in a rotary kiln is in general more
advantageous: for global warming the change is the same, for sea water toxicity the cement
kiln is more advantageous, while for all other impact categories (acidification, photochemical
4
ozone creation, eutrophication, human toxicity, fresh water toxicity and terrestrial toxicity)
the rotary kiln is more advantageous. The change of the environmental impact depends
thus strongly on the choice of the reference fuel. When in the incinerators fuel containing a
high amount of carbon or impurities (e.g. the petcoke used as reference fuel in cement kilns),
is substituted by a cleaner (or lower carbon containing) calorific waste, the environmental
impact can be improved. Moreover, this relative improvement will be highest when the
transfer coefficients of the pollutants are highest. On the other hand the installation with the
highest transfer coefficient has also the highest absolute environmental impact (question 1).
Conclusions
It can be concluded that the absolute environmental impact of incineration of calorific waste
in a rotary kiln is for all impact categories (except impact on sea water toxicity) lower than for
a cement kiln. The change of the environmental impact of both installations, when a reference
fuel is replaced by calorific waste, depends strongly on the selected reference fuel. This
shows clearly that the calculations of the absolute environmental impact and of the
change of the environmental impact when fuel is substituted by calorific waste are
complementary and are both required for this comparative study.
Besides, we believe that in an installation first the flue gas cleaning system should be
optimised to achieve a minimal absolute environmental impact. Only afterwards it makes
sense to consider replacing fuel by waste in order to further improve the situation. Moreover,
for such comparisons it is best to start from an optimal fuel from an environmental point of
view, not from one containing much carbon per calorific value or producing a large quantity
of pollutants.
1 AIM ............................................................................................................ 1
2 STARTING POINT................................................................................... 1
3 METHODOLOGY.................................................................................... 3
3.1 INVENTORY OF EMISSIONS .................................................................................................................... 5 3.1.1 Input specific emissions to air ......................................................................................................... 6 3.1.2 Process specific emissions to air..................................................................................................... 9 3.1.3 Emissions to water .......................................................................................................................... 9 3.1.4 By-products ....................................................................................................................................10
3.2 ESTIMATION OF THE ABSOLUTE ENVIRONMENTAL IMPACT ..................................................................10 3.3 COMPARISON OF WASTE INCINERATION SCENARIOS RELATIVE TO A REFERENCE SCENARIO ................11
3.3.1 Scenario 1.......................................................................................................................................12 3.3.2 Scenario 2.......................................................................................................................................12 3.3.3 Reference scenario .........................................................................................................................14 3.3.4 Actual comparison..........................................................................................................................14
4 RESULTS AND DISCUSSION .............................................................. 16
4.1 ESTIMATION OF THE ABSOLUTE ENVIRONMENTAL IMPACT ..................................................................16 4.1.1 Global warming .............................................................................................................................16 4.1.2 Acidification ...................................................................................................................................17 4.1.3 Photochemical ozone creation .......................................................................................................18 4.1.4 Eutrophication................................................................................................................................18 4.1.5 Human toxicity and ecotoxicity ......................................................................................................19 4.1.6 Conclusions ....................................................................................................................................23
4.2 COMPARISON OF WASTE INCINERATION SCENARIOS RELATIVE TO A REFERENCE SCENARIO ................24 4.2.1 Global warming .............................................................................................................................24 4.2.2 Acidification ...................................................................................................................................26 4.2.3 Photochemical ozone creation .......................................................................................................27 4.2.4 Eutrophication................................................................................................................................28 4.2.5 Human toxicity and ecotoxicity ......................................................................................................29 4.2.6 Conclusions ....................................................................................................................................34
5 GENERAL CONCLUSION.................................................................... 35
6 REFERENCES ........................................................................................ 37
7 ANNEX .................................................................................................... 42
7.1 ANNEX I: CHARACTERISTICS OF THE INPUT .........................................................................................42 7.2 ANNEX II : TRANSFER COEFFICIENTS ...................................................................................................53 7.3 ANNEX III: CALCULATION OF ENVIRONMENTAL IMPACTS ...................................................................56 7.4 ANNEX IV: COMPARISON OF THE DISCHARGES INTO WATER AND THE AIRBORNE EMISSIONS AT THE
INDAVER SITE (ROTARY KILN)..........................................................................................................................137 7.5 ANNEX V. CHARACTISATION FACTORS [CML-DATABASE] ...............................................................140
1
1 Aim
This project compares from an environmental point of view the incineration of industrial
waste (mainly high calorific, but also medium calorific waste) in a specialised waste
incinerator (rotary kiln) and the co-incineration in a cement kiln (dry process). In particular
the environmental impact of the emissions related to the incineration of industrial waste in
both processes is considered. In both cases, the objective is substitution of fuel by calorific
waste, in order to counteract resource depletion and to save costs. The comparative analysis
facilitates deciding in which type of installation, cement kiln or rotary kiln, a given amount of
industrial waste can best be incinerated from an environmental point of view.
The functional unit of the study is the incineration of 1 ton of industrial high or medium
calorific waste, which substitutes an equivalent energetic amount of fossil fuel.
Three types of industrial calorific waste are considered:
• industrial sludge, typical calorific value of 7 – 16 MJ/kg
• automotive shredder residue (ASR), typical calorific value of 15 – 22 MJ/kg
• high calorific solvents, typical calorific value of 22 – 29 MJ/kg
All three waste types are currently used as fuel substitutes in both rotary kilns and cement
kilns in Belgium and cover different calorific ranges and toxicity levels [Annex I].
2 Starting point
The study starts from the (obvious) viewpoint that the aim of a specialised rotary kiln
incinerator is to incinerate difficult waste (mainly toxic, medical, hazardous, and otherwise
difficult to treat industrial waste) in the best environmental conditions. In a lot of cases
incineration is the only possible or the most acceptable treatment of these difficult waste
streams. Moreover, it generates steam and electricity as a by-product. The major inputs are
waste to be destroyed, and fuel (fossil fuels, possibly substituted by calorific waste).
The function of a cement kiln, on the other hand, is to produce clinker, in the best process
conditions. In this case the product is thus clinker; inputs are raw materials which contain a
specific proportion of calcium oxide (65%), silica (22%), alumina (6%) and iron oxide (3%)
[van Oss and Padovani, 2003; Hewlett, 1998] and fuel (fossil fuels, possibly substituted by
calorific waste).
For the execution of these processes large amounts of fuel are needed, to obtain the high
temperatures required. Substitution of fuel in a rotary kiln by calorific industrial waste is
2
considered comparable to substitution of fuel in a cement kiln, despite the intrinsic differences
between both processes.
In both installations fuel is thus required:
- In the rotary kiln incinerator, fuel is necessary in order to conduct the destruction
and combustion process at the lowest possible temperature, at which the waste can still
be destroyed with an as low as possible environmental impact. In general flame
temperatures between 850°C and 1200°C are required in the kiln. For waste
containing high chlorine contents, temperature should minimally be 1200°C during at
least 2 seconds.
The input of fuel serves to obtain the necessary temperatures at start-up and to
compensate for energy losses (mainly with the flue gases) during combustion.
Moreover, to ensure the continuity of the process and a complete burnout of the waste,
the incinerator requires a certain average calorific value provided by the fuel [Seyler
et al., 2005; Pavlas and Tous, 2009]. For a specific rotary kiln this average calorific
value depends on the waste that is destroyed and on the working conditions of the kiln.
For instance the rotary kilns at the Indaver site require an average calorific value of
14MJ/kg. Process heat is recovered and transformed into steam and electricity that is
partly reused in the process itself, and partly applied in other processes or delivered to
the electrical grid. The ashes produced in the rotary kiln are disposed in a dedicated
landfill.
- In the cement kiln, fuel is needed to heat the material to a high temperature (1400-
1600°C), required for production of clinker. Especially the sinter process requires
flame temperatures of 1800 – 2000 °C for a short time.
The input of fuel serves thus to obtain the high temperatures for the clinker producing
reactions and to compensate for energy losses. Also this type of process requires a
certain average calorific value of the fuel in order to ensure the continuity of the
process, but in particular to guaranty the quality of the clinker to be produced
[Bolwerk, 2006; Alsop et al., 2007]. In this case not only the working conditions of the
kiln, but also the type of process (wet or dry) and the place where the fuel is fed
determine the calorific requirements of the fuel. Cement kilns in Belgium require for
instance an average calorific value at the main burner of 21MJ/kg [Bolwerk, 2006]. In
the cement kiln flue gases and load flow countercurrent; no excess heat is recovered.
The ashes (or cement kiln dust) are to a large extent recycled into the process,
depending on the heavy metal content. Part of the cement kiln dust is disposed in a
dedicated landfill.
3
In practice the following types of fossil fuel can be used for the two processes discussed:
� Rotary kiln: coal, petcoke or fuel oil
in Belgium, mostly recycled oil is used
� Cement kiln: coal (if necessary pulverised), petcoke or fuel oil
in Belgium, a mixture of coal and petcoke is used
In order to save fossil fuel (in view of resource conservation and to save costs) part or all of
the regular fuel needed may, in principle, in both types of installations be replaced by high or
medium calorific waste. It is important to note that the fraction of fossil fuel that can
effectively be substituted depends on the required calorific value for the incineration process,
the type of fossil fuel substituted and the calorific value of the waste substituting the fossil
fuel.
This study investigates the effects of substituting marginal amounts of fossil fuels by certain
industrial waste types and takes thus not into account the energetic limitations of the kilns. If
however large amounts of fossil fuels (several percentages) are being replaced in the kilns,
these aspects should also be taken into account.
3 Methodology
In order to help judging in which type of installation a specific type of high or medium
calorific waste can best be incinerated from an environmental point of view, we consider the
following questions:
1. What is the absolute environmental impact due to emissions (and avoided emissions)
related to the incineration of 1 ton of such waste in a cement kiln and in a rotary kiln
incinerator?
The outcome of this comparison reflects the effectiveness of the flue gas cleaning
system, the capability of trapping heavy metals and SO2 (in the clinker or the ashes)
and the energy efficiency of the incinerator.
2. When 1 ton of high or medium calorific waste replaces in each process an equivalent
energetic amount of fossil fuel how does the environmental impact of each process
changes?
On the one hand, this problem is investigated for the current situation in Belgium: the
actually used fuels, fuel oil for rotary kilns and petcokes for cement kilns, are
(partially) substituted by calorific waste. This approach is however biased: there is no
4
guarantee that the actually used fuel is optimal from an environmental point of view.
Therefore also the change of environmental impact when other types of fossil fuel
would have been substituted is estimated.
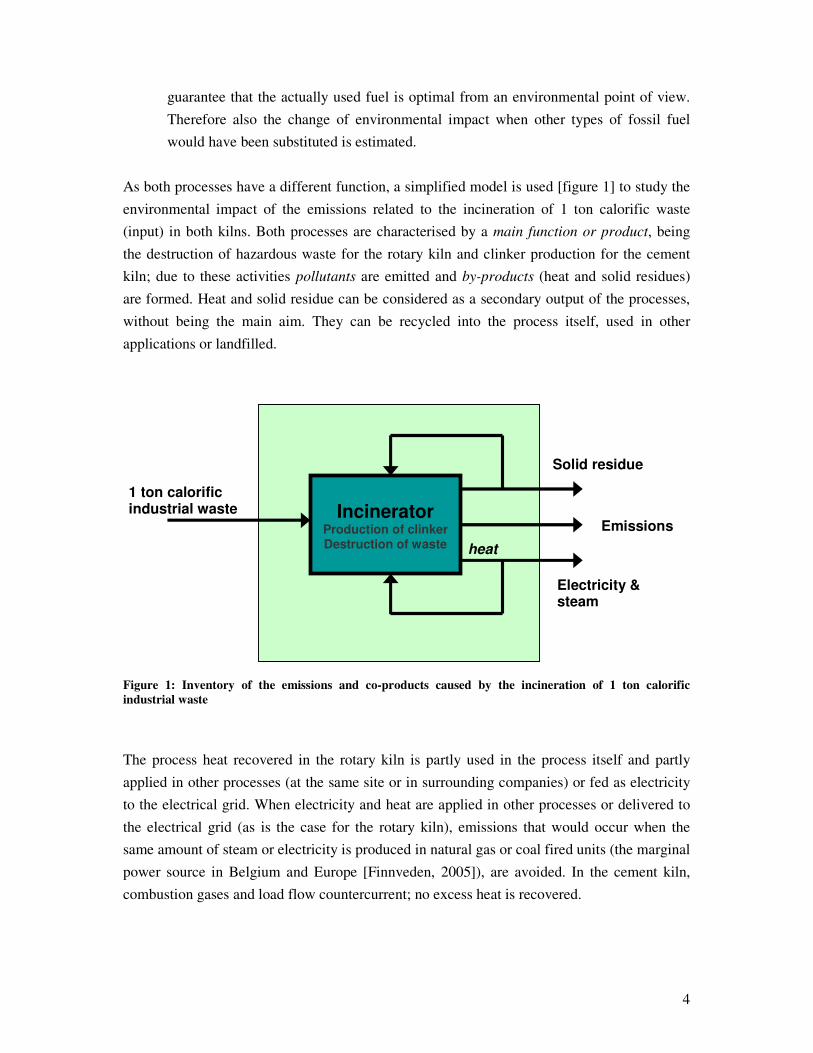
As both processes have a different function, a simplified model is used [figure 1] to study the
environmental impact of the emissions related to the incineration of 1 ton calorific waste
(input) in both kilns. Both processes are characterised by a main function or product, being
the destruction of hazardous waste for the rotary kiln and clinker production for the cement
kiln; due to these activities pollutants are emitted and by-products (heat and solid residues)
are formed. Heat and solid residue can be considered as a secondary output of the processes,
without being the main aim. They can be recycled into the process itself, used in other
applications or landfilled.
Figure 1: Inventory of the emissions and co-products caused by the incineration of 1 ton calorific
industrial waste
The process heat recovered in the rotary kiln is partly used in the process itself and partly
applied in other processes (at the same site or in surrounding companies) or fed as electricity
to the electrical grid. When electricity and heat are applied in other processes or delivered to
the electrical grid (as is the case for the rotary kiln), emissions that would occur when the
same amount of steam or electricity is produced in natural gas or coal fired units (the marginal
power source in Belgium and Europe [Finnveden, 2005]), are avoided. In the cement kiln,
combustion gases and load flow countercurrent; no excess heat is recovered.
Incinerator
Production of clinker Destruction of waste
1 ton calorific industrial waste
Solid residue
Electricity & steam
heat
Emissions
5
The ashes produced in the rotary kiln are disposed in a dedicated landfill, while the cement
kiln dust is to a large extent recycled into the process, depending on the load of heavy metals.
Part of the cement kiln dust is also landfilled. The environmental impact of the landfilling of
the ashes of both processes (bottom ash, flue gas cleaning residues, cement kiln dust, …) is
not taken into account, as the impact is uncertain [Hellweg, 2000; Bruder-Hubscher et al.,
2001; Astrup et al., 2006; Obersteiner et al., 2007]. Moreover the possible environmental
impact due to trapping pollutants (especially heavy metals) in clinker and thus the dispersion
of these pollutants in cement is not taken into account.
Emissions due to collection and transport of waste, construction of buildings, equipments or
flue gas cleaning systems and pre-treatment of waste are not taken into the scope of the
calculations.
It is assumed that the transport and collection of the industrial waste is similar for both
processes, so that it can be excluded in a comparative study. Besides, if the waste is not
transported over long distances, the environmental impact of the transport is in general small
in comparison to the actual incineration process [Rabl et al., 2008; Finnveden et al., 2007].
As this investigation is made for the situation in Belgium, where both incinerator types
already exist, investment costs are not considered. For countries having only one of these
processes available (or even none), taking into account the investment costs is mostly
inevitable when making general waste management decisions.
Finally, it must be remarked that quality requirements for fuel for cement kilns, are higher
than for specialised waste incinerators. A homogeneous input for the cement kiln often
requires an intensive pre-treatment of the waste. In this study however only industrial waste
streams, suitable for both processes, are considered. This way also pre-treatment could be
excluded from this comparative study.
3.1 Inventory of emissions
Emissions of waste treatment processes can be classified into two groups: input specific
emissions and process specific emissions. Some emissions however e.g. NOx show
characteristics of both categories: emissions of fuel-NOx are input specific, while emissions of
thermal NOx are process specific [Miller and Bowman, 1989; Hill and Smoot, 2000; Glarborg
et al., 2003]. The fuel NOx and thermal NOx were considered separately.
While it is obvious that input specific emissions are allocated to the input of the process,
process specific emissions are in general allocated to the process and its function [Seyler et
al., 2005]. In this study, process specific emissions are for the rotary kiln allocated to the
destruction of hazardous waste, those of the cement kiln to the production of clinker.
6
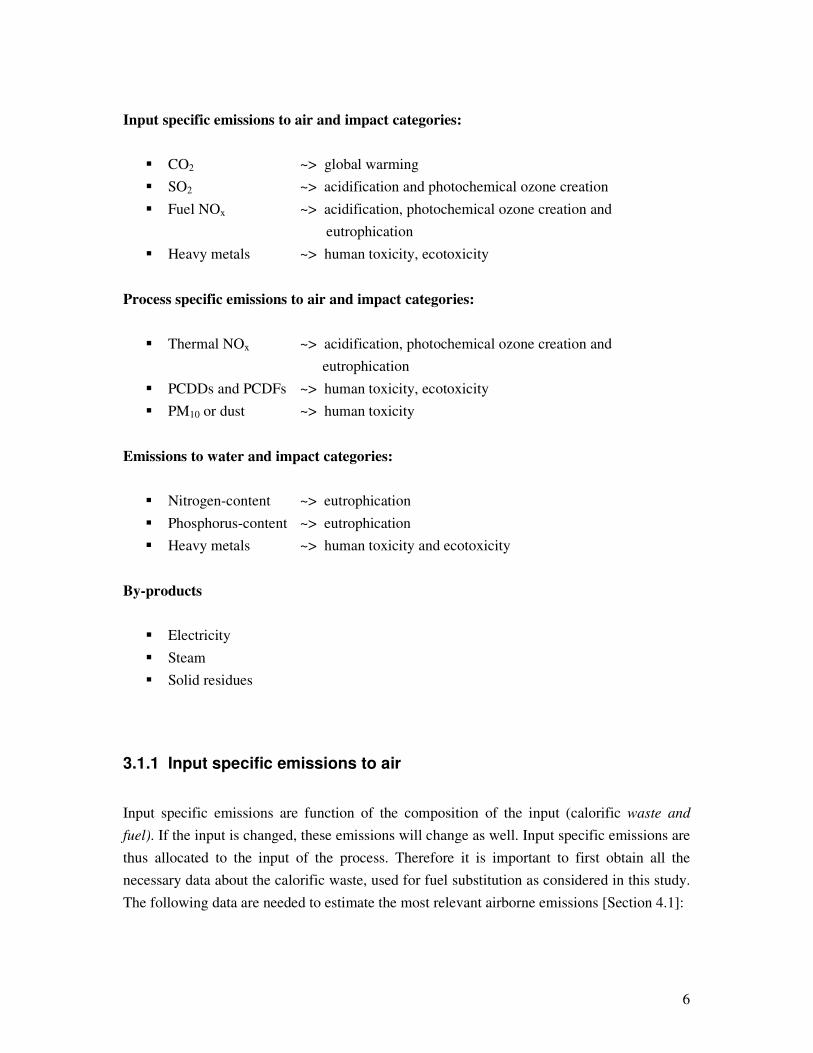
Input specific emissions to air and impact categories:
� CO2 ~> global warming
� SO2 ~> acidification and photochemical ozone creation
� Fuel NOx ~> acidification, photochemical ozone creation and
eutrophication
� Heavy metals ~> human toxicity, ecotoxicity
Process specific emissions to air and impact categories:
� Thermal NOx ~> acidification, photochemical ozone creation and
eutrophication
� PCDDs and PCDFs ~> human toxicity, ecotoxicity
� PM10 or dust ~> human toxicity
Emissions to water and impact categories:
� Nitrogen-content ~> eutrophication
� Phosphorus-content ~> eutrophication
� Heavy metals ~> human toxicity and ecotoxicity
By-products
� Electricity
� Steam
� Solid residues
3.1.1 Input specific emissions to air
Input specific emissions are function of the composition of the input (calorific waste and
fuel). If the input is changed, these emissions will change as well. Input specific emissions are
thus allocated to the input of the process. Therefore it is important to first obtain all the
necessary data about the calorific waste, used for fuel substitution as considered in this study.
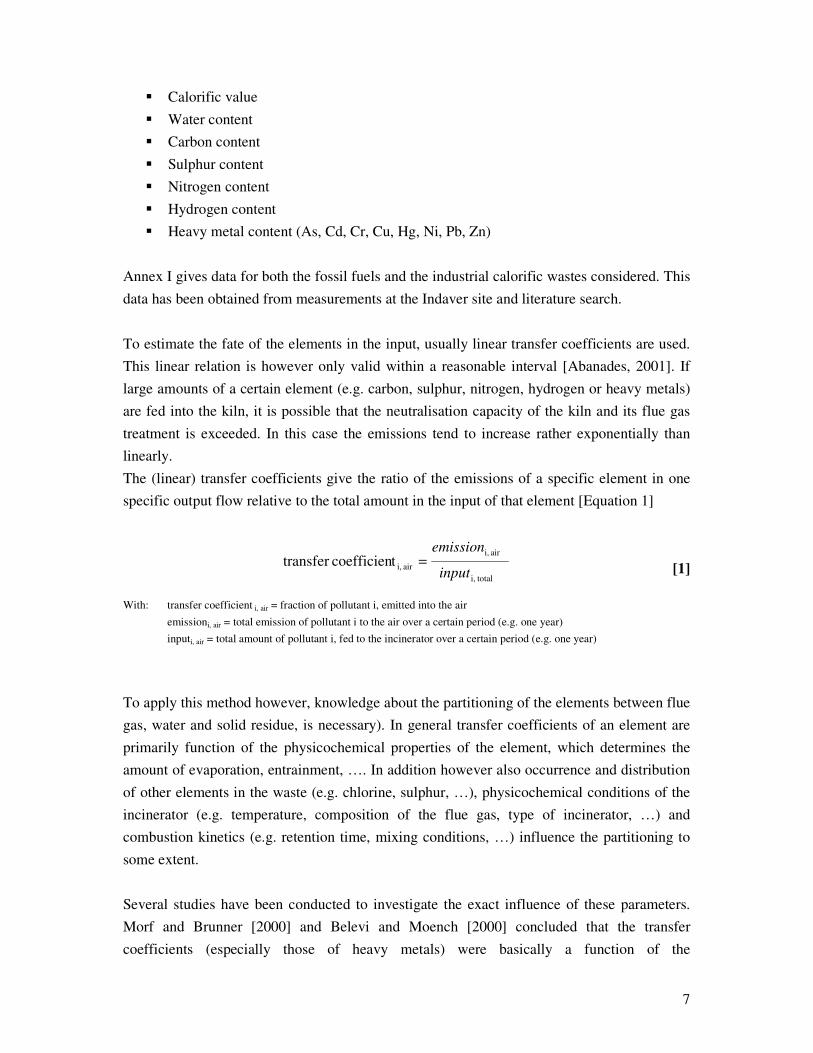
The following data are needed to estimate the most relevant airborne emissions [Section 4.1]:
7
� Calorific value
� Water content
� Carbon content
� Sulphur content
� Nitrogen content
� Hydrogen content
� Heavy metal content (As, Cd, Cr, Cu, Hg, Ni, Pb, Zn)
Annex I gives data for both the fossil fuels and the industrial calorific wastes considered. This
data has been obtained from measurements at the Indaver site and literature search.
To estimate the fate of the elements in the input, usually linear transfer coefficients are used.
This linear relation is however only valid within a reasonable interval [Abanades, 2001]. If
large amounts of a certain element (e.g. carbon, sulphur, nitrogen, hydrogen or heavy metals)
are fed into the kiln, it is possible that the neutralisation capacity of the kiln and its flue gas
treatment is exceeded. In this case the emissions tend to increase rather exponentially than
linearly.
The (linear) transfer coefficients give the ratio of the emissions of a specific element in one
specific output flow relative to the total amount in the input of that element [Equation 1]
[1]
With: transfer coefficient i, air = fraction of pollutant i, emitted into the air
emissioni, air = total emission of pollutant i to the air over a certain period (e.g. one year)
inputi, air = total amount of pollutant i, fed to the incinerator over a certain period (e.g. one year)
To apply this method however, knowledge about the partitioning of the elements between flue
gas, water and solid residue, is necessary). In general transfer coefficients of an element are
primarily function of the physicochemical properties of the element, which determines the
amount of evaporation, entrainment, …. In addition however also occurrence and distribution
of other elements in the waste (e.g. chlorine, sulphur, …), physicochemical conditions of the
incinerator (e.g. temperature, composition of the flue gas, type of incinerator, …) and
combustion kinetics (e.g. retention time, mixing conditions, …) influence the partitioning to
some extent.
Several studies have been conducted to investigate the exact influence of these parameters.
Morf and Brunner [2000] and Belevi and Moench [2000] concluded that the transfer
coefficients (especially those of heavy metals) were basically a function of the
totali,
air i,
air i,tcoefficientransfer input
emission=
8
physicochemical properties of the elements and the working conditions of the incinerator.
Since only marginal changes in normal operation of the incinerators are considered in this
study, working conditions of the incinerators are assumed constant.
For this study, transfer coefficients for the rotary kiln were deduced from online and offline
measurements performed for the rotary kiln at the Indaver site in Antwerp during normal
operation. These were subsequently compared with literature data, in order to ensure an
accurate and robust set of transfer coefficients. Annex II shows the transfer coefficients that
have been used and compares these with literature data.
For cement kilns an extensive literature search has been conducted in order to make a good
estimate of the transfer coefficients [Annex II]. In this study the average values have been
used from different sources, showing good consistency (Denis, 1999; Ministerium fur UNLV,
2000; Seyler et al., 2005; Genon and Brizio, 2008 and data from CBR Lixhe).
For fuel-NOx however, transfer coefficients for both processes are strongly dependent on
process conditions and on the composition of the waste. As a consequence transfer
coefficients cannot be assumed constant for every waste type, as it is the case for other
pollutants such as CO2, SO2 and heavy metals. Based on literature research [Baumbach, 1996;
Jones et al., 1999; Winter et al., 1999; Glarborg et al., 2003; Rogaume et al., 2005; Streibel et
al., 2006; Chyang et al., 2007; Afsharvahid et al., 2008; Dagaut et al., 2008] and data from
different incinerators a semi-empirical model was developed in order to make a crude
estimate of transfer coefficients for fuel-NOx emissions. As can be seen in Annex III, not only
the working conditions of the incinerator, but also the nitrogen and bounded hydrogen content
(water content not taken into account) of the input will influence the specific transfer
coefficients of the fuel-NOx. According to Chyang et al. (2007) the hydrogen content of the
input will enhance the conversion of fuel nitrogen into NOx, while high levels of nitrogen will
rather decrease the conversion into fuel-NOx.
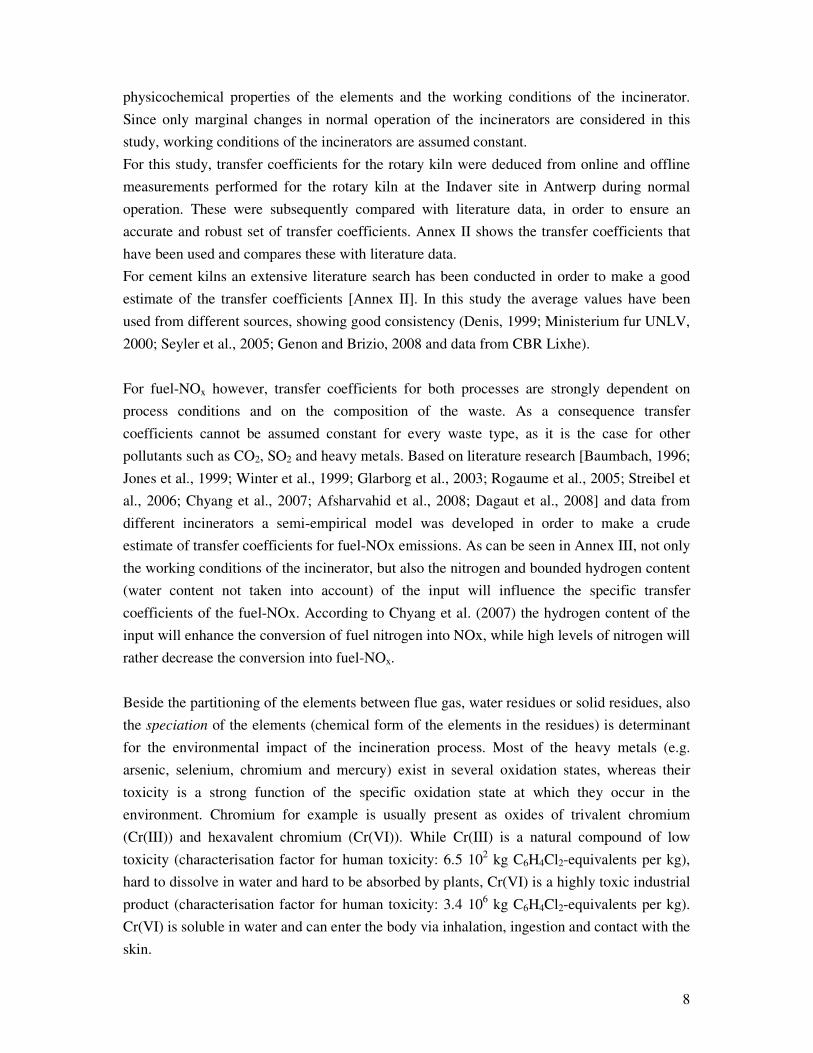
Beside the partitioning of the elements between flue gas, water residues or solid residues, also
the speciation of the elements (chemical form of the elements in the residues) is determinant
for the environmental impact of the incineration process. Most of the heavy metals (e.g.
arsenic, selenium, chromium and mercury) exist in several oxidation states, whereas their
toxicity is a strong function of the specific oxidation state at which they occur in the
environment. Chromium for example is usually present as oxides of trivalent chromium
(Cr(III)) and hexavalent chromium (Cr(VI)). While Cr(III) is a natural compound of low
toxicity (characterisation factor for human toxicity: 6.5 102 kg C6H4Cl2-equivalents per kg),
hard to dissolve in water and hard to be absorbed by plants, Cr(VI) is a highly toxic industrial
product (characterisation factor for human toxicity: 3.4 106 kg C6H4Cl2-equivalents per kg).
Cr(VI) is soluble in water and can enter the body via inhalation, ingestion and contact with the
skin.

9
The specific oxidation state of chromium depends largely on the working conditions of the
incinerator, e.g. flame temperature and oxygen excess and the composition of the input [Chen
et al., 1997; Kashireninov and Fontijn, 1998; Guo and Kennedy, 2001].
3.1.2 Process specific emissions to air
Process specific emissions are assumed to be independent of the input to the process (e.g. raw
materials, fuel) and occur solely because of the execution of the process. They depend on the
process and its operating conditions, e.g. temperature, oxygen content, … . As a consequence,
changes in the input will not (or barely) alter these emissions. This assumption is reasonable
for emissions that are completely determined and controlled by the technology and operation
of the process like dust, dioxins and thermal NOx. In order to make an accurate estimate of
these emissions only data from processes and working conditions are necessary.
These emissions are for this reason related to the functionality of the kiln: the process specific
emissions of the rotary kiln are allocated to the destruction of hazardous waste, those of the
cement kiln to the production of clinker. This implies that these emissions will not be taken
into account when the absolute environmental impact of 1 ton of high or medium calorific
waste is determined [Section 3.2].
3.1.3 Emissions to water
An advantage of a cement kiln (especially the dry process) is that there are no or barely any
discharges into water. Specialised incinerators however use water in the flue gas scrubber,
which generates polluted wastewater. This wastewater however is treated intensively, so that
the actual discharges are rather low and process dependent. In Annex IV the overall
discharges into water from the rotary kiln at the Indaver site, after water treatment, are given
and the environmental impact is compared to the environmental impact of the emissions to
air. From this calculation it can be concluded that the environmental impact of the discharges
into water can be neglected in comparison to the emissions into air, as it accounts for less than
1% of the total environmental impact.
In some specialised incinerators the water is re-circulated and evaporated completely in the
process. This way zero discharge can be put into practice for specialised incinerators as well.
10
3.1.4 By-products
As stated before, both processes are characterised by a main function and by-products [Figure
1].
The process heat, produced during incineration of the calorific waste can be recycled into the
process or transformed into steam or electricity [Figure 1]. When electricity or steam is
produced from an excess of heat, it can be applied in other processes (in or outside the waste
treatment company) or delivered to the electrical grid. Consequently, this use of electricity or
steam avoids certain emissions that would otherwise occur when the same amount of energy
was produced in natural gas or coal fired units [Finnveden, 2005]. Based on data and
literature, we assumed gas and coal fired power units to be the marginal power source in
Belgium. Estimates of the avoided emissions from gas and coal fired power units are obtained
from the Eco-invent database and extensive literature search. To estimate the avoided
emissions, the calorific value of 1 ton of the considered industrial waste was multiplied by an
energy yield factor. This yield factor was obtained as the fraction of the amount of energy
applied in other processes or delivered to the electrical grid to the total energy input. This way
process heat is allocated to the calorific value of the input [Seyler, 2005]. Depending on the
calorific value of the input, more or less excess heat will be generated and thus more or less
emissions will be avoided. Avoided emissions related to an excess process heat are thus
allocated to the calorific value of the process input; they are different for different waste
types.
The amount of ashes strongly depends on the waste to be incinerated and can also be recycled
into the process, as is the case in the cement kiln. The environmental impact of the landfilling
of the ashes of both processes (bottom ash, flue gas cleaning residues, cement kiln dust, …) is
not taken into account, as the impact is uncertain [Hellweg, 2000; Bruder-Hubscher et al.,
2001; Astrup et al., 2006; Obersteiner et al., 2007].
3.2 Estimation of the absolute environmental impact
In order to answer the first question: ’What is the environmental impact when 1 ton of high or
medium calorific waste is incinerated in a rotary kiln incinerator or in a cement kiln?’, the
direct emissions of the process and indirect (avoided) emissions (related to the steam and
electricity production from excess heat) when incinerating 1 ton of high calorific waste, will
be translated into environmental impacts for the relevant impact categories:
11
� global warming
� acidification
� photochemical ozone creation
� eutrophication
� human toxicity
� ecotoxicity (respectively fresh water, sea water and terrestrial toxicity)
The environmental impacts for the relevant impact categories are subsequently determined
using the characterisation factors from the CML-database [Annex V].
The results of these calculations are shown in Annex III in detail and discussed in Section 5.1.
Resource depletion was not studied, since the substitution and thus the saving of fossil fuels is
equal in both options.
As explained in Section 4.1, on the one hand the discharges into water can be neglected in
comparison to the emissions into air and on the other hand the process specific emissions to
air will not be allocated to the fuel or its substitutes. In this way only the input specific
emissions, and the avoided emissions due to the production of steam and electricity from
excess heat will have to be considered.
3.3 Comparison of waste incineration scenarios relative to a
reference scenario
This section aims at answering the question: ‘When 1 ton of high or medium calorific waste
replaces in each process an equivalent energetic amount of fossil fuel how does the
environmental impact of each process changes?’
This can be investigated in a ‘business as usual scenario’ where the actual fossil fuel, in this
case used in Belgium, for the considered processes is replaced by calorific waste. In addition
the change of environmental impact for different types of fossil fuel is estimated and
compared.
As explained in Section 2, the two types of processes being compared, have several intrinsic
differences. One of the most important is the difference in functionality which makes it
particularly difficult to compare all the emissions of these two processes. Questions that arise
are e.g. how must ‘products’ like clinker production or the destruction of low calorific, toxic
waste be taken into account properly, since it is not easy to translate this into environmental
impact categories.
12
These difficulties can be overcome by setting up hypothetical scenarios, with constant
amounts of products generated in each scenario. In this way one can decide in which kiln
specific high or medium calorific wastes cause the largest environmental improvement or the
lowest environmental deterioration in comparison to the reference scenario.
The set up of these scenarios assumes that both specialised incinerators and cement kilns still
have some capacity left for the substitution of fuel by high or medium calorific waste. In this
way one can discuss whether 1 ton of a specific calorific waste, should rather be incinerated in
a rotary kiln incinerator, substituting fossil fuel (scenario 1); or whether it is better for
environment to use the same amount of industrial waste as fuel substitute in a cement kiln
(scenario 2). By comparing these two scenarios with a reference scenario, where the energy
for both processes is obtained only from fossil fuels, the environmental improvement or
deterioration can be calculated for each impact category.
The light blue frame in Figures 2, 3 and 4 represents the boundaries of the scenarios. In the
different scenarios emissions of a specialised incinerator and of a cement kiln are taken into
account, along with the avoided emissions related to the formation of by-products.
We apply techniques of life cycle analysis, but do not have the aim to carry out an LCA.
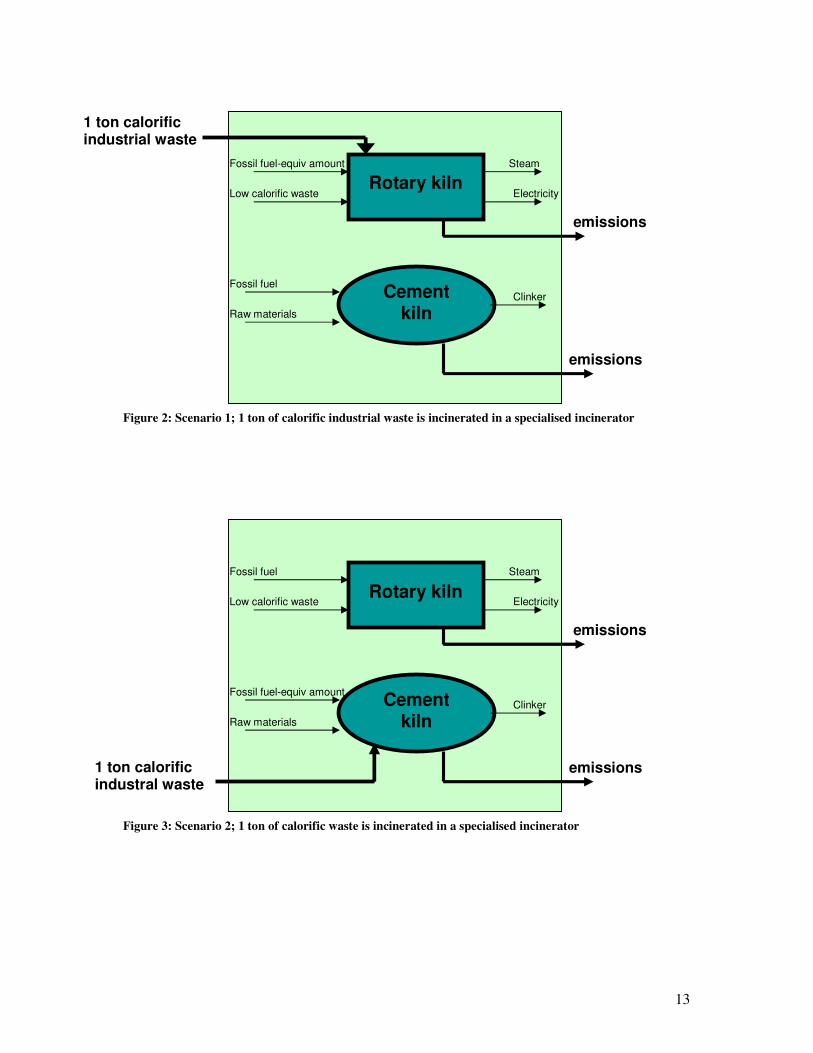
3.3.1 Scenario 1
In this scenario the reference flow of 1 ton of calorific waste is incinerated in the specialised
incinerator [Figure 2], substituting an equivalent energetic amount of fossil fuel (fuel oil for
the case of Belgium), which would otherwise be used to generate the necessary heat for the
destruction of low calorific and/or toxic waste.
3.3.2 Scenario 2
In scenario 2 the cement kiln incinerates the reference flow of 1 ton of calorific waste [Figure
3], substituting an equivalent energetic amount of fossil fuel (petcokes for the case of
Belgium), which would otherwise be needed for the production of clinker.
13
Figure 2: Scenario 1; 1 ton of calorific industrial waste is incinerated in a specialised incinerator
Figure 3: Scenario 2; 1 ton of calorific waste is incinerated in a specialised incinerator
Rotary kiln
Cement kiln
Fossil fuel-equiv amount
Low calorific waste
Fossil fuel
Raw materials
Steam
Electricity
Clinker
emissions
emissions
Rotary kiln
Cement kiln
Fossil fuel
Low calorific waste
Fossil fuel-equiv amount
Raw materials
Steam
Electricity
Clinker
emissions
emissions
1 ton calorific industral waste
1 ton calorific industrial waste
14
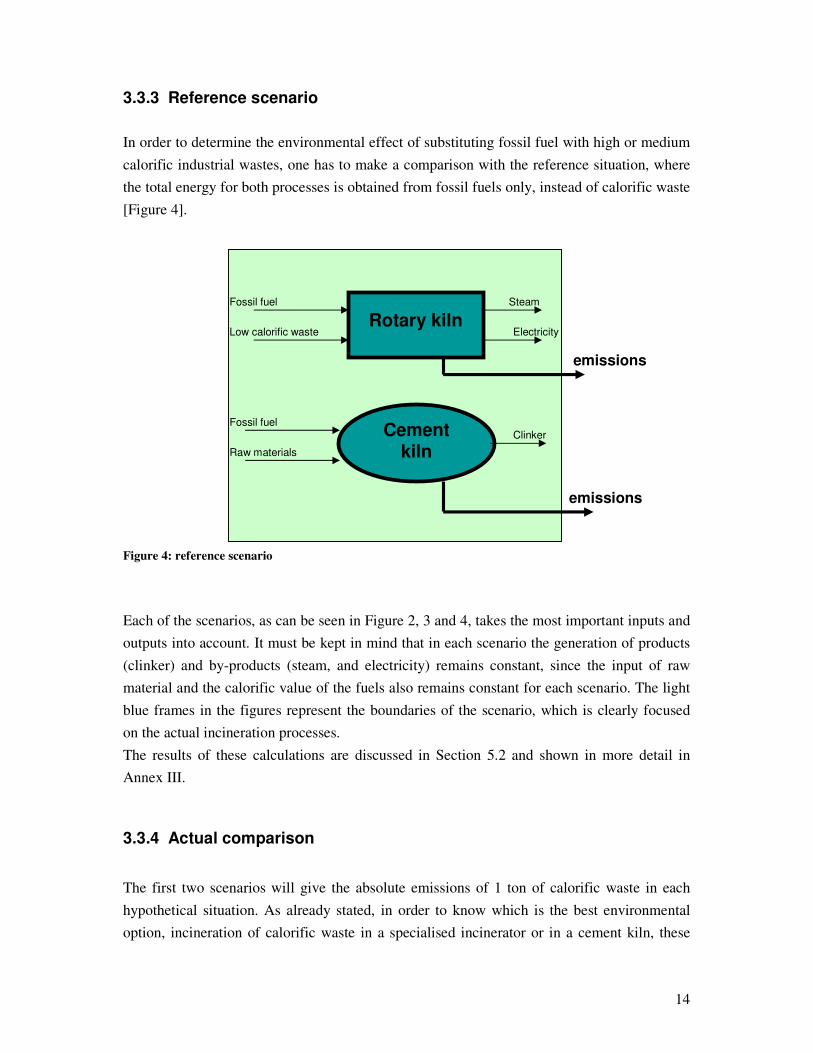
3.3.3 Reference scenario
In order to determine the environmental effect of substituting fossil fuel with high or medium
calorific industrial wastes, one has to make a comparison with the reference situation, where
the total energy for both processes is obtained from fossil fuels only, instead of calorific waste
[Figure 4].
Figure 4: reference scenario
Each of the scenarios, as can be seen in Figure 2, 3 and 4, takes the most important inputs and
outputs into account. It must be kept in mind that in each scenario the generation of products
(clinker) and by-products (steam, and electricity) remains constant, since the input of raw
material and the calorific value of the fuels also remains constant for each scenario. The light
blue frames in the figures represent the boundaries of the scenario, which is clearly focused
on the actual incineration processes.
The results of these calculations are discussed in Section 5.2 and shown in more detail in
Annex III.
3.3.4 Actual comparison
The first two scenarios will give the absolute emissions of 1 ton of calorific waste in each
hypothetical situation. As already stated, in order to know which is the best environmental
option, incineration of calorific waste in a specialised incinerator or in a cement kiln, these
Rotary kiln
Cement kiln
Fossil fuel
Low calorific waste
Fossil fuel
Raw materials
Steam
Electricity
Clinker
emissions
emissions
15
scenarios will be compared with the reference scenario for the most important airborne
emissions.
The difference between scenario 1 and the reference scenario will give an estimate of the
change of environmental impact due to emissions of the incineration of 1 ton waste in a rotary
kiln incinerator, substituting an equivalent energetic amount of fossil fuel. The difference
between scenario 2 and the reference scenario will give an estimate of the change of
environmental impact of the emissions due to the incineration of 1 ton waste in a cement kiln,
substituting an equivalent energetic amount of fossil fuel.
These comparisons can help to make a decision about which situation is more favourable:
using high or medium calorific wastes in a rotary kiln incinerators and using fossil fuels (e.g.
coal, petcoke or fossil fuel) in cement kilns, or vice versa.
The current situation in Belgium will be investigated in a ‘business as usual scenario’ where
the actually used fuels of both incinerators in Belgium are considered, namely fuel oil
(recycled oil to be precise) for rotary kilns and petcokes for cement kilns. This gives however
only a biased indication of the change of environmental impact, as it would be valid for
Belgium but not necessarily for other countries and would assume that the existing fuel
selection in Belgium is optimal from an environmental point of view, while this choice is in
general based on price and availability. As a consequence also estimates are made of the
changes in environmental impact when other types of fossil fuel would have been substituted.
(Section 5.2, Annex III)
Due to the specific set up of these hypothetical scenarios, allocation problems of process
specific emissions and difficulties with taking products properly into account can be
overcome, as already stated. Indeed a suitable selection of the scenarios, which implies the
same amount of products and by-products, makes that the products and by-products are
cancelled out. In addition, only the input specific emissions have to be taken into account,
since only those will differ due to a change of input, between scenario 1 and the reference
scenario or between scenario 2 and the reference scenario, as follows directly from the
definition of process specific emissions (Section 3.1.2)
Thus, only the following airborne emissions have to be considered:
� CO2 ~> global warming
� SO2 ~> acidification, photochemical ozone creation
� Fuel NOx ~> acidification, photochemical ozone creation and
eutrophication
� Heavy metals ~> human toxicity, ecotoxicity
16
4 Results and discussion
4.1 Estimation of the absolute environmental impact
As discussed in the previous section, first the absolute environmental impact of the
incineration of 1 ton of high or medium calorific waste will be estimated. The input related
emissions and the avoided emissions due to electricity or steam production will be taken into
account, since the process related emissions are allocated to the main function of each process
(respectively low calorific or toxic waste destruction and clinker production) and the
discharges into water can be neglected in comparison to the airborne emissions, as discussed
in Section 4. The data used to obtain the environmental impact due to the incineration of 1 ton
of high or medium calorific waste can be found in Annex II, III and IV.
In some cases a general improvement of absolute environmental impact can be realized: when
the direct emissions due to the incineration of the waste are lower than the avoided emissions
due to electricity or steam production, a net negative value (= improvement) is obtained.
4.1.1 Global warming
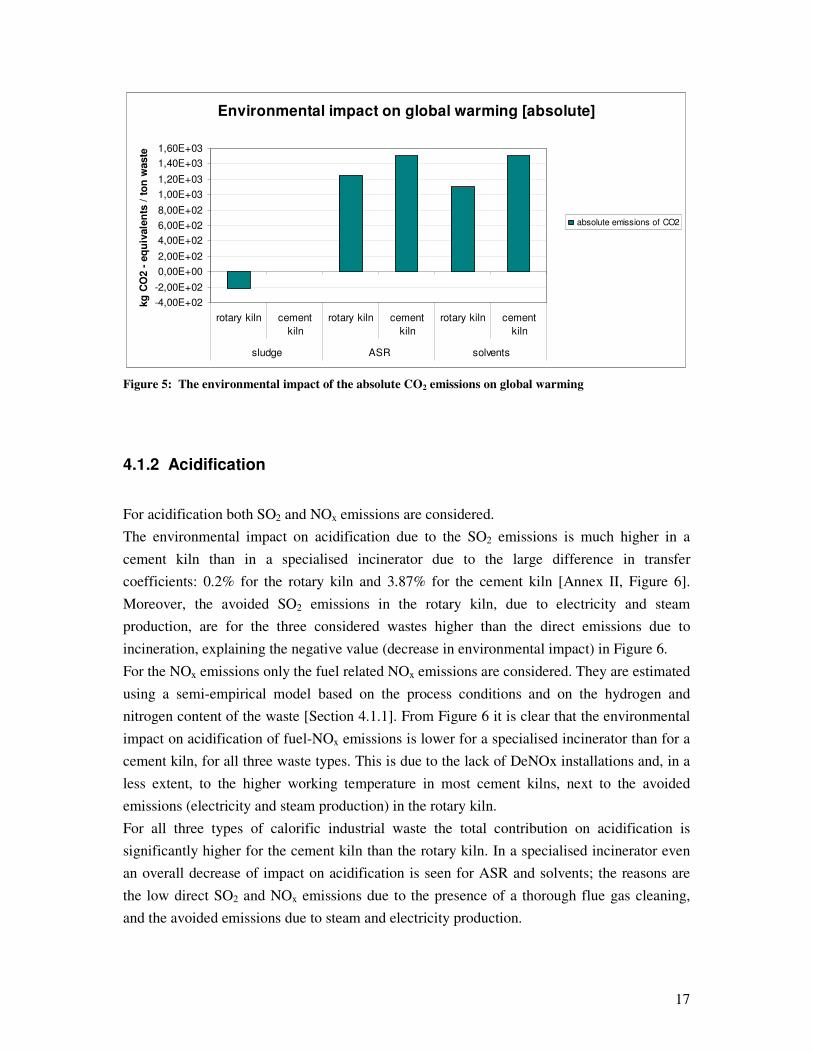
As can be seen in Figure 5, the environmental impact due to global warming is less for the
rotary kiln than for the cement kiln. Since the transfer coefficients for both incinerators are
100%, the only difference in environmental impact of these absolute emissions is caused by
the avoided emissions due to steam and electricity production in the rotary kiln.
Sludge (e.g. from municipal wastewater treatment plants) contains almost only biogenic
carbon, consequently its impact on global warming is not relevant . Due to the avoided CO2
emissions, a negative environmental impact can be distinguished for the incineration of sludge
in the rotary kiln, which means that a general avoidance of CO2 emissions can be realised in
this case.
17
Environmental impact on global warming [absolute]
-4,00E+02
-2,00E+02
0,00E+00
2,00E+02
4,00E+02
6,00E+02
8,00E+02
1,00E+03
1,20E+03
1,40E+03
1,60E+03
rotary kiln cement
kiln
rotary kiln cement
kiln
rotary kiln cement
kiln
sludge ASR solvents
kg
CO
2 -
eq
uiv
ale
nts
/ t
on
waste
absolute emissions of CO2
Figure 5: The environmental impact of the absolute CO2 emissions on global warming
4.1.2 Acidification
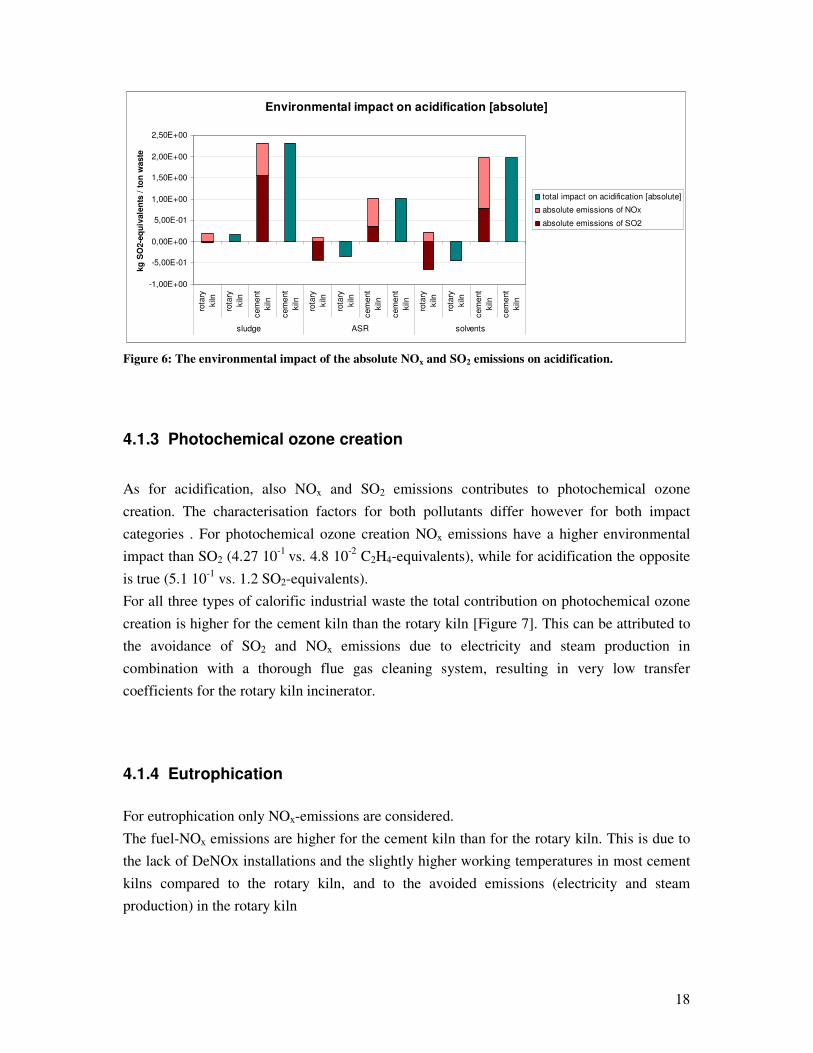
For acidification both SO2 and NOx emissions are considered.
The environmental impact on acidification due to the SO2 emissions is much higher in a
cement kiln than in a specialised incinerator due to the large difference in transfer
coefficients: 0.2% for the rotary kiln and 3.87% for the cement kiln [Annex II, Figure 6].
Moreover, the avoided SO2 emissions in the rotary kiln, due to electricity and steam
production, are for the three considered wastes higher than the direct emissions due to
incineration, explaining the negative value (decrease in environmental impact) in Figure 6.
For the NOx emissions only the fuel related NOx emissions are considered. They are estimated
using a semi-empirical model based on the process conditions and on the hydrogen and
nitrogen content of the waste [Section 4.1.1]. From Figure 6 it is clear that the environmental
impact on acidification of fuel-NOx emissions is lower for a specialised incinerator than for a
cement kiln, for all three waste types. This is due to the lack of DeNOx installations and, in a
less extent, to the higher working temperature in most cement kilns, next to the avoided
emissions (electricity and steam production) in the rotary kiln.
For all three types of calorific industrial waste the total contribution on acidification is
significantly higher for the cement kiln than the rotary kiln. In a specialised incinerator even
an overall decrease of impact on acidification is seen for ASR and solvents; the reasons are
the low direct SO2 and NOx emissions due to the presence of a thorough flue gas cleaning,
and the avoided emissions due to steam and electricity production.
18
Environmental impact on acidification [absolute]
-1,00E+00
-5,00E-01
0,00E+00
5,00E-01
1,00E+00
1,50E+00
2,00E+00
2,50E+00
rota
ry
kiln
rota
ry
kiln
cem
ent
kiln
cem
ent
kiln
rota
ry
kiln
rota
ry
kiln
cem
ent
kiln
cem
ent
kiln
rota
ry
kiln
rota
ry
kiln
cem
ent
kiln
cem
ent
kiln
sludge ASR solvents
kg
SO
2-e
qu
ivale
nts
/ t
on
waste
total impact on acidification [absolute]
absolute emissions of NOx
absolute emissions of SO2
Figure 6: The environmental impact of the absolute NOx and SO2 emissions on acidification.
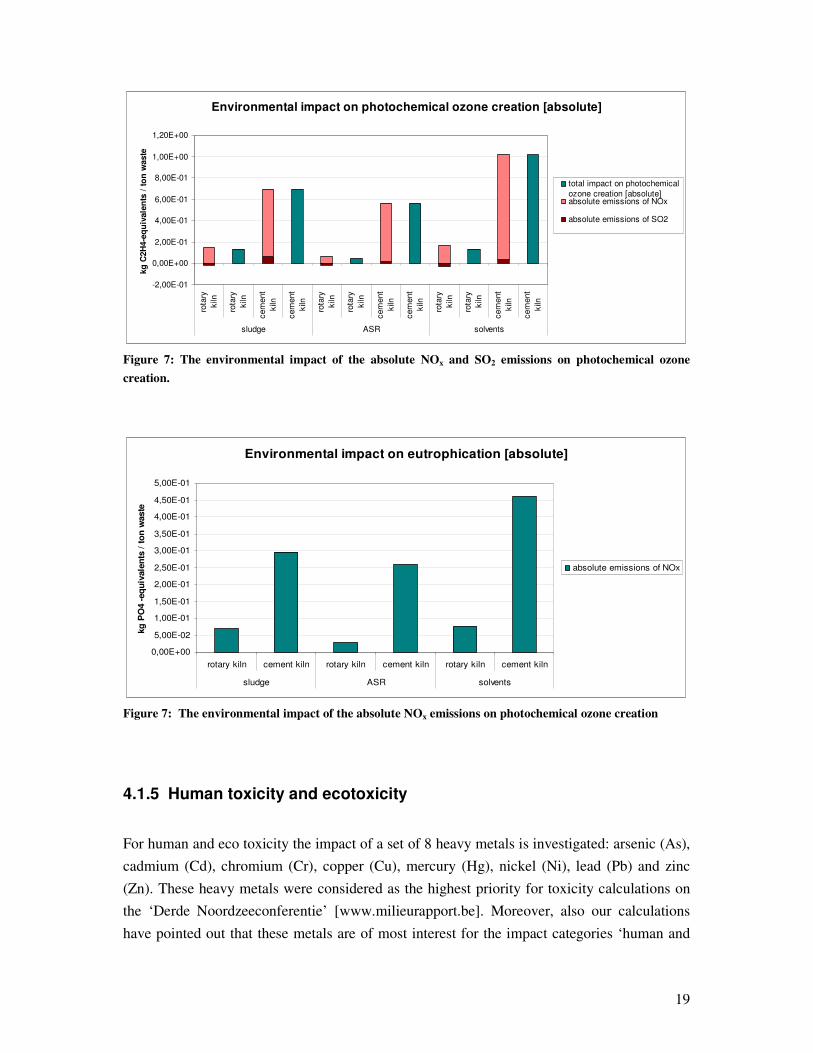
4.1.3 Photochemical ozone creation
As for acidification, also NOx and SO2 emissions contributes to photochemical ozone
creation. The characterisation factors for both pollutants differ however for both impact
categories . For photochemical ozone creation NOx emissions have a higher environmental
impact than SO2 (4.27 10-1
vs. 4.8 10-2
C2H4-equivalents), while for acidification the opposite
is true (5.1 10-1
vs. 1.2 SO2-equivalents).
For all three types of calorific industrial waste the total contribution on photochemical ozone
creation is higher for the cement kiln than the rotary kiln [Figure 7]. This can be attributed to
the avoidance of SO2 and NOx emissions due to electricity and steam production in
combination with a thorough flue gas cleaning system, resulting in very low transfer
coefficients for the rotary kiln incinerator.
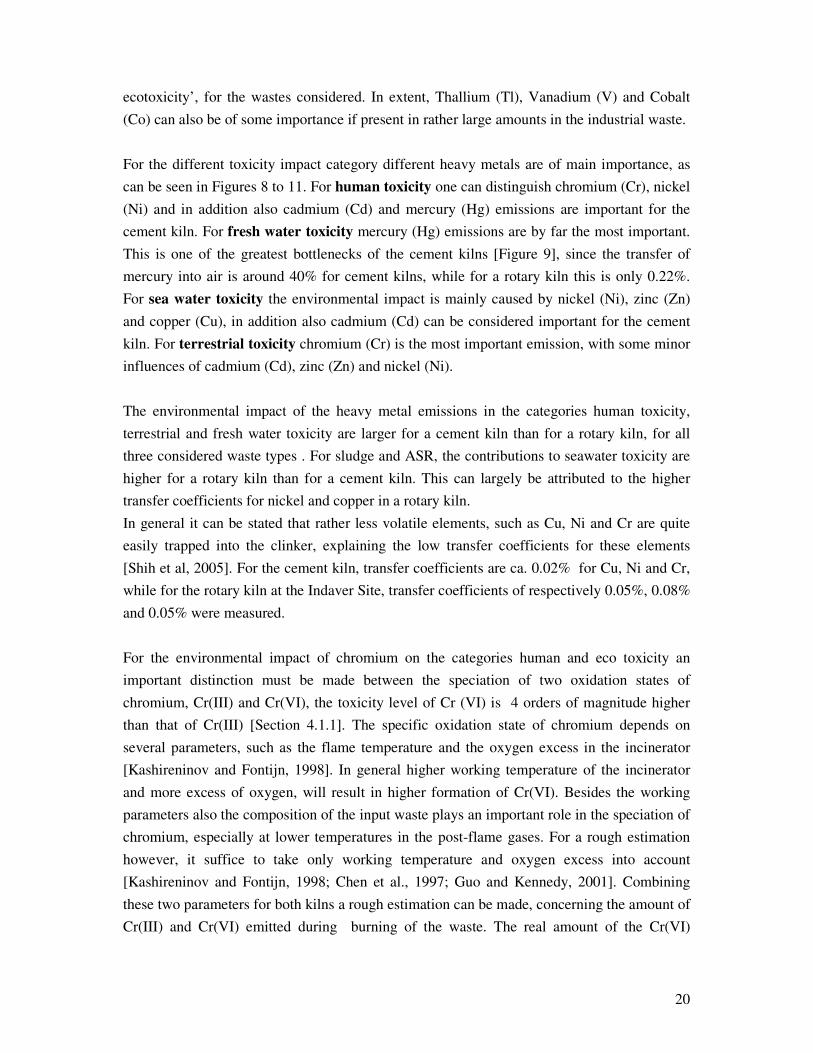
4.1.4 Eutrophication
For eutrophication only NOx-emissions are considered.
The fuel-NOx emissions are higher for the cement kiln than for the rotary kiln. This is due to
the lack of DeNOx installations and the slightly higher working temperatures in most cement
kilns compared to the rotary kiln, and to the avoided emissions (electricity and steam
production) in the rotary kiln
19
Environmental impact on photochemical ozone creation [absolute]
-2,00E-01
0,00E+00
2,00E-01
4,00E-01
6,00E-01
8,00E-01
1,00E+00
1,20E+00
rota
ry
kiln
rota
ry
kiln
cem
ent
kiln
cem
ent
kiln
rota
ry
kiln
rota
ry
kiln
cem
ent
kiln
cem
ent
kiln
rota
ry
kiln
rota
ry
kiln
cem
ent
kiln
cem
ent
kiln
sludge ASR solvents
kg
C2H
4-e
qu
ivale
nts
/ t
on
waste
total impact on photochemical
ozone creation [absolute]absolute emissions of NOx
absolute emissions of SO2
Figure 7: The environmental impact of the absolute NOx and SO2 emissions on photochemical ozone
creation.
Environmental impact on eutrophication [absolute]
0,00E+00
5,00E-02
1,00E-01
1,50E-01
2,00E-01
2,50E-01
3,00E-01
3,50E-01
4,00E-01
4,50E-01
5,00E-01
rotary kiln cement kiln rotary kiln cement kiln rotary kiln cement kiln
sludge ASR solvents
kg
PO
4 -
eq
uiv
ale
nts
/ t
on
waste
absolute emissions of NOx
Figure 7: The environmental impact of the absolute NOx emissions on photochemical ozone creation
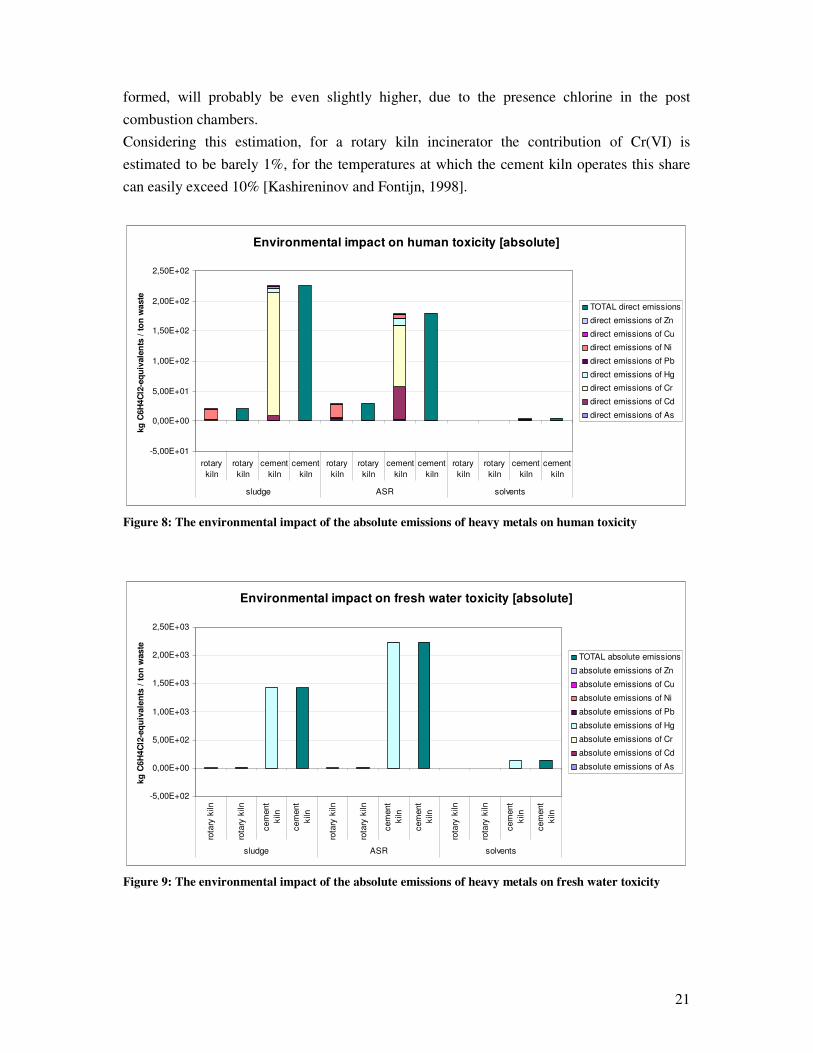
4.1.5 Human toxicity and ecotoxicity
For human and eco toxicity the impact of a set of 8 heavy metals is investigated: arsenic (As),
cadmium (Cd), chromium (Cr), copper (Cu), mercury (Hg), nickel (Ni), lead (Pb) and zinc
(Zn). These heavy metals were considered as the highest priority for toxicity calculations on
the ‘Derde Noordzeeconferentie’ [www.milieurapport.be]. Moreover, also our calculations
have pointed out that these metals are of most interest for the impact categories ‘human and
20
ecotoxicity’, for the wastes considered. In extent, Thallium (Tl), Vanadium (V) and Cobalt
(Co) can also be of some importance if present in rather large amounts in the industrial waste.
For the different toxicity impact category different heavy metals are of main importance, as
can be seen in Figures 8 to 11. For human toxicity one can distinguish chromium (Cr), nickel
(Ni) and in addition also cadmium (Cd) and mercury (Hg) emissions are important for the
cement kiln. For fresh water toxicity mercury (Hg) emissions are by far the most important.
This is one of the greatest bottlenecks of the cement kilns [Figure 9], since the transfer of
mercury into air is around 40% for cement kilns, while for a rotary kiln this is only 0.22%.
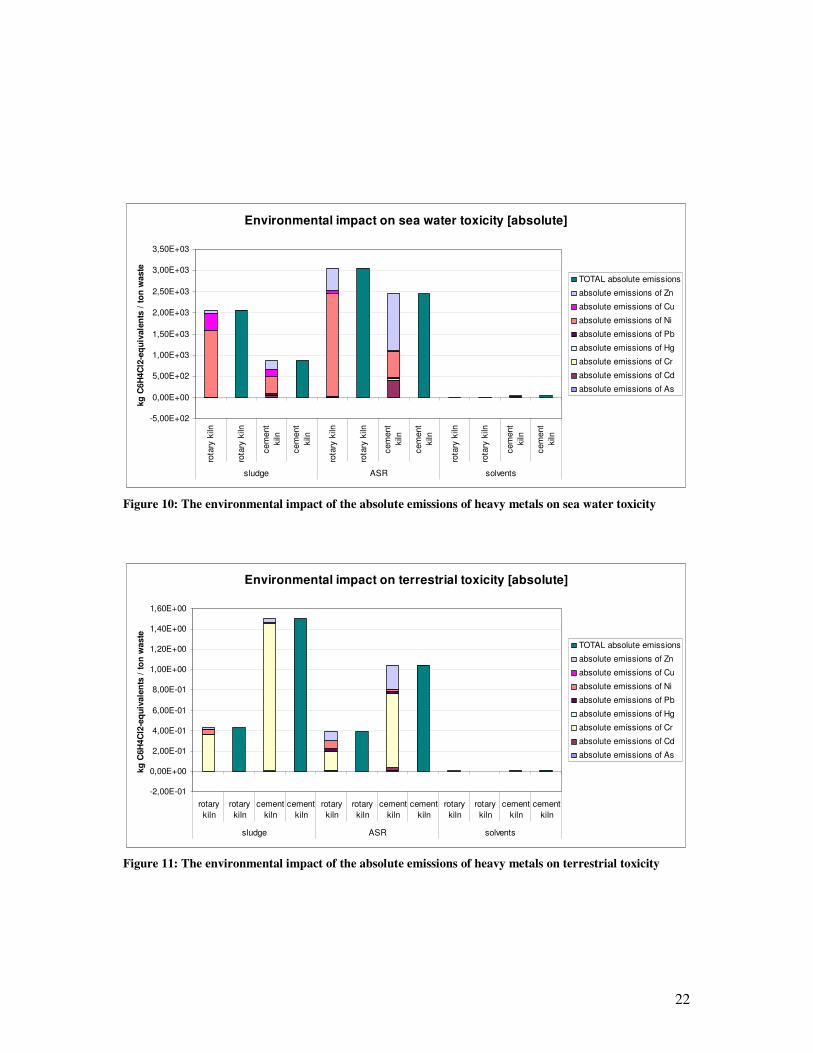
For sea water toxicity the environmental impact is mainly caused by nickel (Ni), zinc (Zn)
and copper (Cu), in addition also cadmium (Cd) can be considered important for the cement
kiln. For terrestrial toxicity chromium (Cr) is the most important emission, with some minor
influences of cadmium (Cd), zinc (Zn) and nickel (Ni).
The environmental impact of the heavy metal emissions in the categories human toxicity,
terrestrial and fresh water toxicity are larger for a cement kiln than for a rotary kiln, for all
three considered waste types . For sludge and ASR, the contributions to seawater toxicity are
higher for a rotary kiln than for a cement kiln. This can largely be attributed to the higher
transfer coefficients for nickel and copper in a rotary kiln.
In general it can be stated that rather less volatile elements, such as Cu, Ni and Cr are quite
easily trapped into the clinker, explaining the low transfer coefficients for these elements
[Shih et al, 2005]. For the cement kiln, transfer coefficients are ca. 0.02% for Cu, Ni and Cr,
while for the rotary kiln at the Indaver Site, transfer coefficients of respectively 0.05%, 0.08%
and 0.05% were measured.
For the environmental impact of chromium on the categories human and eco toxicity an
important distinction must be made between the speciation of two oxidation states of
chromium, Cr(III) and Cr(VI), the toxicity level of Cr (VI) is 4 orders of magnitude higher
than that of Cr(III) [Section 4.1.1]. The specific oxidation state of chromium depends on
several parameters, such as the flame temperature and the oxygen excess in the incinerator
[Kashireninov and Fontijn, 1998]. In general higher working temperature of the incinerator
and more excess of oxygen, will result in higher formation of Cr(VI). Besides the working
parameters also the composition of the input waste plays an important role in the speciation of
chromium, especially at lower temperatures in the post-flame gases. For a rough estimation
however, it suffice to take only working temperature and oxygen excess into account
[Kashireninov and Fontijn, 1998; Chen et al., 1997; Guo and Kennedy, 2001]. Combining
these two parameters for both kilns a rough estimation can be made, concerning the amount of
Cr(III) and Cr(VI) emitted during burning of the waste. The real amount of the Cr(VI)
21
formed, will probably be even slightly higher, due to the presence chlorine in the post
combustion chambers.
Considering this estimation, for a rotary kiln incinerator the contribution of Cr(VI) is
estimated to be barely 1%, for the temperatures at which the cement kiln operates this share
can easily exceed 10% [Kashireninov and Fontijn, 1998].
Environmental impact on human toxicity [absolute]
-5,00E+01
0,00E+00
5,00E+01
1,00E+02
1,50E+02
2,00E+02
2,50E+02
rotary
kiln
rotary
kiln
cement
kiln
cement
kiln
rotary
kiln
rotary
kiln
cement
kiln
cement
kiln
rotary
kiln
rotary
kiln
cement
kiln
cement
kiln
sludge ASR solvents
kg
C6H
4C
l2-e
qu
ivale
nts
/ t
on
waste
TOTAL direct emissions
direct emissions of Zn
direct emissions of Cu
direct emissions of Ni
direct emissions of Pb
direct emissions of Hg
direct emissions of Cr
direct emissions of Cd
direct emissions of As
Figure 8: The environmental impact of the absolute emissions of heavy metals on human toxicity
Environmental impact on fresh water toxicity [absolute]
-5,00E+02
0,00E+00
5,00E+02
1,00E+03
1,50E+03
2,00E+03
2,50E+03
rota
ry k
iln
rota
ry k
iln
cem
ent
kiln
cem
ent
kiln
rota
ry k
iln
rota
ry k
iln
cem
ent
kiln
cem
ent
kiln
rota
ry k
iln
rota
ry k
iln
cem
ent
kiln
cem
ent
kiln
sludge ASR solvents
kg
C6H
4C
l2-e
qu
ivale
nts
/ t
on
waste
TOTAL absolute emissions
absolute emissions of Zn
absolute emissions of Cu
absolute emissions of Ni
absolute emissions of Pb
absolute emissions of Hg
absolute emissions of Cr
absolute emissions of Cd
absolute emissions of As
Figure 9: The environmental impact of the absolute emissions of heavy metals on fresh water toxicity
22
Environmental impact on sea water toxicity [absolute]
-5,00E+02
0,00E+00
5,00E+02
1,00E+03
1,50E+03
2,00E+03
2,50E+03
3,00E+03
3,50E+03
rota
ry k
iln
rota
ry k
iln
cem
ent
kiln
cem
ent
kiln
rota
ry k
iln
rota
ry k
iln
cem
ent
kiln
cem
ent
kiln
rota
ry k
iln
rota
ry k
iln
cem
ent
kiln
cem
ent
kiln
sludge ASR solvents
kg
C6H
4C
l2-e
qu
ivale
nts
/ t
on
waste
TOTAL absolute emissions
absolute emissions of Zn
absolute emissions of Cu
absolute emissions of Ni
absolute emissions of Pb
absolute emissions of Hg
absolute emissions of Cr
absolute emissions of Cd
absolute emissions of As
Figure 10: The environmental impact of the absolute emissions of heavy metals on sea water toxicity
Environmental impact on terrestrial toxicity [absolute]
-2,00E-01
0,00E+00
2,00E-01
4,00E-01
6,00E-01
8,00E-01
1,00E+00
1,20E+00
1,40E+00
1,60E+00
rotary
kiln
rotary
kiln
cement
kiln
cement
kiln
rotary
kiln
rotary
kiln
cement
kiln
cement
kiln
rotary
kiln
rotary
kiln
cement
kiln
cement
kiln
sludge ASR solvents
kg
C6H
4C
l2-e
qu
ivale
nts
/ t
on
waste
TOTAL absolute emissions
absolute emissions of Zn
absolute emissions of Cu
absolute emissions of Ni
absolute emissions of Pb
absolute emissions of Hg
absolute emissions of Cr
absolute emissions of Cd
absolute emissions of As
Figure 11: The environmental impact of the absolute emissions of heavy metals on terrestrial toxicity
23
4.1.6 Conclusions
When answering the question ‘what is the environmental impact when 1 ton of high or
medium calorific waste is incinerated in a cement kiln or in a rotary kiln’, this study shows
that for all environmental impact categories considered (except sea water toxicity) the impact
of incinerating calorific industrial waste in the rotary kiln is considerably smaller than for a
cement kiln.
This can mainly be attributed to the higher effectiveness of the flue gas cleaning of the rotary
kiln in comparison to the cement kiln, causing (in general) smaller transfer coefficients for
almost all elements considered [Annex II]. Moreover the higher energy efficiency of the
rotary kiln, leading to recuperation of part of the calorific value of the waste as steam and/or
electricity, makes it in some cases possible to even generate a general improvement in
environmental impact when substituting fossil fuel with high calorific waste.
24
4.2 Comparison of waste incineration scenarios relative to a
reference scenario
In this section the change of the environmental impact is investigated when 1 ton of high or
medium calorific waste replaces an equivalent energetic amount of fuel.
First in ‘a business as usual’ scenario, the change of the environmental impact is studied,
relative to the fossil fuel actually used in this type of kilns in Belgium (fossil fuel for the
rotary kiln and petcoke for the cement kiln). For several impact categories however, the
change of environmental impact is highly dependent on the actual fuel being substituted.
Therefore the possible changes of environmental impact is also investigated and compared for
different fossil fuel types in both kilns.
When in the incinerators fuel containing a high amount of carbon or impurities (e.g. the
petcoke used as reference fuel in cement kilns), is substituted by a cleaner calorific waste, the
environmental impact can be improved, resulting in a negative value. Moreover, this relative
improvement will be highest for pollutants with high transfer.
4.2.1 Global warming
Since the transfer coefficients for carbon for both incinerators are 100%, the only difference
in environmental impact of the absolute emissions is caused by the avoided emissions due to
steam and electricity production in the rotary kiln [Section 5.1.1]. The change of
environmental impact, substituting different fossil fuels for both incinerators is however the
same [Figure 12], since an equal amount of steam and electricity is generated in both the
substitution and the reference scenario. This implies that the energy efficiency of the
incinerator and subsequently the efficiency of the generation of steam and electricity is not
taken into account in this comparison.
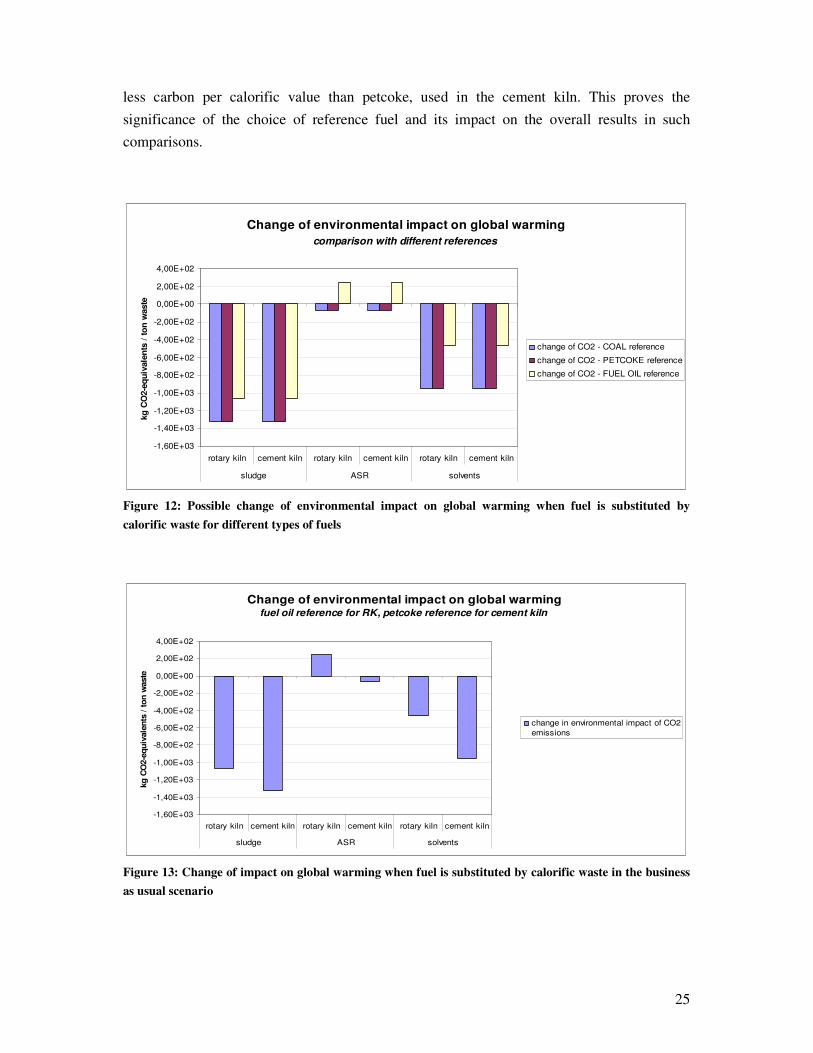
All three waste types have a lower impact on global warming than the incineration of an
equivalent energetic amount of coal or petcoke (negative values in figure 12). This can be
attributed to their lower non-biogenic carbon content per calorific value. Automotive shredder
residue (ASR) however contains more non-biogenic carbon per calorific value than fuel oil,
which implies an increase of environmental impact on global warming (a positive value) as
can be seen in Figure 12; for the other two waste types a reduction of environmental impact is
observed compared to fuel oil.
If the comparison is made for the business as usual scenario [Figure 13], it is clear that the
decrease of environmental impact on global warming for a cement kiln is larger than for a
specialised incinerator. The reason is that fuel oil, normally used in the rotary kiln, contains
25
less carbon per calorific value than petcoke, used in the cement kiln. This proves the
significance of the choice of reference fuel and its impact on the overall results in such
comparisons.
Change of environmental impact on global warming
comparison with different references
-1,60E+03
-1,40E+03
-1,20E+03
-1,00E+03
-8,00E+02
-6,00E+02
-4,00E+02
-2,00E+02
0,00E+00
2,00E+02
4,00E+02
rotary kiln cement kiln rotary kiln cement kiln rotary kiln cement kiln
sludge ASR solvents
kg
CO
2-e
qu
ivale
nts
/ t
on
waste
change of CO2 - COAL reference
change of CO2 - PETCOKE reference
change of CO2 - FUEL OIL reference
Figure 12: Possible change of environmental impact on global warming when fuel is substituted by
calorific waste for different types of fuels
Change of environmental impact on global warmingfuel oil reference for RK, petcoke reference for cement kiln
-1,60E+03
-1,40E+03
-1,20E+03
-1,00E+03
-8,00E+02
-6,00E+02
-4,00E+02
-2,00E+02
0,00E+00
2,00E+02
4,00E+02
rotary kiln cement kiln rotary kiln cement kiln rotary kiln cement kiln
sludge ASR solvents
kg
CO
2-e
qu
ivale
nts
/ t
on
waste
change in environmental impact of CO2
emissions
Figure 13: Change of impact on global warming when fuel is substituted by calorific waste in the business
as usual scenario
26
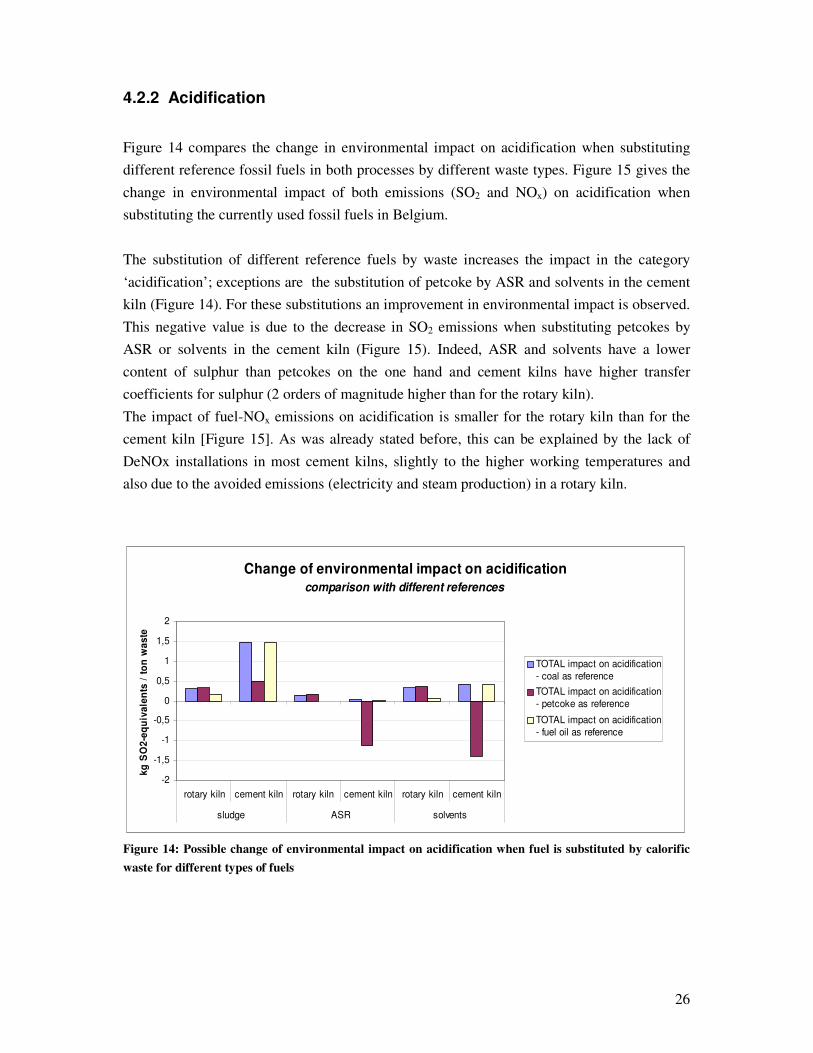
4.2.2 Acidification
Figure 14 compares the change in environmental impact on acidification when substituting
different reference fossil fuels in both processes by different waste types. Figure 15 gives the
change in environmental impact of both emissions (SO2 and NOx) on acidification when
substituting the currently used fossil fuels in Belgium.
The substitution of different reference fuels by waste increases the impact in the category
‘acidification’; exceptions are the substitution of petcoke by ASR and solvents in the cement
kiln (Figure 14). For these substitutions an improvement in environmental impact is observed.
This negative value is due to the decrease in SO2 emissions when substituting petcokes by
ASR or solvents in the cement kiln (Figure 15). Indeed, ASR and solvents have a lower
content of sulphur than petcokes on the one hand and cement kilns have higher transfer
coefficients for sulphur (2 orders of magnitude higher than for the rotary kiln).
The impact of fuel-NOx emissions on acidification is smaller for the rotary kiln than for the
cement kiln [Figure 15]. As was already stated before, this can be explained by the lack of
DeNOx installations in most cement kilns, slightly to the higher working temperatures and
also due to the avoided emissions (electricity and steam production) in a rotary kiln.
Change of environmental impact on acidification
comparison with different references
-2
-1,5
-1
-0,5
0
0,5
1
1,5
2
rotary kiln cement kiln rotary kiln cement kiln rotary kiln cement kiln
sludge ASR solvents
kg
SO
2-e
qu
iva
len
ts /
to
n w
as
te
TOTAL impact on acidification
- coal as reference
TOTAL impact on acidification
- petcoke as reference
TOTAL impact on acidification
- fuel oil as reference
Figure 14: Possible change of environmental impact on acidification when fuel is substituted by calorific
waste for different types of fuels
27
Change of environmental impact on acidification
fuel oil reference for RK, petcoke reference for cement kiln
-2,50E+00
-2,00E+00
-1,50E+00
-1,00E+00
-5,00E-01
0,00E+00
5,00E-01
1,00E+00
rota
ry k
iln
rota
ry k
iln
cem
ent
kiln
cem
ent
kiln
rota
ry k
iln
rota
ry k
iln
cem
ent
kiln
cem
ent
kiln
rota
ry k
iln
rota
ry k
iln
cem
ent
kiln
cem
ent
kiln
sludge ASR solvents
kg
SO
2-e
qu
ivale
nts
/ t
on
waste
total environmental impact on acidification
environmental impact of NET NO emissions
environmental impact of NET SO2 emissions
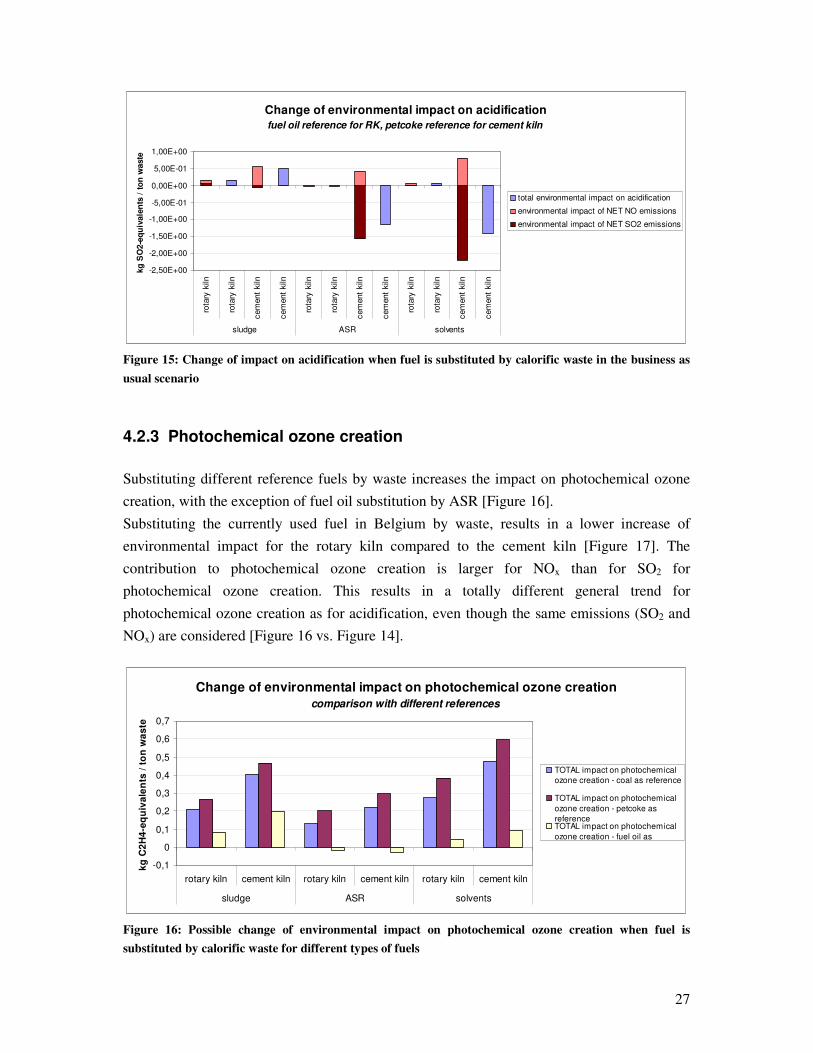
Figure 15: Change of impact on acidification when fuel is substituted by calorific waste in the business as
usual scenario
4.2.3 Photochemical ozone creation
Substituting different reference fuels by waste increases the impact on photochemical ozone
creation, with the exception of fuel oil substitution by ASR [Figure 16].
Substituting the currently used fuel in Belgium by waste, results in a lower increase of
environmental impact for the rotary kiln compared to the cement kiln [Figure 17]. The
contribution to photochemical ozone creation is larger for NOx than for SO2 for
photochemical ozone creation. This results in a totally different general trend for
photochemical ozone creation as for acidification, even though the same emissions (SO2 and
NOx) are considered [Figure 16 vs. Figure 14].
Change of environmental impact on photochemical ozone creation
comparison with different references
-0,1
0
0,1
0,2
0,3
0,4
0,5
0,6
0,7
rotary kiln cement kiln rotary kiln cement kiln rotary kiln cement kiln
sludge ASR solvents
kg
C2
H4
-eq
uiv
ale
nts
/ t
on
wa
ste
TOTAL impact on photochemical
ozone creation - coal as reference
TOTAL impact on photochemical
ozone creation - petcoke as
referenceTOTAL impact on photochemical
ozone creation - fuel oil as
Figure 16: Possible change of environmental impact on photochemical ozone creation when fuel is
substituted by calorific waste for different types of fuels
28
Change of environmental impact on photochemical ozone creation
fuel oil reference for RK, petcoke reference for cement kiln
-2,00E-01
-1,00E-01
0,00E+00
1,00E-01
2,00E-01
3,00E-01
4,00E-01
5,00E-01
6,00E-01
7,00E-01
8,00E-01
rota
ry
kiln
rota
ry
kiln
cem
ent
kiln
cem
ent
kiln
rota
ry
kiln
rota
ry
kiln
cem
ent
kiln
cem
ent
kiln
rota
ry
kiln
rota
ry
kiln
cem
ent
kiln
cem
ent
kiln
sludge ASR solvents
kg
C2H
4-e
qu
ivale
nts
/ t
on
waste
total environmental impact on
photochemical ozone creation
environmental impact of NET
NOx emissions
environmental impact of NET
SO2 emissions
Figure 17: Change of impact on photochemical ozone creation when fuel is substituted by calorific waste
in the business as usual scenario
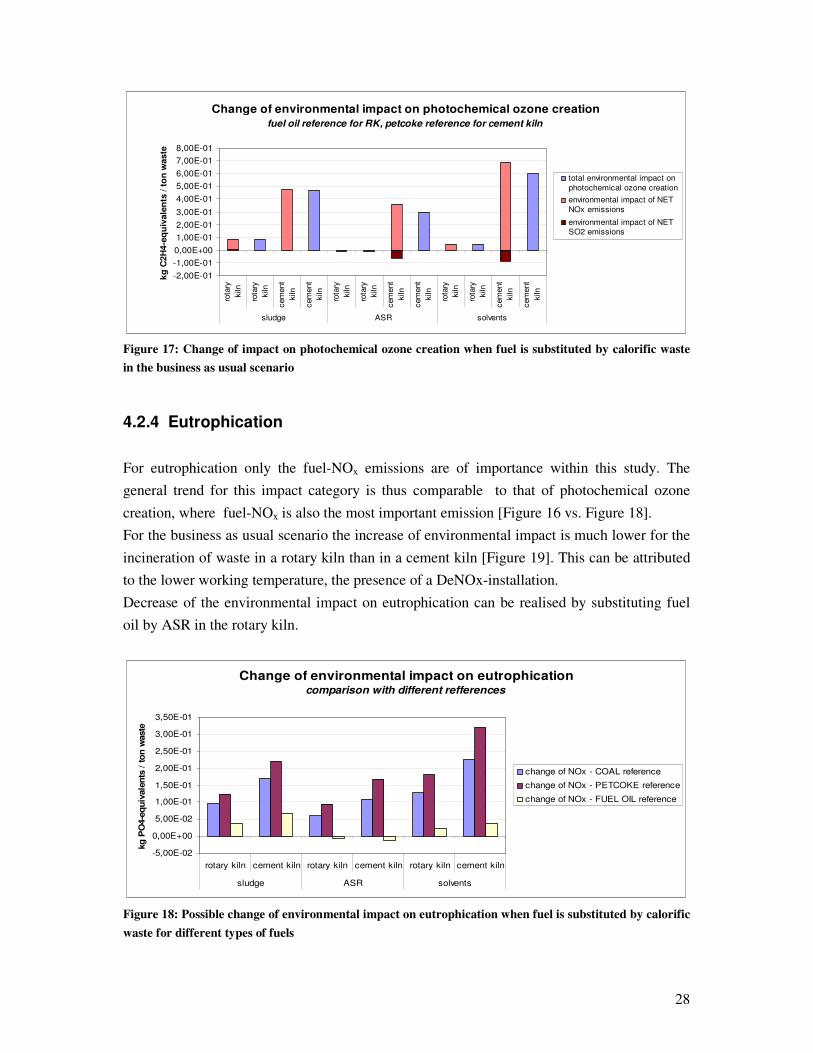
4.2.4 Eutrophication
For eutrophication only the fuel-NOx emissions are of importance within this study. The
general trend for this impact category is thus comparable to that of photochemical ozone
creation, where fuel-NOx is also the most important emission [Figure 16 vs. Figure 18].
For the business as usual scenario the increase of environmental impact is much lower for the
incineration of waste in a rotary kiln than in a cement kiln [Figure 19]. This can be attributed
to the lower working temperature, the presence of a DeNOx-installation.
Decrease of the environmental impact on eutrophication can be realised by substituting fuel
oil by ASR in the rotary kiln.
Change of environmental impact on eutrophicationcomparison with different refferences
-5,00E-02
0,00E+00
5,00E-02
1,00E-01
1,50E-01
2,00E-01
2,50E-01
3,00E-01
3,50E-01
rotary kiln cement kiln rotary kiln cement kiln rotary kiln cement kiln
sludge ASR solvents
kg
PO
4-e
qu
ivale
nts
/ t
on
waste
change of NOx - COAL reference
change of NOx - PETCOKE reference
change of NOx - FUEL OIL reference
Figure 18: Possible change of environmental impact on eutrophication when fuel is substituted by calorific
waste for different types of fuels

29
Change in environmental impact on eutrophicationfuel oil reference for RK and petcoke reference for cement kiln
-5,00E-02
0,00E+00
5,00E-02
1,00E-01
1,50E-01
2,00E-01
2,50E-01
3,00E-01
3,50E-01
rotary kiln cement
kiln
rotary kiln cement
kiln
rotary kiln cement
kiln
sludge ASR solvents
kg
PO
4-
eq
uiv
ale
nts
/ t
on
waste
change in environmental
impact of NOx emissions
Figure 19: Change of impact on eutrophication when fuel is substituted by calorific waste in the business
as usual scenario
4.2.5 Human toxicity and ecotoxicity
Industrial wastes (high or medium calorific) contain in general higher amounts of heavy
metals than fossil fuels, resulting in a general increase in environmental impact on toxicity
impact categories when 1 ton of these wastes replace an equivalent energetic amount of fossil
fuel.
Specialised incinerators such as rotary kilns are in general equipped with a thorough flue gas
cleaning system. This makes that the transfer coefficients of a rotary kiln are in general lower
than those of a cement kiln as can bee seen in Annex II. Less volatile heavy metals however,
such as copper (Cu), chromium (Cr) and nickel (Ni) can be trapped quite efficiently into the
clinker, resulting in rather low transfer coefficients for these heavy metals in cement kilns
[Section 5.1.5].
In general the substitution of different reference fuels by waste results in a lower impact on
human toxicity for the rotary kiln, compared with the cement kiln [Figures 20 and 21]. The
decrease of environmental impact on human toxicity when coal is substituted by solvents can
be attributed to the high content of arsenic in coal[Figure 20].
For a specialised incinerator emissions of nickel (Ni) are of most importance along with those
of chromium (Cr). For a cement kiln, next to these, also the emissions of the more volatile
heavy metals cadmium (Cd) and mercury (Hg) have to be considered for the environmental
impact on human toxicity.
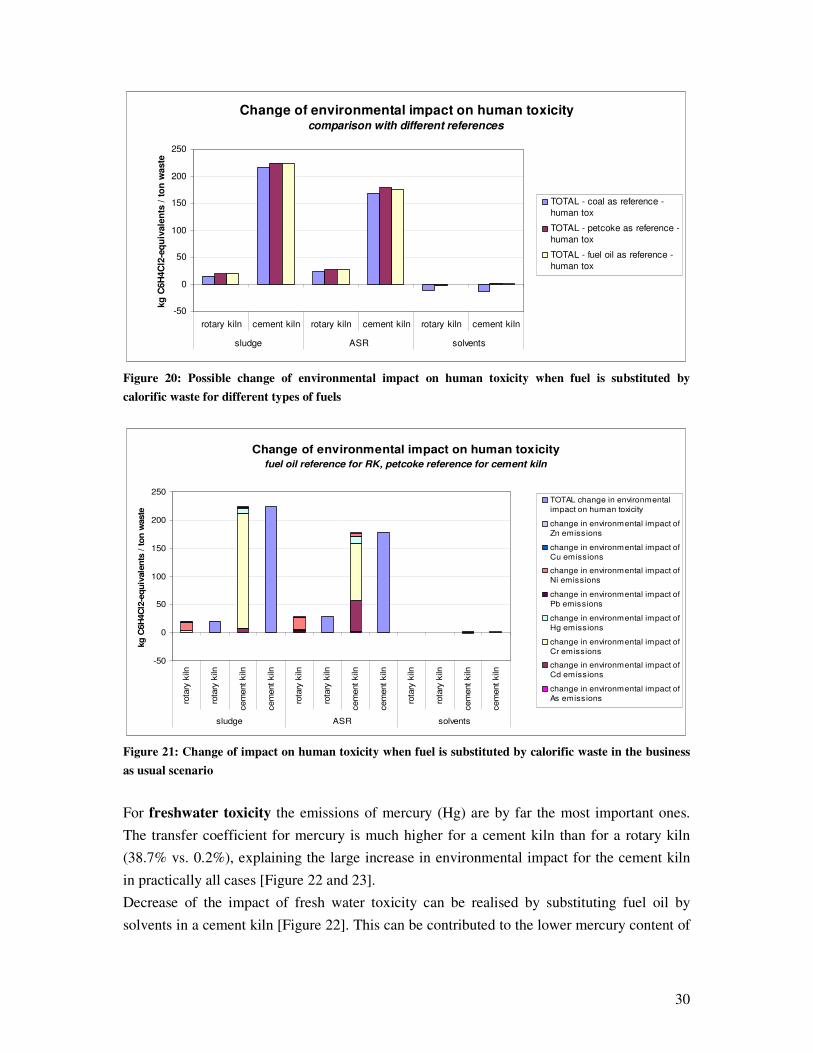
30
Change of environmental impact on human toxicity comparison with different references
-50
0
50
100
150
200
250
rotary kiln cement kiln rotary kiln cement kiln rotary kiln cement kiln
sludge ASR solvents
kg
C6H
4C
l2-e
qu
ivale
nts
/ t
on
waste
TOTAL - coal as reference -
human tox
TOTAL - petcoke as reference -
human tox
TOTAL - fuel oil as reference -
human tox
Figure 20: Possible change of environmental impact on human toxicity when fuel is substituted by
calorific waste for different types of fuels
Change of environmental impact on human toxicity
fuel oil reference for RK, petcoke reference for cement kiln
-50
0
50
100
150
200
250
rota
ry k
iln
rota
ry k
iln
cem
ent
kiln
cem
ent
kiln
rota
ry k
iln
rota
ry k
iln
cem
ent
kiln
cem
ent
kiln
rota
ry k
iln
rota
ry k
iln
cem
ent
kiln
cem
ent
kiln
sludge ASR solvents
kg
C6H
4C
l2-e
qu
ivale
nts
/ t
on
waste
TOTAL change in environmental
impact on human toxicity
change in environmental impact of
Zn emissions
change in environmental impact of
Cu emissions
change in environmental impact of
Ni emissions
change in environmental impact of
Pb emissions
change in environmental impact of
Hg emissions
change in environmental impact of
Cr emissions
change in environmental impact of
Cd emissions
change in environmental impact of
As emissions
Figure 21: Change of impact on human toxicity when fuel is substituted by calorific waste in the business
as usual scenario
For freshwater toxicity the emissions of mercury (Hg) are by far the most important ones.
The transfer coefficient for mercury is much higher for a cement kiln than for a rotary kiln
(38.7% vs. 0.2%), explaining the large increase in environmental impact for the cement kiln
in practically all cases [Figure 22 and 23].
Decrease of the impact of fresh water toxicity can be realised by substituting fuel oil by
solvents in a cement kiln [Figure 22]. This can be contributed to the lower mercury content of
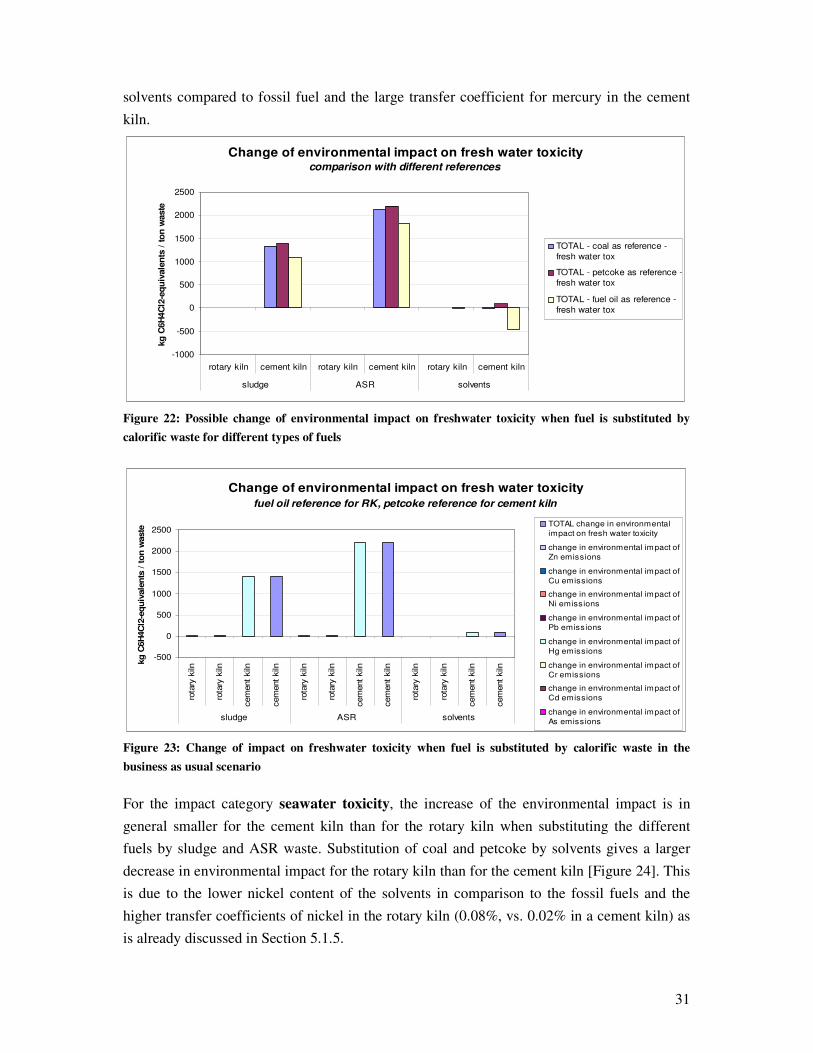
31
solvents compared to fossil fuel and the large transfer coefficient for mercury in the cement
kiln.
Change of environmental impact on fresh water toxicity comparison with different references
-1000
-500
0
500
1000
1500
2000
2500
rotary kiln cement kiln rotary kiln cement kiln rotary kiln cement kiln
sludge ASR solvents
kg
C6H
4C
l2-e
qu
ivale
nts
/ t
on
waste
TOTAL - coal as reference -
fresh water tox
TOTAL - petcoke as reference -
fresh water tox
TOTAL - fuel oil as reference -
fresh water tox
Figure 22: Possible change of environmental impact on freshwater toxicity when fuel is substituted by
calorific waste for different types of fuels
Change of environmental impact on fresh water toxicity
fuel oil reference for RK, petcoke reference for cement kiln
-500
0
500
1000
1500
2000
2500
rota
ry k
iln
rota
ry k
iln
cem
ent
kiln
cem
ent
kiln
rota
ry k
iln
rota
ry k
iln
cem
ent
kiln
cem
ent
kiln
rota
ry k
iln
rota
ry k
iln
cem
ent
kiln
cem
ent
kiln
sludge ASR solvents
kg
C6H
4C
l2-e
qu
ivale
nts
/ t
on
waste
TOTAL change in environmental
impact on fresh water toxicity
change in environmental impact of
Zn emissions
change in environmental impact of
Cu emissions
change in environmental impact of
Ni emissions
change in environmental impact of
Pb emissions
change in environmental impact of
Hg emissions
change in environmental impact of
Cr emissions
change in environmental impact of
Cd emissions
change in environmental impact of
As emissions
Figure 23: Change of impact on freshwater toxicity when fuel is substituted by calorific waste in the
business as usual scenario
For the impact category seawater toxicity, the increase of the environmental impact is in
general smaller for the cement kiln than for the rotary kiln when substituting the different
fuels by sludge and ASR waste. Substitution of coal and petcoke by solvents gives a larger
decrease in environmental impact for the rotary kiln than for the cement kiln [Figure 24]. This
is due to the lower nickel content of the solvents in comparison to the fossil fuels and the
higher transfer coefficients of nickel in the rotary kiln (0.08%, vs. 0.02% in a cement kiln) as
is already discussed in Section 5.1.5.
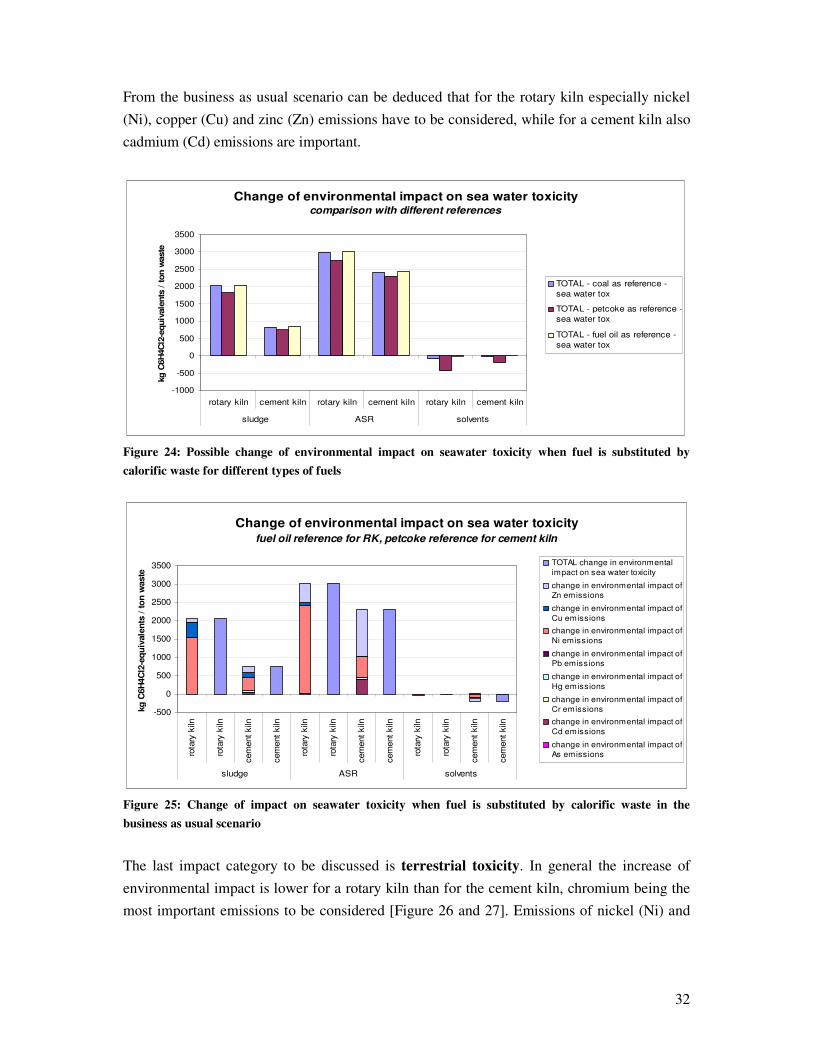
32
From the business as usual scenario can be deduced that for the rotary kiln especially nickel
(Ni), copper (Cu) and zinc (Zn) emissions have to be considered, while for a cement kiln also
cadmium (Cd) emissions are important.
Change of environmental impact on sea water toxicity comparison with different references
-1000
-500
0
500
1000
1500
2000
2500
3000
3500
rotary kiln cement kiln rotary kiln cement kiln rotary kiln cement kiln
sludge ASR solvents
kg
C6H
4C
l2-e
qu
ivale
nts
/ t
on
waste
TOTAL - coal as reference -
sea water tox
TOTAL - petcoke as reference -
sea water tox
TOTAL - fuel oil as reference -
sea water tox
Figure 24: Possible change of environmental impact on seawater toxicity when fuel is substituted by
calorific waste for different types of fuels
Change of environmental impact on sea water toxicity fuel oil reference for RK, petcoke reference for cement kiln
-500
0
500
1000
1500
2000
2500
3000
3500
rota
ry k
iln
rota
ry k
iln
cem
ent
kiln
cem
ent
kiln
rota
ry k
iln
rota
ry k
iln
cem
ent
kiln
cem
ent
kiln
rota
ry k
iln
rota
ry k
iln
cem
ent
kiln
cem
ent
kiln
sludge ASR solvents
kg
C6H
4C
l2-e
qu
ivale
nts
/ t
on
waste
TOTAL change in environmental
impact on sea water toxicity
change in environmental impact of
Zn emissions
change in environmental impact of
Cu emissions
change in environmental impact of
Ni emissions
change in environmental impact of
Pb emissions
change in environmental impact of
Hg emissions
change in environmental impact of
Cr emissions
change in environmental impact of
Cd emissions
change in environmental impact of
As emissions
Figure 25: Change of impact on seawater toxicity when fuel is substituted by calorific waste in the
business as usual scenario
The last impact category to be discussed is terrestrial toxicity. In general the increase of
environmental impact is lower for a rotary kiln than for the cement kiln, chromium being the
most important emissions to be considered [Figure 26 and 27]. Emissions of nickel (Ni) and
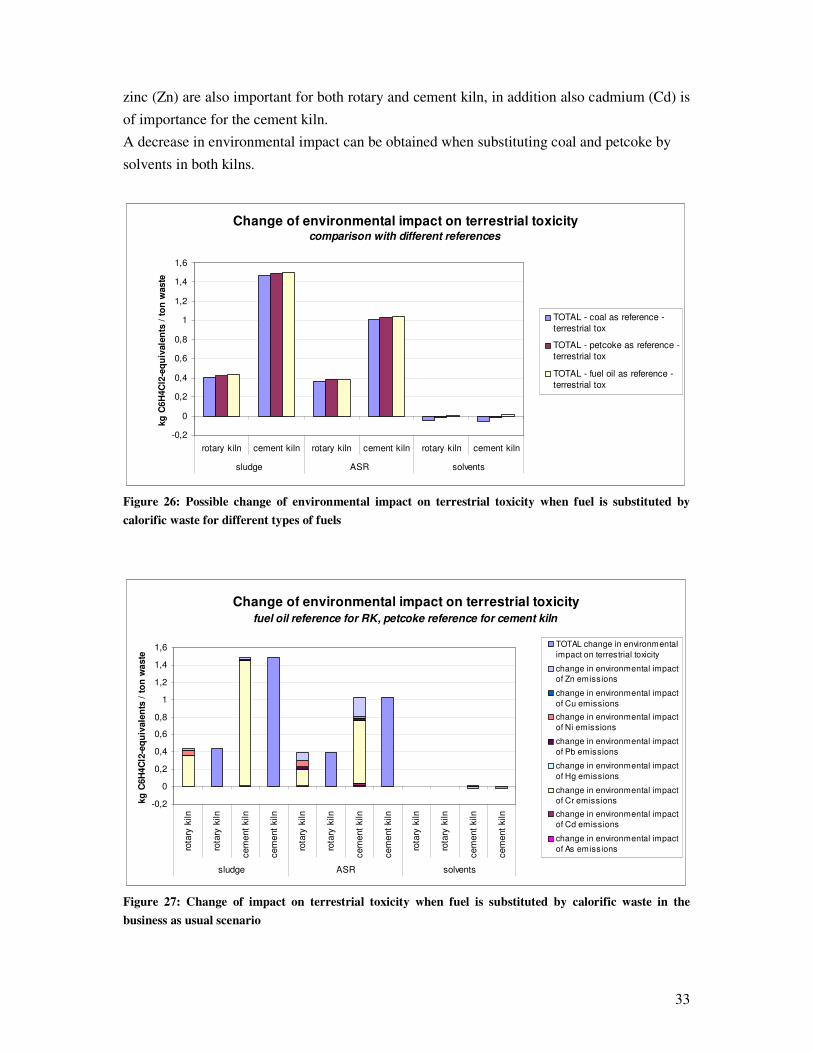
33
zinc (Zn) are also important for both rotary and cement kiln, in addition also cadmium (Cd) is
of importance for the cement kiln.
A decrease in environmental impact can be obtained when substituting coal and petcoke by
solvents in both kilns.
Change of environmental impact on terrestrial toxicity comparison with different references
-0,2
0
0,2
0,4
0,6
0,8
1
1,2
1,4
1,6
rotary kiln cement kiln rotary kiln cement kiln rotary kiln cement kiln
sludge ASR solvents
kg
C6H
4C
l2-e
qu
ivale
nts
/ t
on
waste
TOTAL - coal as reference -
terrestrial tox
TOTAL - petcoke as reference -
terrestrial tox
TOTAL - fuel oil as reference -
terrestrial tox
Figure 26: Possible change of environmental impact on terrestrial toxicity when fuel is substituted by
calorific waste for different types of fuels
Change of environmental impact on terrestrial toxicity fuel oil reference for RK, petcoke reference for cement kiln
-0,2
0
0,2
0,4
0,6
0,8
1
1,2
1,4
1,6
rota
ry k
iln
rota
ry k
iln
cem
ent
kiln
cem
ent
kiln
rota
ry k
iln
rota
ry k
iln
cem
ent
kiln
cem
ent
kiln
rota
ry k
iln
rota
ry k
iln
cem
ent
kiln
cem
ent
kiln
sludge ASR solvents
kg
C6H
4C
l2-e
qu
ivale
nts
/ t
on
waste
TOTAL change in environmental
impact on terrestrial toxicity
change in environmental impact
of Zn emissions
change in environmental impact
of Cu emissions
change in environmental impact
of Ni emissions
change in environmental impact
of Pb emissions
change in environmental impact
of Hg emissions
change in environmental impact
of Cr emissions
change in environmental impact
of Cd emissions
change in environmental impact
of As emissions
Figure 27: Change of impact on terrestrial toxicity when fuel is substituted by calorific waste in the
business as usual scenario
34
4.2.6 Conclusions
From the point of view of resource conservation both systems show in general comparable
changes when the actually used fuels in Belgium are substituted by calorific waste in both
kilns. When, however, the same reference fuels are (hypothetically) substituted by waste in
both installations, substitution of the fuel by calorific waste in a rotary kiln is in general more
advantageous: for global warming the improvement is the same, for sea water toxicity the
cement kiln is more advantageous and for all other impact categories (acidification,
photochemical ozone creation, eutrophication, human toxicity, fresh water toxicity and
terrestrial toxicity) the rotary kiln scores better. The results of the comparison of both kilns
depends thus strongly on the choice of the reference fuel. When fuels containing a high
amount of carbon or impurities, are substituted by a rather clean industrial waste, there is an
improvement of the environmental impact. Moreover, this improvement will be the highest
when the transfer coefficients of the pollutants are the highest. It should be kept in mind that
the highest transfer coefficients also result in the highest absolute environmental impact
(Section 3.1 and 4.1).
35
5 General conclusion
In this study a methodology has been developed to investigate the environmental impact when
substituting fuel by medium and high calorific industrial waste (sludge, ASR and solvents) in
a rotary kiln and in a cement kiln. Despite their intrinsic differences we have considered the
substitution of fuel by industrial waste in a rotary kiln as an activity, comparable to the
substitution in a cement kiln, for these industrial waste types. The impact categories global
warming, acidification, photochemical ozone creation, eutrophication, human toxicity, fresh
water toxicity, sea water toxicity and terrestrial toxicity are considered.
In our opinion two aspects must be considered:
The absolute environmental impact when incinerating 1 ton of industrial waste, reflects the
effectiveness of the flue gas cleaning systems of the incinerators, the capability of trapping
heavy metals or SO2 in the clinker or the ashes and the energy efficiency of the incinerator,
including the avoided emissions due to electricity and steam generation. It is clear that the
process yielding the least environmental impact should in principle be preferred.
The second important aspect is the change of environmental impact when substituting an
equivalent amount of fossil fuel by 1 ton calorific industrial waste. First the current situation
in Belgium was investigated, considering the substitution of the actually used fuels in both
processes in Belgium, namely fuel oil (recycled oil to be precise) for rotary kilns and petcokes
for cement kilns. Next to this also the change in environmental impact, when (hypothetically)
substituting other types of fossil fuels (coal, petcoke, fuel oil) in both kilns, was estimated
[Section 5.2, Annex III]. Indeed simply making the calculation for the currently used fuel
would give a biased analysis as it assumes that the selection of this fuel would be optimal
from an environmental point of view, while this choice is in general merely based on prise
and availability.
It may be concluded that considering the absolute emissions, for almost each impact category
(except for sea water toxicity) the impact of incinerating calorific waste in the rotary kiln is
considerably smaller than for a cement kiln. This can mainly be explained by the higher
effectiveness of the flue gas cleaning of the rotary kiln and to some extent also by the avoided
emissions due to steam and electricity generation.
When considering the change of environmental impact when replacing the actually used fossil
fuels in Belgium (business as usual scenario), both systems show in general comparable
changes. When, however, the same reference fuels are (hypothetically) substituted in both
installations, the substitution of fuel by calorific waste is in general more advantageous in a
36
rotary kiln. The incineration of the industrial waste in the rotary kiln results indeed in a lower
impact for all impact categories, with exception for the category global warming, giving the
same result for both processes
The specific results when comparing both kilns are thus strongly dependent on the choice of
reference fuel and the specific characteristics of the calorific waste. When fuels containing a
higher amount of carbon or impurities are substituted by a rather clean calorific waste, there is
an improvement of the environmental impact. For instance, if a calorific waste contains less
contaminants than the fuel, it can be noticed that substitution of the most carbon containing,
impure fossil fuel results in the highest environmental improvement. Moreover, the
improvement will be highest when the transfer coefficients of the pollutants (for both fuel and
the calorific waste) are highest, while it is obvious that the latter causes also the highest
absolute environmental impact.
This shows clearly that the calculations of the absolute environmental impact and of the
change of the environmental impact when fuel is substituted by calorific waste in different
kilns, are complementary and are both required. Besides environmental aspects, also social
and economical consequences are of great importance when making general waste
management decisions. They are however out of the scope of this study.
From this study can be concluded that cement kilns show opportunities in improving their
environmental impact when substituting their currently used fuels by high or medium calorific
wastes. These are rather short term solutions for a lot of high or medium calorific wastes,
since the transfers of sulphur, nitrogen and (volatile) heavy metals into air remain relatively
high for cement kilns. Besides, we believe that in an installation first the flue gas cleaning
should be optimised to achieve a minimal absolute environmental impact. Only then it makes
sense to consider the replacement of fuel by waste in order to further improve the situation
and conserve resources. Moreover for such comparisons it is best to start from an optimal
fuel, not from one containing much carbon per calorific value or a lot of pollutants.
37
6 References
Abanades S., Flamant G., Gagnepain B., Gauthier D., Fate of heavy metals during municipal
solid waste incineration; Waste Management & Research 20; p 55 – 68; 2002
Afsharvahid S., Ashman P.J., Dally B.B., Investigation of NOx conversion characteristics in a
porous medium; Combustion and Flame 152; p 604 – 615; 2008
Alsop P.A., Chen H., Tseng H.H., Cement plant operations handbook: for dry process plants;
Tradeship Publications Ltd, Surrey, UK; 2007
Astrup T., Mosbaek H., Christensen T.H., Assessment of long-term leaching from waste
incineration air-pollution-control residues; Waste Management 26; p 803 – 814, 2006
Baumbach G., Air Pollution Control; Springer; Berlin, Heidelberg; 1996
Barros H., Sajo-Bohus L., Abril J.M., Greaves E.D., Radioactivity concentration and heavy
metal content in fuel oil and oil-ashes in Venezuela, Radioprotection Suppl. 1, Vol 40; p S183
– S189; 2005
Belevi H., Moench H., Factors determining the element behaviour in municipal solid waste
incinerators; Environmental Science and Technology 34 (12); p 2501 – 2506; 2000
Bolwerk R., Co-processing of Waste and Energy Efficiency by Cement Plants; Council
Government Münster; 2006
Börjeson L., Löfvenus G., Hjelt M., Characterization of automotive shredder residues from
two shredding facilities with different refining processes in Sweden, Waste management &
Research 18, p 358 – 366; 2000
Bruder-Hubscher V., Lagarde F., Leroy M.J.F., Coughanowr C., Enguehard F., Application of
a sequential extraction procedure to study the release of elements from municipal solid waste
incineration bottom ash; Analytica Chimica Acta 451; p 285 – 295; 2002
Canonico J.S., Katz A.L., Managing secondary sludge at international paper’s Ticonderoga
mill, Ticonderoga - New York; 2000
38
Chen J., Lu X., Progress of petroleum coke combusting in circulating fluidized bed boilers –
A review and future perspectives, Resource Conservation & Recycling 49; p 203 – 216; 2007
Chyand C.-S., Wu K.-T., Lin C.-S., Emissions of nitrogen oxides in a vortexing fluidized bed
combustor; Fuel 86; p 234 – 243; 2007
Conesa J.A., Galvez A., Mateos F., Martin-Gullon I., Font R., Organic and inorganic
pollutants from cement kiln stack feeding alternative fuels, Journal of Hazardous Material;
2008
Dagaut P., Glarborg P., Alzueta M.U., The oxidation of hydrogen cyanide and related
chemistry; Progress in Energy and Combustion Science 34; p 1 – 46; 2008
Denis S., Renzoni R., Fontaine J., Germain A., Corman L., Gilson P., Experimental
evaluation of emission factors of cement kilns burning hazardous wastes, Toxilogical and
Environmental Chemistry 74; p 155-163, 1999
De Vos S., Ligthart T., Görtzn J., Mulder E., LCA of Thermal treatment of waste streams in
the clinker production in Belgium. Comparison to alternative treatment options, Environment
Health and Safety; 2007
Elled A.-E., Amand L.-E., Leckner B., Andersson B.-A., The fate of trace elements in
fluidised bed combustion of sewage sludge and wood, Fuel 86; p843 – 852; 2007
Finnveden G., Björklund A., Reich M.C., Eriksson O., Sörbom A., Flexible and robust
strategies for waste management in Sweden; Waste Management 27, p S1 – S8; 2007
Fiorucci P., Minciardi R., Robba M., Sacile R., Solid waste management in urban areas –
Development and application of a decision support system; Resources, Conservation and
recycling 37; p 301 – 328; 2003
Font R., Fullana A., Conesa J.A., Llavador F., Analysis of the pyrolysis and combustion of
different sewage sludges by TG, Journal of Analytical and applied pyrolysis 58 – 59; p 927 –
941; 2001
Galvez A., Conesa J.A., Martin-Gullon I., Font R., Interaction between pollutants produced
in sewage sludge combustion and cement raw material, Chemosphere 69, p 387 – 394; 2007
39
Genon G. and Brizio E., Perspectives and limits for cement kilns as a destination for RDF;
Waste Management 28; p 2375 – 2385; 2008
Gieré R., Smith K., Blackford M., Chemical composition of fuels and emissions from a coal +
tire combustion experiment in a power station, Fuel 85; p 2278 – 2285; 2006
Glarborg P., Jensen A.D., Johnsson J.E., Fuel nitrogen conversion in solid fuel fired systems;
Progress in Energy and Combustion Science 2; p 89 - 113; 2003
Hellweg S., Time and Site-Dependent Life-Cycle Assessment of Thermal Waste Treatment
Processes; doctoral thesis submitted to the Swiss Federal Institute of Technology; Zurich;
2000
Hellweg S., Hofstetter T.B., Hungerbühler K., Time-dependent life-cycle assessment of slag
landfills with the help of scenario analysis: the example of Cd and Cu; Journal of Cleaner
Production 13; p 301 – 320; 2005
Hendrik G. van Oss and Amy C. Padovani, Cement Manufacture and the Environment - Part
II: Environmental Challenges and Opportunities; Journal of Industrial Ecology 7 (1); p 93 –
126; 2003
Hewlett P.C., Lea’s chemistry of cement and concrete; Elsevier, London; 1998
Hofstetter T.B., Capello C., Hungerbuhler K., Environmentally preferable treatment options
for industrial waste solvent management –A case study of a toluene containing waste solvent-
Trans IChemE 81, Part B; 2003
Jones J.M., Patterson P.M., Pourkashanian M., Williams A., Arenillas A., Rubiera F., Pis J.J.,
Modelling NOx formation in coal particle combustion at high temperature: an investigation of
the devolatilisation kinetic factors; Fuel 78; p 1171 – 1179; 1999
Kääntee U., Zevenhoven R., Backman R., Hupa M., Cement manufacturing using alternative
fuels and the advantages of process modelling; Fuel Processing Technology 85; p 293 – 301;
2004
Kashireninov O.E. and Fontijn A., Modelling of chromium combustion in incineration:
thermochemistry of Cr-C-H-Cl combustion in air and selection of key reactions; Combustion
and Flame 113; p 498 – 506; 1998
40
Leckner B., Amand, L.-E., Lücke K., Werther J., Gaseous emissions from co-combustion of
sewage sludge and coal/wood in a fluidized bed, Fuel 83, p 477 – 486; 2004
McIlveen-Wright D.R., Huang Y., Rezvani S., Wang Y., A technical and environmental
analysis of co-combustion of coal and biomass in fluidised bed technologiesI, Fuel 86, p 2032
– 2042; 2007
Ministerium für Umwelt and Naturschutz, Landwirtshaft und Verbraucherschutz des Landes
Nordrhein-Westfalen, Stoffflussanalyse bei abfallrechtlichen Beurteilungsfragen; 2000
Morf L.S., Brunner P.H., Effect of operating conditions and input variations on the
partitioning of metals in a municipal solid waste incinerator; Waste Management & Research
18; p 4 – 15; 2000
Nadziakiewicz J., Koziol M., Co-combustion of sludge with coal, Applied Energy 75; p 239 –
248; 2003
Nagpal S., Sarkar T.K., Sen P.K., Simulation of petcoke gasification in slagging moving bed
reactors, Fuel Processing Technology 86, p 617 – 640; 2005
Nourriddine M., Recycling of auto shredder residue, Journal of Hazardous Materials A139;
p481 – 490; 2007
Obersteiner G., Binner E., Mostbauer P., Salhofer S., Landfill modelling in LCA – A
contribution base don empirical data; Waste Management 27; p S58 – S74; 2007
Pavlas M. and Tous M., Efficient waste-to-energy system as a contribution to clean
technologies; Clean Techn Environ Policy 11; p 19 – 29; 2009
Rabl A., Spadaro J.V., Zoughaib A., Environmental impacts and costs of solid waste: a
comparison of landfill and incineration; Waste Management 26; p 147 – 162; 2008
Ragosnig A.M., Lorber K.E., Combined incineration of industrial wastes with in-plant
residues in fluidized-bed utility boilers – decision relevant factors, Waste Management &
Research 23; p 448 – 456; 2005
Rogaume T., Richard F., Jabuille F., Torero J.L., Computational Model of the impact of the
combustion regime on the mechanisms of NOx formation during waste incineration,
Proceedings of the Europian Combustion Meeting; 2005
41
Roy C., Chaala A., Vacuum pyrolysis of automobile shredder residues, Resource
Conservation & Recycling 32; p1 – 27; 2001
Saft R.J., Life cycle assessment of a pysolysis/gasification plant for hazardous paint waste,
Internationional Journal of LCA - LCA Case studies – 12(4); p 230 – 238; 2007
Seyler C., Hofstetter T.B., Hungerbühler K., Life cycle inventory for thermal treatment of
waste solvent from chemical industry: a multi input allocation model; Journal of Cleaner
Production 13; p 1211 – 1224; 2005
Spliethoff H., Scheurer W., Hein K.R.G., Effect of co-combustion of sewage sludge and
biomass on emissions and heavy metals behaviour, Trans IChemE 78, Part B; 2000
Streibel T., Hafner K., Mühlberger F., Adam T., Warnecke R., Zimmermann R.,
Investigation of NOx precursor compounds and other combustion by-products in the primary
combustion zone of a waste-incineration plant using on-line, real-time mass spectrometry and
Fourier-transform infrared spectrometry (FTIR); Analytical Bioanalytical Chemistry 384; p
1096 – 1106; 2006
Turunen M., Peraniemi S., Ahlgren M., Westerholm H., Determination of tracé elements in
heavy oil samples by graphite furnace and cold vapour atomic absorption spectrometry after
acid digestionI, Analytica Chemica Acta 311; p 85 – 91; 1995
Van de Velden M., Dewil R., Baeyens J., Josson L., Lanssens P., The distribution of heavy
metals during fluidized bed combustion of sludge (FBSC), Journal of hazardous materials 151;
p 96 – 102; 2008
VITO, Coverbranding: Cementoven; BBT-kenniscentrum, VITO; 2001
Vouk V.B., Piver W.T., Metallic elements in fossil fuel combustion products: Amount and
form of emissions and evaluation of carcinogenicity and mutagenicity, Environmetal Health
Perspectives 47; p201 – 225; 1983
Werther J., Ogada T., Sewage sludge combustion, Progress in energy and combustion science
25, p 55 – 116; 1999
Winter F., Wartha C., Hofbauer H., NO and N2O formation during the combustion of wood,
straw, malt waste and peat; Bioresource Technology 70; p 39 – 49; 1999
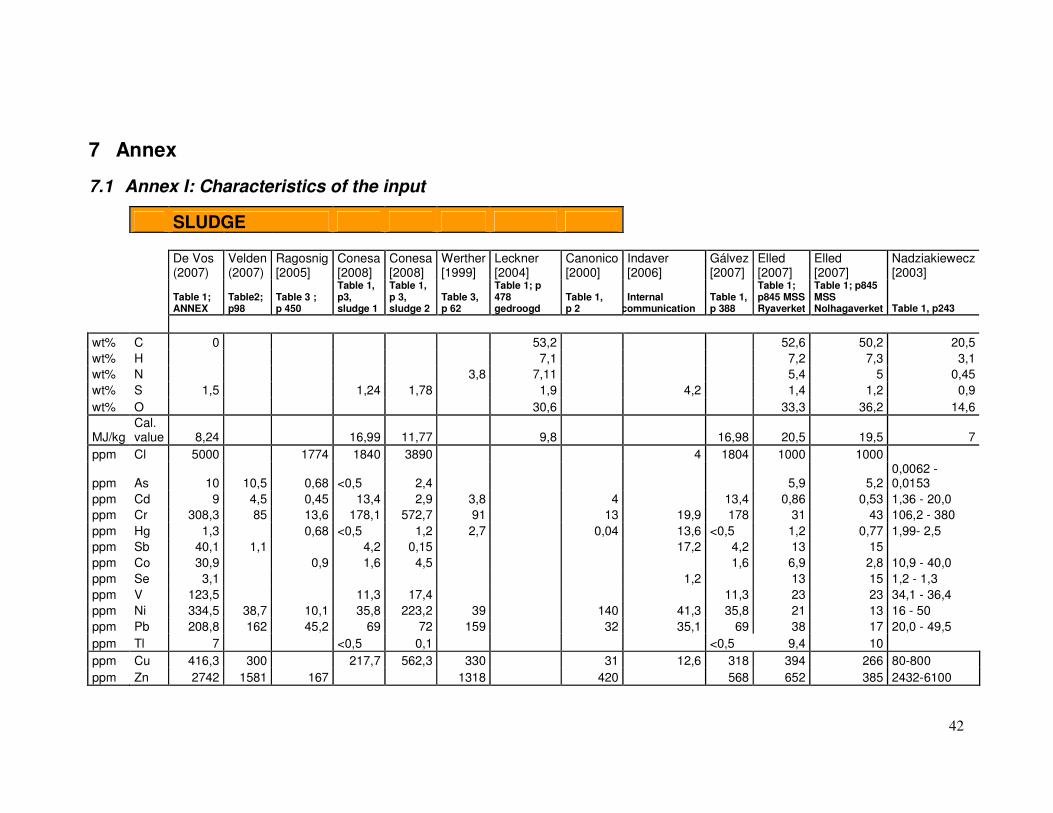
42
7 Annex
7.1 Annex I: Characteristics of the input
SLUDGE
De Vos (2007)
Velden (2007)
Ragosnig [2005]
Conesa [2008]
Conesa [2008]
Werther [1999]
Leckner [2004]
Canonico [2000]
Indaver [2006]
Gálvez [2007]
Elled [2007]
Elled [2007]
Nadziakiewecz [2003]
Table 1; ANNEX
Table2; p98
Table 3 ; p 450
Table 1, p3, sludge 1
Table 1, p 3, sludge 2
Table 3, p 62
Table 1; p 478 gedroogd
Table 1, p 2
Internal communication
Table 1, p 388
Table 1; p845 MSS Ryaverket
Table 1; p845 MSS Nolhagaverket Table 1, p243
wt% C 0 53,2 52,6 50,2 20,5
wt% H 7,1 7,2 7,3 3,1
wt% N 3,8 7,11 5,4 5 0,45
wt% S 1,5 1,24 1,78 1,9 4,2 1,4 1,2 0,9
wt% O 30,6 33,3 36,2 14,6
MJ/kg Cal. value 8,24 16,99 11,77 9,8 16,98 20,5 19,5 7
ppm Cl 5000 1774 1840 3890 4 1804 1000 1000
ppm As 10 10,5 0,68 <0,5 2,4 5,9 5,2 0,0062 - 0,0153
ppm Cd 9 4,5 0,45 13,4 2,9 3,8 4 13,4 0,86 0,53 1,36 - 20,0
ppm Cr 308,3 85 13,6 178,1 572,7 91 13 19,9 178 31 43 106,2 - 380
ppm Hg 1,3 0,68 <0,5 1,2 2,7 0,04 13,6 <0,5 1,2 0,77 1,99- 2,5
ppm Sb 40,1 1,1 4,2 0,15 17,2 4,2 13 15
ppm Co 30,9 0,9 1,6 4,5 1,6 6,9 2,8 10,9 - 40,0
ppm Se 3,1 1,2 13 15 1,2 - 1,3
ppm V 123,5 11,3 17,4 11,3 23 23 34,1 - 36,4
ppm Ni 334,5 38,7 10,1 35,8 223,2 39 140 41,3 35,8 21 13 16 - 50
ppm Pb 208,8 162 45,2 69 72 159 32 35,1 69 38 17 20,0 - 49,5
ppm Tl 7 <0,5 0,1 <0,5 9,4 10
ppm Cu 416,3 300 217,7 562,3 330 31 12,6 318 394 266 80-800
ppm Zn 2742 1581 167 1318 420 568 652 385 2432-6100
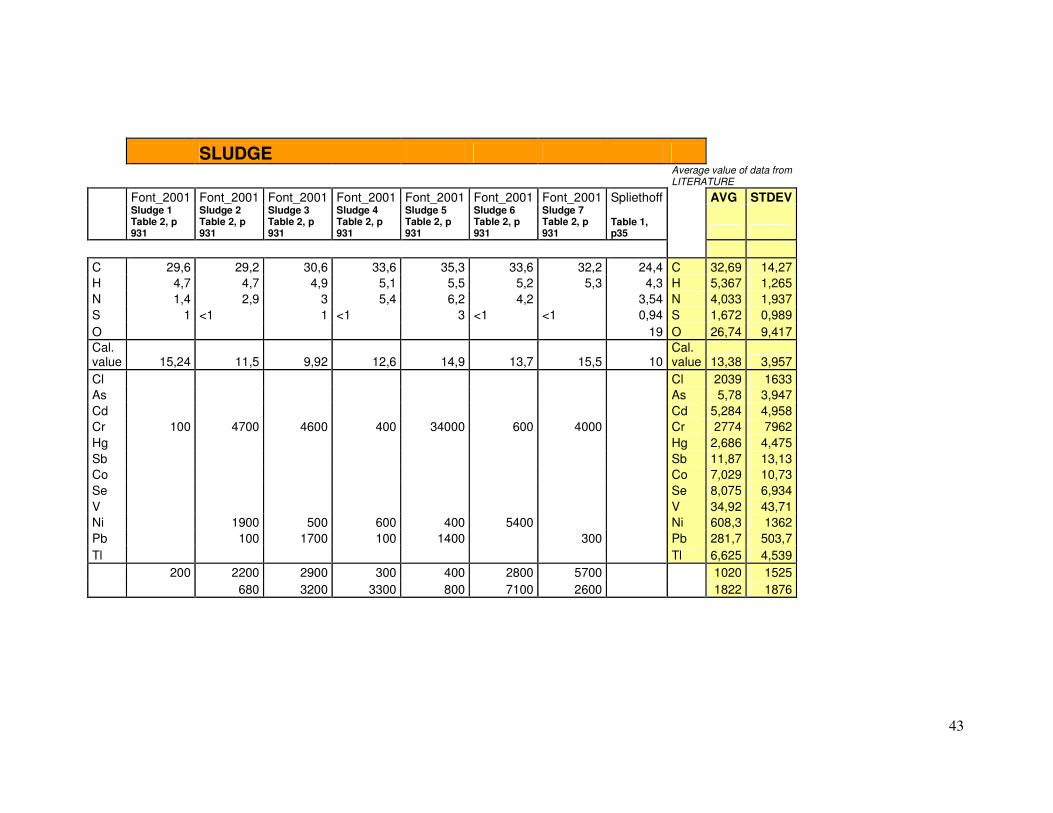
43
SLUDGE
Average value of data from LITERATURE
Font_2001 Font_2001 Font_2001 Font_2001 Font_2001 Font_2001 Font_2001 Spliethoff AVG STDEV
Sludge 1 Table 2, p 931
Sludge 2 Table 2, p 931
Sludge 3 Table 2, p 931
Sludge 4 Table 2, p 931
Sludge 5 Table 2, p 931
Sludge 6 Table 2, p 931
Sludge 7 Table 2, p 931
Table 1, p35
C 29,6 29,2 30,6 33,6 35,3 33,6 32,2 24,4 C 32,69 14,27
H 4,7 4,7 4,9 5,1 5,5 5,2 5,3 4,3 H 5,367 1,265
N 1,4 2,9 3 5,4 6,2 4,2 3,54 N 4,033 1,937
S 1 <1 1 <1 3 <1 <1 0,94 S 1,672 0,989
O 19 O 26,74 9,417
Cal. value 15,24 11,5 9,92 12,6 14,9 13,7 15,5 10
Cal. value 13,38 3,957
Cl Cl 2039 1633
As As 5,78 3,947
Cd Cd 5,284 4,958
Cr 100 4700 4600 400 34000 600 4000 Cr 2774 7962
Hg Hg 2,686 4,475
Sb Sb 11,87 13,13
Co Co 7,029 10,73
Se Se 8,075 6,934
V V 34,92 43,71
Ni 1900 500 600 400 5400 Ni 608,3 1362
Pb 100 1700 100 1400 300 Pb 281,7 503,7
Tl Tl 6,625 4,539
200 2200 2900 300 400 2800 5700 1020 1525
680 3200 3300 800 7100 2600 1822 1876
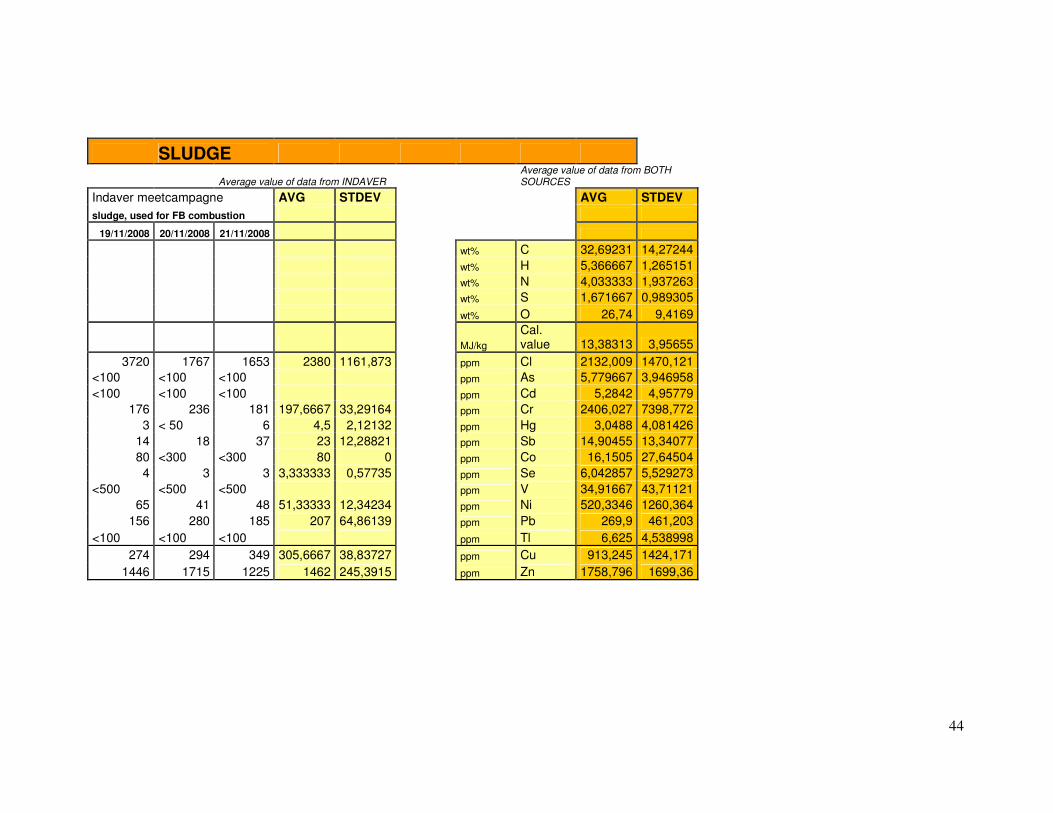
44
SLUDGE
Average value of data from INDAVER Average value of data from BOTH SOURCES
Indaver meetcampagne AVG STDEV AVG STDEV
sludge, used for FB combustion
19/11/2008 20/11/2008 21/11/2008
wt% C 32,69231 14,27244
wt% H 5,366667 1,265151
wt% N 4,033333 1,937263
wt% S 1,671667 0,989305
wt% O 26,74 9,4169
MJ/kg
Cal. value 13,38313 3,95655
3720 1767 1653 2380 1161,873 ppm Cl 2132,009 1470,121
<100 <100 <100 ppm As 5,779667 3,946958
<100 <100 <100 ppm Cd 5,2842 4,95779
176 236 181 197,6667 33,29164 ppm Cr 2406,027 7398,772
3 < 50 6 4,5 2,12132 ppm Hg 3,0488 4,081426
14 18 37 23 12,28821 ppm Sb 14,90455 13,34077
80 <300 <300 80 0 ppm Co 16,1505 27,64504
4 3 3 3,333333 0,57735 ppm Se 6,042857 5,529273
<500 <500 <500 ppm V 34,91667 43,71121
65 41 48 51,33333 12,34234 ppm Ni 520,3346 1260,364
156 280 185 207 64,86139 ppm Pb 269,9 461,203
<100 <100 <100 ppm Tl 6,625 4,538998
274 294 349 305,6667 38,83727 ppm Cu 913,245 1424,171
1446 1715 1225 1462 245,3915 ppm Zn 1758,796 1699,36
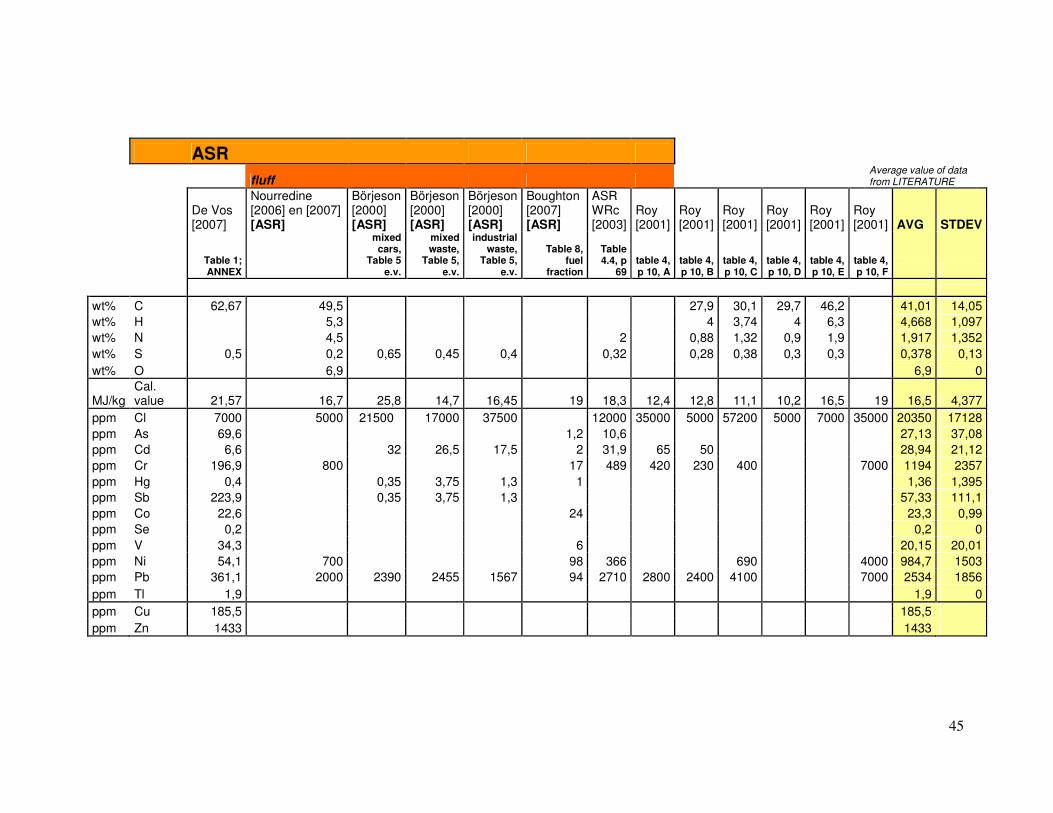
45
ASR
fluff Average value of data from LITERATURE
De Vos [2007]
Nourredine [2006] en [2007] [ASR]
Börjeson [2000] [ASR]
Börjeson [2000] [ASR]
Börjeson [2000] [ASR]
Boughton [2007] [ASR]
ASR WRc [2003]
Roy [2001]
Roy [2001]
Roy [2001]
Roy [2001]
Roy [2001]
Roy [2001] AVG STDEV
Table 1; ANNEX
mixed cars,
Table 5 e.v.
mixed waste,
Table 5, e.v.
industrial waste,
Table 5, e.v.
Table 8, fuel
fraction
Table 4.4, p
69 table 4, p 10, A
table 4, p 10, B
table 4, p 10, C
table 4, p 10, D
table 4, p 10, E
table 4, p 10, F
wt% C 62,67 49,5 27,9 30,1 29,7 46,2 41,01 14,05
wt% H 5,3 4 3,74 4 6,3 4,668 1,097
wt% N 4,5 2 0,88 1,32 0,9 1,9 1,917 1,352
wt% S 0,5 0,2 0,65 0,45 0,4 0,32 0,28 0,38 0,3 0,3 0,378 0,13
wt% O 6,9 6,9 0
MJ/kg Cal. value 21,57 16,7 25,8 14,7 16,45 19 18,3 12,4 12,8 11,1 10,2 16,5 19 16,5 4,377
ppm Cl 7000 5000 21500 17000 37500 12000 35000 5000 57200 5000 7000 35000 20350 17128
ppm As 69,6 1,2 10,6 27,13 37,08
ppm Cd 6,6 32 26,5 17,5 2 31,9 65 50 28,94 21,12
ppm Cr 196,9 800 17 489 420 230 400 7000 1194 2357
ppm Hg 0,4 0,35 3,75 1,3 1 1,36 1,395
ppm Sb 223,9 0,35 3,75 1,3 57,33 111,1
ppm Co 22,6 24 23,3 0,99
ppm Se 0,2 0,2 0
ppm V 34,3 6 20,15 20,01
ppm Ni 54,1 700 98 366 690 4000 984,7 1503
ppm Pb 361,1 2000 2390 2455 1567 94 2710 2800 2400 4100 7000 2534 1856
ppm Tl 1,9 1,9 0
ppm Cu 185,5 185,5
ppm Zn 1433 1433
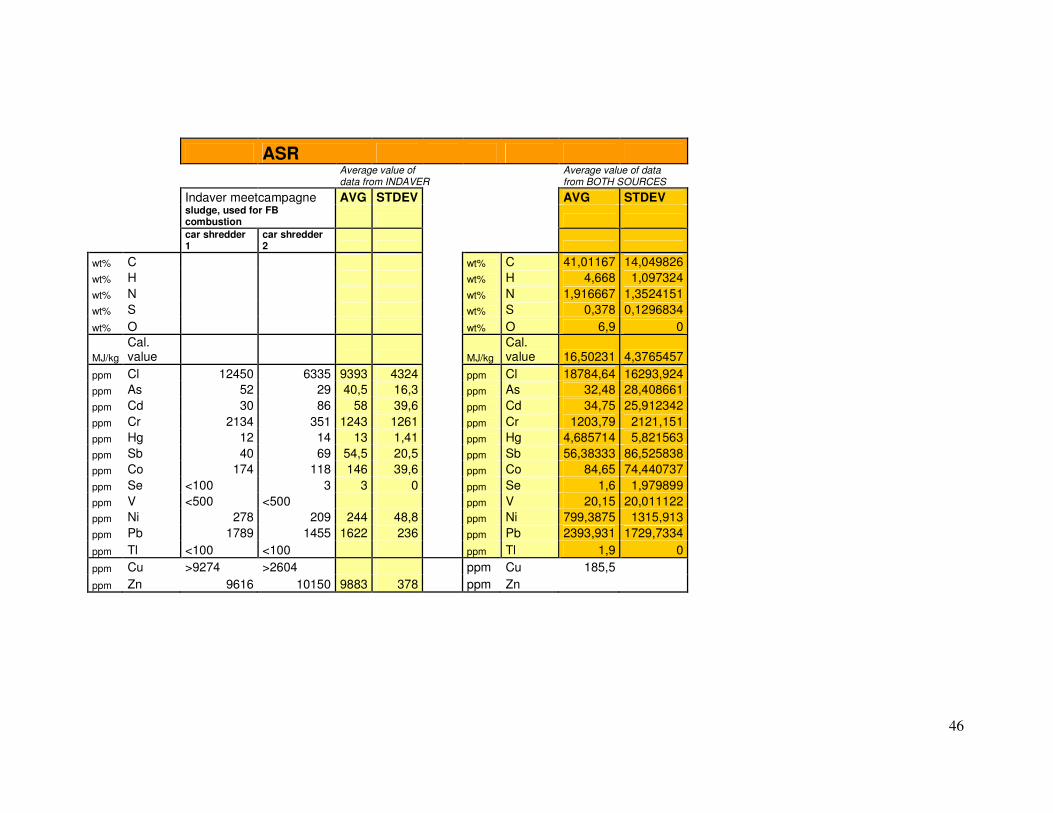
46
ASR
Average value of data from INDAVER
Average value of data from BOTH SOURCES
Indaver meetcampagne AVG STDEV AVG STDEV
sludge, used for FB combustion
car shredder 1
car shredder 2
wt% C wt% C 41,01167 14,049826
wt% H wt% H 4,668 1,097324
wt% N wt% N 1,916667 1,3524151
wt% S wt% S 0,378 0,1296834
wt% O wt% O 6,9 0
MJ/kg
Cal. value MJ/kg
Cal. value 16,50231 4,3765457
ppm Cl 12450 6335 9393 4324 ppm Cl 18784,64 16293,924
ppm As 52 29 40,5 16,3 ppm As 32,48 28,408661
ppm Cd 30 86 58 39,6 ppm Cd 34,75 25,912342
ppm Cr 2134 351 1243 1261 ppm Cr 1203,79 2121,151
ppm Hg 12 14 13 1,41 ppm Hg 4,685714 5,821563
ppm Sb 40 69 54,5 20,5 ppm Sb 56,38333 86,525838
ppm Co 174 118 146 39,6 ppm Co 84,65 74,440737
ppm Se <100 3 3 0 ppm Se 1,6 1,979899
ppm V <500 <500 ppm V 20,15 20,011122
ppm Ni 278 209 244 48,8 ppm Ni 799,3875 1315,913
ppm Pb 1789 1455 1622 236 ppm Pb 2393,931 1729,7334
ppm Tl <100 <100 ppm Tl 1,9 0
ppm Cu >9274 >2604 ppm Cu 185,5
ppm Zn 9616 10150 9883 378 ppm Zn
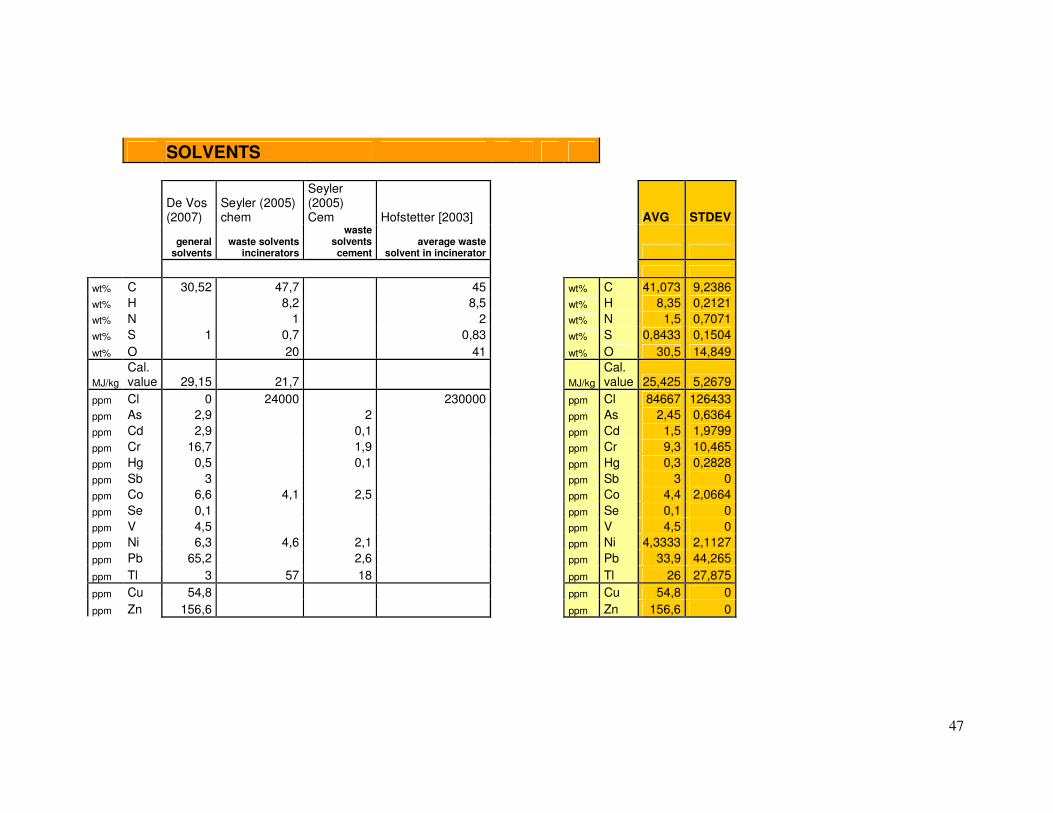
47
SOLVENTS
De Vos (2007)
Seyler (2005) chem
Seyler (2005) Cem Hofstetter [2003] AVG STDEV
general
solvents waste solvents
incinerators
waste solvents cement
average waste solvent in incinerator
wt% C 30,52 47,7 45 wt% C 41,073 9,2386
wt% H 8,2 8,5 wt% H 8,35 0,2121
wt% N 1 2 wt% N 1,5 0,7071
wt% S 1 0,7 0,83 wt% S 0,8433 0,1504
wt% O 20 41 wt% O 30,5 14,849
MJ/kg
Cal. value 29,15 21,7 MJ/kg
Cal. value 25,425 5,2679
ppm Cl 0 24000 230000 ppm Cl 84667 126433
ppm As 2,9 2 ppm As 2,45 0,6364
ppm Cd 2,9 0,1 ppm Cd 1,5 1,9799
ppm Cr 16,7 1,9 ppm Cr 9,3 10,465
ppm Hg 0,5 0,1 ppm Hg 0,3 0,2828
ppm Sb 3 ppm Sb 3 0
ppm Co 6,6 4,1 2,5 ppm Co 4,4 2,0664
ppm Se 0,1 ppm Se 0,1 0
ppm V 4,5 ppm V 4,5 0
ppm Ni 6,3 4,6 2,1 ppm Ni 4,3333 2,1127
ppm Pb 65,2 2,6 ppm Pb 33,9 44,265
ppm Tl 3 57 18 ppm Tl 26 27,875
ppm Cu 54,8 ppm Cu 54,8 0
ppm Zn 156,6 ppm Zn 156,6 0
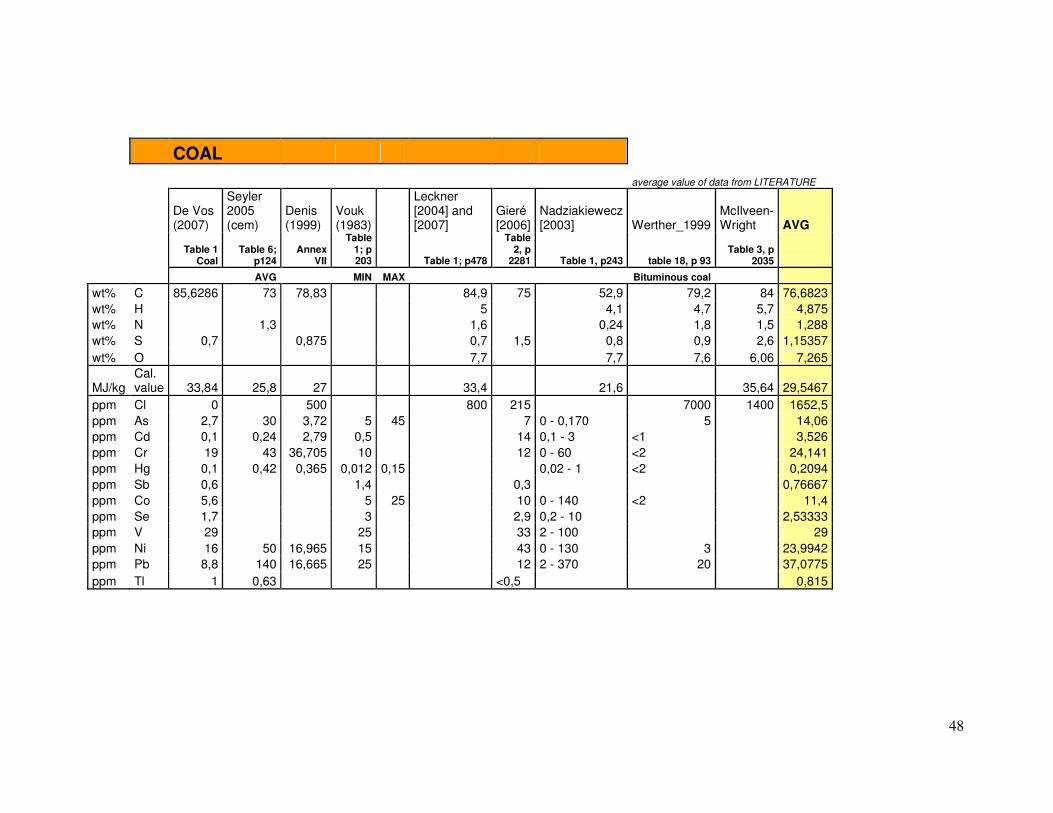
48
COAL
average value of data from LITERATURE
De Vos (2007)
Seyler 2005 (cem)
Denis (1999)
Vouk (1983)
Leckner [2004] and [2007]
Gieré [2006]
Nadziakiewecz [2003] Werther_1999
McIlveen-Wright AVG
Table 1
Coal Table 6;
p124 Annex
VII
Table 1; p 203 Table 1; p478
Table 2, p
2281 Table 1, p243 table 18, p 93 Table 3, p
2035
AVG MIN MAX Bituminous coal
wt% C 85,6286 73 78,83 84,9 75 52,9 79,2 84 76,6823
wt% H 5 4,1 4,7 5,7 4,875
wt% N 1,3 1,6 0,24 1,8 1,5 1,288
wt% S 0,7 0,875 0,7 1,5 0,8 0,9 2,6 1,15357
wt% O 7,7 7,7 7,6 6,06 7,265
MJ/kg Cal. value 33,84 25,8 27 33,4 21,6 35,64 29,5467
ppm Cl 0 500 800 215 7000 1400 1652,5
ppm As 2,7 30 3,72 5 45 7 0 - 0,170 5 14,06
ppm Cd 0,1 0,24 2,79 0,5 14 0,1 - 3 <1 3,526
ppm Cr 19 43 36,705 10 12 0 - 60 <2 24,141
ppm Hg 0,1 0,42 0,365 0,012 0,15 0,02 - 1 <2 0,2094
ppm Sb 0,6 1,4 0,3 0,76667
ppm Co 5,6 5 25 10 0 - 140 <2 11,4
ppm Se 1,7 3 2,9 0,2 - 10 2,53333
ppm V 29 25 33 2 - 100 29
ppm Ni 16 50 16,965 15 43 0 - 130 3 23,9942
ppm Pb 8,8 140 16,665 25 12 2 - 370 20 37,0775
ppm Tl 1 0,63 <0,5 0,815
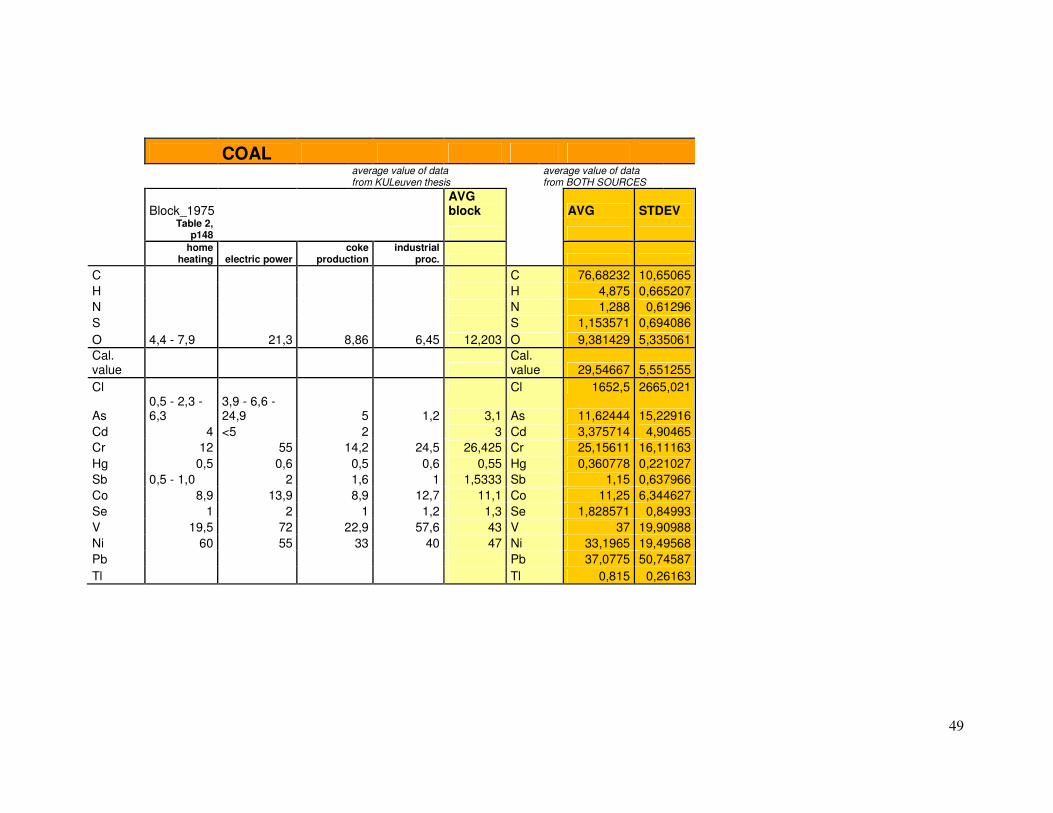
49
COAL
average value of data from KULeuven thesis
average value of data from BOTH SOURCES
Block_1975 AVG block AVG STDEV
Table 2,
p148
home
heating electric power coke
production industrial
proc.
C C 76,68232 10,65065
H H 4,875 0,665207
N N 1,288 0,61296
S S 1,153571 0,694086
O 4,4 - 7,9 21,3 8,86 6,45 12,203 O 9,381429 5,335061
Cal. value
Cal. value 29,54667 5,551255
Cl Cl 1652,5 2665,021
As 0,5 - 2,3 - 6,3
3,9 - 6,6 - 24,9 5 1,2 3,1 As 11,62444 15,22916
Cd 4 <5 2 3 Cd 3,375714 4,90465
Cr 12 55 14,2 24,5 26,425 Cr 25,15611 16,11163
Hg 0,5 0,6 0,5 0,6 0,55 Hg 0,360778 0,221027
Sb 0,5 - 1,0 2 1,6 1 1,5333 Sb 1,15 0,637966
Co 8,9 13,9 8,9 12,7 11,1 Co 11,25 6,344627
Se 1 2 1 1,2 1,3 Se 1,828571 0,84993
V 19,5 72 22,9 57,6 43 V 37 19,90988
Ni 60 55 33 40 47 Ni 33,1965 19,49568
Pb Pb 37,0775 50,74587
Tl Tl 0,815 0,26163
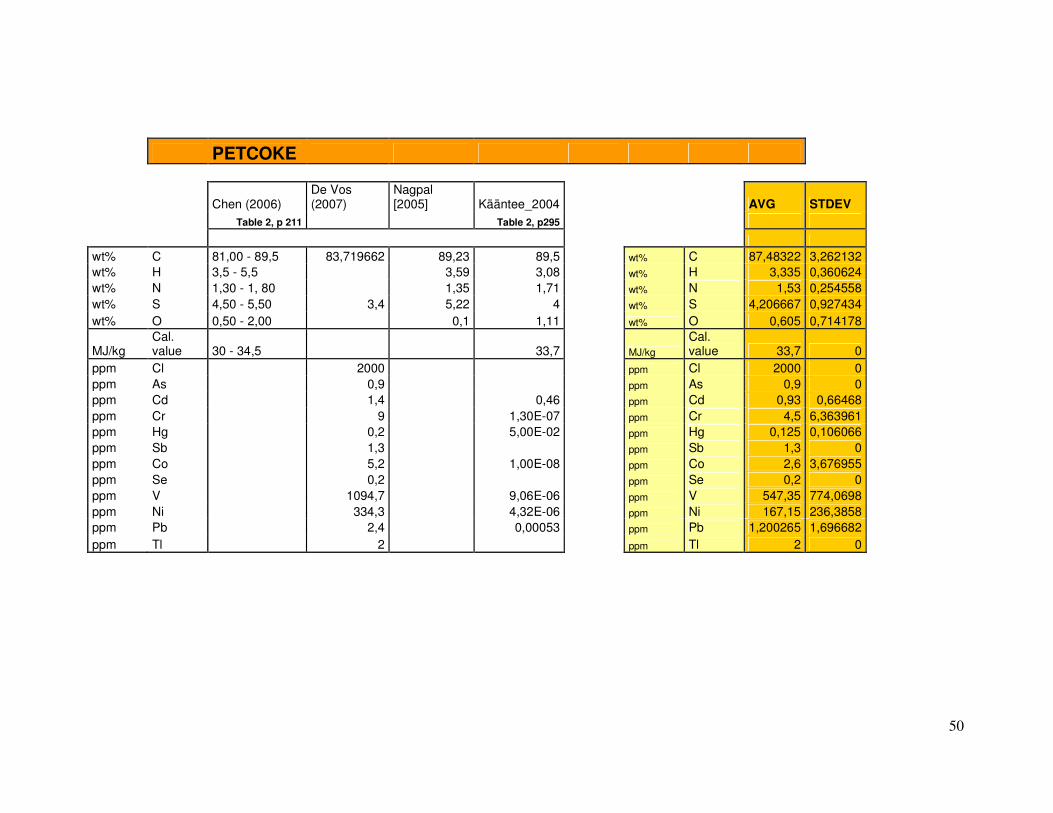
50
PETCOKE
Chen (2006) De Vos (2007)
Nagpal [2005] Kääntee_2004 AVG STDEV
Table 2, p 211 Table 2, p295
wt% C 81,00 - 89,5 83,719662 89,23 89,5 wt% C 87,48322 3,262132
wt% H 3,5 - 5,5 3,59 3,08 wt% H 3,335 0,360624
wt% N 1,30 - 1, 80 1,35 1,71 wt% N 1,53 0,254558
wt% S 4,50 - 5,50 3,4 5,22 4 wt% S 4,206667 0,927434
wt% O 0,50 - 2,00 0,1 1,11 wt% O 0,605 0,714178
MJ/kg Cal. value 30 - 34,5 33,7 MJ/kg
Cal. value 33,7 0
ppm Cl 2000 ppm Cl 2000 0
ppm As 0,9 ppm As 0,9 0
ppm Cd 1,4 0,46 ppm Cd 0,93 0,66468
ppm Cr 9 1,30E-07 ppm Cr 4,5 6,363961
ppm Hg 0,2 5,00E-02 ppm Hg 0,125 0,106066
ppm Sb 1,3 ppm Sb 1,3 0
ppm Co 5,2 1,00E-08 ppm Co 2,6 3,676955
ppm Se 0,2 ppm Se 0,2 0
ppm V 1094,7 9,06E-06 ppm V 547,35 774,0698
ppm Ni 334,3 4,32E-06 ppm Ni 167,15 236,3858
ppm Pb 2,4 0,00053 ppm Pb 1,200265 1,696682
ppm Tl 2 ppm Tl 2 0
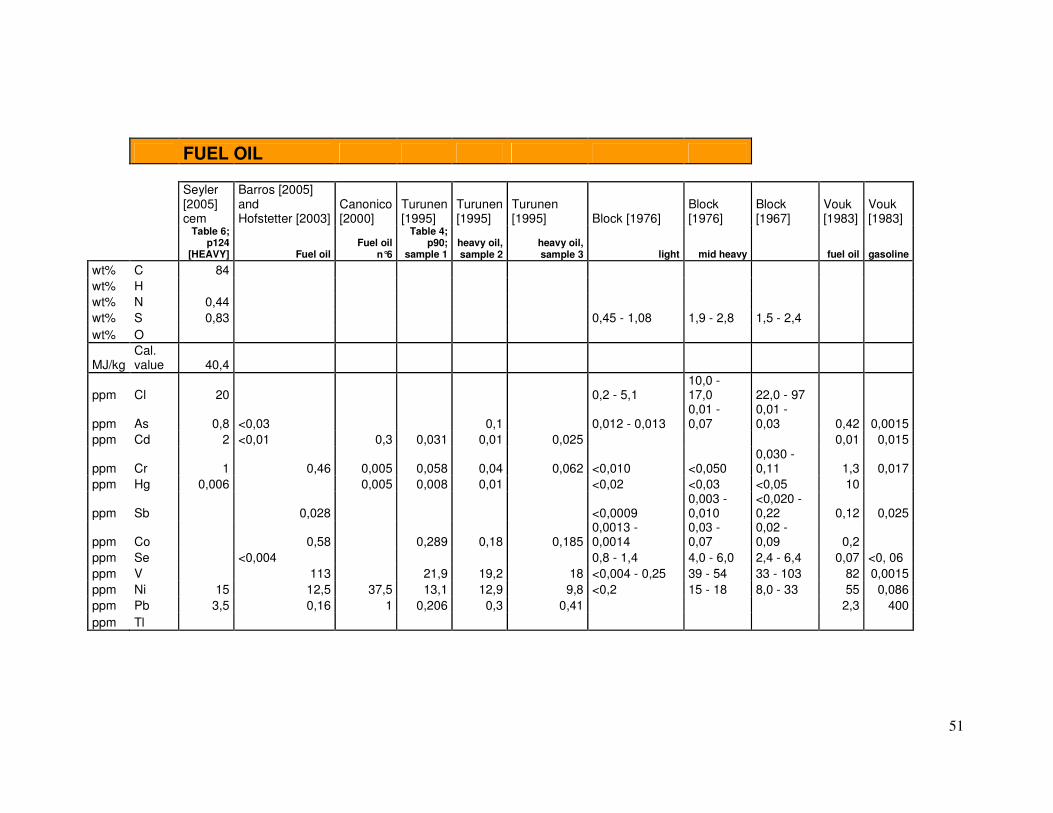
51
FUEL OIL
Seyler [2005] cem
Barros [2005] and Hofstetter [2003]
Canonico [2000]
Turunen [1995]
Turunen [1995]
Turunen [1995] Block [1976]
Block [1976]
Block [1967]
Vouk [1983]
Vouk [1983]
Table 6; p124
[HEAVY] Fuel oil Fuel oil
n°6
Table 4; p90;
sample 1 heavy oil, sample 2
heavy oil, sample 3 light mid heavy fuel oil gasoline
wt% C 84
wt% H
wt% N 0,44
wt% S 0,83 0,45 - 1,08 1,9 - 2,8 1,5 - 2,4
wt% O
MJ/kg Cal. value 40,4
ppm Cl 20 0,2 - 5,1 10,0 - 17,0 22,0 - 97
ppm As 0,8 <0,03 0,1 0,012 - 0,013 0,01 - 0,07
0,01 - 0,03 0,42 0,0015
ppm Cd 2 <0,01 0,3 0,031 0,01 0,025 0,01 0,015
ppm Cr 1 0,46 0,005 0,058 0,04 0,062 <0,010 <0,050 0,030 - 0,11 1,3 0,017
ppm Hg 0,006 0,005 0,008 0,01 <0,02 <0,03 <0,05 10
ppm Sb 0,028 <0,0009 0,003 - 0,010
<0,020 - 0,22 0,12 0,025
ppm Co 0,58 0,289 0,18 0,185 0,0013 - 0,0014
0,03 - 0,07
0,02 - 0,09 0,2
ppm Se <0,004 0,8 - 1,4 4,0 - 6,0 2,4 - 6,4 0,07 <0, 06
ppm V 113 21,9 19,2 18 <0,004 - 0,25 39 - 54 33 - 103 82 0,0015
ppm Ni 15 12,5 37,5 13,1 12,9 9,8 <0,2 15 - 18 8,0 - 33 55 0,086
ppm Pb 3,5 0,16 1 0,206 0,3 0,41 2,3 400
ppm Tl
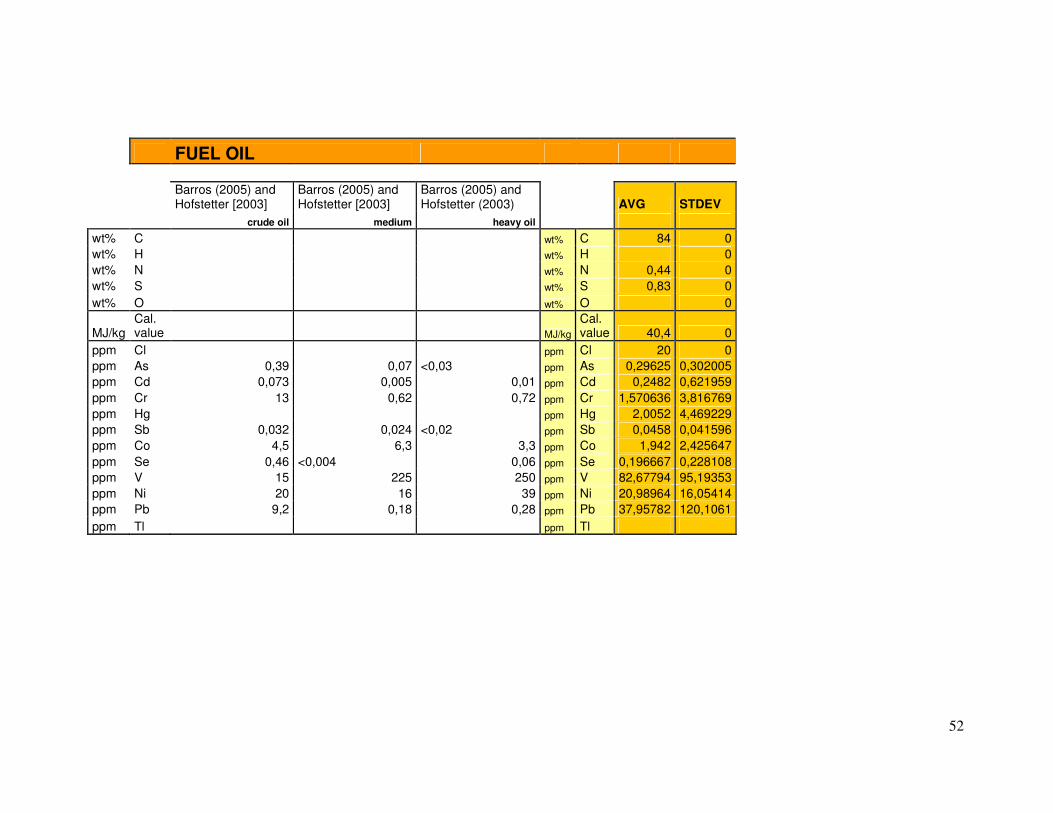
52
FUEL OIL
Barros (2005) and Hofstetter [2003]
Barros (2005) and Hofstetter [2003]
Barros (2005) and Hofstetter (2003) AVG STDEV
crude oil medium heavy oil
wt% C wt% C 84 0
wt% H wt% H 0
wt% N wt% N 0,44 0
wt% S wt% S 0,83 0
wt% O wt% O 0
MJ/kg Cal. value MJ/kg
Cal. value 40,4 0
ppm Cl ppm Cl 20 0
ppm As 0,39 0,07 <0,03 ppm As 0,29625 0,302005
ppm Cd 0,073 0,005 0,01 ppm Cd 0,2482 0,621959
ppm Cr 13 0,62 0,72 ppm Cr 1,570636 3,816769
ppm Hg ppm Hg 2,0052 4,469229
ppm Sb 0,032 0,024 <0,02 ppm Sb 0,0458 0,041596
ppm Co 4,5 6,3 3,3 ppm Co 1,942 2,425647
ppm Se 0,46 <0,004 0,06 ppm Se 0,196667 0,228108
ppm V 15 225 250 ppm V 82,67794 95,19353
ppm Ni 20 16 39 ppm Ni 20,98964 16,05414
ppm Pb 9,2 0,18 0,28 ppm Pb 37,95782 120,1061
ppm Tl ppm Tl

53
7.2 Annex II : Transfer coefficients
rotary kiln
Indaver_2006 Wauters_1997 De Vos_2007 - TNO Saft_2007 Seyler_2005
Ministerium fur UNLV
AVG TFC ST.DEV
internal
communication special project table 4; p22 Table 5, p
235 Table 8; p
1222 Anhang II,01 e.v.
in % O 91,7 O 91,7 0
H 100 H 100 0
C 100 100 100 100 C 100 0
S 0,059 0,2 0,06 0,06 S 0,09475 0,07017
Cl 0,2 0,005 0,03 0,03 0,015 Cl 0,056 0,08119
As <0,733 0,02 1,02E-06 0,063529 0,00007 As 0,0209 0,02994
Cd <0,133 0,01 0,899 0,684615 0,009 Cd 0,400654 0,46007
Co <0,0902 0,07 0,063707 0,07 0,000053 Co 0,05094 0,03405
Cr <0,0493 0,005 7,39E-06 0,063592 7,90E-07 Cr 1,72E-02 0,03105
Hg <0,157 0,22 4,02 0,272857 0,4 Hg 1,228214 1,86272
Sb <0,0826 3,89E-07 0,063651 Sb 0,031826 0,04501
Se 5,03E-07 Se 5,03E-07 0
V <0,0507 1,00E-02 1,30E-06 V 0,005001 0,00707
Ni <0,0564 0,08 7,00E-02 0,063684 0,07 2,60E-07 Ni 5,67E-02 0,03225
Pb <0,0272 0,09 3,31E-01 0,157011 0,004 Pb 0,145503 0,13862
Tl <0,271 1,00E-01 0,00016 Tl 0,05008 0,0706
Cu <0,00558 7,00E-02 <63,7 0,07 8,00E-08 Cu 0,046667 0,04041
Zn 7,00E-02 0,063691 0,07 Zn 0,067897 0,00364
Transfer coefficients, measured at the Indaver site are “Indaver_2006” and “Wauters_1997”;
for Cu and Zn of which data from the Indaver site lacked, the average value from literature data was used.
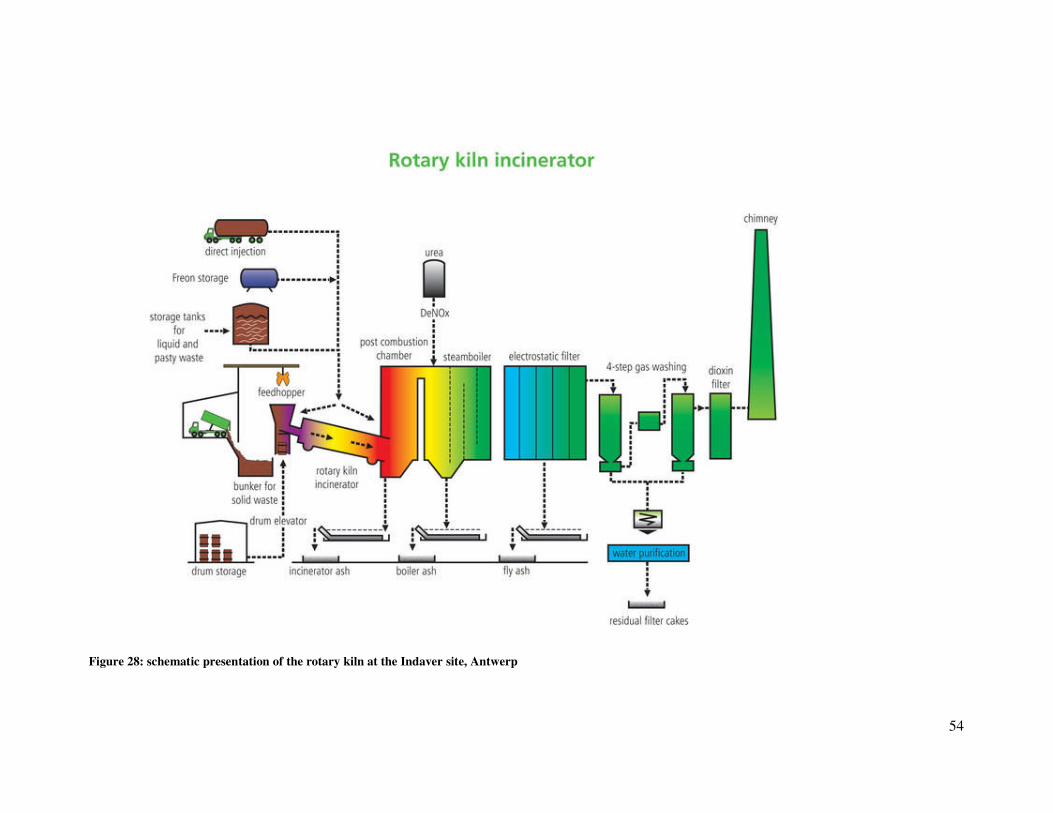
54
Figure 28: schematic presentation of the rotary kiln at the Indaver site, Antwerp
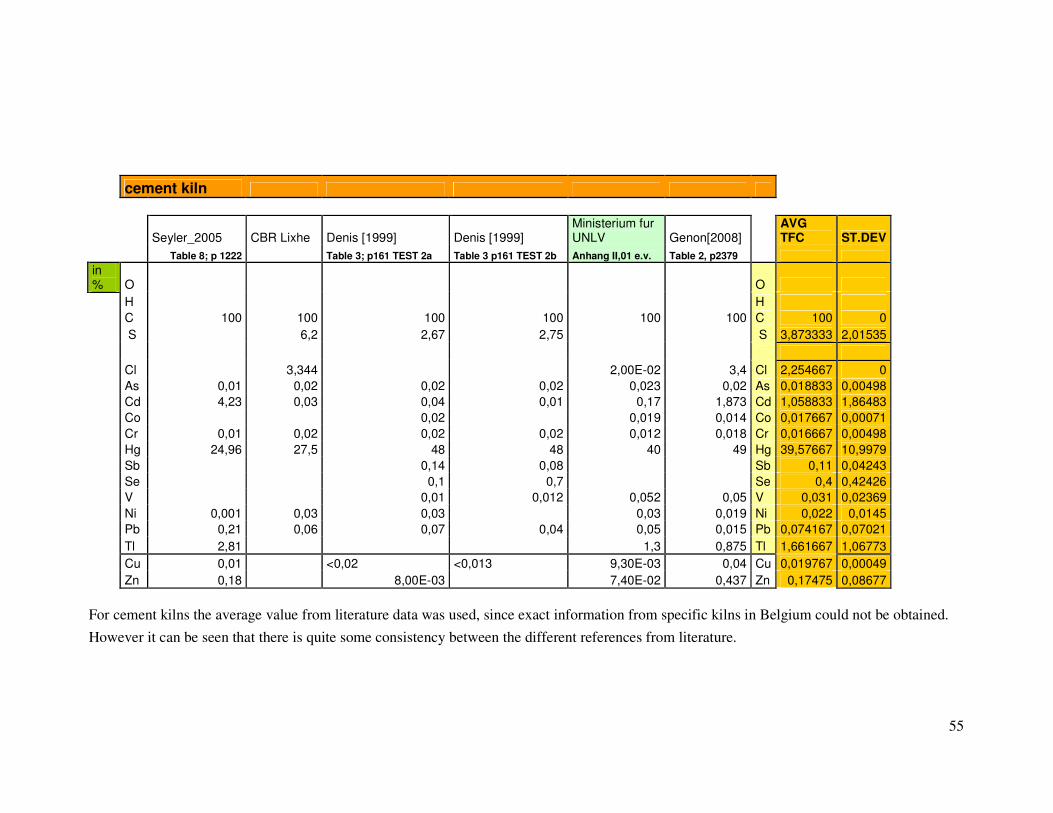
55
cement kiln
Seyler_2005 CBR Lixhe Denis [1999] Denis [1999] Ministerium fur UNLV Genon[2008]
AVG TFC ST.DEV
Table 8; p 1222 Table 3; p161 TEST 2a Table 3 p161 TEST 2b Anhang II,01 e.v. Table 2, p2379
in % O O
H H
C 100 100 100 100 100 100 C 100 0
S 6,2 2,67 2,75 S 3,873333 2,01535
Cl 3,344 2,00E-02 3,4 Cl 2,254667 0
As 0,01 0,02 0,02 0,02 0,023 0,02 As 0,018833 0,00498
Cd 4,23 0,03 0,04 0,01 0,17 1,873 Cd 1,058833 1,86483
Co 0,02 0,019 0,014 Co 0,017667 0,00071
Cr 0,01 0,02 0,02 0,02 0,012 0,018 Cr 0,016667 0,00498
Hg 24,96 27,5 48 48 40 49 Hg 39,57667 10,9979
Sb 0,14 0,08 Sb 0,11 0,04243
Se 0,1 0,7 Se 0,4 0,42426
V 0,01 0,012 0,052 0,05 V 0,031 0,02369
Ni 0,001 0,03 0,03 0,03 0,019 Ni 0,022 0,0145
Pb 0,21 0,06 0,07 0,04 0,05 0,015 Pb 0,074167 0,07021
Tl 2,81 1,3 0,875 Tl 1,661667 1,06773
Cu 0,01 <0,02 <0,013 9,30E-03 0,04 Cu 0,019767 0,00049
Zn 0,18 8,00E-03 7,40E-02 0,437 Zn 0,17475 0,08677
For cement kilns the average value from literature data was used, since exact information from specific kilns in Belgium could not be obtained.
However it can be seen that there is quite some consistency between the different references from literature.
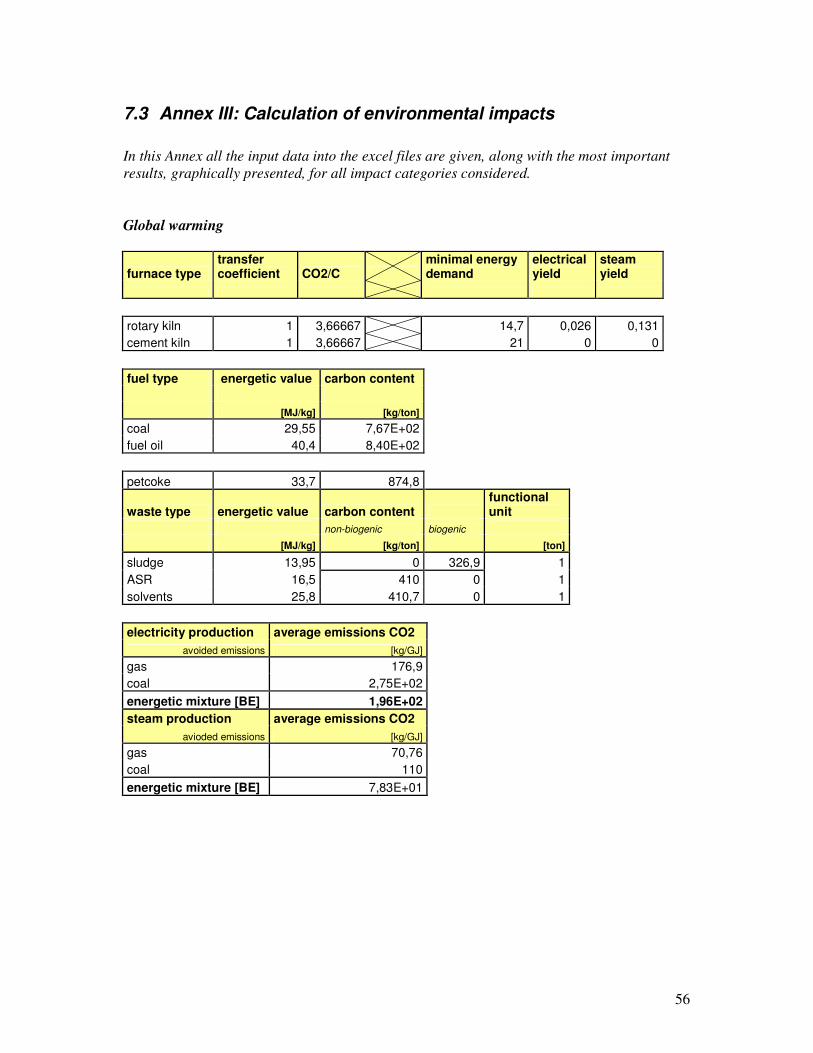
56
7.3 Annex III: Calculation of environmental impacts
In this Annex all the input data into the excel files are given, along with the most important
results, graphically presented, for all impact categories considered.
Global warming
furnace type transfer coefficient CO2/C
minimal energy demand
electrical yield
steam yield
rotary kiln 1 3,66667 14,7 0,026 0,131
cement kiln 1 3,66667 21 0 0
fuel type energetic value carbon content
[MJ/kg] [kg/ton]
coal 29,55 7,67E+02
fuel oil 40,4 8,40E+02
petcoke 33,7 874,8
waste type energetic value carbon content functional unit
non-biogenic biogenic
[MJ/kg] [kg/ton] [ton]
sludge 13,95 0 326,9 1
ASR 16,5 410 0 1
solvents 25,8 410,7 0 1
electricity production average emissions CO2
avoided emissions [kg/GJ]
gas 176,9
coal 2,75E+02
energetic mixture [BE] 1,96E+02
steam production average emissions CO2
avioded emissions [kg/GJ]
gas 70,76
coal 110
energetic mixture [BE] 7,83E+01
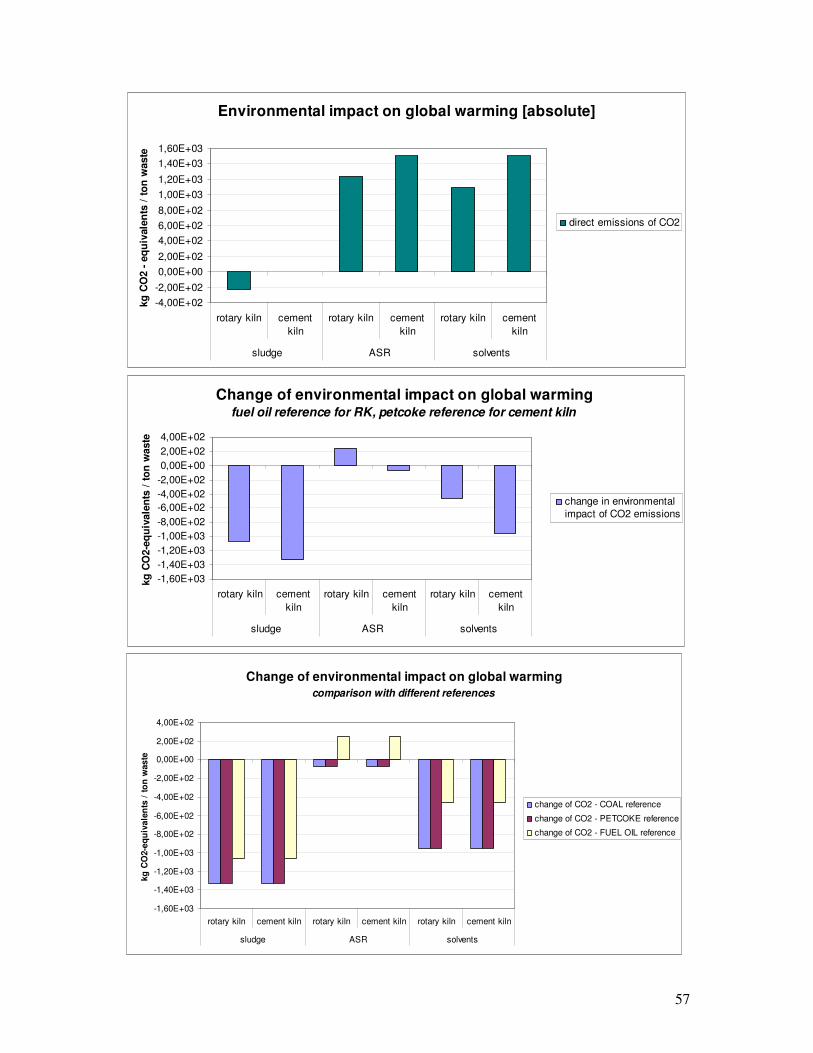
57
Environmental impact on global warming [absolute]
-4,00E+02
-2,00E+02
0,00E+00
2,00E+02
4,00E+02
6,00E+02
8,00E+02
1,00E+03
1,20E+03
1,40E+03
1,60E+03
rotary kiln cement
kiln
rotary kiln cement
kiln
rotary kiln cement
kiln
sludge ASR solvents
kg
CO
2 -
eq
uiv
ale
nts
/ t
on
waste
direct emissions of CO2
Change of environmental impact on global warmingfuel oil reference for RK, petcoke reference for cement kiln
-1,60E+03
-1,40E+03
-1,20E+03
-1,00E+03
-8,00E+02
-6,00E+02
-4,00E+02
-2,00E+02
0,00E+00
2,00E+02
4,00E+02
rotary kiln cement
kiln
rotary kiln cement
kiln
rotary kiln cement
kiln
sludge ASR solvents
kg
CO
2-e
qu
ivale
nts
/ t
on
waste
change in environmental
impact of CO2 emissions
Change of environmental impact on global warming
comparison with different references
-1,60E+03
-1,40E+03
-1,20E+03
-1,00E+03
-8,00E+02
-6,00E+02
-4,00E+02
-2,00E+02
0,00E+00
2,00E+02
4,00E+02
rotary kiln cement kiln rotary kiln cement kiln rotary kiln cement kiln
sludge ASR solvents
kg
CO
2-e
qu
ivale
nts
/ t
on
waste
change of CO2 - COAL reference
change of CO2 - PETCOKE reference
change of CO2 - FUEL OIL reference
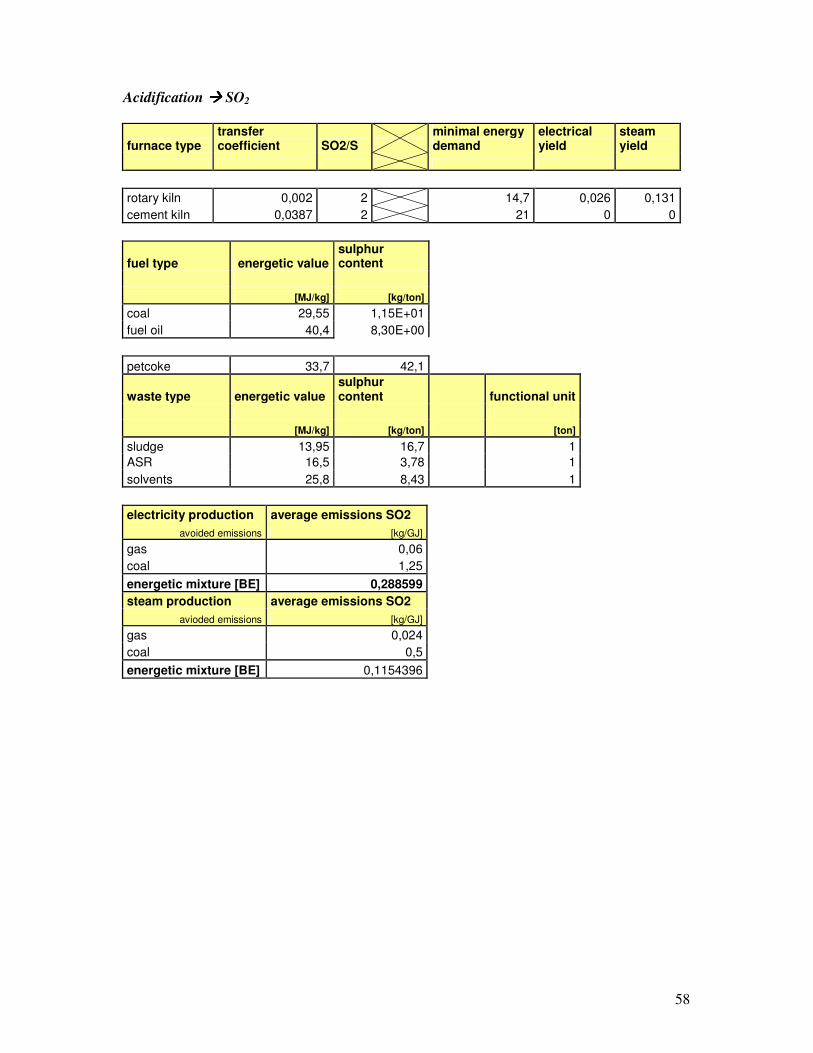
58
Acidification ���� SO2
furnace type transfer coefficient SO2/S
minimal energy demand
electrical yield
steam yield
rotary kiln 0,002 2 14,7 0,026 0,131
cement kiln 0,0387 2 21 0 0
fuel type energetic value sulphur content
[MJ/kg] [kg/ton]
coal 29,55 1,15E+01
fuel oil 40,4 8,30E+00
petcoke 33,7 42,1
waste type energetic value sulphur content functional unit
[MJ/kg] [kg/ton] [ton]
sludge 13,95 16,7 1
ASR 16,5 3,78 1
solvents 25,8 8,43 1
electricity production average emissions SO2
avoided emissions [kg/GJ]
gas 0,06
coal 1,25
energetic mixture [BE] 0,288599
steam production average emissions SO2
avioded emissions [kg/GJ]
gas 0,024
coal 0,5
energetic mixture [BE] 0,1154396
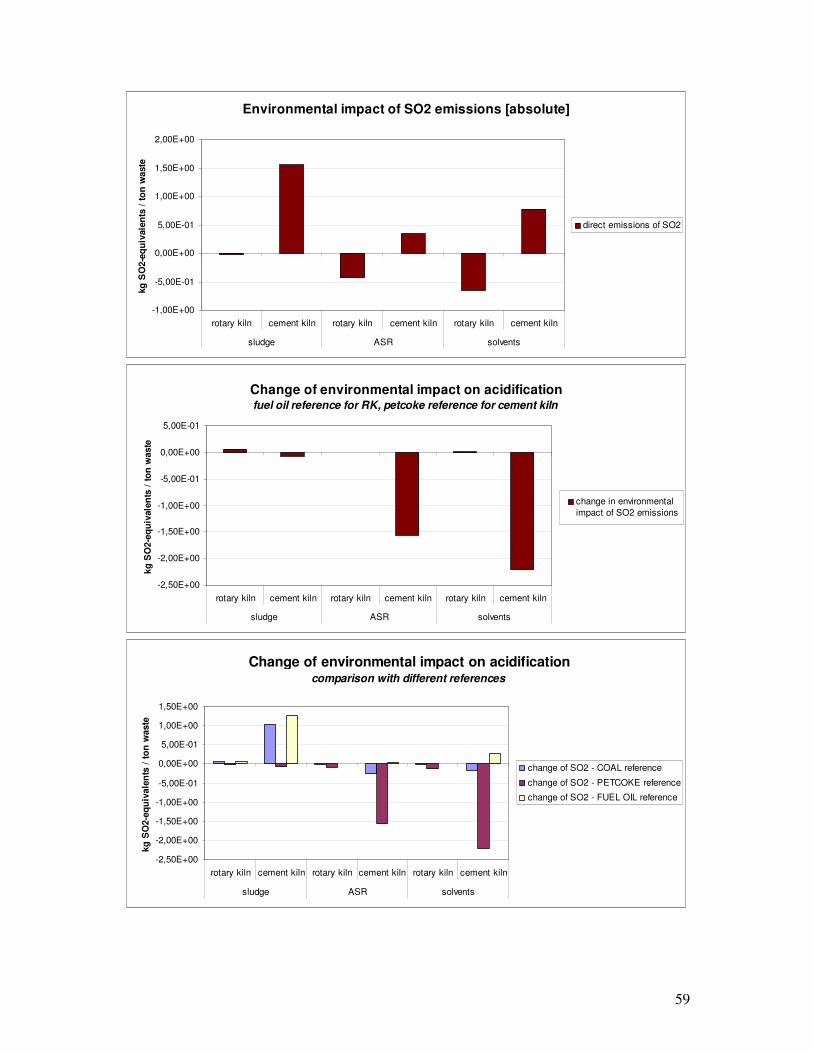
59
Environmental impact of SO2 emissions [absolute]
-1,00E+00
-5,00E-01
0,00E+00
5,00E-01
1,00E+00
1,50E+00
2,00E+00
rotary kiln cement kiln rotary kiln cement kiln rotary kiln cement kiln
sludge ASR solvents
kg
SO
2-e
qu
ivale
nts
/ t
on
waste
direct emissions of SO2
Change of environmental impact on acidificationfuel oil reference for RK, petcoke reference for cement kiln
-2,50E+00
-2,00E+00
-1,50E+00
-1,00E+00
-5,00E-01
0,00E+00
5,00E-01
rotary kiln cement kiln rotary kiln cement kiln rotary kiln cement kiln
sludge ASR solvents
kg
SO
2-e
qu
ivale
nts
/ t
on
waste
change in environmental
impact of SO2 emissions
Change of environmental impact on acidification comparison with different references
-2,50E+00
-2,00E+00
-1,50E+00
-1,00E+00
-5,00E-01
0,00E+00
5,00E-01
1,00E+00
1,50E+00
rotary kiln cement kiln rotary kiln cement kiln rotary kiln cement kiln
sludge ASR solvents
kg
SO
2-e
qu
ivale
nts
/ t
on
waste
change of SO2 - COAL reference
change of SO2 - PETCOKE reference
change of SO2 - FUEL OIL reference
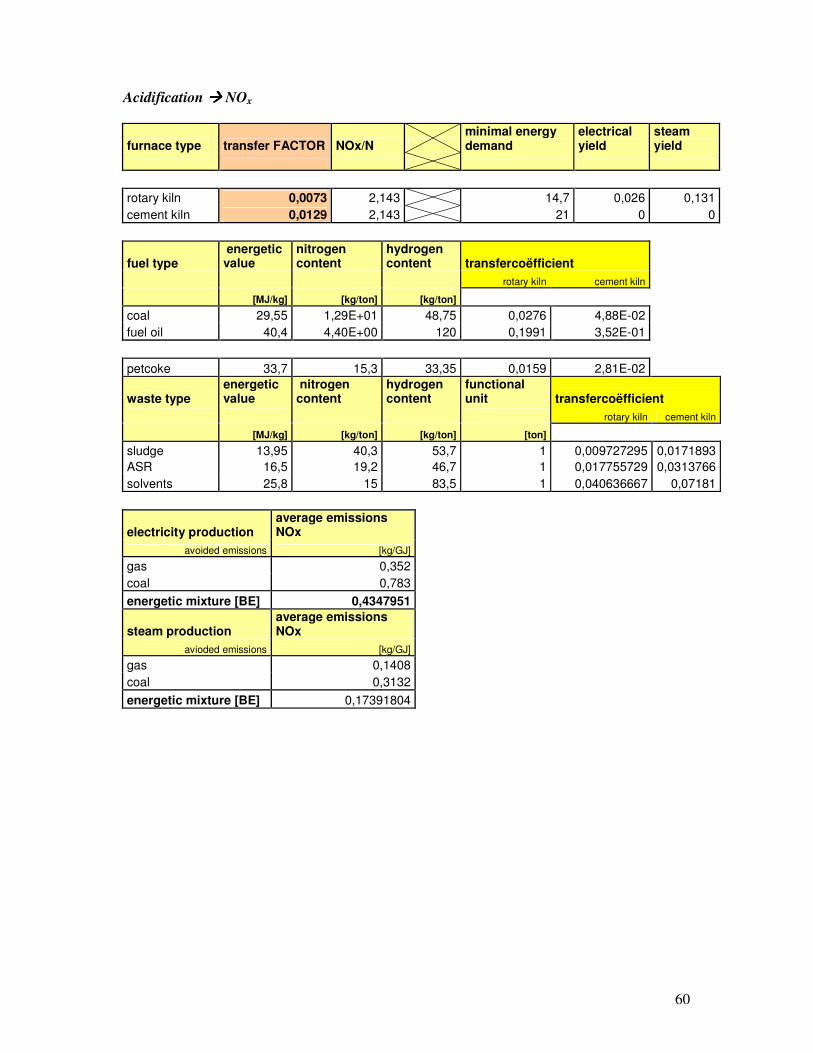
60
Acidification ���� NOx
furnace type transfer FACTOR NOx/N minimal energy demand
electrical yield
steam yield
rotary kiln 0,0073 2,143 14,7 0,026 0,131
cement kiln 0,0129 2,143 21 0 0
fuel type energetic value
nitrogen content
hydrogen content transfercoëfficient
rotary kiln cement kiln
[MJ/kg] [kg/ton] [kg/ton]
coal 29,55 1,29E+01 48,75 0,0276 4,88E-02
fuel oil 40,4 4,40E+00 120 0,1991 3,52E-01
petcoke 33,7 15,3 33,35 0,0159 2,81E-02
waste type energetic value
nitrogen content
hydrogen content
functional unit transfercoëfficient
rotary kiln cement kiln
[MJ/kg] [kg/ton] [kg/ton] [ton]
sludge 13,95 40,3 53,7 1 0,009727295 0,0171893
ASR 16,5 19,2 46,7 1 0,017755729 0,0313766
solvents 25,8 15 83,5 1 0,040636667 0,07181
electricity production average emissions NOx
avoided emissions [kg/GJ]
gas 0,352
coal 0,783
energetic mixture [BE] 0,4347951
steam production average emissions NOx
avioded emissions [kg/GJ]
gas 0,1408
coal 0,3132
energetic mixture [BE] 0,17391804
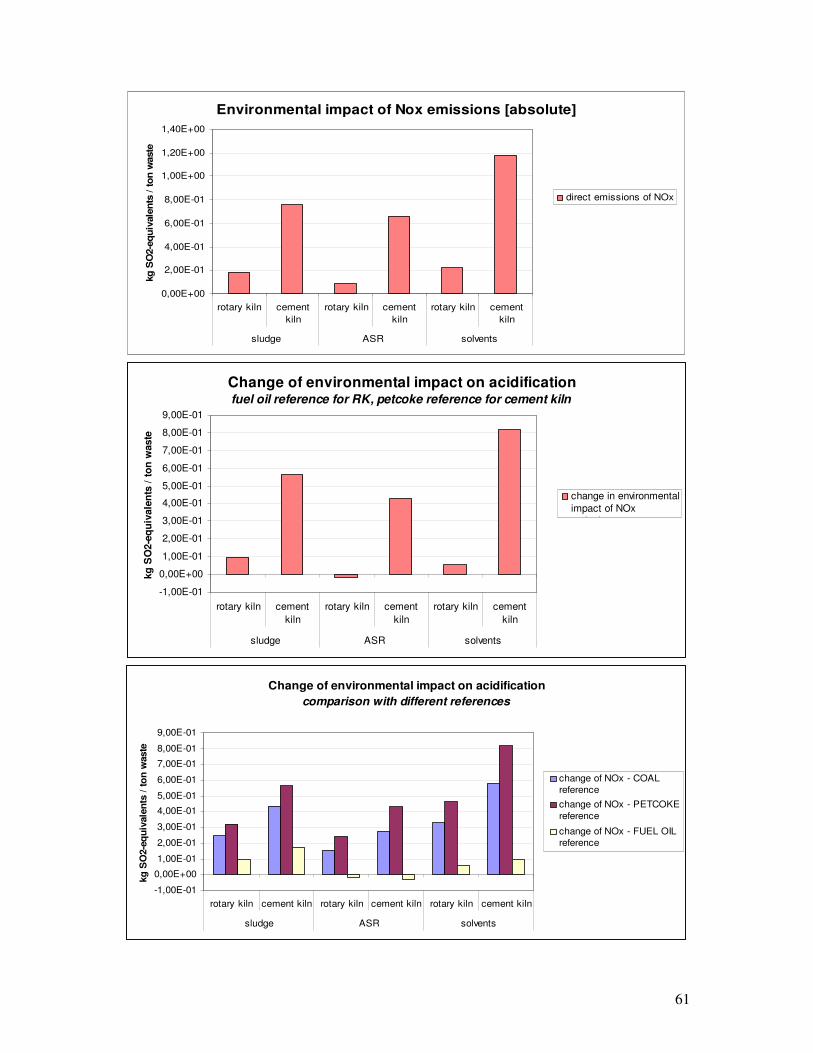
61
Environmental impact of Nox emissions [absolute]
0,00E+00
2,00E-01
4,00E-01
6,00E-01
8,00E-01
1,00E+00
1,20E+00
1,40E+00
rotary kiln cement
kiln
rotary kiln cement
kiln
rotary kiln cement
kiln
sludge ASR solvents
kg
SO
2-e
qu
ivale
nts
/ t
on
waste
direct emissions of NOx
Change of environmental impact on acidificationfuel oil reference for RK, petcoke reference for cement kiln
-1,00E-01
0,00E+00
1,00E-01
2,00E-01
3,00E-01
4,00E-01
5,00E-01
6,00E-01
7,00E-01
8,00E-01
9,00E-01
rotary kiln cement
kiln
rotary kiln cement
kiln
rotary kiln cement
kiln
sludge ASR solvents
kg
SO
2-e
qu
ivale
nts
/ t
on
waste
change in environmental
impact of NOx
emissions
Change of environmental impact on acidification
comparison with different references
-1,00E-01
0,00E+00
1,00E-01
2,00E-01
3,00E-01
4,00E-01
5,00E-01
6,00E-01
7,00E-01
8,00E-01
9,00E-01
rotary kiln cement kiln rotary kiln cement kiln rotary kiln cement kiln
sludge ASR solvents
kg
SO
2-e
qu
ivale
nts
/ t
on
waste
change of NOx - COAL
reference
change of NOx - PETCOKE
reference
change of NOx - FUEL OIL
reference
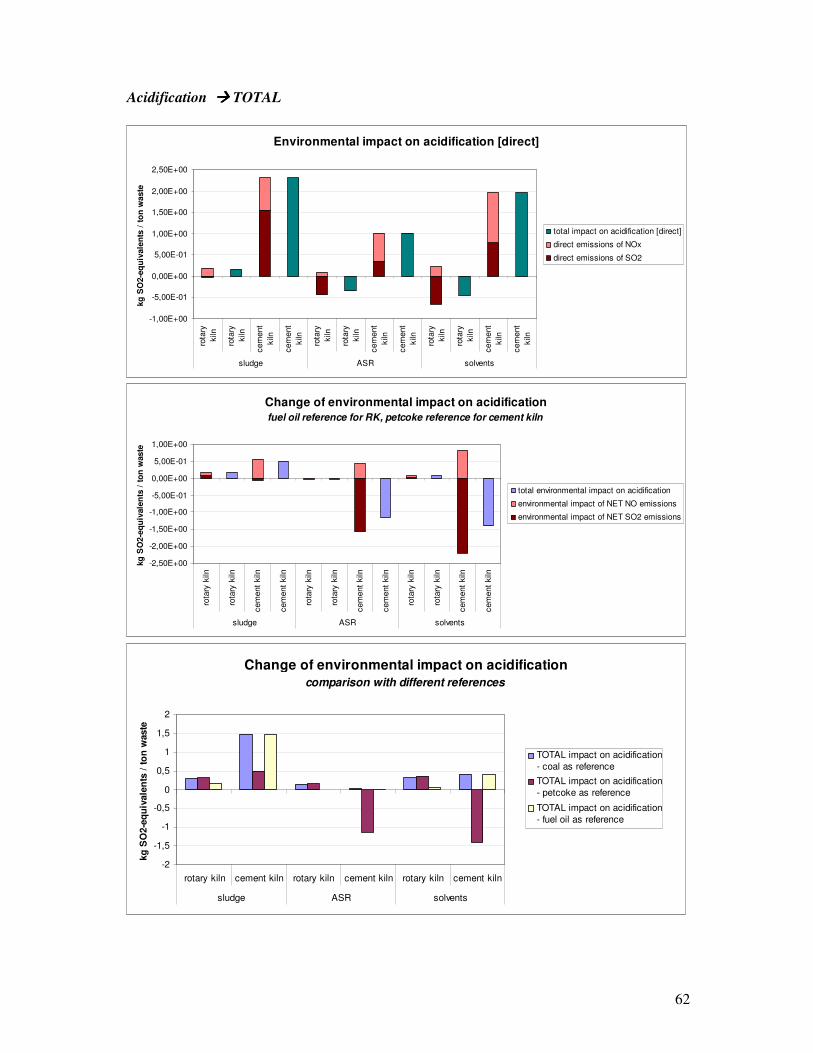
62
Acidification ���� TOTAL
Environmental impact on acidification [direct]
-1,00E+00
-5,00E-01
0,00E+00
5,00E-01
1,00E+00
1,50E+00
2,00E+00
2,50E+00
rota
ry
kiln
rota
ry
kiln
cem
ent
kiln
cem
ent
kiln
rota
ry
kiln
rota
ry
kiln
cem
ent
kiln
cem
ent
kiln
rota
ry
kiln
rota
ry
kiln
cem
ent
kiln
cem
ent
kiln
sludge ASR solvents
kg
SO
2-e
qu
ivale
nts
/ t
on
waste
total impact on acidification [direct]
direct emissions of NOx
direct emissions of SO2
Change of environmental impact on acidification
fuel oil reference for RK, petcoke reference for cement kiln
-2,50E+00
-2,00E+00
-1,50E+00
-1,00E+00
-5,00E-01
0,00E+00
5,00E-01
1,00E+00
rota
ry k
iln
rota
ry k
iln
cem
ent
kiln
cem
ent
kiln
rota
ry k
iln
rota
ry k
iln
cem
ent
kiln
cem
ent
kiln
rota
ry k
iln
rota
ry k
iln
cem
ent
kiln
cem
ent
kiln
sludge ASR solvents
kg
SO
2-e
qu
ivale
nts
/ t
on
waste
total environmental impact on acidification
environmental impact of NET NO emissions
environmental impact of NET SO2 emissions
Change of environmental impact on acidification
comparison with different references
-2
-1,5
-1
-0,5
0
0,5
1
1,5
2
rotary kiln cement kiln rotary kiln cement kiln rotary kiln cement kiln
sludge ASR solvents
kg
SO
2-e
qu
ivale
nts
/ t
on
waste
TOTAL impact on acidification
- coal as reference
TOTAL impact on acidification
- petcoke as reference
TOTAL impact on acidification
- fuel oil as reference
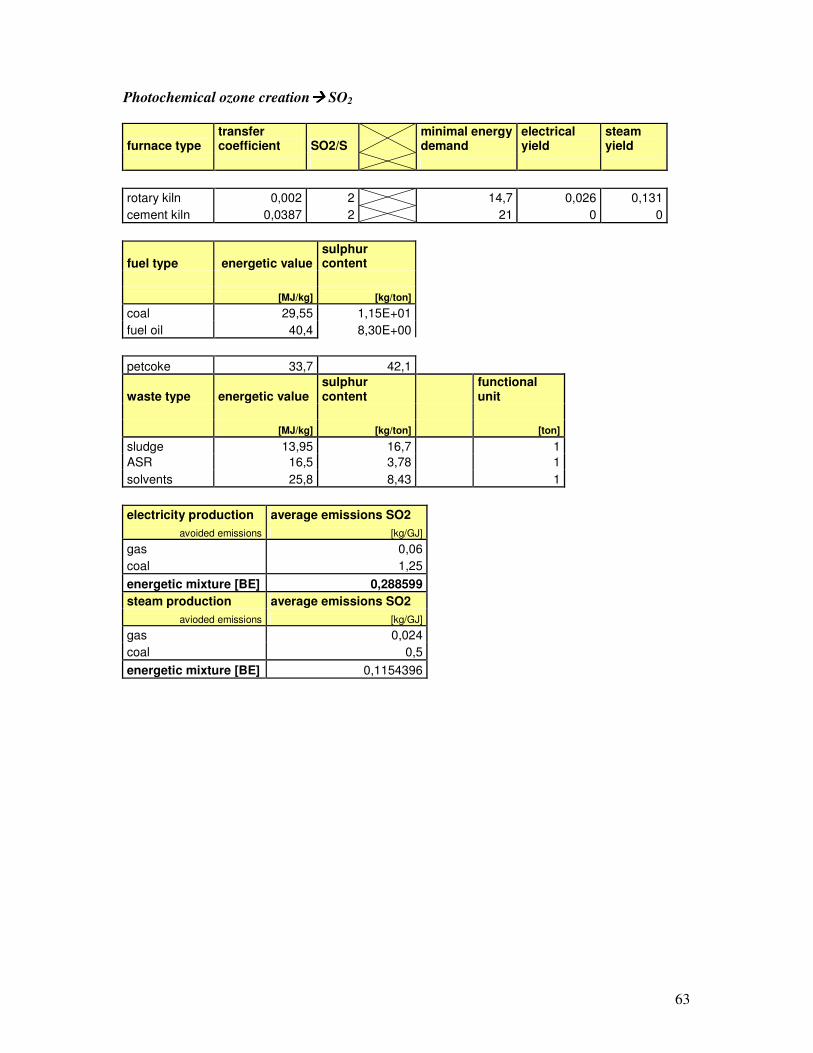
63
Photochemical ozone creation���� SO2
furnace type transfer coefficient SO2/S
minimal energy demand
electrical yield
steam yield
rotary kiln 0,002 2 14,7 0,026 0,131
cement kiln 0,0387 2 21 0 0
fuel type energetic value sulphur content
[MJ/kg] [kg/ton]
coal 29,55 1,15E+01
fuel oil 40,4 8,30E+00
petcoke 33,7 42,1
waste type energetic value sulphur content
functional unit
[MJ/kg] [kg/ton] [ton]
sludge 13,95 16,7 1
ASR 16,5 3,78 1
solvents 25,8 8,43 1
electricity production average emissions SO2
avoided emissions [kg/GJ]
gas 0,06
coal 1,25
energetic mixture [BE] 0,288599
steam production average emissions SO2
avioded emissions [kg/GJ]
gas 0,024
coal 0,5
energetic mixture [BE] 0,1154396
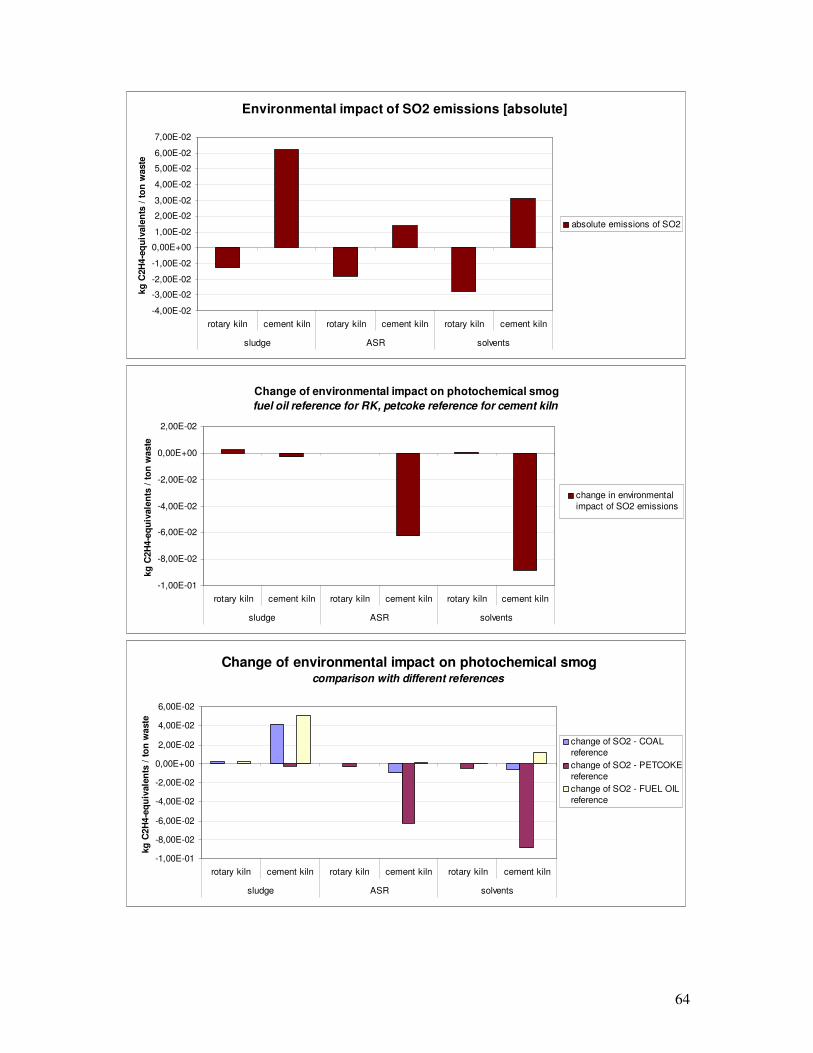
64
Environmental impact of SO2 emissions [absolute]
-4,00E-02
-3,00E-02
-2,00E-02
-1,00E-02
0,00E+00
1,00E-02
2,00E-02
3,00E-02
4,00E-02
5,00E-02
6,00E-02
7,00E-02
rotary kiln cement kiln rotary kiln cement kiln rotary kiln cement kiln
sludge ASR solvents
kg
C2H
4-e
qu
ivale
nts
/ t
on
waste
absolute emissions of SO2
Change of environmental impact on photochemical smog
fuel oil reference for RK, petcoke reference for cement kiln
-1,00E-01
-8,00E-02
-6,00E-02
-4,00E-02
-2,00E-02
0,00E+00
2,00E-02
rotary kiln cement kiln rotary kiln cement kiln rotary kiln cement kiln
sludge ASR solvents
kg
C2H
4-e
qu
ivale
nts
/ t
on
waste
change in environmental
impact of SO2 emissions
Change of environmental impact on photochemical smog comparison with different references
-1,00E-01
-8,00E-02
-6,00E-02
-4,00E-02
-2,00E-02
0,00E+00
2,00E-02
4,00E-02
6,00E-02
rotary kiln cement kiln rotary kiln cement kiln rotary kiln cement kiln
sludge ASR solvents
kg
C2H
4-e
qu
ivale
nts
/ t
on
waste
change of SO2 - COAL
reference
change of SO2 - PETCOKE
reference
change of SO2 - FUEL OIL
reference
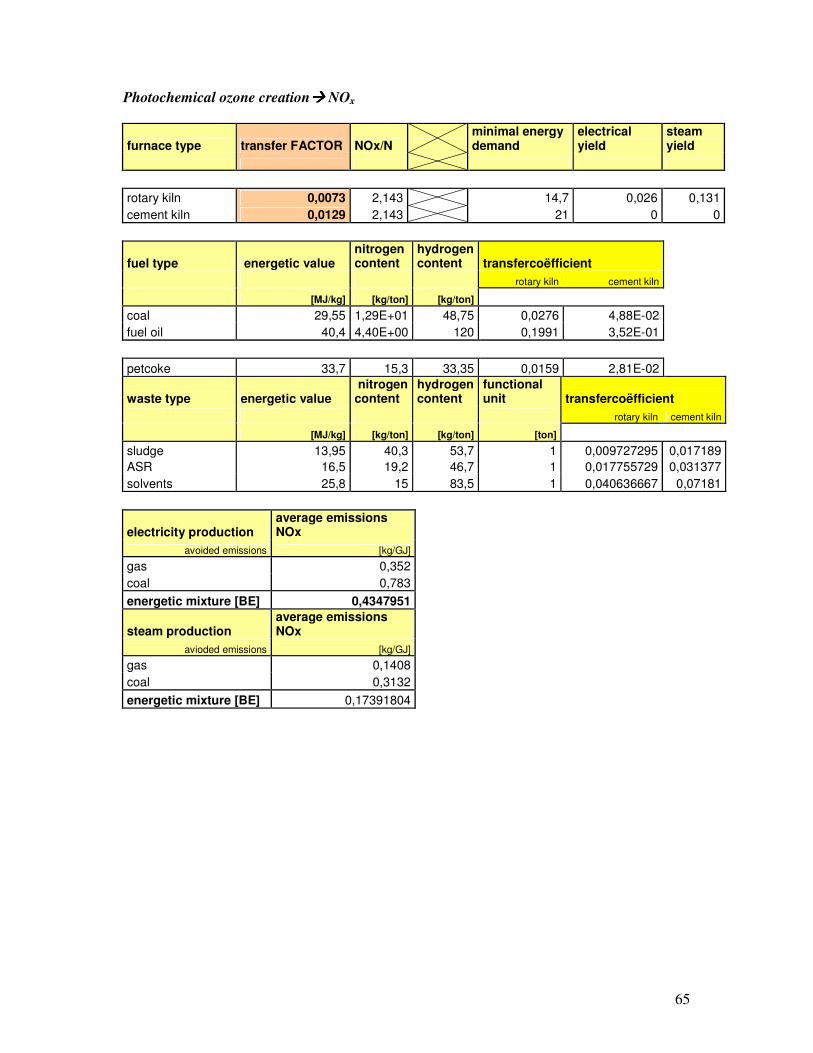
65
Photochemical ozone creation���� NOx
furnace type transfer FACTOR NOx/N minimal energy demand
electrical yield
steam yield
rotary kiln 0,0073 2,143 14,7 0,026 0,131
cement kiln 0,0129 2,143 21 0 0
fuel type energetic value nitrogen content
hydrogen content transfercoëfficient
rotary kiln cement kiln
[MJ/kg] [kg/ton] [kg/ton]
coal 29,55 1,29E+01 48,75 0,0276 4,88E-02
fuel oil 40,4 4,40E+00 120 0,1991 3,52E-01
petcoke 33,7 15,3 33,35 0,0159 2,81E-02
waste type energetic value nitrogen content
hydrogen content
functional unit transfercoëfficient
rotary kiln cement kiln
[MJ/kg] [kg/ton] [kg/ton] [ton]
sludge 13,95 40,3 53,7 1 0,009727295 0,017189
ASR 16,5 19,2 46,7 1 0,017755729 0,031377
solvents 25,8 15 83,5 1 0,040636667 0,07181
electricity production average emissions NOx
avoided emissions [kg/GJ]
gas 0,352
coal 0,783
energetic mixture [BE] 0,4347951
steam production average emissions NOx
avioded emissions [kg/GJ]
gas 0,1408
coal 0,3132
energetic mixture [BE] 0,17391804
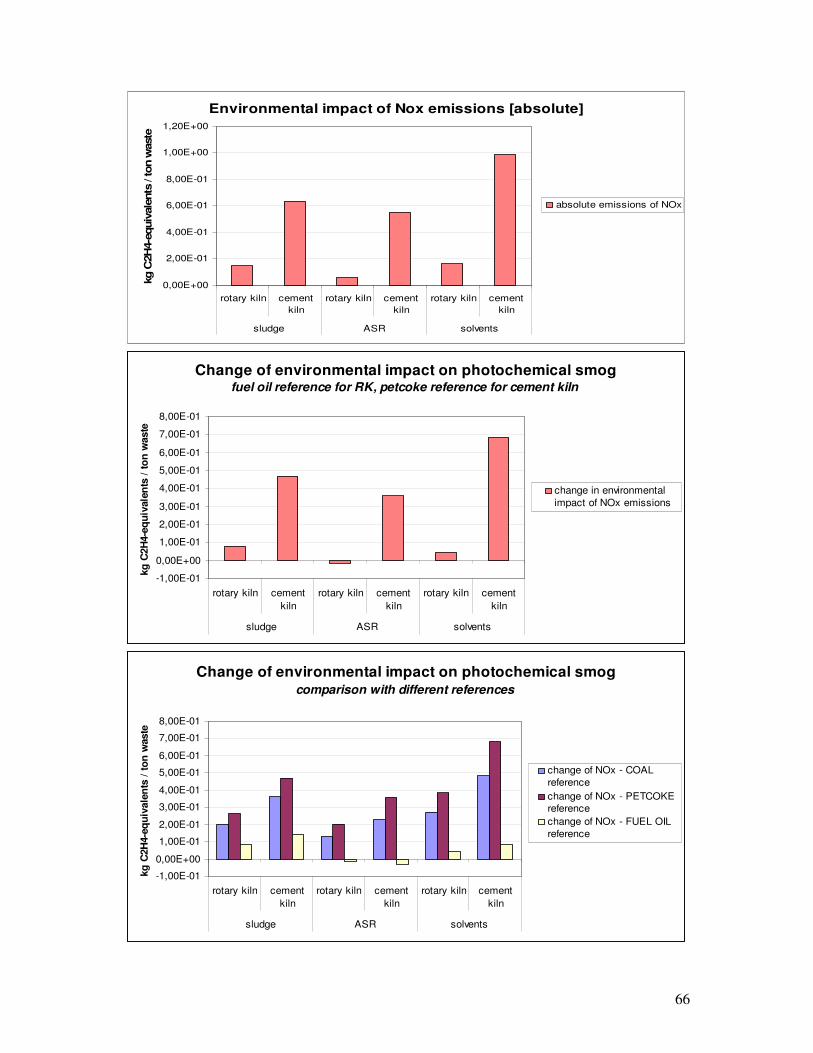
66
Environmental impact of Nox emissions [absolute]
0,00E+00
2,00E-01
4,00E-01
6,00E-01
8,00E-01
1,00E+00
1,20E+00
rotary kiln cement
kiln
rotary kiln cement
kiln
rotary kiln cement
kiln
sludge ASR solvents
kg C
2H
4-e
quiv
ale
nts
/ ton w
aste
absolute emissions of NOx
Change of environmental impact on photochemical smogfuel oil reference for RK, petcoke reference for cement kiln
-1,00E-01
0,00E+00
1,00E-01
2,00E-01
3,00E-01
4,00E-01
5,00E-01
6,00E-01
7,00E-01
8,00E-01
rotary kiln cement
kiln
rotary kiln cement
kiln
rotary kiln cement
kiln
sludge ASR solvents
kg
C2H
4-e
qu
ivale
nts
/ t
on
waste
change in environmental
impact of NOx emissions
Change of environmental impact on photochemical smog comparison with different references
-1,00E-01
0,00E+00
1,00E-01
2,00E-01
3,00E-01
4,00E-01
5,00E-01
6,00E-01
7,00E-01
8,00E-01
rotary kiln cement
kiln
rotary kiln cement
kiln
rotary kiln cement
kiln
sludge ASR solvents
kg
C2H
4-e
qu
ivale
nts
/ t
on
waste
change of NOx - COAL
reference
change of NOx - PETCOKE
reference
change of NOx - FUEL OIL
reference
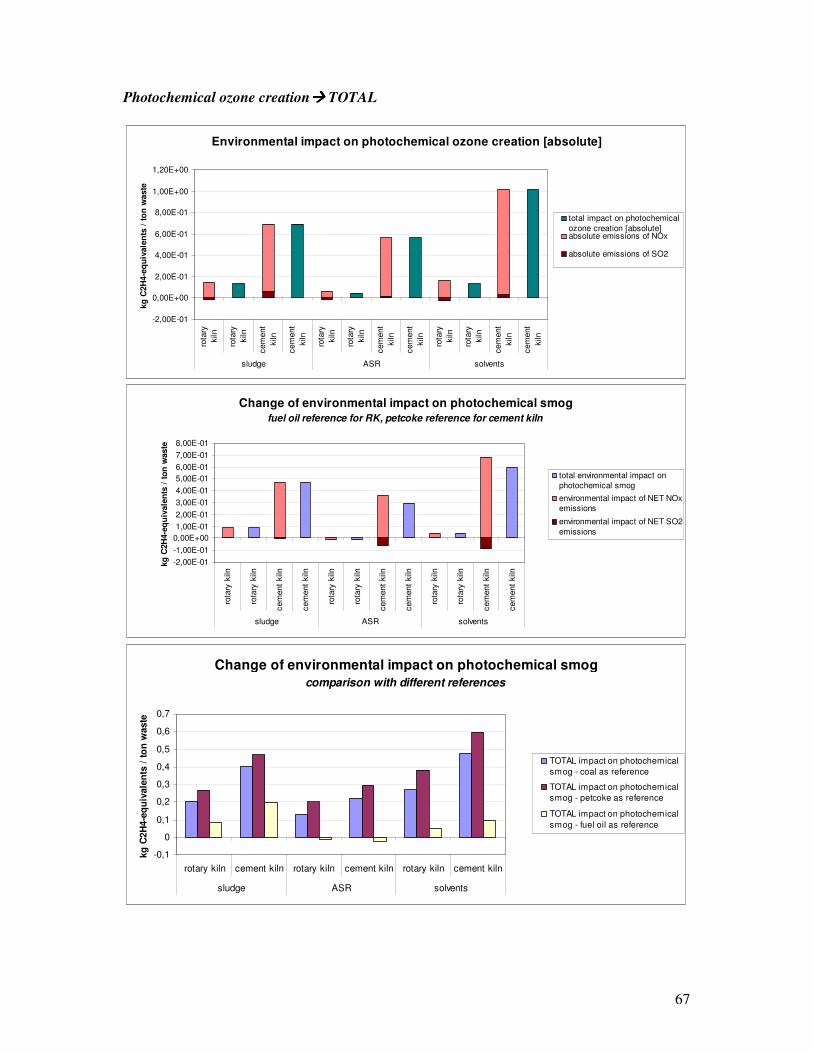
67
Photochemical ozone creation���� TOTAL
Environmental impact on photochemical ozone creation [absolute]
-2,00E-01
0,00E+00
2,00E-01
4,00E-01
6,00E-01
8,00E-01
1,00E+00
1,20E+00
rota
ry
kiln
rota
ry
kiln
cem
ent
kiln
cem
ent
kiln
rota
ry
kiln
rota
ry
kiln
cem
ent
kiln
cem
ent
kiln
rota
ry
kiln
rota
ry
kiln
cem
ent
kiln
cem
ent
kiln
sludge ASR solvents
kg
C2H
4-e
qu
ivale
nts
/ t
on
waste
total impact on photochemical
ozone creation [absolute]absolute emissions of NOx
absolute emissions of SO2
Change of environmental impact on photochemical smog
fuel oil reference for RK, petcoke reference for cement kiln
-2,00E-01
-1,00E-01
0,00E+00
1,00E-01
2,00E-01
3,00E-01
4,00E-01
5,00E-01
6,00E-01
7,00E-01
8,00E-01
rota
ry k
iln
rota
ry k
iln
cem
ent
kiln
cem
ent
kiln
rota
ry k
iln
rota
ry k
iln
cem
ent
kiln
cem
ent
kiln
rota
ry k
iln
rota
ry k
iln
cem
ent
kiln
cem
ent
kiln
sludge ASR solvents
kg
C2H
4-e
qu
ivale
nts
/ t
on
waste
total environmental impact on
photochemical smog
environmental impact of NET NOx
emissions
environmental impact of NET SO2
emissions
Change of environmental impact on photochemical smog
comparison with different references
-0,1
0
0,1
0,2
0,3
0,4
0,5
0,6
0,7
rotary kiln cement kiln rotary kiln cement kiln rotary kiln cement kiln
sludge ASR solvents
kg
C2H
4-e
qu
ivale
nts
/ t
on
waste
TOTAL impact on photochemical
smog - coal as reference
TOTAL impact on photochemical
smog - petcoke as reference
TOTAL impact on photochemical
smog - fuel oil as reference
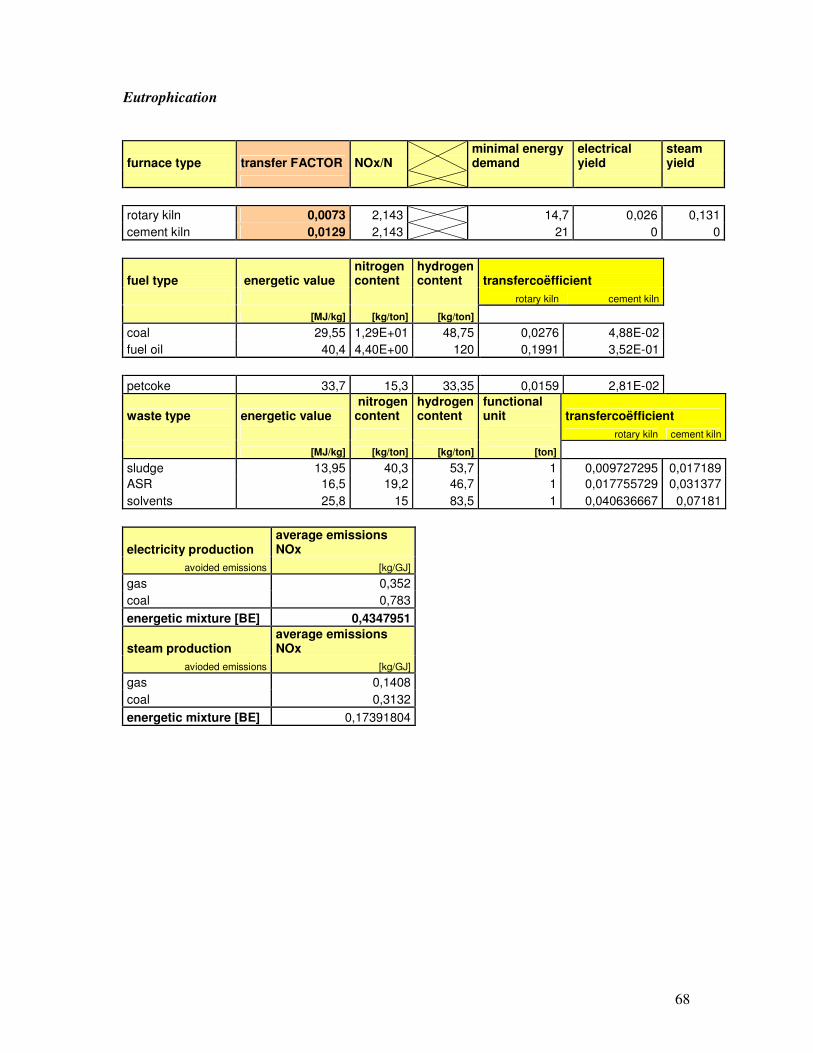
68
Eutrophication
furnace type transfer FACTOR NOx/N minimal energy demand
electrical yield
steam yield
rotary kiln 0,0073 2,143 14,7 0,026 0,131
cement kiln 0,0129 2,143 21 0 0
fuel type energetic value nitrogen content
hydrogen content transfercoëfficient
rotary kiln cement kiln
[MJ/kg] [kg/ton] [kg/ton]
coal 29,55 1,29E+01 48,75 0,0276 4,88E-02
fuel oil 40,4 4,40E+00 120 0,1991 3,52E-01
petcoke 33,7 15,3 33,35 0,0159 2,81E-02
waste type energetic value nitrogen content
hydrogen content
functional unit transfercoëfficient
rotary kiln cement kiln
[MJ/kg] [kg/ton] [kg/ton] [ton]
sludge 13,95 40,3 53,7 1 0,009727295 0,017189
ASR 16,5 19,2 46,7 1 0,017755729 0,031377
solvents 25,8 15 83,5 1 0,040636667 0,07181
electricity production average emissions NOx
avoided emissions [kg/GJ]
gas 0,352
coal 0,783
energetic mixture [BE] 0,4347951
steam production average emissions NOx
avioded emissions [kg/GJ]
gas 0,1408
coal 0,3132
energetic mixture [BE] 0,17391804
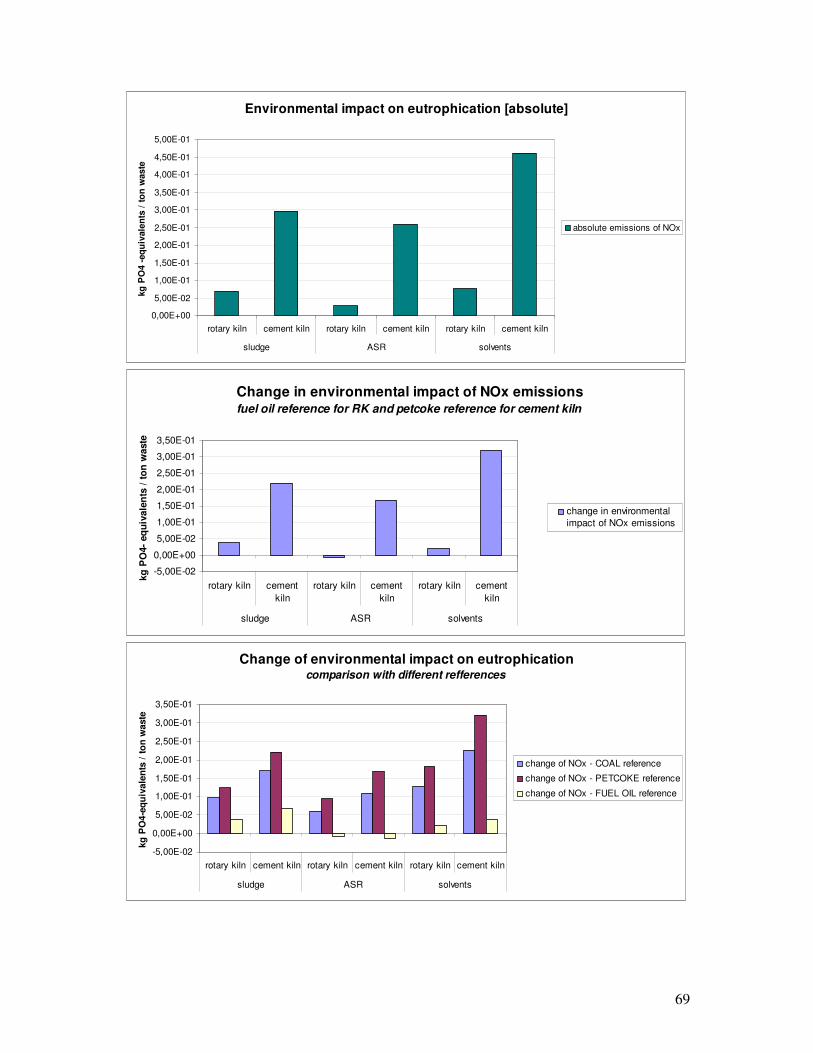
69
Environmental impact on eutrophication [absolute]
0,00E+00
5,00E-02
1,00E-01
1,50E-01
2,00E-01
2,50E-01
3,00E-01
3,50E-01
4,00E-01
4,50E-01
5,00E-01
rotary kiln cement kiln rotary kiln cement kiln rotary kiln cement kiln
sludge ASR solvents
kg
PO
4 -
eq
uiv
ale
nts
/ t
on
waste
absolute emissions of NOx
Change in environmental impact of NOx emissionsfuel oil reference for RK and petcoke reference for cement kiln
-5,00E-02
0,00E+00
5,00E-02
1,00E-01
1,50E-01
2,00E-01
2,50E-01
3,00E-01
3,50E-01
rotary kiln cement
kiln
rotary kiln cement
kiln
rotary kiln cement
kiln
sludge ASR solvents
kg
PO
4-
eq
uiv
ale
nts
/ t
on
waste
change in environmental
impact of NOx emissions
Change of environmental impact on eutrophicationcomparison with different refferences
-5,00E-02
0,00E+00
5,00E-02
1,00E-01
1,50E-01
2,00E-01
2,50E-01
3,00E-01
3,50E-01
rotary kiln cement kiln rotary kiln cement kiln rotary kiln cement kiln
sludge ASR solvents
kg
PO
4-e
qu
ivale
nts
/ t
on
waste
change of NOx - COAL reference
change of NOx - PETCOKE reference
change of NOx - FUEL OIL reference

70
Human toxicity ���� As
furnace type transfer coefficient As/As minimal energy demand
electrical yield
steam yield
]
rotary kiln 0,0002 1 14,7 0,026 0,131
cement kiln 0,0002 1 21 0 0
fuel type energetic value arsenic content
[MJ/kg] [kg/ton]
coal 29,55 1,62E-01
fuel oil 40,4 3,00E-04
petcoke 33,7 0,0009
waste type energetic value arsenic content functional unit
[MJ/kg] [kg/ton] [ton]
sludge 13,95 0,0058 1
ASR 16,5 0,0325 1
solvents 25,8 0,00245 1
electricity production average emissions As
avoided emissions [kg/GJ]
gas 0
coal 0
energetic mixture [BE] 0
steam production average emissions As
avioded emissions [kg/GJ]
gas 0
coal 0
energetic mixture [BE] 0
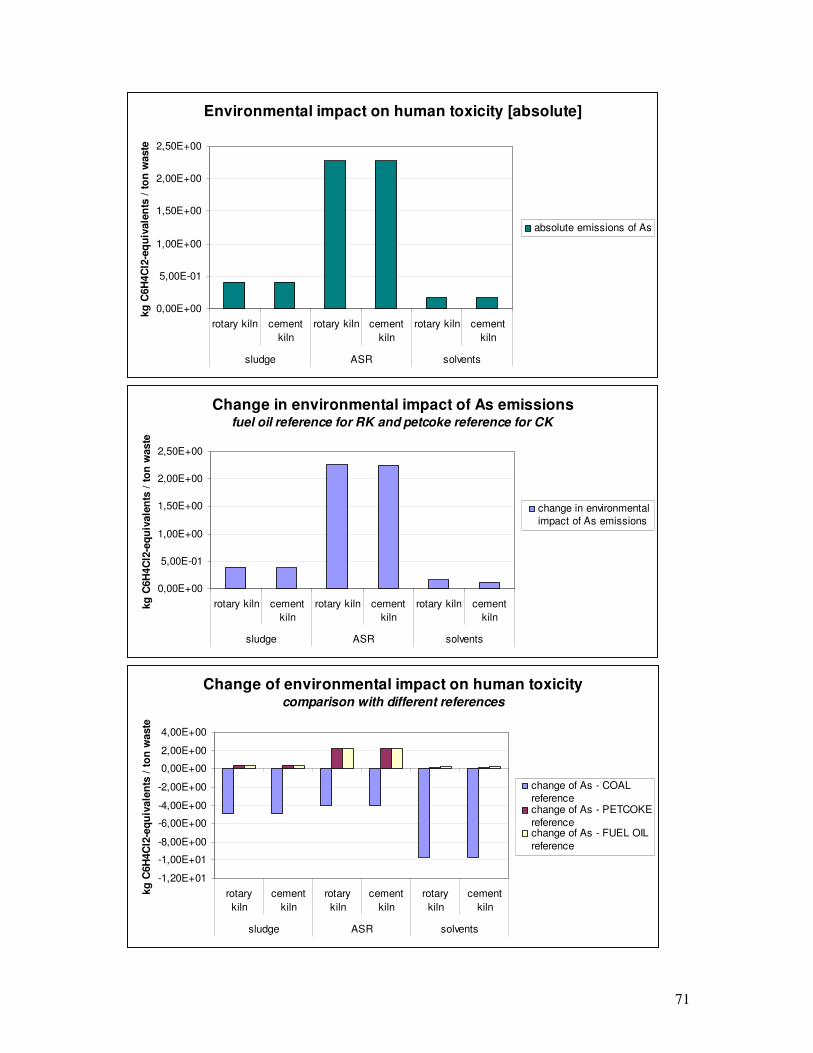
71
Environmental impact on human toxicity [absolute]
0,00E+00
5,00E-01
1,00E+00
1,50E+00
2,00E+00
2,50E+00
rotary kiln cement
kiln
rotary kiln cement
kiln
rotary kiln cement
kiln
sludge ASR solvents
kg
C6H
4C
l2-e
qu
ivale
nts
/ t
on
waste
absolute emissions of As
Change in environmental impact of As emissionsfuel oil reference for RK and petcoke reference for CK
0,00E+00
5,00E-01
1,00E+00
1,50E+00
2,00E+00
2,50E+00
rotary kiln cement
kiln
rotary kiln cement
kiln
rotary kiln cement
kiln
sludge ASR solvents
kg
C6H
4C
l2-e
qu
ivale
nts
/ t
on
waste
change in environmental
impact of As emissions
Change of environmental impact on human toxicity comparison with different references
-1,20E+01
-1,00E+01
-8,00E+00
-6,00E+00
-4,00E+00
-2,00E+00
0,00E+00
2,00E+00
4,00E+00
rotary
kiln
cement
kiln
rotary
kiln
cement
kiln
rotary
kiln
cement
kiln
sludge ASR solvents
kg
C6H
4C
l2-e
qu
ivale
nts
/ t
on
waste
change of As - COAL
referencechange of As - PETCOKE
referencechange of As - FUEL OIL
reference
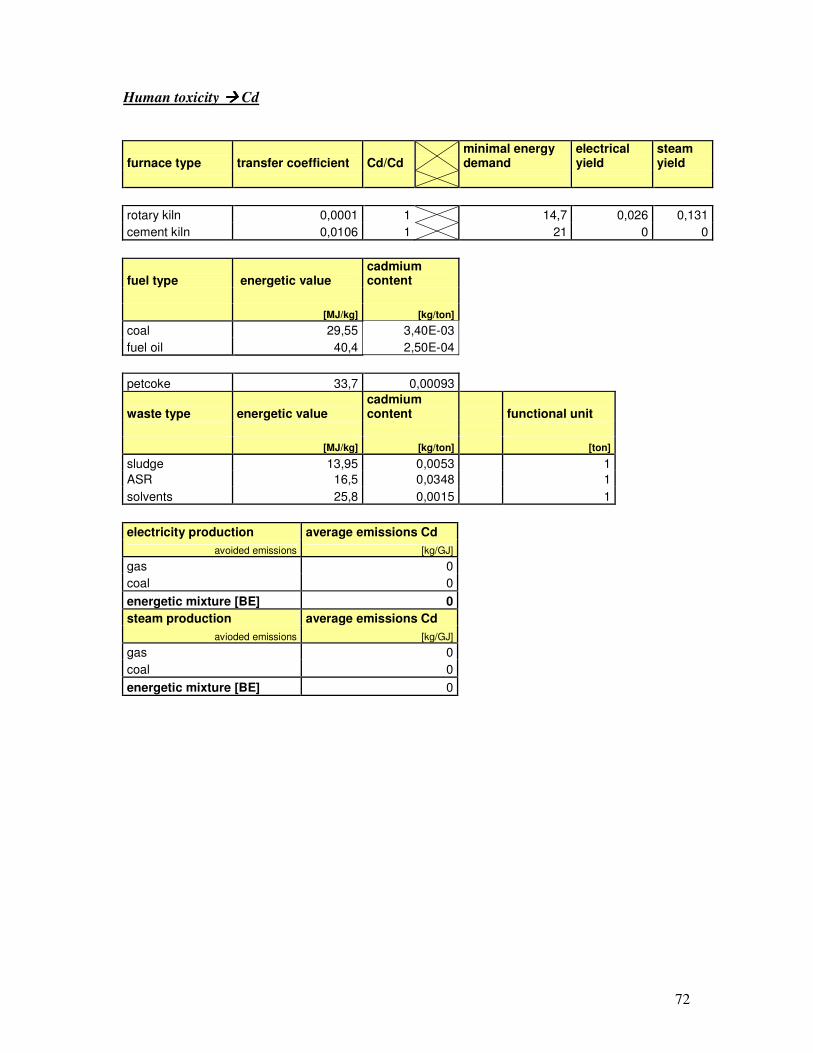
72
Human toxicity ���� Cd
furnace type transfer coefficient Cd/Cd minimal energy demand
electrical yield
steam yield
rotary kiln 0,0001 1 14,7 0,026 0,131
cement kiln 0,0106 1 21 0 0
fuel type energetic value cadmium content
[MJ/kg] [kg/ton]
coal 29,55 3,40E-03
fuel oil 40,4 2,50E-04
petcoke 33,7 0,00093
waste type energetic value cadmium content functional unit
[MJ/kg] [kg/ton] [ton]
sludge 13,95 0,0053 1
ASR 16,5 0,0348 1
solvents 25,8 0,0015 1
electricity production average emissions Cd
avoided emissions [kg/GJ]
gas 0
coal 0
energetic mixture [BE] 0
steam production average emissions Cd
avioded emissions [kg/GJ]
gas 0
coal 0
energetic mixture [BE] 0
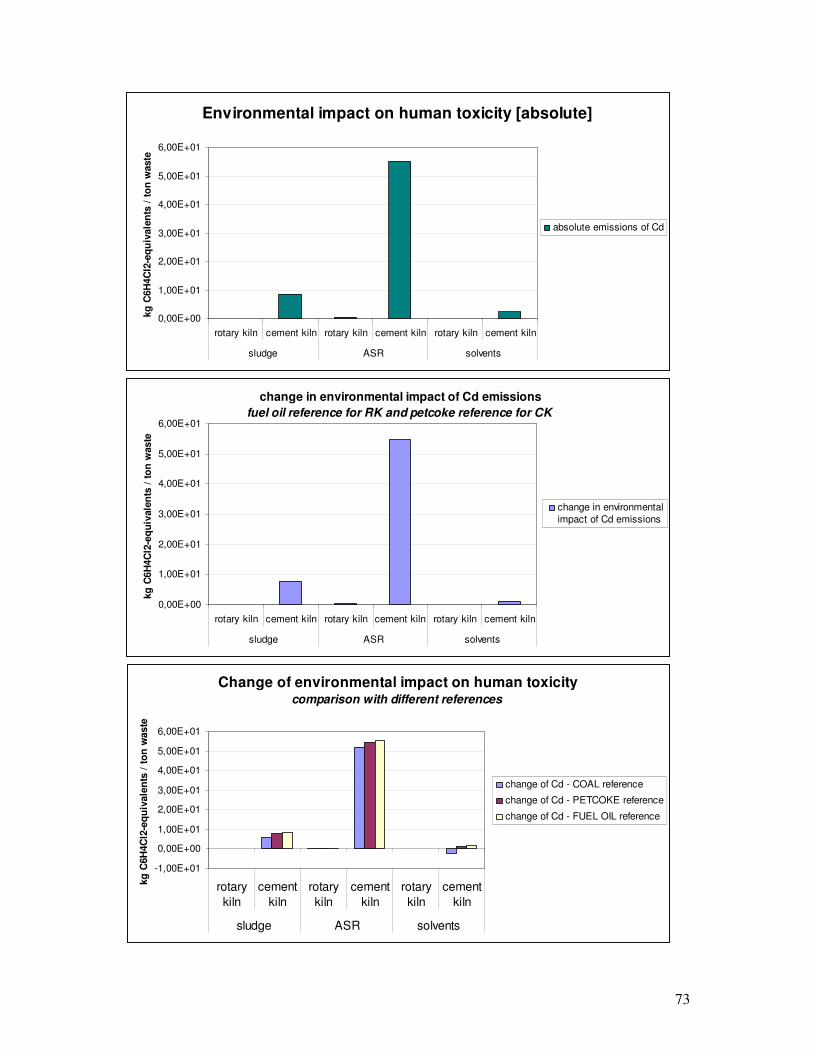
73
Environmental impact on human toxicity [absolute]
0,00E+00
1,00E+01
2,00E+01
3,00E+01
4,00E+01
5,00E+01
6,00E+01
rotary kiln cement kiln rotary kiln cement kiln rotary kiln cement kiln
sludge ASR solvents
kg
C6H
4C
l2-e
qu
ivale
nts
/ t
on
waste
absolute emissions of Cd
change in environmental impact of Cd emissions
fuel oil reference for RK and petcoke reference for CK
0,00E+00
1,00E+01
2,00E+01
3,00E+01
4,00E+01
5,00E+01
6,00E+01
rotary kiln cement kiln rotary kiln cement kiln rotary kiln cement kiln
sludge ASR solvents
kg
C6H
4C
l2-e
qu
ivale
nts
/ t
on
waste
change in environmental
impact of Cd emissions
Change of environmental impact on human toxicity comparison with different references
-1,00E+01
0,00E+00
1,00E+01
2,00E+01
3,00E+01
4,00E+01
5,00E+01
6,00E+01
rotary
kiln
cement
kiln
rotary
kiln
cement
kiln
rotary
kiln
cement
kiln
sludge ASR solvents
kg
C6H
4C
l2-e
qu
ivale
nts
/ t
on
waste
change of Cd - COAL reference
change of Cd - PETCOKE reference
change of Cd - FUEL OIL reference

74
Human toxicity ���� Cr
furnace type transfer coefficient Cr/Cr
minimal energy demand
electrical yield
steam yield
rotary kiln 5,00E-05 1 14,7 0,026 0,131
cement kiln 0,0002 1 21 0 0
fuel type energetic value chromium content
[MJ/kg] [kg/ton]
coal 29,55 2,52E-02
fuel oil 40,4 1,60E-03
petcoke 33,7 0,0045
waste type energetic value chromium content functional unit
[MJ/kg] [kg/ton] [ton]
sludge 13,95 2,406 1
ASR 16,5 1,204 1
solvents 25,8 0,0093 1
electricity production average emissions Cr
avoided emissions [kg/GJ]
gas 0
coal 0
energetic mixture [BE] 0
steam production average emissions Cr
avioded emissions [kg/GJ]
gas 0
coal 0
energetic mixture [BE] 0
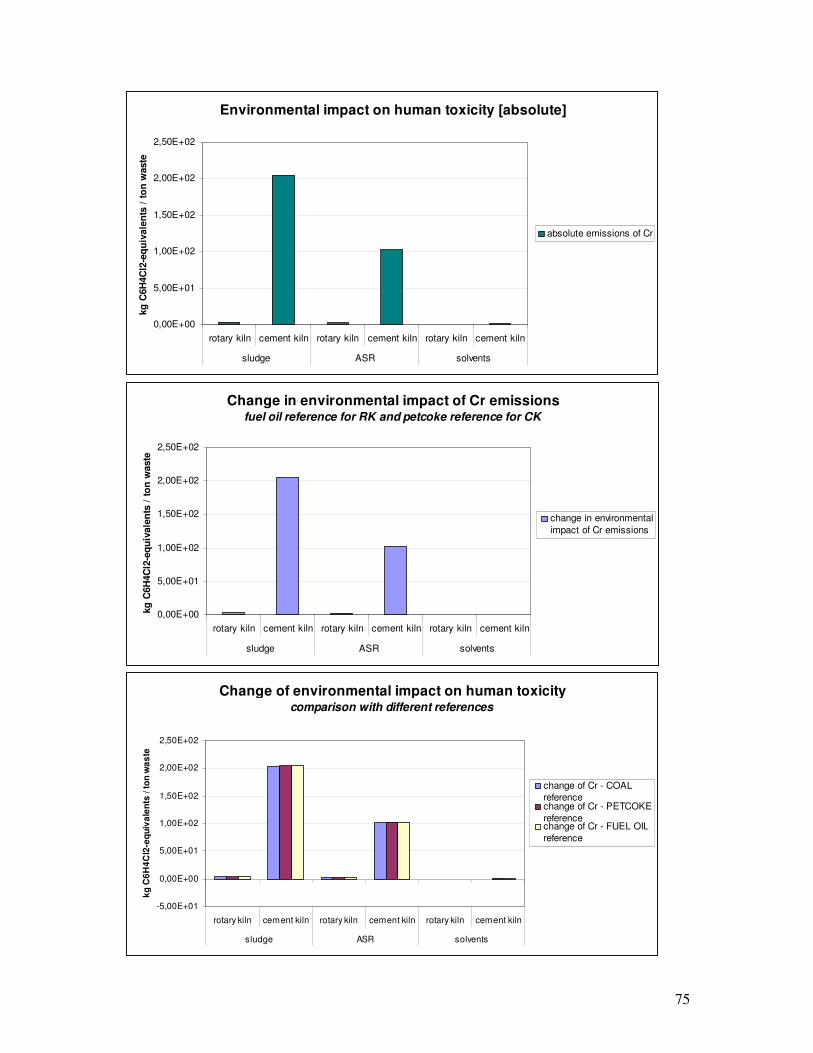
75
Environmental impact on human toxicity [absolute]
0,00E+00
5,00E+01
1,00E+02
1,50E+02
2,00E+02
2,50E+02
rotary kiln cement kiln rotary kiln cement kiln rotary kiln cement kiln
sludge ASR solvents
kg
C6H
4C
l2-e
qu
ivale
nts
/ t
on
waste
absolute emissions of Cr
Change in environmental impact of Cr emissionsfuel oil reference for RK and petcoke reference for CK
0,00E+00
5,00E+01
1,00E+02
1,50E+02
2,00E+02
2,50E+02
rotary kiln cement kiln rotary kiln cement kiln rotary kiln cement kiln
sludge ASR solvents
kg
C6H
4C
l2-e
qu
ivale
nts
/ t
on
waste
change in environmental
impact of Cr emissions
Change of environmental impact on human toxicity comparison with different references
-5,00E+01
0,00E+00
5,00E+01
1,00E+02
1,50E+02
2,00E+02
2,50E+02
rotary kiln cement kiln rotary kiln cement kiln rotary kiln cement kiln
sludge ASR solvents
kg
C6
H4
Cl2
-eq
uiv
ale
nts
/ t
on
wa
ste
change of Cr - COAL
referencechange of Cr - PETCOKE
referencechange of Cr - FUEL OIL
reference
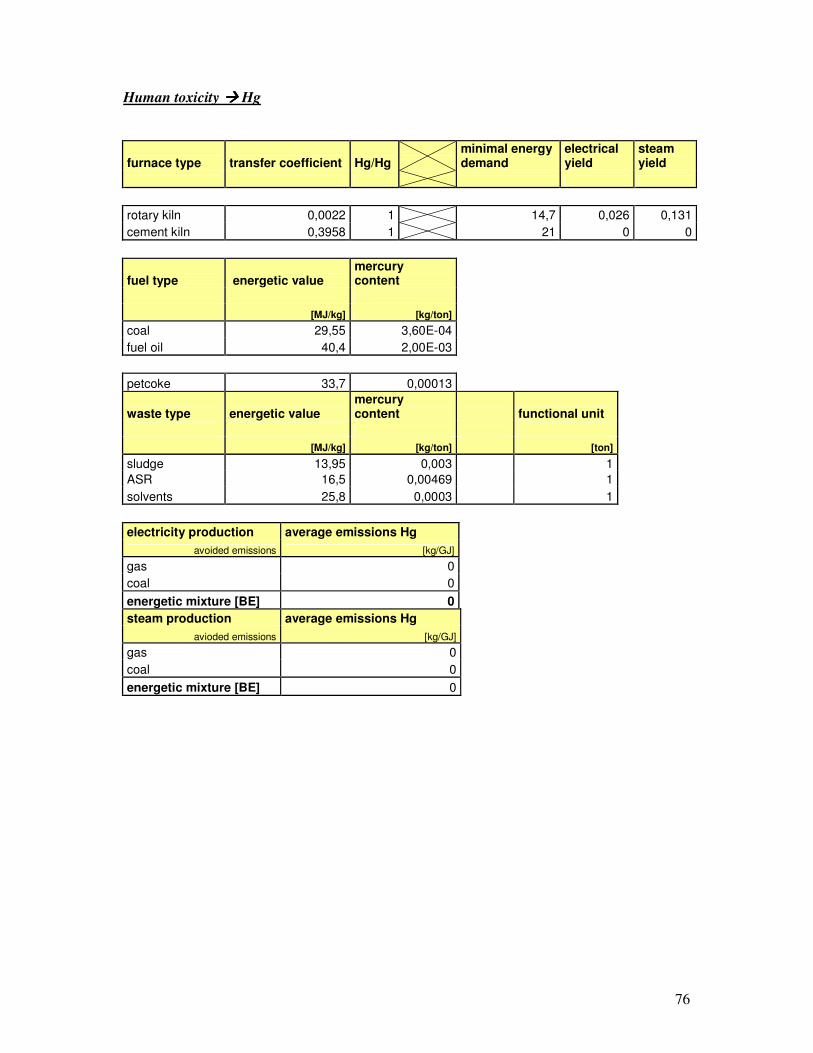
76
Human toxicity ���� Hg
furnace type transfer coefficient Hg/Hg minimal energy demand
electrical yield
steam yield
rotary kiln 0,0022 1 14,7 0,026 0,131
cement kiln 0,3958 1 21 0 0
fuel type energetic value mercury content
[MJ/kg] [kg/ton]
coal 29,55 3,60E-04
fuel oil 40,4 2,00E-03
petcoke 33,7 0,00013
waste type energetic value mercury content functional unit
[MJ/kg] [kg/ton] [ton]
sludge 13,95 0,003 1
ASR 16,5 0,00469 1
solvents 25,8 0,0003 1
electricity production average emissions Hg
avoided emissions [kg/GJ]
gas 0
coal 0
energetic mixture [BE] 0
steam production average emissions Hg
avioded emissions [kg/GJ]
gas 0
coal 0
energetic mixture [BE] 0
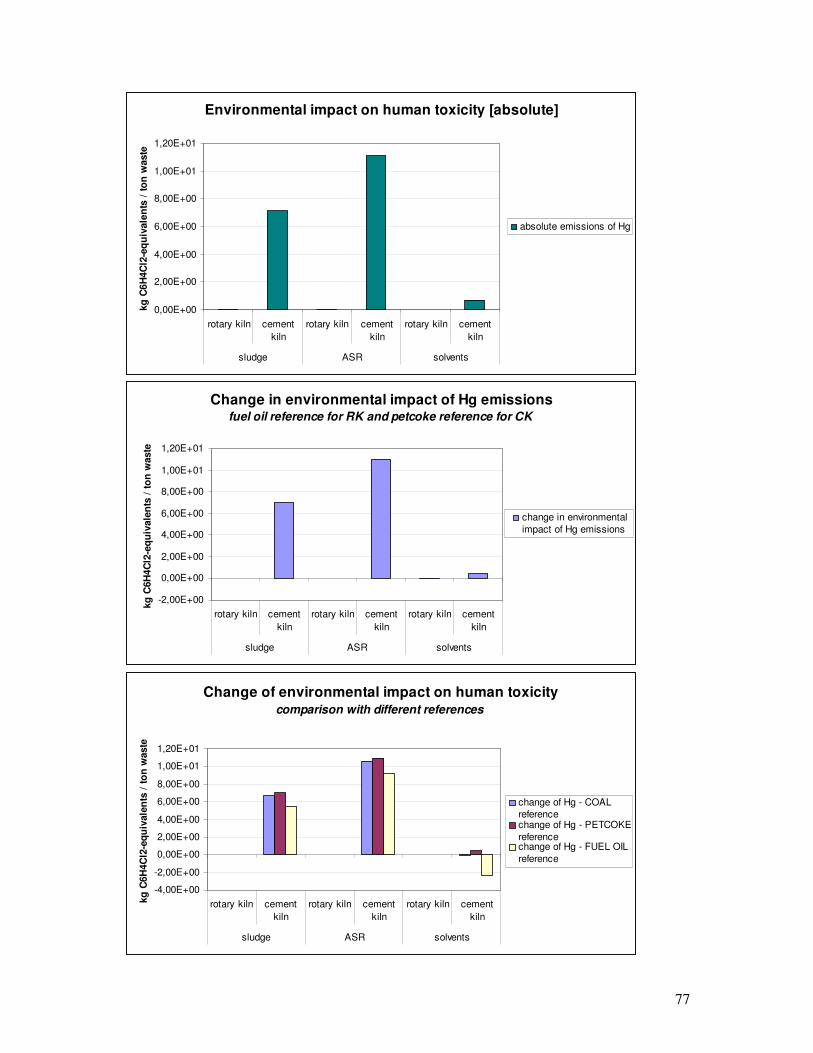
77
Environmental impact on human toxicity [absolute]
0,00E+00
2,00E+00
4,00E+00
6,00E+00
8,00E+00
1,00E+01
1,20E+01
rotary kiln cement
kiln
rotary kiln cement
kiln
rotary kiln cement
kiln
sludge ASR solvents
kg
C6H
4C
l2-e
qu
ivale
nts
/ t
on
waste
absolute emissions of Hg
Change in environmental impact of Hg emissionsfuel oil reference for RK and petcoke reference for CK
-2,00E+00
0,00E+00
2,00E+00
4,00E+00
6,00E+00
8,00E+00
1,00E+01
1,20E+01
rotary kiln cement
kiln
rotary kiln cement
kiln
rotary kiln cement
kiln
sludge ASR solvents
kg
C6H
4C
l2-e
qu
ivale
nts
/ t
on
waste
change in environmental
impact of Hg emissions
Change of environmental impact on human toxicity comparison with different references
-4,00E+00
-2,00E+00
0,00E+00
2,00E+00
4,00E+00
6,00E+00
8,00E+00
1,00E+01
1,20E+01
rotary kiln cement
kiln
rotary kiln cement
kiln
rotary kiln cement
kiln
sludge ASR solvents
kg
C6H
4C
l2-e
qu
ivale
nts
/ t
on
waste
change of Hg - COAL
referencechange of Hg - PETCOKE
referencechange of Hg - FUEL OIL
reference
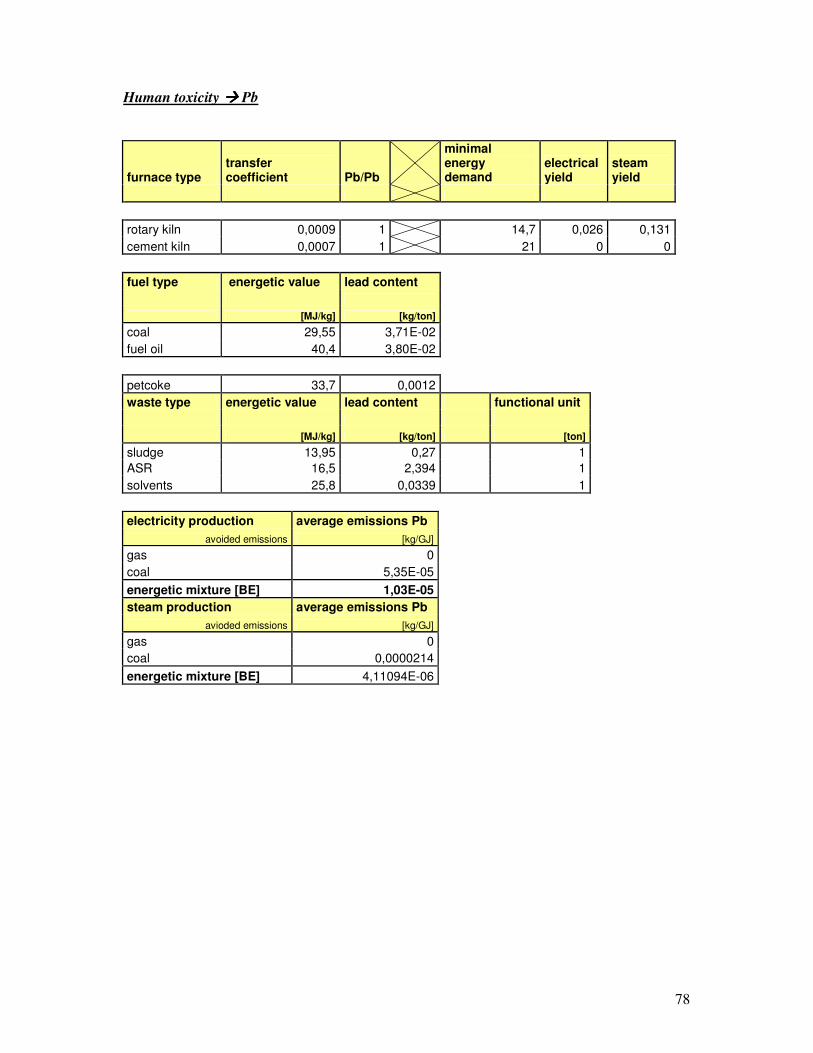
78
Human toxicity ���� Pb
furnace type transfer coefficient Pb/Pb
minimal energy demand
electrical yield
steam yield
rotary kiln 0,0009 1 14,7 0,026 0,131
cement kiln 0,0007 1 21 0 0
fuel type energetic value lead content
[MJ/kg] [kg/ton]
coal 29,55 3,71E-02
fuel oil 40,4 3,80E-02
petcoke 33,7 0,0012
waste type energetic value lead content functional unit
[MJ/kg] [kg/ton] [ton]
sludge 13,95 0,27 1
ASR 16,5 2,394 1
solvents 25,8 0,0339 1
electricity production average emissions Pb
avoided emissions [kg/GJ]
gas 0
coal 5,35E-05
energetic mixture [BE] 1,03E-05
steam production average emissions Pb
avioded emissions [kg/GJ]
gas 0
coal 0,0000214
energetic mixture [BE] 4,11094E-06
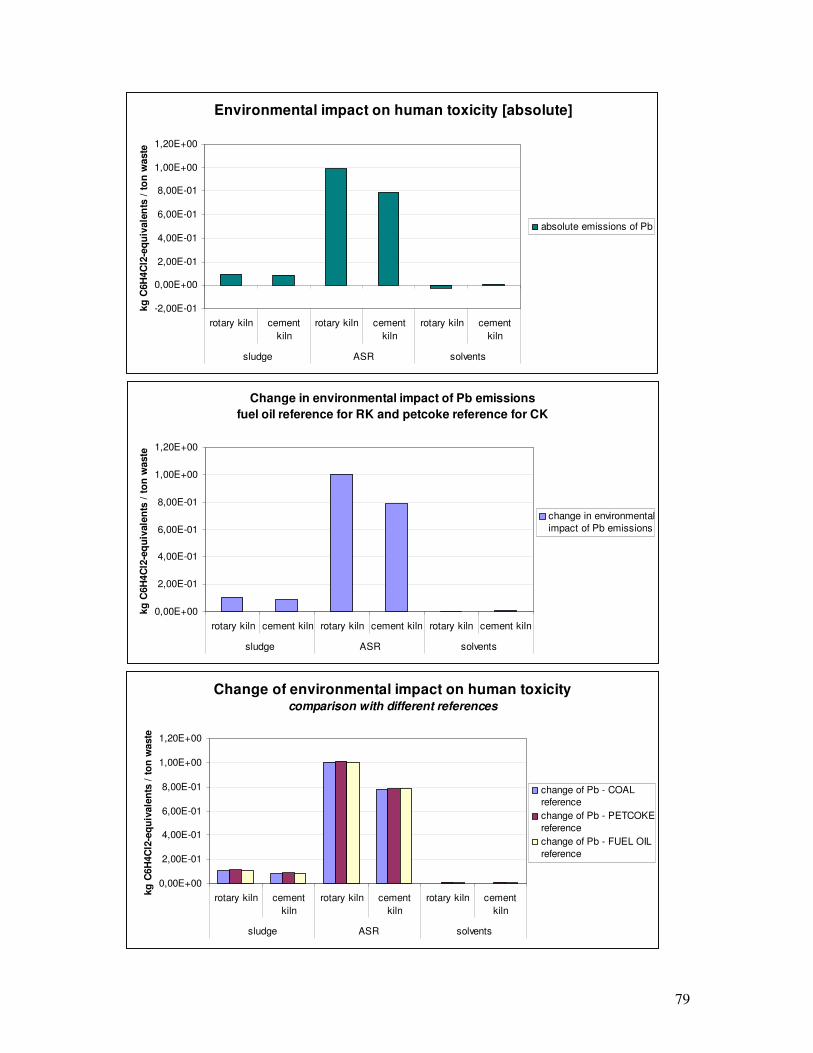
79
Environmental impact on human toxicity [absolute]
-2,00E-01
0,00E+00
2,00E-01
4,00E-01
6,00E-01
8,00E-01
1,00E+00
1,20E+00
rotary kiln cement
kiln
rotary kiln cement
kiln
rotary kiln cement
kiln
sludge ASR solvents
kg
C6H
4C
l2-e
qu
ivale
nts
/ t
on
waste
absolute emissions of Pb
Change in environmental impact of Pb emissions
fuel oil reference for RK and petcoke reference for CK
0,00E+00
2,00E-01
4,00E-01
6,00E-01
8,00E-01
1,00E+00
1,20E+00
rotary kiln cement kiln rotary kiln cement kiln rotary kiln cement kiln
sludge ASR solvents
kg
C6H
4C
l2-e
qu
ivale
nts
/ t
on
waste
change in environmental
impact of Pb emissions
Change of environmental impact on human toxicity comparison with different references
0,00E+00
2,00E-01
4,00E-01
6,00E-01
8,00E-01
1,00E+00
1,20E+00
rotary kiln cement
kiln
rotary kiln cement
kiln
rotary kiln cement
kiln
sludge ASR solvents
kg
C6H
4C
l2-e
qu
ivale
nts
/ t
on
waste
change of Pb - COAL
reference
change of Pb - PETCOKE
reference
change of Pb - FUEL OIL
reference
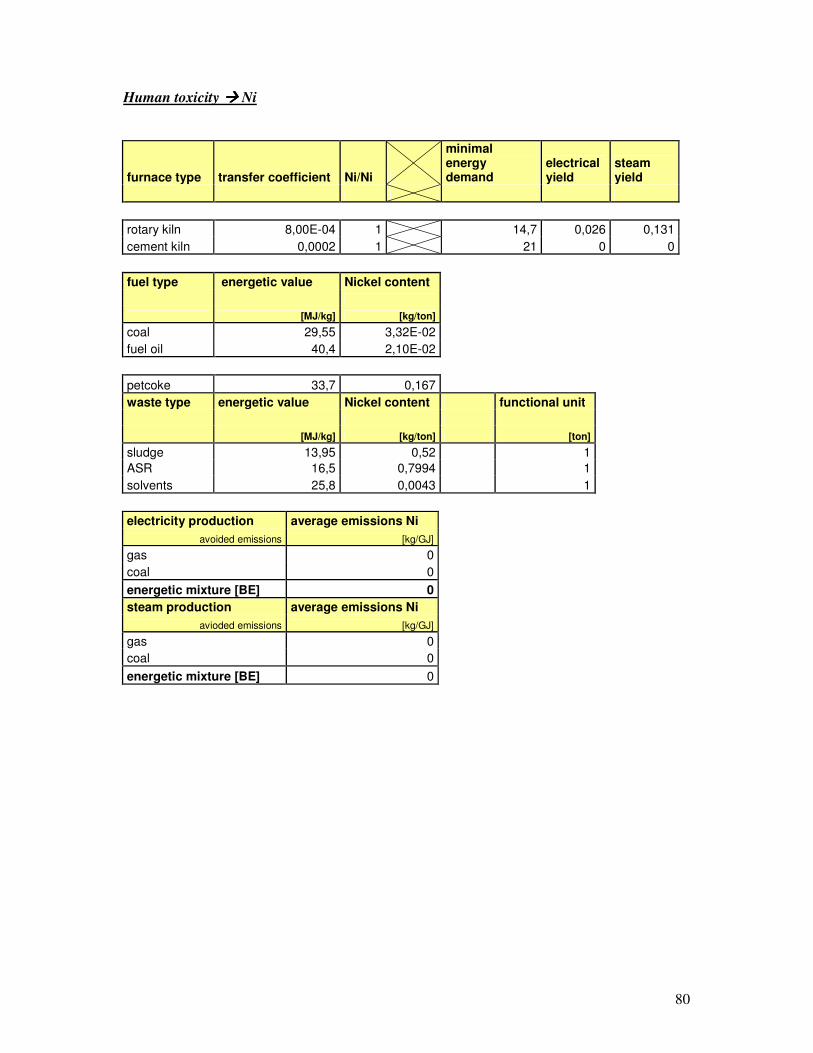
80
Human toxicity ���� Ni
furnace type transfer coefficient Ni/Ni
minimal energy demand
electrical yield
steam yield
rotary kiln 8,00E-04 1 14,7 0,026 0,131
cement kiln 0,0002 1 21 0 0
fuel type energetic value Nickel content
[MJ/kg] [kg/ton]
coal 29,55 3,32E-02
fuel oil 40,4 2,10E-02
petcoke 33,7 0,167
waste type energetic value Nickel content functional unit
[MJ/kg] [kg/ton] [ton]
sludge 13,95 0,52 1
ASR 16,5 0,7994 1
solvents 25,8 0,0043 1
electricity production average emissions Ni
avoided emissions [kg/GJ]
gas 0
coal 0
energetic mixture [BE] 0
steam production average emissions Ni
avioded emissions [kg/GJ]
gas 0
coal 0
energetic mixture [BE] 0
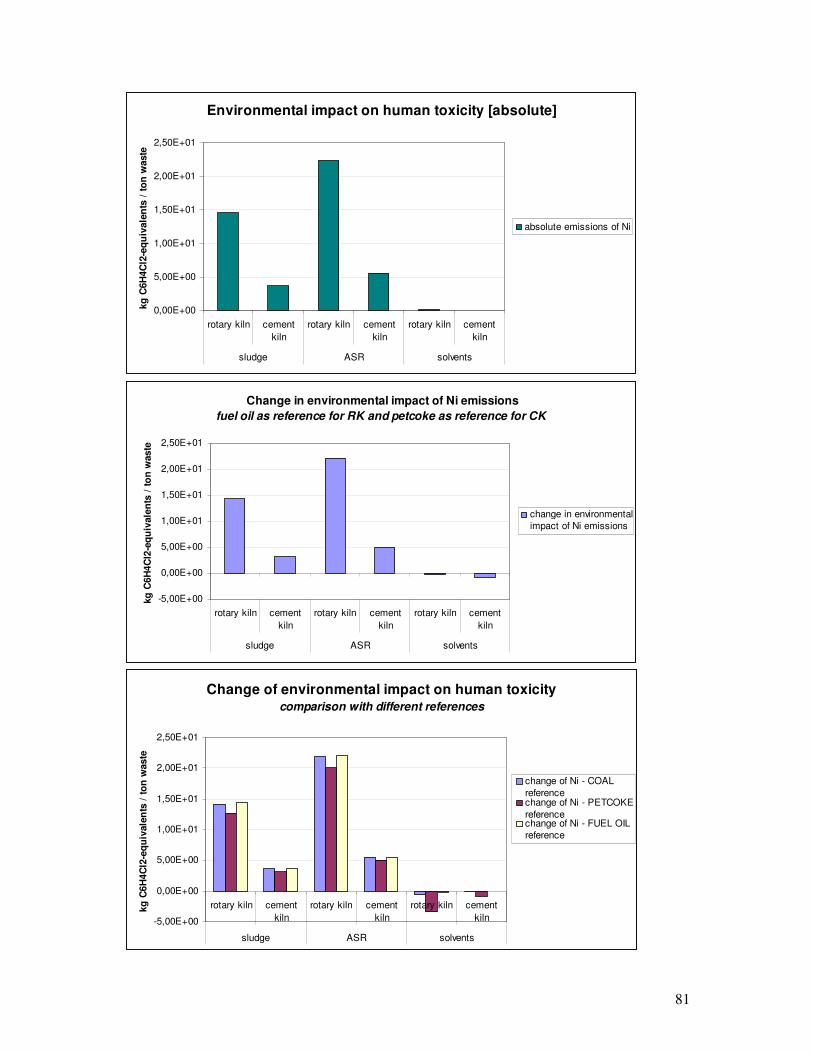
81
Environmental impact on human toxicity [absolute]
0,00E+00
5,00E+00
1,00E+01
1,50E+01
2,00E+01
2,50E+01
rotary kiln cement
kiln
rotary kiln cement
kiln
rotary kiln cement
kiln
sludge ASR solvents
kg
C6H
4C
l2-e
qu
ivale
nts
/ t
on
waste
absolute emissions of Ni
Change in environmental impact of Ni emissions
fuel oil as reference for RK and petcoke as reference for CK
-5,00E+00
0,00E+00
5,00E+00
1,00E+01
1,50E+01
2,00E+01
2,50E+01
rotary kiln cement
kiln
rotary kiln cement
kiln
rotary kiln cement
kiln
sludge ASR solvents
kg
C6H
4C
l2-e
qu
ivale
nts
/ t
on
waste
change in environmental
impact of Ni emissions
Change of environmental impact on human toxicity comparison with different references
-5,00E+00
0,00E+00
5,00E+00
1,00E+01
1,50E+01
2,00E+01
2,50E+01
rotary kiln cement
kiln
rotary kiln cement
kiln
rotary kiln cement
kiln
sludge ASR solvents
kg
C6H
4C
l2-e
qu
ivale
nts
/ t
on
waste
change of Ni - COAL
referencechange of Ni - PETCOKE
referencechange of Ni - FUEL OIL
reference

82
Human toxicity ���� Cu
furnace type transfer coefficient Cu/Cu
minimal energy demand
electrical yield
steam yield
rotary kiln 5,00E-04 1 14,7 0,026 0,131
cement kiln 2,00E-04 1 21 0 0
fuel type energetic value cupper content
[MJ/kg] [kg/ton]
coal 29,55 2,00E-02
fuel oil 40,4 4,77E-03
petcoke 33,7 7,41E-02
waste type energetic value cupper content functional unit
[MJ/kg] [kg/ton] [ton]
sludge 13,95 0,913 1
ASR 16,5 0,1855 1
solvents 25,8 5,48E-03 1
electricity production average emissions Cu
avoided emissions [kg/GJ]
gas 0
coal 0
energetic mixture [BE] 0
steam production average emissions Cu
avioded emissions [kg/GJ]
gas 0
coal 0
energetic mixture [BE] 0
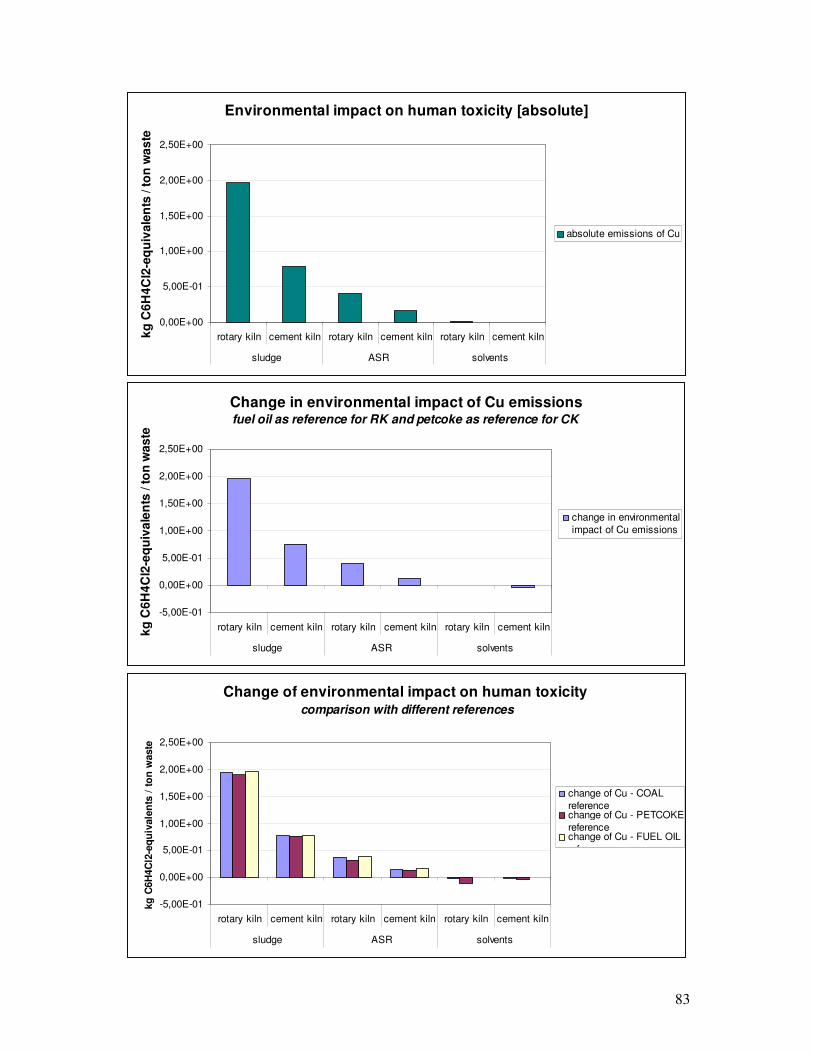
83
Environmental impact on human toxicity [absolute]
0,00E+00
5,00E-01
1,00E+00
1,50E+00
2,00E+00
2,50E+00
rotary kiln cement kiln rotary kiln cement kiln rotary kiln cement kiln
sludge ASR solvents
kg
C6
H4
Cl2
-eq
uiv
ale
nts
/ t
on
wa
ste
absolute emissions of Cu
Change in environmental impact of Cu emissionsfuel oil as reference for RK and petcoke as reference for CK
-5,00E-01
0,00E+00
5,00E-01
1,00E+00
1,50E+00
2,00E+00
2,50E+00
rotary kiln cement kiln rotary kiln cement kiln rotary kiln cement kiln
sludge ASR solvents
kg
C6
H4
Cl2
-eq
uiv
ale
nts
/ t
on
was
te
change in environmental
impact of Cu emissions
Change of environmental impact on human toxicity comparison with different references
-5,00E-01
0,00E+00
5,00E-01
1,00E+00
1,50E+00
2,00E+00
2,50E+00
rotary kiln cement kiln rotary kiln cement kiln rotary kiln cement kiln
sludge ASR solvents
kg
C6H
4C
l2-e
qu
ivale
nts
/ t
on
waste
change of Cu - COAL
referencechange of Cu - PETCOKE
referencechange of Cu - FUEL OIL
reference

84
Human toxicity ���� Zn
furnace type transfer coefficient Zn/Zn
minimal energy demand
electrical yield
steam yield
rotary kiln 0,0007 1 14,7 0,026 0,131
cement kiln 0,0017 1 21 0 0
fuel type energetic value Zinck content
[MJ/kg] [kg/ton]
coal 29,55 6,18E-02
fuel oil 40,4 7,73E-03
petcoke 33,7 1,31E+00
waste type energetic value Zinck content functional unit
[MJ/kg] [kg/ton] [ton]
sludge 13,95 1,758 1
ASR 16,5 11,09 1
solvents 25,8 1,57E-01 1
electricity production average emissions Zn
avoided emissions [kg/GJ]
gas 0
coal 1,35E-04
energetic mixture [BE] 2,59335E-05
steam production average emissions Zn
avioded emissions [kg/GJ]
gas 0
coal 0,000054
energetic mixture [BE] 1,03734E-05

85
Environmental impact on human toxicity [absolute]
-5,00E-01
0,00E+00
5,00E-01
1,00E+00
1,50E+00
2,00E+00
2,50E+00
rotary kiln cement kiln rotary kiln cement kiln rotary kiln cement kiln
sludge ASR solvents
kg
C6H
4C
l2-e
qu
ivale
nts
/ t
on
waste
absolute emissions of Zn
Change in environmental impact of Zn emissionsfuel oil as reference for RK and petcoke as reference for CK
-5,00E-01
0,00E+00
5,00E-01
1,00E+00
1,50E+00
2,00E+00
rotary kiln cement kiln rotary kiln cement kiln rotary kiln cement kiln
sludge ASR solvents
kg
C6H
4C
l2-e
qu
ivale
nts
/ t
on
waste
change in environmental
impact of Zn emissions
Change of environmental impact on human toxicity comparison with different references
-5,00E-01
0,00E+00
5,00E-01
1,00E+00
1,50E+00
2,00E+00
2,50E+00
rotary kiln cement kiln rotary kiln cement kiln rotary kiln cement kiln
sludge ASR solvents
kg
C6H
4C
l2-e
qu
ivale
nts
/ t
on
waste
change of Zn - COAL
referencechange of Zn - PETCOKE
referencechange of Zn - FUEL OIL
reference
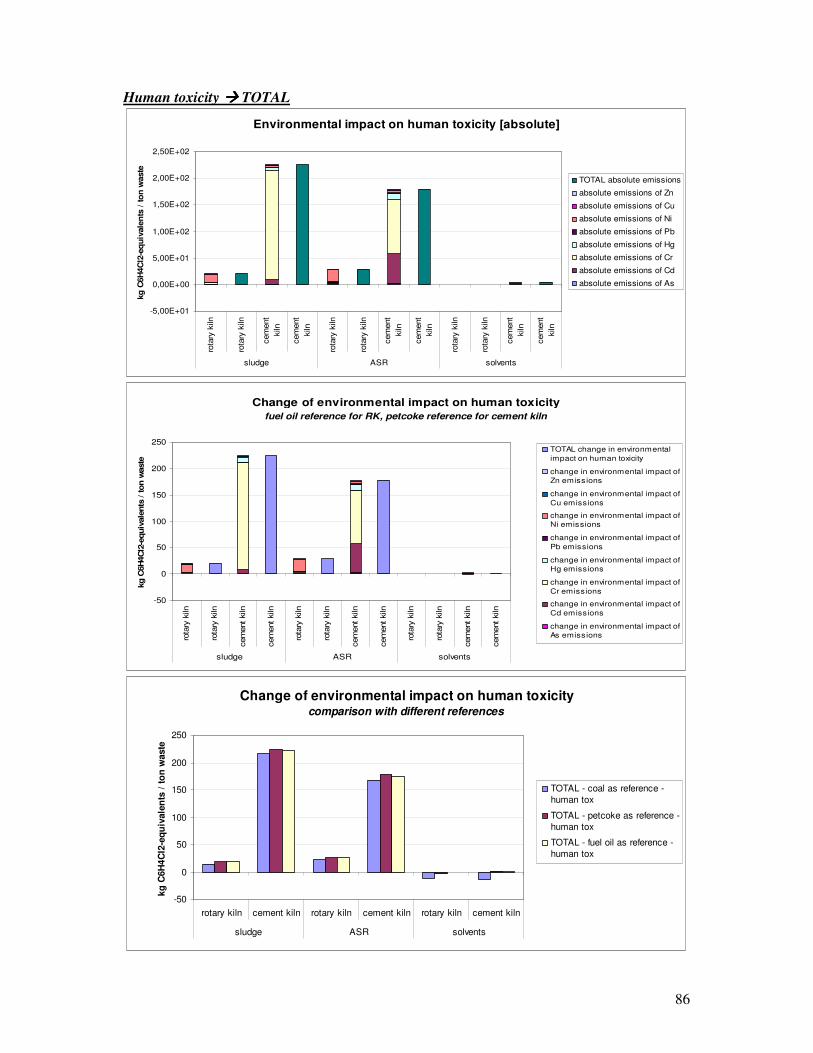
86
Human toxicity ���� TOTAL
Environmental impact on human toxicity [absolute]
-5,00E+01
0,00E+00
5,00E+01
1,00E+02
1,50E+02
2,00E+02
2,50E+02
rota
ry k
iln
rota
ry k
iln
cem
ent
kiln
cem
ent
kiln
rota
ry k
iln
rota
ry k
iln
cem
ent
kiln
cem
ent
kiln
rota
ry k
iln
rota
ry k
iln
cem
ent
kiln
cem
ent
kiln
sludge ASR solvents
kg
C6H
4C
l2-e
qu
ivale
nts
/ t
on
waste
TOTAL absolute emissions
absolute emissions of Zn
absolute emissions of Cu
absolute emissions of Ni
absolute emissions of Pb
absolute emissions of Hg
absolute emissions of Cr
absolute emissions of Cd
absolute emissions of As
Change of environmental impact on human toxicity
fuel oil reference for RK, petcoke reference for cement kiln
-50
0
50
100
150
200
250
rota
ry k
iln
rota
ry k
iln
cem
ent kiln
cem
ent kiln
rota
ry k
iln
rota
ry k
iln
cem
ent kiln
cem
ent kiln
rota
ry k
iln
rota
ry k
iln
cem
ent kiln
cem
ent kiln
sludge ASR solvents
kg C
6H
4C
l2-e
quiv
ale
nts
/ ton w
aste
TOTAL change in environmental
impact on human toxicity
change in environmental impact of
Zn emissions
change in environmental impact of
Cu emissions
change in environmental impact of
Ni emissions
change in environmental impact of
Pb emissions
change in environmental impact of
Hg emissions
change in environmental impact of
Cr emissions
change in environmental impact of
Cd emissions
change in environmental impact of
As emissions
Change of environmental impact on human toxicity comparison with different references
-50
0
50
100
150
200
250
rotary kiln cement kiln rotary kiln cement kiln rotary kiln cement kiln
sludge ASR solvents
kg
C6H
4C
l2-e
qu
ivale
nts
/ t
on
waste
TOTAL - coal as reference -
human tox
TOTAL - petcoke as reference -
human tox
TOTAL - fuel oil as reference -
human tox

87
Fresh water toxicity ���� As
furnace type transfer coefficient As/As minimal energy demand
electrical yield
steam yield
rotary kiln 0,0002 1 14,7 0,026 0,131
cement kiln 0,0002 1 21 0 0
fuel type energetic value arsenic content
[MJ/kg] [kg/ton]
coal 29,55 1,62E-01
fuel oil 40,4 3,00E-04
petcoke 33,7 0,0009
waste type energetic value arsenic content functional unit
[MJ/kg] [kg/ton] [ton]
sludge 13,95 0,0058 1
ASR 16,5 0,0325 1
solvents 25,8 0,00245 1
electricity production average emissions As
avoided emissions [kg/GJ]
gas 0
coal 0
energetic mixture [BE] 0
steam production average emissions As
avioded emissions [kg/GJ]
gas 0
coal 0
energetic mixture [BE] 0
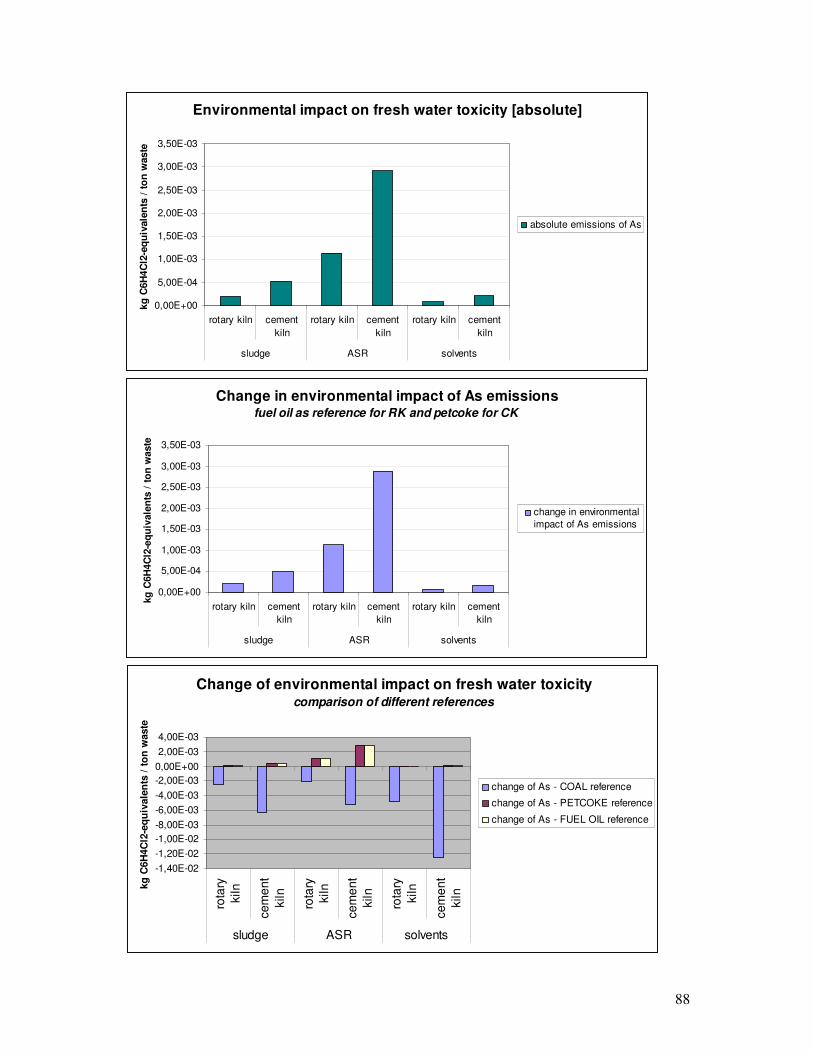
88
Environmental impact on fresh water toxicity [absolute]
0,00E+00
5,00E-04
1,00E-03
1,50E-03
2,00E-03
2,50E-03
3,00E-03
3,50E-03
rotary kiln cement
kiln
rotary kiln cement
kiln
rotary kiln cement
kiln
sludge ASR solvents
kg
C6H
4C
l2-e
qu
ivale
nts
/ t
on
waste
absolute emissions of As
Change in environmental impact of As emissionsfuel oil as reference for RK and petcoke for CK
0,00E+00
5,00E-04
1,00E-03
1,50E-03
2,00E-03
2,50E-03
3,00E-03
3,50E-03
rotary kiln cement
kiln
rotary kiln cement
kiln
rotary kiln cement
kiln
sludge ASR solvents
kg
C6H
4C
l2-e
qu
ivale
nts
/ t
on
waste
change in environmental
impact of As emissions
Change of environmental impact on fresh water toxicity comparison of different references
-1,40E-02
-1,20E-02
-1,00E-02
-8,00E-03
-6,00E-03
-4,00E-03
-2,00E-03
0,00E+00
2,00E-03
4,00E-03
rota
ry
kiln
cem
ent
kiln
rota
ry
kiln
cem
ent
kiln
rota
ry
kiln
cem
ent
kiln
sludge ASR solvents
kg
C6H
4C
l2-e
qu
ivale
nts
/ t
on
waste
change of As - COAL reference
change of As - PETCOKE reference
change of As - FUEL OIL reference

89
Fresh water toxicity ���� Cd
furnace type transfer coefficient Cd/Cd minimal energy demand
electrical yield
steam yield
rotary kiln 0,0001 1 14,7 0,026 0,131
cement kiln 0,0106 1 21 0 0
fuel type energetic value cadmium content
[MJ/kg] [kg/ton]
coal 29,55 3,40E-03
fuel oil 40,4 2,50E-04
petcoke 33,7 0,00093
waste type energetic value cadmium content functional unit
[MJ/kg] [kg/ton] [ton]
sludge 13,95 0,0053 1
ASR 16,5 0,0348 1
solvents 25,8 0,0015 1
electricity production average emissions Cd
avoided emissions [kg/GJ]
gas 0
coal 0
energetic mixture [BE] 0
steam production average emissions Cd
avioded emissions [kg/GJ]
gas 0
coal 0
energetic mixture [BE] 0
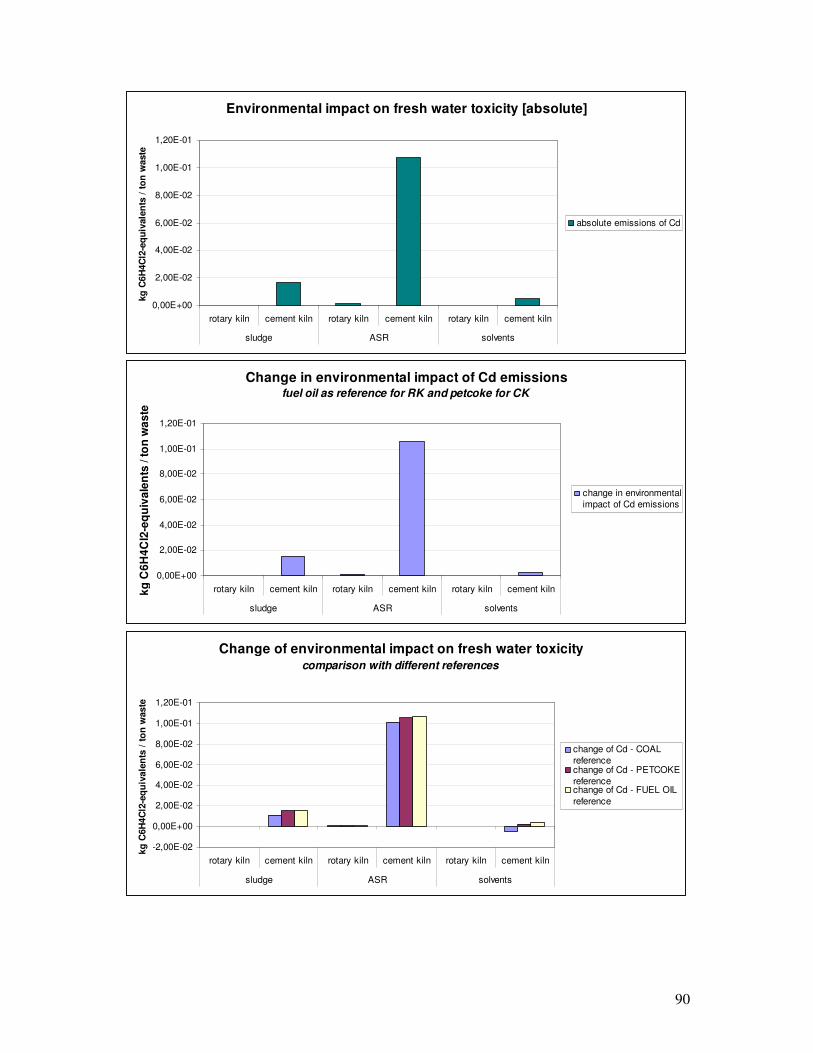
90
Environmental impact on fresh water toxicity [absolute]
0,00E+00
2,00E-02
4,00E-02
6,00E-02
8,00E-02
1,00E-01
1,20E-01
rotary kiln cement kiln rotary kiln cement kiln rotary kiln cement kiln
sludge ASR solvents
kg
C6H
4C
l2-e
qu
ivale
nts
/ t
on
waste
absolute emissions of Cd
Change in environmental impact of Cd emissionsfuel oil as reference for RK and petcoke for CK
0,00E+00
2,00E-02
4,00E-02
6,00E-02
8,00E-02
1,00E-01
1,20E-01
rotary kiln cement kiln rotary kiln cement kiln rotary kiln cement kiln
sludge ASR solvents
kg
C6
H4
Cl2
-eq
uiv
ale
nts
/ t
on
wa
ste
change in environmental
impact of Cd emissions
Change of environmental impact on fresh water toxicity comparison with different references
-2,00E-02
0,00E+00
2,00E-02
4,00E-02
6,00E-02
8,00E-02
1,00E-01
1,20E-01
rotary kiln cement kiln rotary kiln cement kiln rotary kiln cement kiln
sludge ASR solvents
kg
C6H
4C
l2-e
qu
ivale
nts
/ t
on
waste
change of Cd - COAL
referencechange of Cd - PETCOKE
referencechange of Cd - FUEL OIL
reference

91
Fresh water toxicity ���� Cr
furnace type transfer coefficient Cr/Cr
minimal energy demand
electrical yield
steam yield
rotary kiln 5,00E-05 1 14,7 0,026 0,131
cement kiln 0,0002 1 21 0 0
fuel type energetic value chromium content
[MJ/kg] [kg/ton]
coal 29,55 2,52E-02
fuel oil 40,4 1,60E-03
petcoke 33,7 0,0045
waste type energetic value chromium content functional unit
[MJ/kg] [kg/ton] [ton]
sludge 13,95 2,406 1
ASR 16,5 1,204 1
solvents 25,8 0,0093 1
electricity production average emissions Cr
avoided emissions [kg/GJ]
gas 0
coal 0
energetic mixture [BE] 0
steam production average emissions Cr
avioded emissions [kg/GJ]
gas 0
coal 0
energetic mixture [BE] 0
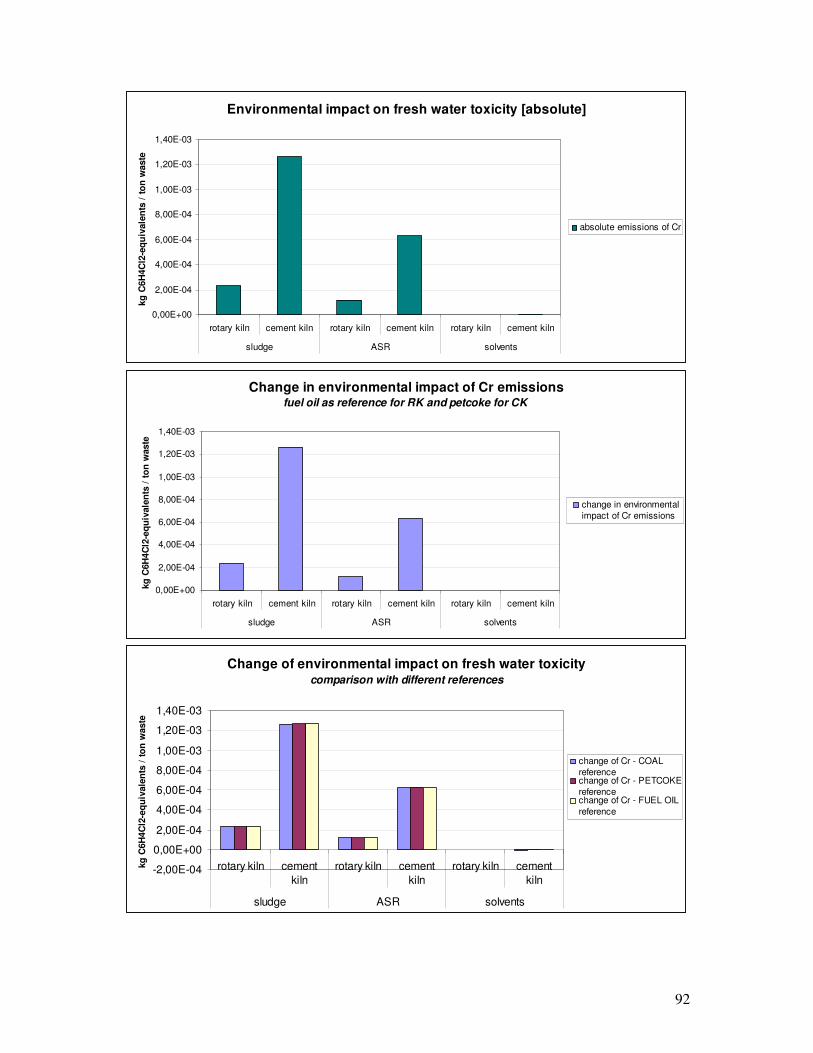
92
Environmental impact on fresh water toxicity [absolute]
0,00E+00
2,00E-04
4,00E-04
6,00E-04
8,00E-04
1,00E-03
1,20E-03
1,40E-03
rotary kiln cement kiln rotary kiln cement kiln rotary kiln cement kiln
sludge ASR solvents
kg
C6H
4C
l2-e
qu
ivale
nts
/ t
on
waste
absolute emissions of Cr
Change in environmental impact of Cr emissionsfuel oil as reference for RK and petcoke for CK
0,00E+00
2,00E-04
4,00E-04
6,00E-04
8,00E-04
1,00E-03
1,20E-03
1,40E-03
rotary kiln cement kiln rotary kiln cement kiln rotary kiln cement kiln
sludge ASR solvents
kg
C6H
4C
l2-e
qu
ivale
nts
/ t
on
waste
change in environmental
impact of Cr emissions
Change of environmental impact on fresh water toxicity comparison with different references
-2,00E-04
0,00E+00
2,00E-04
4,00E-04
6,00E-04
8,00E-04
1,00E-03
1,20E-03
1,40E-03
rotary kiln cement
kiln
rotary kiln cement
kiln
rotary kiln cement
kiln
sludge ASR solvents
kg
C6H
4C
l2-e
qu
ivale
nts
/ t
on
waste
change of Cr - COAL
referencechange of Cr - PETCOKE
referencechange of Cr - FUEL OIL
reference
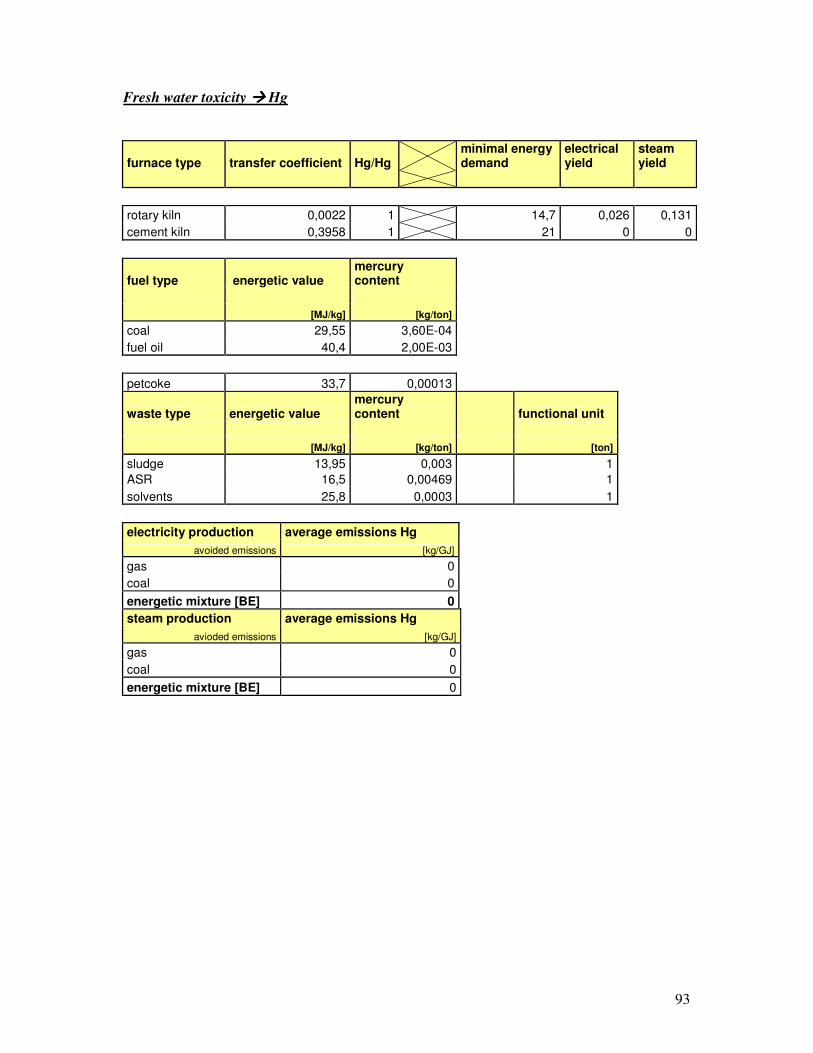
93
Fresh water toxicity ���� Hg
furnace type transfer coefficient Hg/Hg minimal energy demand
electrical yield
steam yield
rotary kiln 0,0022 1 14,7 0,026 0,131
cement kiln 0,3958 1 21 0 0
fuel type energetic value mercury content
[MJ/kg] [kg/ton]
coal 29,55 3,60E-04
fuel oil 40,4 2,00E-03
petcoke 33,7 0,00013
waste type energetic value mercury content functional unit
[MJ/kg] [kg/ton] [ton]
sludge 13,95 0,003 1
ASR 16,5 0,00469 1
solvents 25,8 0,0003 1
electricity production average emissions Hg
avoided emissions [kg/GJ]
gas 0
coal 0
energetic mixture [BE] 0
steam production average emissions Hg
avioded emissions [kg/GJ]
gas 0
coal 0
energetic mixture [BE] 0
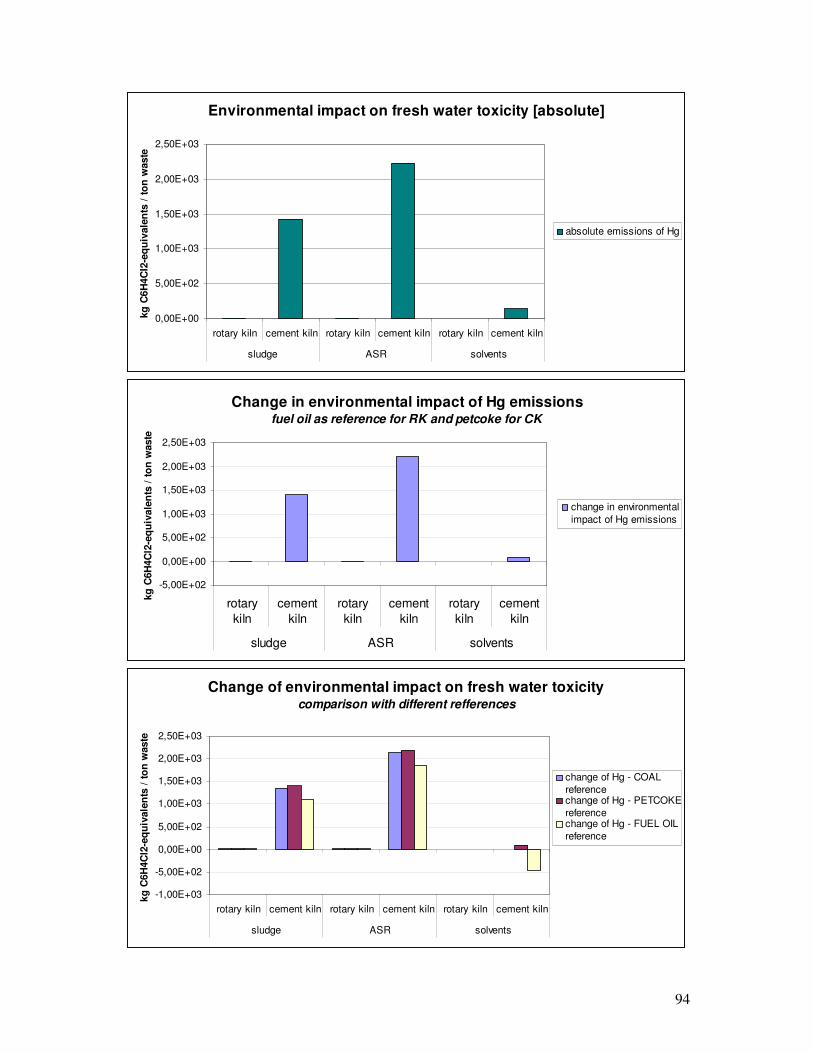
94
Environmental impact on fresh water toxicity [absolute]
0,00E+00
5,00E+02
1,00E+03
1,50E+03
2,00E+03
2,50E+03
rotary kiln cement kiln rotary kiln cement kiln rotary kiln cement kiln
sludge ASR solvents
kg
C6H
4C
l2-e
qu
ivale
nts
/ t
on
waste
absolute emissions of Hg
Change in environmental impact of Hg emissionsfuel oil as reference for RK and petcoke for CK
-5,00E+02
0,00E+00
5,00E+02
1,00E+03
1,50E+03
2,00E+03
2,50E+03
rotary
kiln
cement
kiln
rotary
kiln
cement
kiln
rotary
kiln
cement
kiln
sludge ASR solvents
kg
C6H
4C
l2-e
qu
ivale
nts
/ t
on
waste
change in environmental
impact of Hg emissions
Change of environmental impact on fresh water toxicity comparison with different refferences
-1,00E+03
-5,00E+02
0,00E+00
5,00E+02
1,00E+03
1,50E+03
2,00E+03
2,50E+03
rotary kiln cement kiln rotary kiln cement kiln rotary kiln cement kiln
sludge ASR solvents
kg
C6H
4C
l2-e
qu
ivale
nts
/ t
on
waste
change of Hg - COAL
referencechange of Hg - PETCOKE
referencechange of Hg - FUEL OIL
reference

95
Fresh water toxicity ���� Pb
furnace type transfer coefficient Pb/Pb
minimal energy demand
electrical yield
steam yield
rotary kiln 0,0009 1 14,7 0,026 0,131
cement kiln 0,0007 1 21 0 0
fuel type energetic value lead content
[MJ/kg] [kg/ton]
coal 29,55 3,71E-02
fuel oil 40,4 3,80E-02
petcoke 33,7 0,0012
waste type energetic value lead content functional unit
[MJ/kg] [kg/ton] [ton]
sludge 13,95 0,27 1
ASR 16,5 2,394 1
solvents 25,8 0,0339 1
electricity production average emissions Pb
avoided emissions [kg/GJ]
gas 0
coal 5,35E-05
energetic mixture [BE] 1,03E-05
steam production average emissions Pb
avioded emissions [kg/GJ]
gas 0
coal 0,0000214
energetic mixture [BE] 4,11094E-06
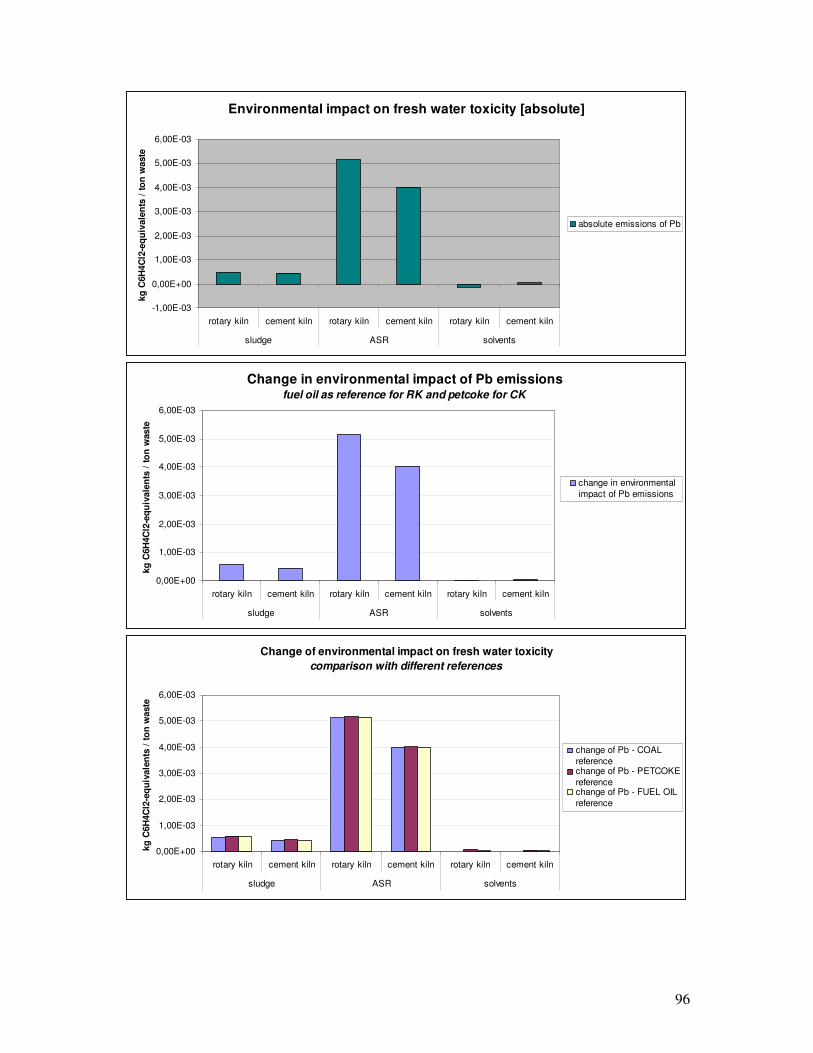
96
Environmental impact on fresh water toxicity [absolute]
-1,00E-03
0,00E+00
1,00E-03
2,00E-03
3,00E-03
4,00E-03
5,00E-03
6,00E-03
rotary kiln cement kiln rotary kiln cement kiln rotary kiln cement kiln
sludge ASR solvents
kg
C6H
4C
l2-e
qu
ivale
nts
/ t
on
waste
absolute emissions of Pb
Change in environmental impact of Pb emissionsfuel oil as reference for RK and petcoke for CK
0,00E+00
1,00E-03
2,00E-03
3,00E-03
4,00E-03
5,00E-03
6,00E-03
rotary kiln cement kiln rotary kiln cement kiln rotary kiln cement kiln
sludge ASR solvents
kg
C6H
4C
l2-e
qu
ivale
nts
/ t
on
waste
change in environmental
impact of Pb emissions
Change of environmental impact on fresh water toxicity
comparison with different references
0,00E+00
1,00E-03
2,00E-03
3,00E-03
4,00E-03
5,00E-03
6,00E-03
rotary kiln cement kiln rotary kiln cement kiln rotary kiln cement kiln
sludge ASR solvents
kg
C6H
4C
l2-e
qu
ivale
nts
/ t
on
waste
change of Pb - COAL
referencechange of Pb - PETCOKE
referencechange of Pb - FUEL OIL
reference

97
Fresh water toxicity ���� Ni
furnace type transfer coefficient Ni/Ni
minimal energy demand
electrical yield
steam yield
rotary kiln 8,00E-04 1 14,7 0,026 0,131
cement kiln 0,0002 1 21 0 0
fuel type energetic value Nickel content
[MJ/kg] [kg/ton]
coal 29,55 3,32E-02
fuel oil 40,4 2,10E-02
petcoke 33,7 0,167
waste type energetic value Nickel content functional unit
[MJ/kg] [kg/ton] [ton]
sludge 13,95 0,52 1
ASR 16,5 0,7994 1
solvents 25,8 0,0043 1
electricity production average emissions Ni
avoided emissions [kg/GJ]
gas 0
coal 0
energetic mixture [BE] 0
steam production average emissions Ni
avioded emissions [kg/GJ]
gas 0
coal 0
energetic mixture [BE] 0
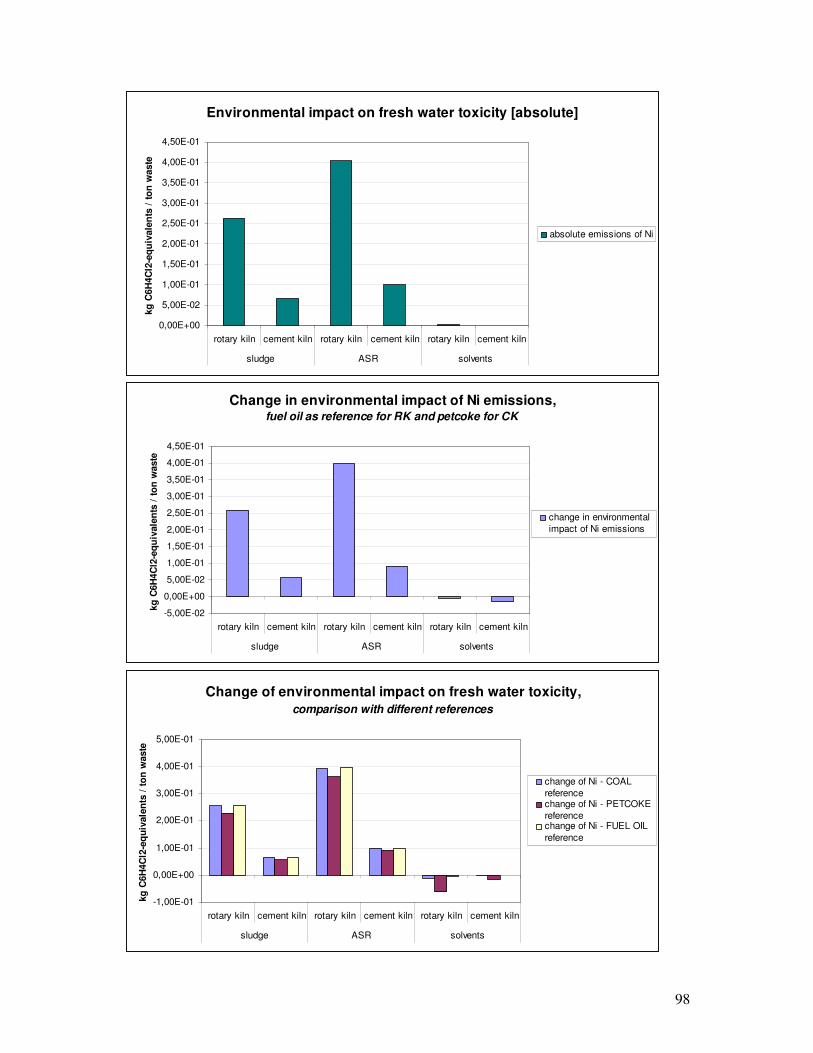
98
Environmental impact on fresh water toxicity [absolute]
0,00E+00
5,00E-02
1,00E-01
1,50E-01
2,00E-01
2,50E-01
3,00E-01
3,50E-01
4,00E-01
4,50E-01
rotary kiln cement kiln rotary kiln cement kiln rotary kiln cement kiln
sludge ASR solvents
kg
C6H
4C
l2-e
qu
ivale
nts
/ t
on
waste
absolute emissions of Ni
Change in environmental impact of Ni emissions,fuel oil as reference for RK and petcoke for CK
-5,00E-02
0,00E+00
5,00E-02
1,00E-01
1,50E-01
2,00E-01
2,50E-01
3,00E-01
3,50E-01
4,00E-01
4,50E-01
rotary kiln cement kiln rotary kiln cement kiln rotary kiln cement kiln
sludge ASR solvents
kg
C6H
4C
l2-e
qu
ivale
nts
/ t
on
waste
change in environmental
impact of Ni emissions
Change of environmental impact on fresh water toxicity,
comparison with different references
-1,00E-01
0,00E+00
1,00E-01
2,00E-01
3,00E-01
4,00E-01
5,00E-01
rotary kiln cement kiln rotary kiln cement kiln rotary kiln cement kiln
sludge ASR solvents
kg
C6H
4C
l2-e
qu
ivale
nts
/ t
on
waste
change of Ni - COAL
referencechange of Ni - PETCOKE
referencechange of Ni - FUEL OIL
reference
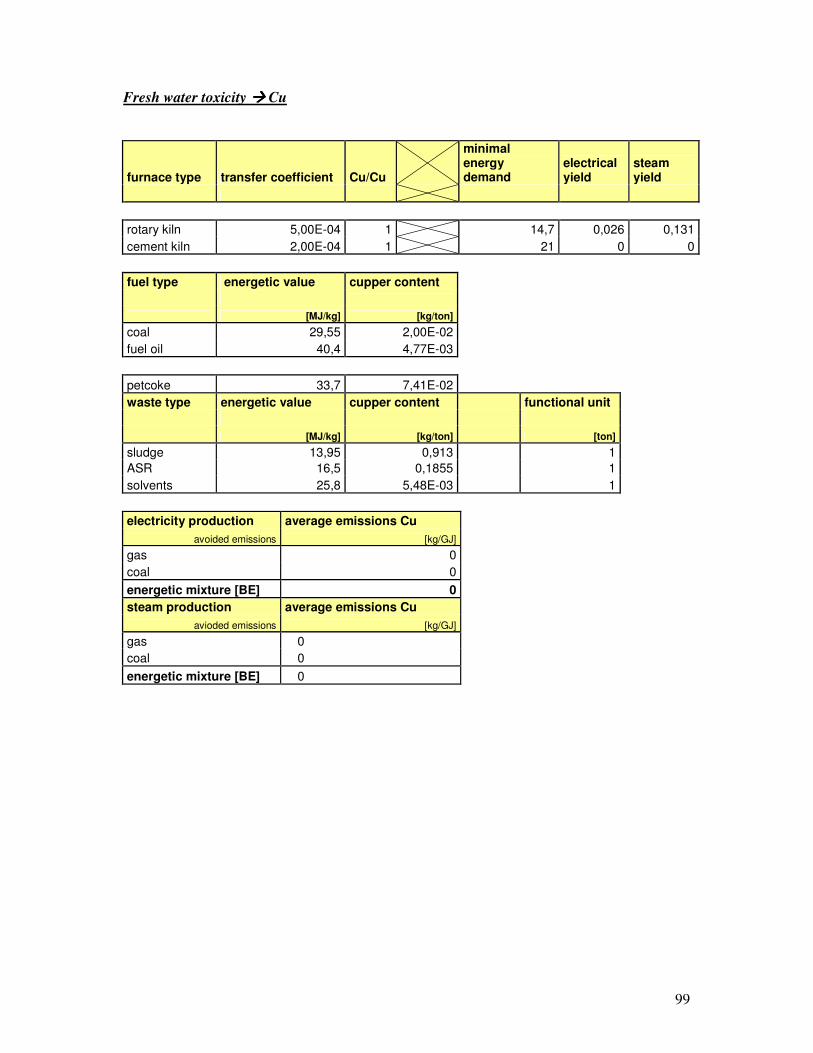
99
Fresh water toxicity ���� Cu
furnace type transfer coefficient Cu/Cu
minimal energy demand
electrical yield
steam yield
rotary kiln 5,00E-04 1 14,7 0,026 0,131
cement kiln 2,00E-04 1 21 0 0
fuel type energetic value cupper content
[MJ/kg] [kg/ton]
coal 29,55 2,00E-02
fuel oil 40,4 4,77E-03
petcoke 33,7 7,41E-02
waste type energetic value cupper content functional unit
[MJ/kg] [kg/ton] [ton]
sludge 13,95 0,913 1
ASR 16,5 0,1855 1
solvents 25,8 5,48E-03 1
electricity production average emissions Cu
avoided emissions [kg/GJ]
gas 0
coal 0
energetic mixture [BE] 0
steam production average emissions Cu
avioded emissions [kg/GJ]
gas 0
coal 0
energetic mixture [BE] 0
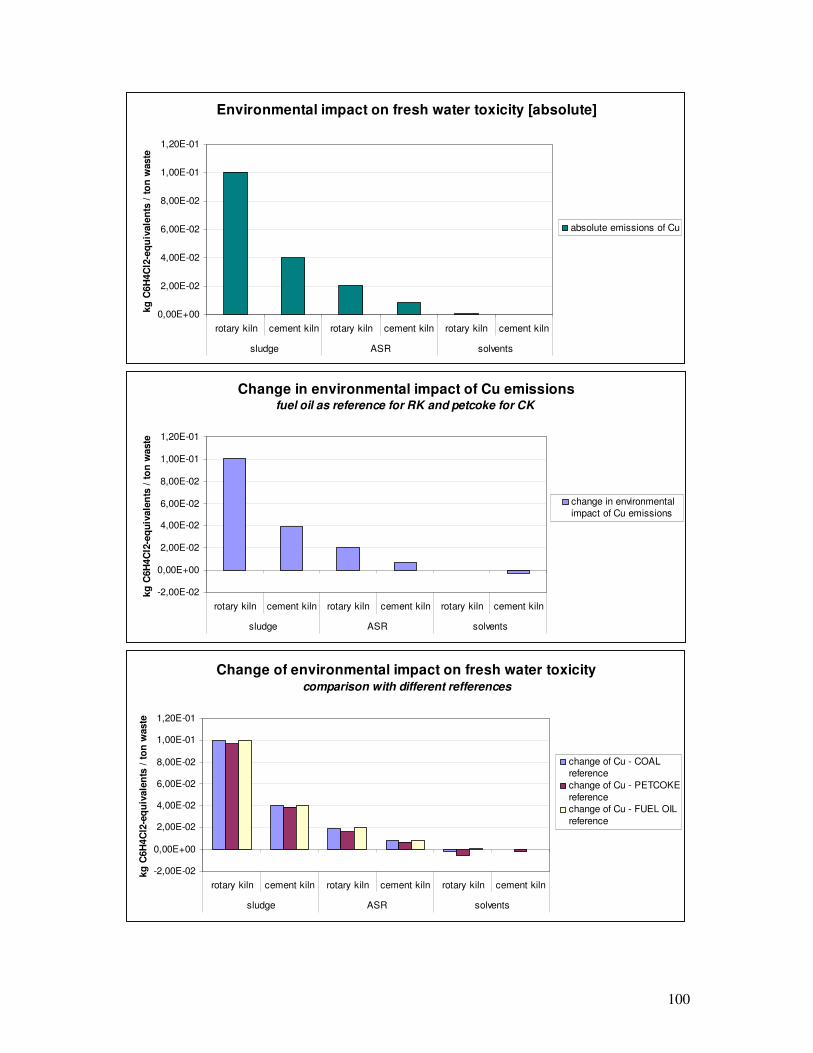
100
Environmental impact on fresh water toxicity [absolute]
0,00E+00
2,00E-02
4,00E-02
6,00E-02
8,00E-02
1,00E-01
1,20E-01
rotary kiln cement kiln rotary kiln cement kiln rotary kiln cement kiln
sludge ASR solvents
kg
C6H
4C
l2-e
qu
ivale
nts
/ t
on
waste
absolute emissions of Cu
Change in environmental impact of Cu emissionsfuel oil as reference for RK and petcoke for CK
-2,00E-02
0,00E+00
2,00E-02
4,00E-02
6,00E-02
8,00E-02
1,00E-01
1,20E-01
rotary kiln cement kiln rotary kiln cement kiln rotary kiln cement kiln
sludge ASR solvents
kg
C6H
4C
l2-e
qu
ivale
nts
/ t
on
waste
change in environmental
impact of Cu emissions
Change of environmental impact on fresh water toxicity comparison with different refferences
-2,00E-02
0,00E+00
2,00E-02
4,00E-02
6,00E-02
8,00E-02
1,00E-01
1,20E-01
rotary kiln cement kiln rotary kiln cement kiln rotary kiln cement kiln
sludge ASR solvents
kg
C6H
4C
l2-e
qu
ivale
nts
/ t
on
waste
change of Cu - COAL
reference
change of Cu - PETCOKE
reference
change of Cu - FUEL OIL
reference

101
Fresh water toxicity ���� Zn
furnace type transfer coefficient Zn/Zn
minimal energy demand
electrical yield
steam yield
rotary kiln 0,0007 1 14,7 0,026 0,131
cement kiln 0,0017 1 21 0 0
fuel type energetic value Zinck content
[MJ/kg] [kg/ton]
coal 29,55 6,18E-02
fuel oil 40,4 7,73E-03
petcoke 33,7 1,31E+00
waste type energetic value Zinck content functional unit
[MJ/kg] [kg/ton] [ton]
sludge 13,95 1,758 1
ASR 16,5 11,09 1
solvents 25,8 1,57E-01 1
electricity production average emissions Zn
avoided emissions [kg/GJ]
gas 0
coal 1,35E-04
energetic mixture [BE] 2,59335E-05
steam production average emissions Zn
avioded emissions [kg/GJ]
gas 0
coal 0,000054
energetic mixture [BE] 1,03734E-05
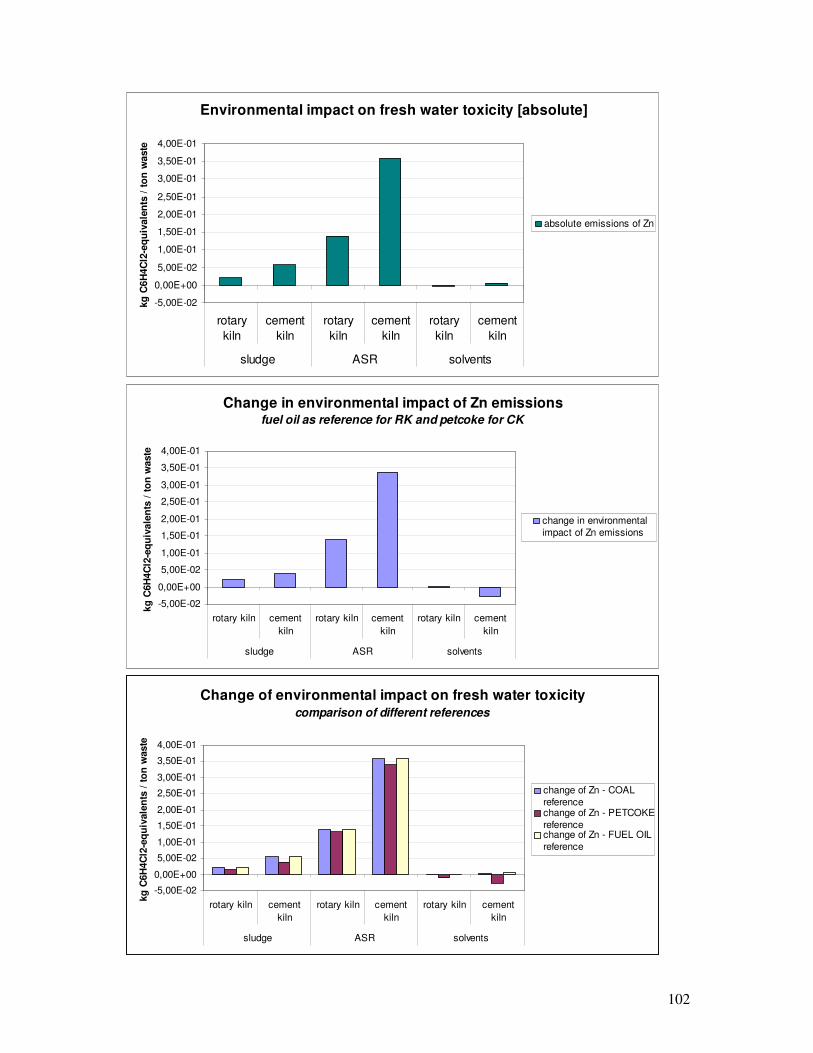
102
Environmental impact on fresh water toxicity [absolute]
-5,00E-02
0,00E+00
5,00E-02
1,00E-01
1,50E-01
2,00E-01
2,50E-01
3,00E-01
3,50E-01
4,00E-01
rotary
kiln
cement
kiln
rotary
kiln
cement
kiln
rotary
kiln
cement
kiln
sludge ASR solvents
kg
C6H
4C
l2-e
qu
ivale
nts
/ t
on
waste
absolute emissions of Zn
Change in environmental impact of Zn emissionsfuel oil as reference for RK and petcoke for CK
-5,00E-02
0,00E+00
5,00E-02
1,00E-01
1,50E-01
2,00E-01
2,50E-01
3,00E-01
3,50E-01
4,00E-01
rotary kiln cement
kiln
rotary kiln cement
kiln
rotary kiln cement
kiln
sludge ASR solvents
kg
C6H
4C
l2-e
qu
ivale
nts
/ t
on
waste
change in environmental
impact of Zn emissions
Change of environmental impact on fresh water toxicity comparison of different references
-5,00E-02
0,00E+00
5,00E-02
1,00E-01
1,50E-01
2,00E-01
2,50E-01
3,00E-01
3,50E-01
4,00E-01
rotary kiln cement
kiln
rotary kiln cement
kiln
rotary kiln cement
kiln
sludge ASR solvents
kg
C6H
4C
l2-e
qu
ivale
nts
/ t
on
waste
change of Zn - COAL
referencechange of Zn - PETCOKE
referencechange of Zn - FUEL OIL
reference
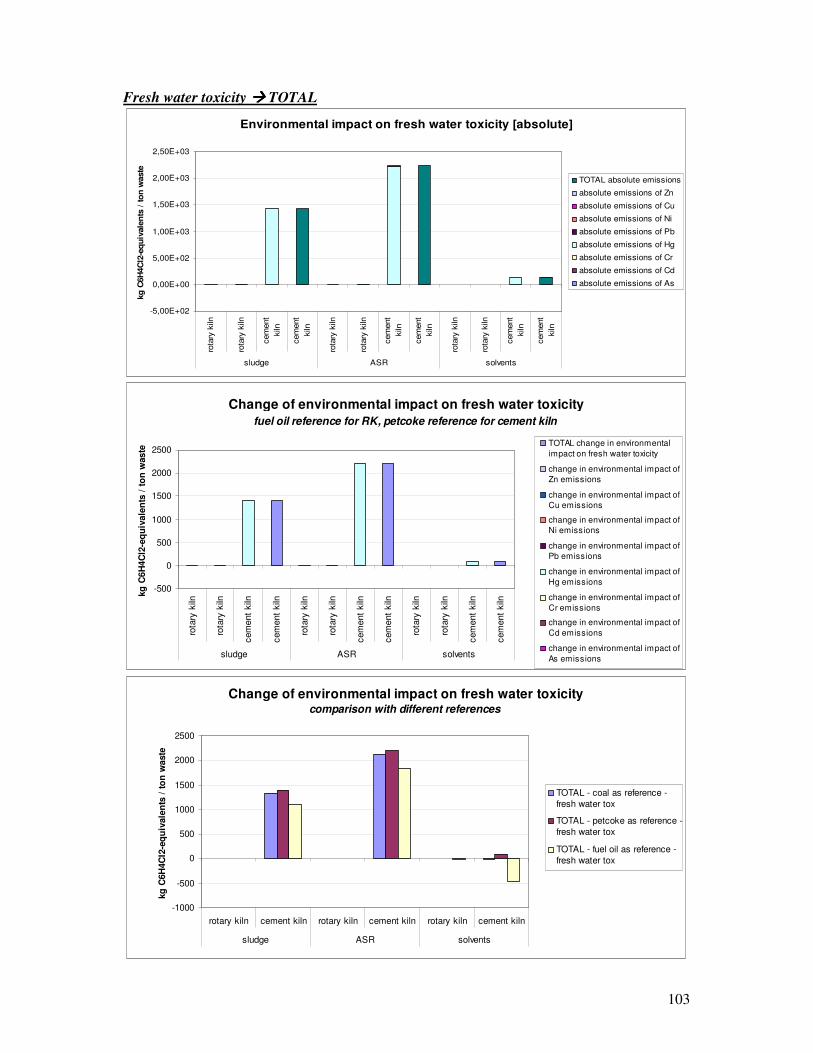
103
Fresh water toxicity ���� TOTAL
Environmental impact on fresh water toxicity [absolute]
-5,00E+02
0,00E+00
5,00E+02
1,00E+03
1,50E+03
2,00E+03
2,50E+03
rota
ry k
iln
rota
ry k
iln
cem
ent
kiln
cem
ent
kiln
rota
ry k
iln
rota
ry k
iln
cem
ent
kiln
cem
ent
kiln
rota
ry k
iln
rota
ry k
iln
cem
ent
kiln
cem
ent
kiln
sludge ASR solvents
kg
C6H
4C
l2-e
qu
ivale
nts
/ t
on
waste
TOTAL absolute emissions
absolute emissions of Zn
absolute emissions of Cu
absolute emissions of Ni
absolute emissions of Pb
absolute emissions of Hg
absolute emissions of Cr
absolute emissions of Cd
absolute emissions of As
Change of environmental impact on fresh water toxicity
fuel oil reference for RK, petcoke reference for cement kiln
-500
0
500
1000
1500
2000
2500
rota
ry k
iln
rota
ry k
iln
cem
ent
kiln
cem
ent
kiln
rota
ry k
iln
rota
ry k
iln
cem
ent
kiln
cem
ent
kiln
rota
ry k
iln
rota
ry k
iln
cem
ent
kiln
cem
ent
kiln
sludge ASR solvents
kg
C6H
4C
l2-e
qu
ivale
nts
/ t
on
waste
TOTAL change in environmental
impact on fresh water toxicity
change in environmental impact of
Zn emissions
change in environmental impact of
Cu emissions
change in environmental impact of
Ni emissions
change in environmental impact of
Pb emissions
change in environmental impact of
Hg emissions
change in environmental impact of
Cr emissions
change in environmental impact of
Cd emissions
change in environmental impact of
As emissions
Change of environmental impact on fresh water toxicity comparison with different references
-1000
-500
0
500
1000
1500
2000
2500
rotary kiln cement kiln rotary kiln cement kiln rotary kiln cement kiln
sludge ASR solvents
kg
C6H
4C
l2-e
qu
ivale
nts
/ t
on
waste
TOTAL - coal as reference -
fresh water tox
TOTAL - petcoke as reference -
fresh water tox
TOTAL - fuel oil as reference -
fresh water tox

104
Sea water toxicity ���� As
furnace type transfer coefficient As/As minimal energy demand
electrical yield
steam yield
rotary kiln 0,0002 1 14,7 0,026 0,131
cement kiln 0,0002 1 21 0 0
fuel type energetic value arsenic content
[MJ/kg] [kg/ton]
coal 29,55 1,62E-01
fuel oil 40,4 3,00E-04
petcoke 33,7 0,0009
waste type energetic value arsenic content functional unit
[MJ/kg] [kg/ton] [ton]
sludge 13,95 0,0058 1
ASR 16,5 0,0325 1
solvents 25,8 0,00245 1
electricity production average emissions As
avoided emissions [kg/GJ]
gas 0
coal 0
energetic mixture [BE] 0
steam production average emissions As
avioded emissions [kg/GJ]
gas 0
coal 0
energetic mixture [BE] 0
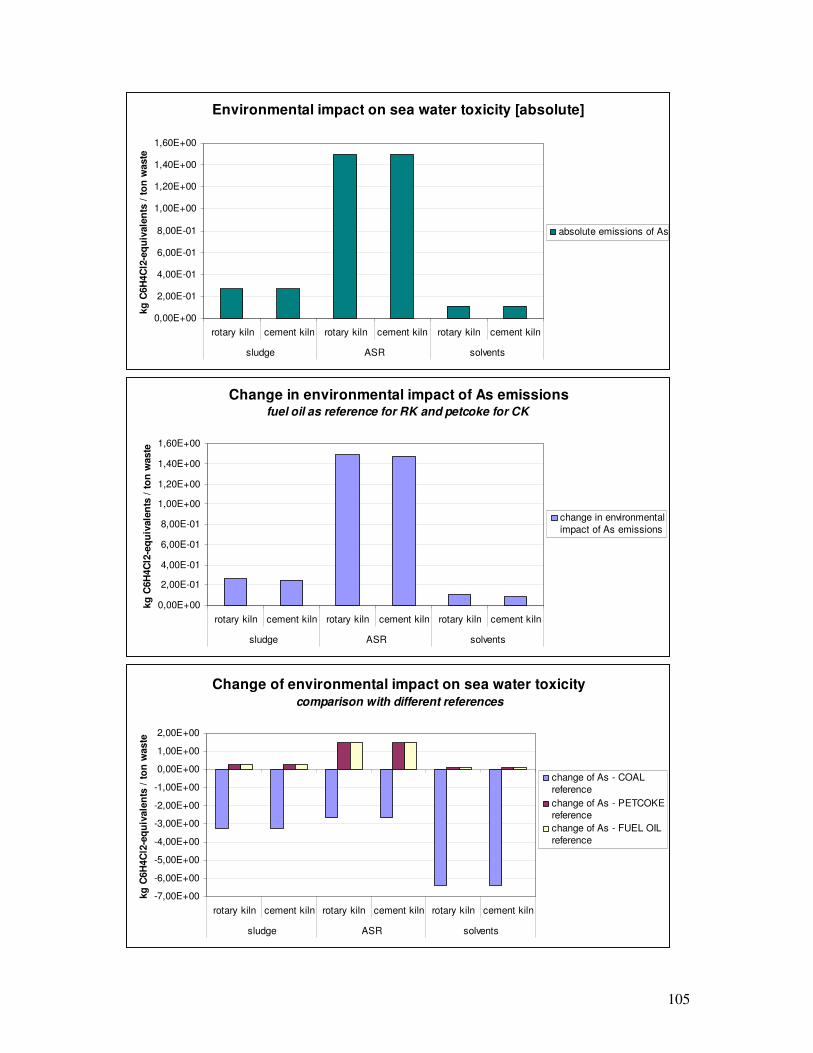
105
Environmental impact on sea water toxicity [absolute]
0,00E+00
2,00E-01
4,00E-01
6,00E-01
8,00E-01
1,00E+00
1,20E+00
1,40E+00
1,60E+00
rotary kiln cement kiln rotary kiln cement kiln rotary kiln cement kiln
sludge ASR solvents
kg
C6H
4C
l2-e
qu
ivale
nts
/ t
on
waste
absolute emissions of As
Change in environmental impact of As emissionsfuel oil as reference for RK and petcoke for CK
0,00E+00
2,00E-01
4,00E-01
6,00E-01
8,00E-01
1,00E+00
1,20E+00
1,40E+00
1,60E+00
rotary kiln cement kiln rotary kiln cement kiln rotary kiln cement kiln
sludge ASR solvents
kg
C6H
4C
l2-e
qu
ivale
nts
/ t
on
waste
change in environmental
impact of As emissions
Change of environmental impact on sea water toxicity comparison with different references
-7,00E+00
-6,00E+00
-5,00E+00
-4,00E+00
-3,00E+00
-2,00E+00
-1,00E+00
0,00E+00
1,00E+00
2,00E+00
rotary kiln cement kiln rotary kiln cement kiln rotary kiln cement kiln
sludge ASR solvents
kg
C6H
4C
l2-e
qu
ivale
nts
/ t
on
waste
change of As - COAL
reference
change of As - PETCOKE
reference
change of As - FUEL OIL
reference

106
Sea water toxicity ���� Cd
furnace type transfer coefficient Cd/Cd minimal energy demand
electrical yield
steam yield
rotary kiln 0,0001 1 14,7 0,026 0,131
cement kiln 0,0106 1 21 0 0
fuel type energetic value cadmium content
[MJ/kg] [kg/ton]
coal 29,55 3,40E-03
fuel oil 40,4 2,50E-04
petcoke 33,7 0,00093
waste type energetic value cadmium content functional unit
[MJ/kg] [kg/ton] [ton]
sludge 13,95 0,0053 1
ASR 16,5 0,0348 1
solvents 25,8 0,0015 1
electricity production average emissions Cd
avoided emissions [kg/GJ]
gas 0
coal 0
energetic mixture [BE] 0
steam production average emissions Cd
avioded emissions [kg/GJ]
gas 0
coal 0
energetic mixture [BE] 0
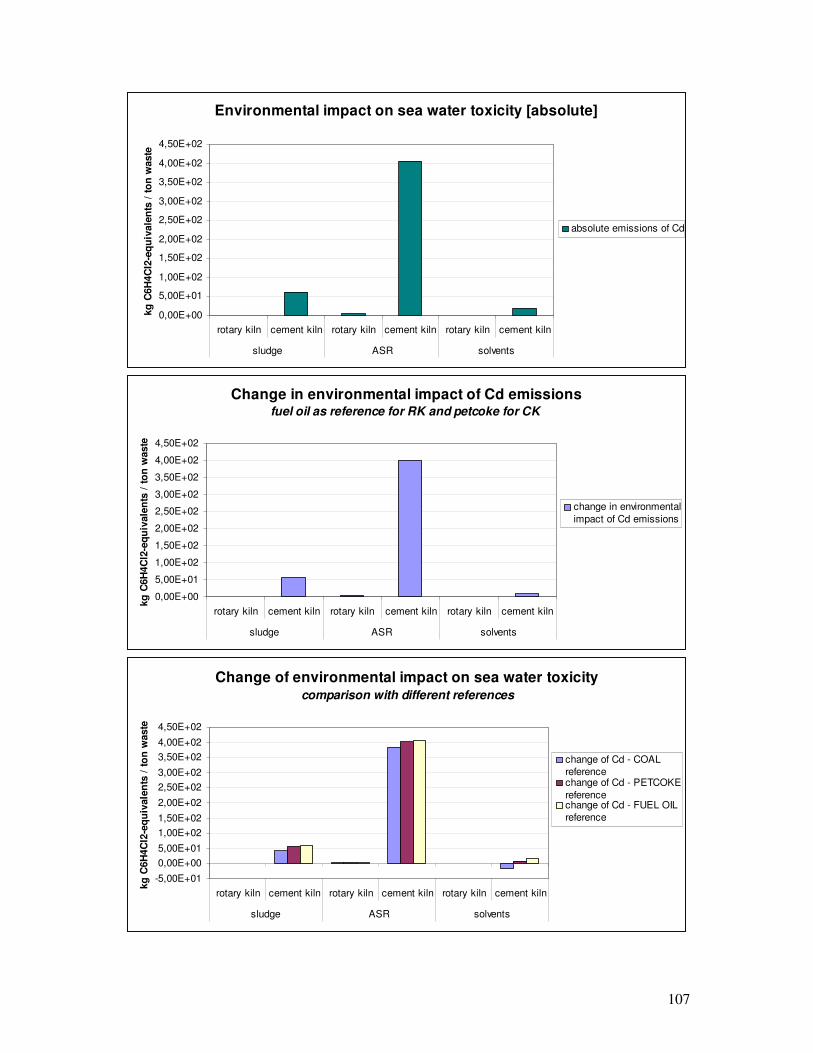
107
Environmental impact on sea water toxicity [absolute]
0,00E+00
5,00E+01
1,00E+02
1,50E+02
2,00E+02
2,50E+02
3,00E+02
3,50E+02
4,00E+02
4,50E+02
rotary kiln cement kiln rotary kiln cement kiln rotary kiln cement kiln
sludge ASR solvents
kg
C6H
4C
l2-e
qu
ivale
nts
/ t
on
waste
absolute emissions of Cd
Change in environmental impact of Cd emissionsfuel oil as reference for RK and petcoke for CK
0,00E+00
5,00E+01
1,00E+02
1,50E+02
2,00E+02
2,50E+02
3,00E+02
3,50E+02
4,00E+02
4,50E+02
rotary kiln cement kiln rotary kiln cement kiln rotary kiln cement kiln
sludge ASR solvents
kg
C6H
4C
l2-e
qu
ivale
nts
/ t
on
waste
change in environmental
impact of Cd emissions
Change of environmental impact on sea water toxicity comparison with different references
-5,00E+01
0,00E+00
5,00E+01
1,00E+02
1,50E+02
2,00E+02
2,50E+02
3,00E+02
3,50E+02
4,00E+02
4,50E+02
rotary kiln cement kiln rotary kiln cement kiln rotary kiln cement kiln
sludge ASR solvents
kg
C6H
4C
l2-e
qu
ivale
nts
/ t
on
waste
change of Cd - COAL
referencechange of Cd - PETCOKE
referencechange of Cd - FUEL OIL
reference

108
Sea water toxicity ���� Cr
furnace type transfer coefficient Cr/Cr
minimal energy demand
electrical yield
steam yield
rotary kiln 5,00E-05 1 14,7 0,026 0,131
cement kiln 0,0002 1 21 0 0
fuel type energetic value chromium content
[MJ/kg] [kg/ton]
coal 29,55 2,52E-02
fuel oil 40,4 1,60E-03
petcoke 33,7 0,0045
waste type energetic value chromium content functional unit
[MJ/kg] [kg/ton] [ton]
sludge 13,95 2,406 1
ASR 16,5 1,204 1
solvents 25,8 0,0093 1
electricity production average emissions Cr
avoided emissions [kg/GJ]
gas 0
coal 0
energetic mixture [BE] 0
steam production average emissions Cr
avioded emissions [kg/GJ]
gas 0
coal 0
energetic mixture [BE] 0
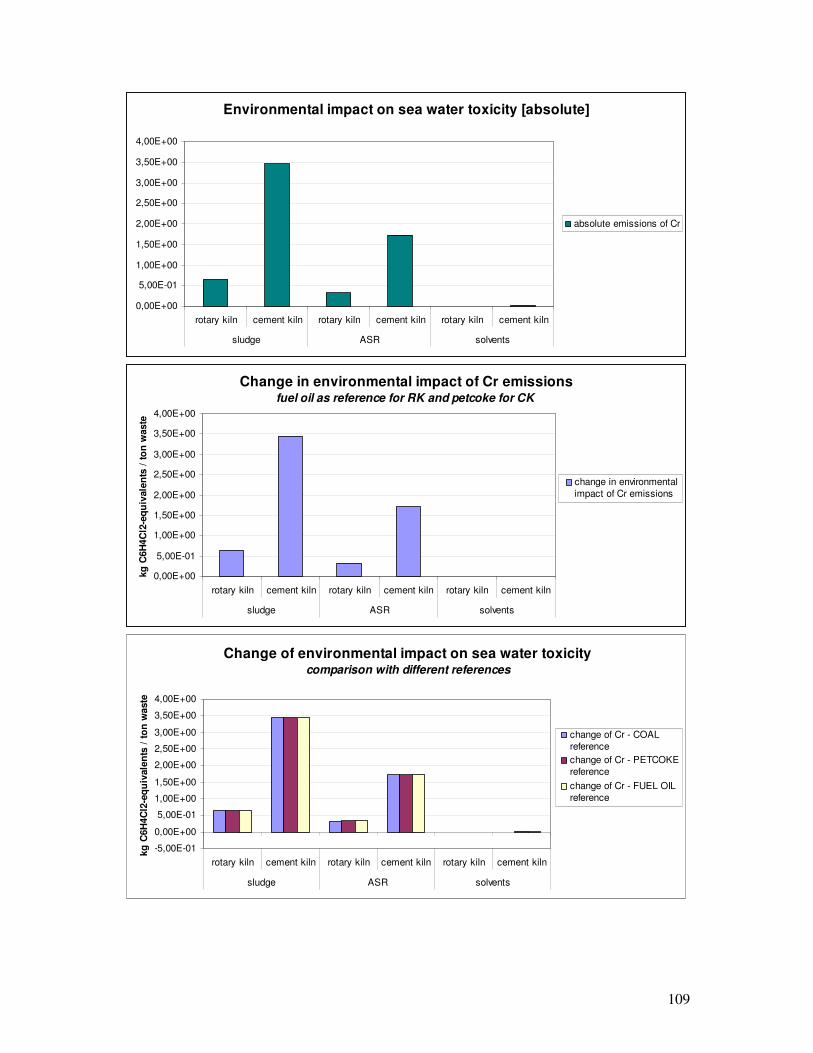
109
Environmental impact on sea water toxicity [absolute]
0,00E+00
5,00E-01
1,00E+00
1,50E+00
2,00E+00
2,50E+00
3,00E+00
3,50E+00
4,00E+00
rotary kiln cement kiln rotary kiln cement kiln rotary kiln cement kiln
sludge ASR solvents
absolute emissions of Cr
Change in environmental impact of Cr emissionsfuel oil as reference for RK and petcoke for CK
0,00E+00
5,00E-01
1,00E+00
1,50E+00
2,00E+00
2,50E+00
3,00E+00
3,50E+00
4,00E+00
rotary kiln cement kiln rotary kiln cement kiln rotary kiln cement kiln
sludge ASR solvents
kg
C6H
4C
l2-e
qu
ivale
nts
/ t
on
waste
change in environmental
impact of Cr emissions
Change of environmental impact on sea water toxicity comparison with different references
-5,00E-01
0,00E+00
5,00E-01
1,00E+00
1,50E+00
2,00E+00
2,50E+00
3,00E+00
3,50E+00
4,00E+00
rotary kiln cement kiln rotary kiln cement kiln rotary kiln cement kiln
sludge ASR solvents
kg
C6H
4C
l2-e
qu
ivale
nts
/ t
on
waste
change of Cr - COAL
reference
change of Cr - PETCOKE
reference
change of Cr - FUEL OIL
reference

110
Sea water toxicity ���� Hg
furnace type transfer coefficient Hg/Hg minimal energy demand
electrical yield
steam yield
rotary kiln 0,0022 1 14,7 0,026 0,131
cement kiln 0,3958 1 21 0 0
fuel type energetic value mercury content
[MJ/kg] [kg/ton]
coal 29,55 3,60E-04
fuel oil 40,4 2,00E-03
petcoke 33,7 0,00013
waste type energetic value mercury content functional unit
[MJ/kg] [kg/ton] [ton]
sludge 13,95 0,003 1
ASR 16,5 0,00469 1
solvents 25,8 0,0003 1
electricity production average emissions Hg
avoided emissions [kg/GJ]
gas 0
coal 0
energetic mixture [BE] 0
steam production average emissions Hg
avioded emissions [kg/GJ]
gas 0
coal 0
energetic mixture [BE] 0
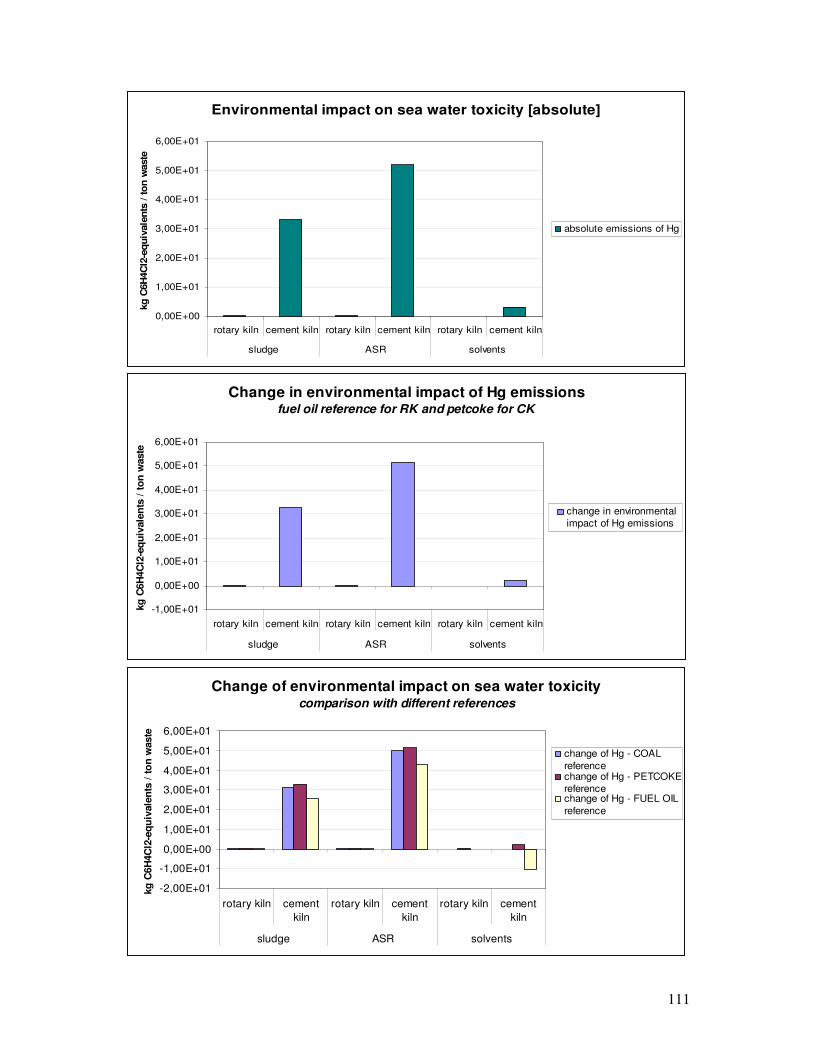
111
Environmental impact on sea water toxicity [absolute]
0,00E+00
1,00E+01
2,00E+01
3,00E+01
4,00E+01
5,00E+01
6,00E+01
rotary kiln cement kiln rotary kiln cement kiln rotary kiln cement kiln
sludge ASR solvents
kg
C6H
4C
l2-e
qu
ivale
nts
/ t
on
waste
absolute emissions of Hg
Change in environmental impact of Hg emissionsfuel oil reference for RK and petcoke for CK
-1,00E+01
0,00E+00
1,00E+01
2,00E+01
3,00E+01
4,00E+01
5,00E+01
6,00E+01
rotary kiln cement kiln rotary kiln cement kiln rotary kiln cement kiln
sludge ASR solvents
kg
C6H
4C
l2-e
qu
ivale
nts
/ t
on
waste
change in environmental
impact of Hg emissions
Change of environmental impact on sea water toxicity comparison with different references
-2,00E+01
-1,00E+01
0,00E+00
1,00E+01
2,00E+01
3,00E+01
4,00E+01
5,00E+01
6,00E+01
rotary kiln cement
kiln
rotary kiln cement
kiln
rotary kiln cement
kiln
sludge ASR solvents
kg
C6H
4C
l2-e
qu
ivale
nts
/ t
on
waste
change of Hg - COAL
referencechange of Hg - PETCOKE
referencechange of Hg - FUEL OIL
reference
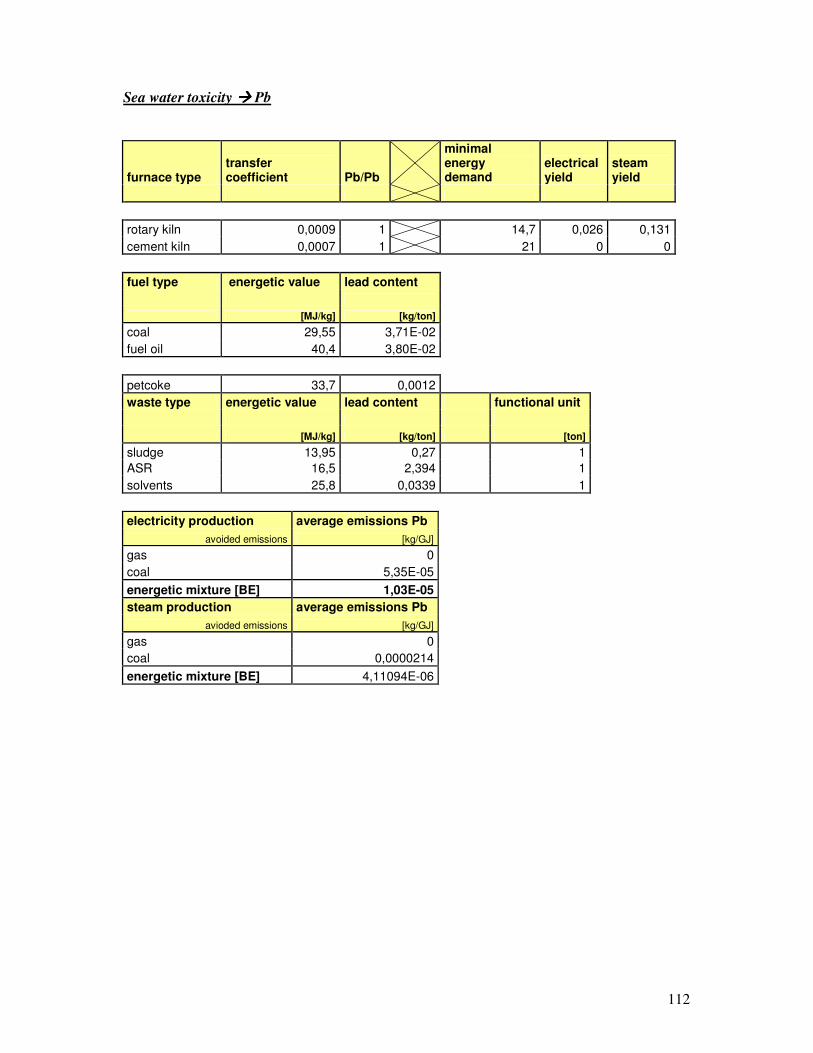
112
Sea water toxicity ���� Pb
furnace type transfer coefficient Pb/Pb
minimal energy demand
electrical yield
steam yield
rotary kiln 0,0009 1 14,7 0,026 0,131
cement kiln 0,0007 1 21 0 0
fuel type energetic value lead content
[MJ/kg] [kg/ton]
coal 29,55 3,71E-02
fuel oil 40,4 3,80E-02
petcoke 33,7 0,0012
waste type energetic value lead content functional unit
[MJ/kg] [kg/ton] [ton]
sludge 13,95 0,27 1
ASR 16,5 2,394 1
solvents 25,8 0,0339 1
electricity production average emissions Pb
avoided emissions [kg/GJ]
gas 0
coal 5,35E-05
energetic mixture [BE] 1,03E-05
steam production average emissions Pb
avioded emissions [kg/GJ]
gas 0
coal 0,0000214
energetic mixture [BE] 4,11094E-06
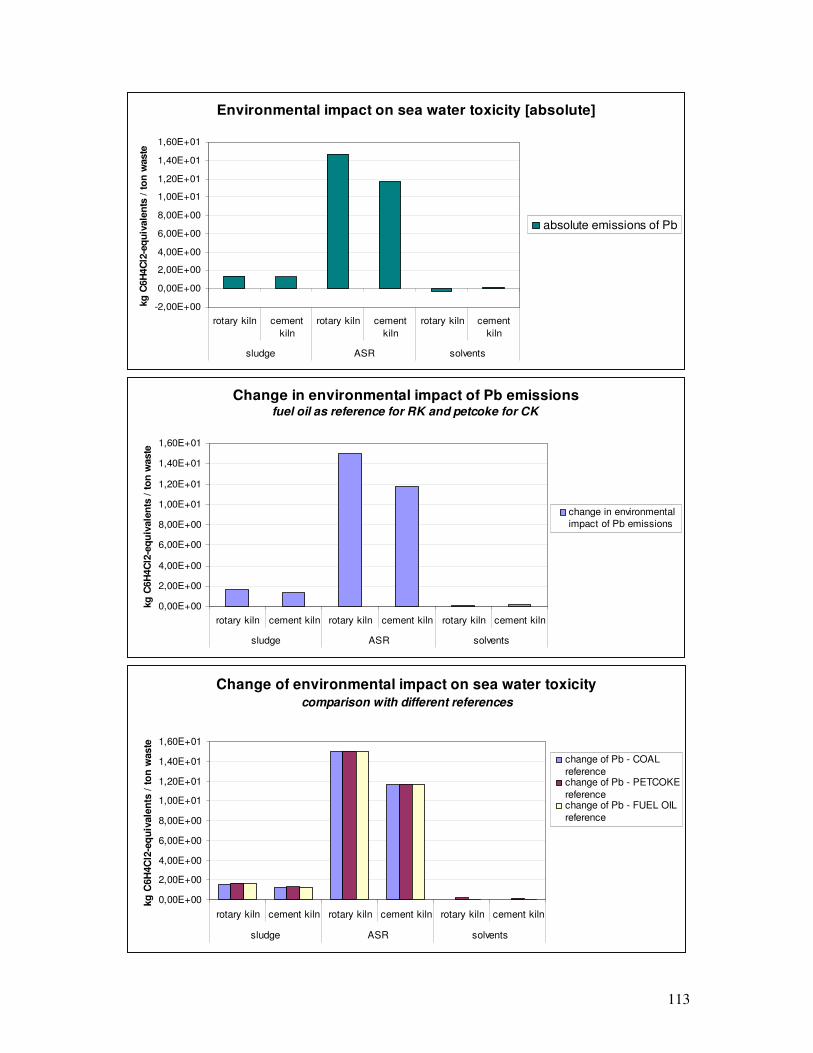
113
Environmental impact on sea water toxicity [absolute]
-2,00E+00
0,00E+00
2,00E+00
4,00E+00
6,00E+00
8,00E+00
1,00E+01
1,20E+01
1,40E+01
1,60E+01
rotary kiln cement
kiln
rotary kiln cement
kiln
rotary kiln cement
kiln
sludge ASR solvents
kg
C6H
4C
l2-e
qu
ivale
nts
/ t
on
waste
absolute emissions of Pb
Change in environmental impact of Pb emissionsfuel oil as reference for RK and petcoke for CK
0,00E+00
2,00E+00
4,00E+00
6,00E+00
8,00E+00
1,00E+01
1,20E+01
1,40E+01
1,60E+01
rotary kiln cement kiln rotary kiln cement kiln rotary kiln cement kiln
sludge ASR solvents
kg
C6H
4C
l2-e
qu
ivale
nts
/ t
on
waste
change in environmental
impact of Pb emissions
Change of environmental impact on sea water toxicity comparison with different references
0,00E+00
2,00E+00
4,00E+00
6,00E+00
8,00E+00
1,00E+01
1,20E+01
1,40E+01
1,60E+01
rotary kiln cement kiln rotary kiln cement kiln rotary kiln cement kiln
sludge ASR solvents
kg
C6H
4C
l2-e
qu
ivale
nts
/ t
on
waste
change of Pb - COAL
referencechange of Pb - PETCOKE
referencechange of Pb - FUEL OIL
reference

114
Sea water toxicity ���� Ni
furnace type transfer coefficient Ni/Ni
minimal energy demand
electrical yield
steam yield
rotary kiln 8,00E-04 1 14,7 0,026 0,131
cement kiln 0,0002 1 21 0 0
fuel type energetic value Nickel content
[MJ/kg] [kg/ton]
coal 29,55 3,32E-02
fuel oil 40,4 2,10E-02
petcoke 33,7 0,167
waste type energetic value Nickel content functional unit
[MJ/kg] [kg/ton] [ton]
sludge 13,95 0,52 1
ASR 16,5 0,7994 1
solvents 25,8 0,0043 1
electricity production average emissions Ni
avoided emissions [kg/GJ]
gas 0
coal 0
energetic mixture [BE] 0
steam production average emissions Ni
avioded emissions [kg/GJ]
gas 0
coal 0
energetic mixture [BE] 0
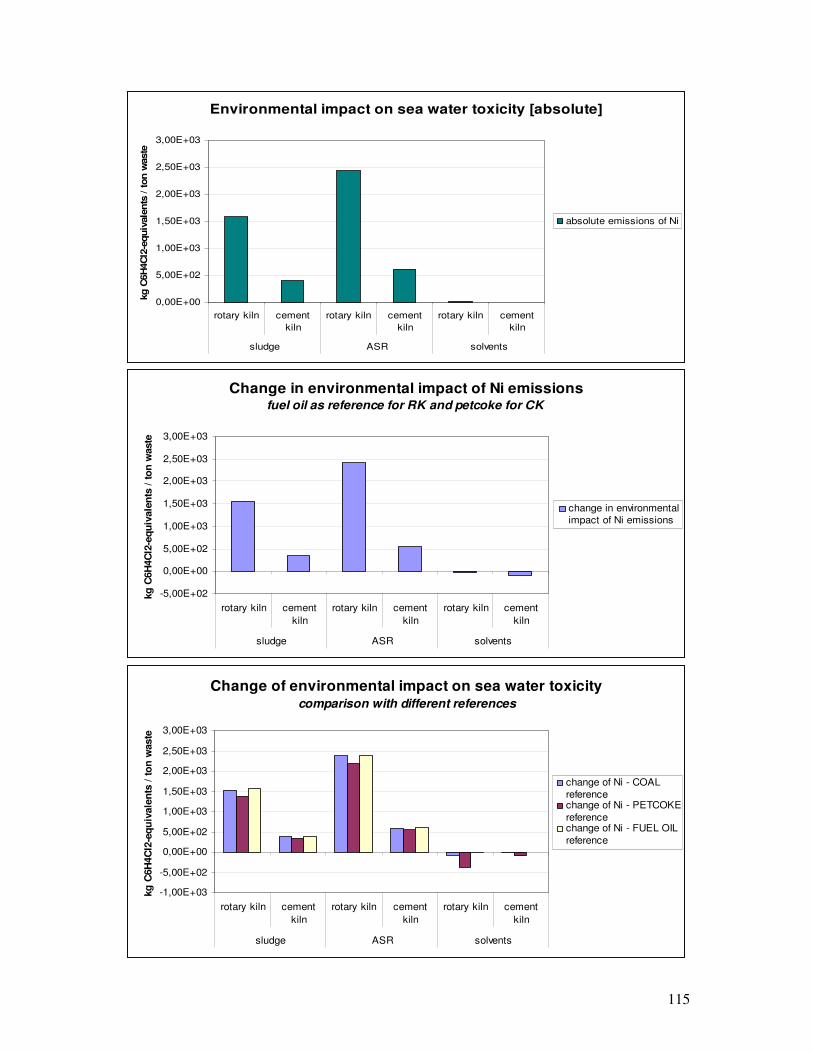
115
Environmental impact on sea water toxicity [absolute]
0,00E+00
5,00E+02
1,00E+03
1,50E+03
2,00E+03
2,50E+03
3,00E+03
rotary kiln cement
kiln
rotary kiln cement
kiln
rotary kiln cement
kiln
sludge ASR solvents
kg
C6H
4C
l2-e
qu
ivale
nts
/ t
on
waste
absolute emissions of Ni
Change in environmental impact of Ni emissionsfuel oil as reference for RK and petcoke for CK
-5,00E+02
0,00E+00
5,00E+02
1,00E+03
1,50E+03
2,00E+03
2,50E+03
3,00E+03
rotary kiln cement
kiln
rotary kiln cement
kiln
rotary kiln cement
kiln
sludge ASR solvents
kg
C6H
4C
l2-e
qu
ivale
nts
/ t
on
waste
change in environmental
impact of Ni emissions
Change of environmental impact on sea water toxicity comparison with different references
-1,00E+03
-5,00E+02
0,00E+00
5,00E+02
1,00E+03
1,50E+03
2,00E+03
2,50E+03
3,00E+03
rotary kiln cement
kiln
rotary kiln cement
kiln
rotary kiln cement
kiln
sludge ASR solvents
kg
C6H
4C
l2-e
qu
ivale
nts
/ t
on
waste
change of Ni - COAL
referencechange of Ni - PETCOKE
referencechange of Ni - FUEL OIL
reference

116
Sea water toxicity ���� Cu
furnace type transfer coefficient Cu/Cu
minimal energy demand
electrical yield
steam yield
rotary kiln 5,00E-04 1 14,7 0,026 0,131
cement kiln 2,00E-04 1 21 0 0
fuel type energetic value cupper content
[MJ/kg] [kg/ton]
coal 29,55 2,00E-02
fuel oil 40,4 4,77E-03
petcoke 33,7 7,41E-02
waste type energetic value cupper content functional unit
[MJ/kg] [kg/ton] [ton]
sludge 13,95 0,913 1
ASR 16,5 0,1855 1
solvents 25,8 5,48E-03 1
electricity production average emissions Cu
avoided emissions [kg/GJ]
gas 0
coal 0
energetic mixture [BE] 0
steam production average emissions Cu
avioded emissions [kg/GJ]
gas 0
coal 0
energetic mixture [BE] 0
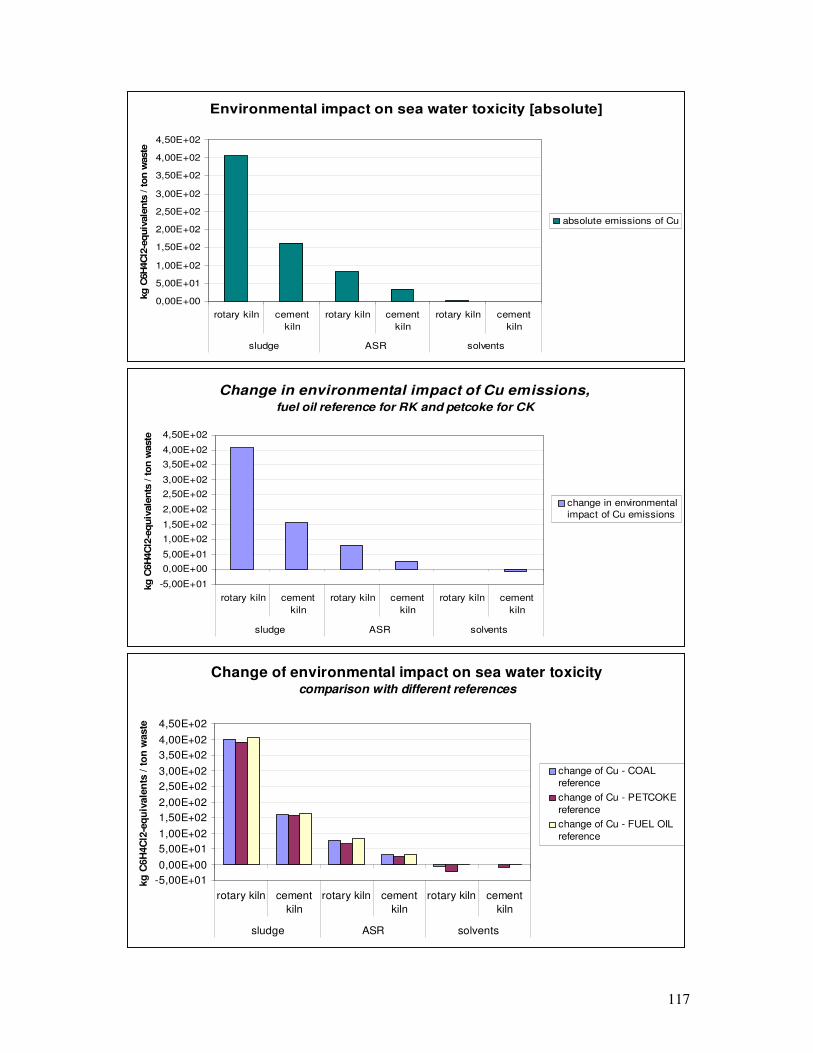
117
Environmental impact on sea water toxicity [absolute]
0,00E+00
5,00E+01
1,00E+02
1,50E+02
2,00E+02
2,50E+02
3,00E+02
3,50E+02
4,00E+02
4,50E+02
rotary kiln cement
kiln
rotary kiln cement
kiln
rotary kiln cement
kiln
sludge ASR solvents
kg
C6H
4C
l2-e
quiv
ale
nts
/ t
on w
aste
absolute emissions of Cu
Change in environmental impact of Cu emissions,fuel oil reference for RK and petcoke for CK
-5,00E+01
0,00E+00
5,00E+01
1,00E+02
1,50E+02
2,00E+02
2,50E+02
3,00E+02
3,50E+02
4,00E+02
4,50E+02
rotary kiln cement
kiln
rotary kiln cement
kiln
rotary kiln cement
kiln
sludge ASR solvents
kg
C6H
4C
l2-e
qu
ivale
nts
/ t
on
waste
change in environmental
impact of Cu emissions
Change of environmental impact on sea water toxicity comparison with different references
-5,00E+01
0,00E+00
5,00E+01
1,00E+02
1,50E+02
2,00E+02
2,50E+02
3,00E+02
3,50E+02
4,00E+02
4,50E+02
rotary kiln cement
kiln
rotary kiln cement
kiln
rotary kiln cement
kiln
sludge ASR solvents
kg
C6H
4C
l2-e
qu
ivale
nts
/ t
on
waste
change of Cu - COAL
reference
change of Cu - PETCOKE
reference
change of Cu - FUEL OIL
reference

118
Sea water toxicity ���� Zn
furnace type transfer coefficient Zn/Zn
minimal energy demand
electrical yield
steam yield
rotary kiln 0,0007 1 14,7 0,026 0,131
cement kiln 0,0017 1 21 0 0
fuel type energetic value Zinck content
[MJ/kg] [kg/ton]
coal 29,55 6,18E-02
fuel oil 40,4 7,73E-03
petcoke 33,7 1,31E+00
waste type energetic value Zinck content functional unit
[MJ/kg] [kg/ton] [ton]
sludge 13,95 1,758 1
ASR 16,5 11,09 1
solvents 25,8 1,57E-01 1
electricity production average emissions Zn
avoided emissions [kg/GJ]
gas 0
coal 1,35E-04
energetic mixture [BE] 2,59335E-05
steam production average emissions Zn
avioded emissions [kg/GJ]
gas 0
coal 0,000054
energetic mixture [BE] 1,03734E-05
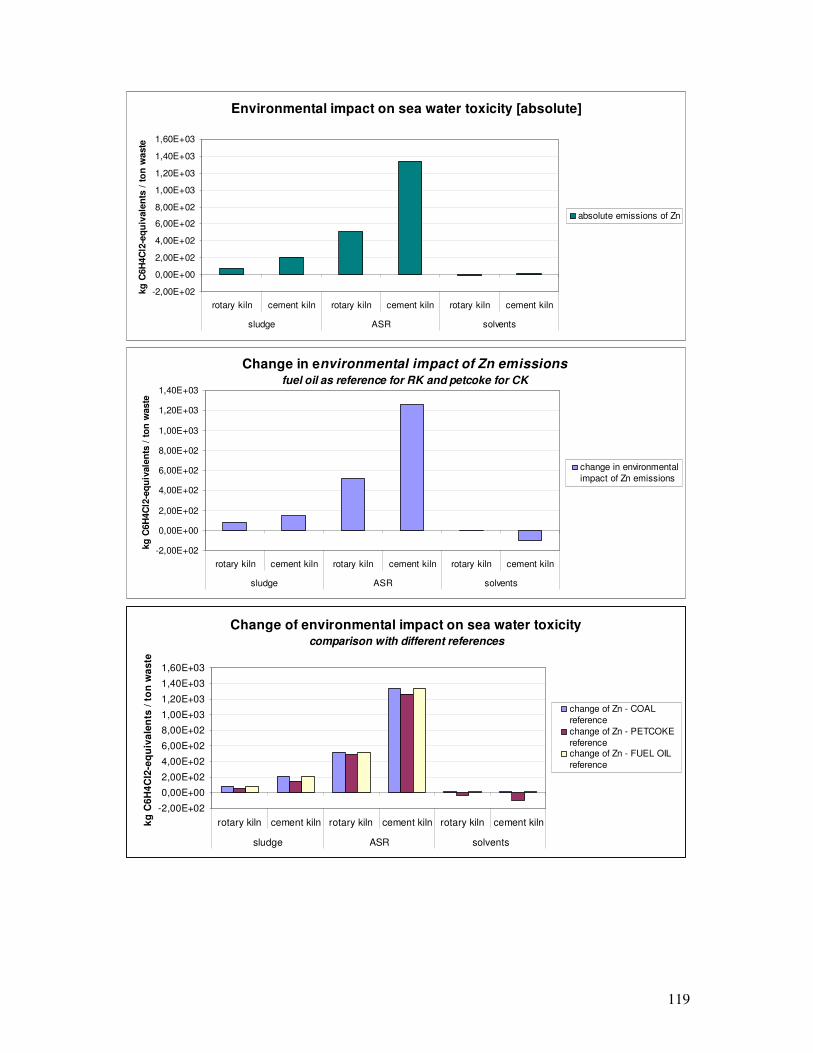
119
Environmental impact on sea water toxicity [absolute]
-2,00E+02
0,00E+00
2,00E+02
4,00E+02
6,00E+02
8,00E+02
1,00E+03
1,20E+03
1,40E+03
1,60E+03
rotary kiln cement kiln rotary kiln cement kiln rotary kiln cement kiln
sludge ASR solvents
kg
C6H
4C
l2-e
qu
ivale
nts
/ t
on
waste
absolute emissions of Zn
Change in environmental impact of Zn emissionsfuel oil as reference for RK and petcoke for CK
-2,00E+02
0,00E+00
2,00E+02
4,00E+02
6,00E+02
8,00E+02
1,00E+03
1,20E+03
1,40E+03
rotary kiln cement kiln rotary kiln cement kiln rotary kiln cement kiln
sludge ASR solvents
kg
C6H
4C
l2-e
qu
ivale
nts
/ t
on
waste
change in environmental
impact of Zn emissions
Change of environmental impact on sea water toxicity comparison with different references
-2,00E+02
0,00E+00
2,00E+02
4,00E+02
6,00E+02
8,00E+02
1,00E+03
1,20E+03
1,40E+03
1,60E+03
rotary kiln cement kiln rotary kiln cement kiln rotary kiln cement kiln
sludge ASR solvents
kg
C6
H4
Cl2
-eq
uiv
ale
nts
/ t
on
wa
ste
change of Zn - COAL
reference
change of Zn - PETCOKE
referencechange of Zn - FUEL OIL
reference
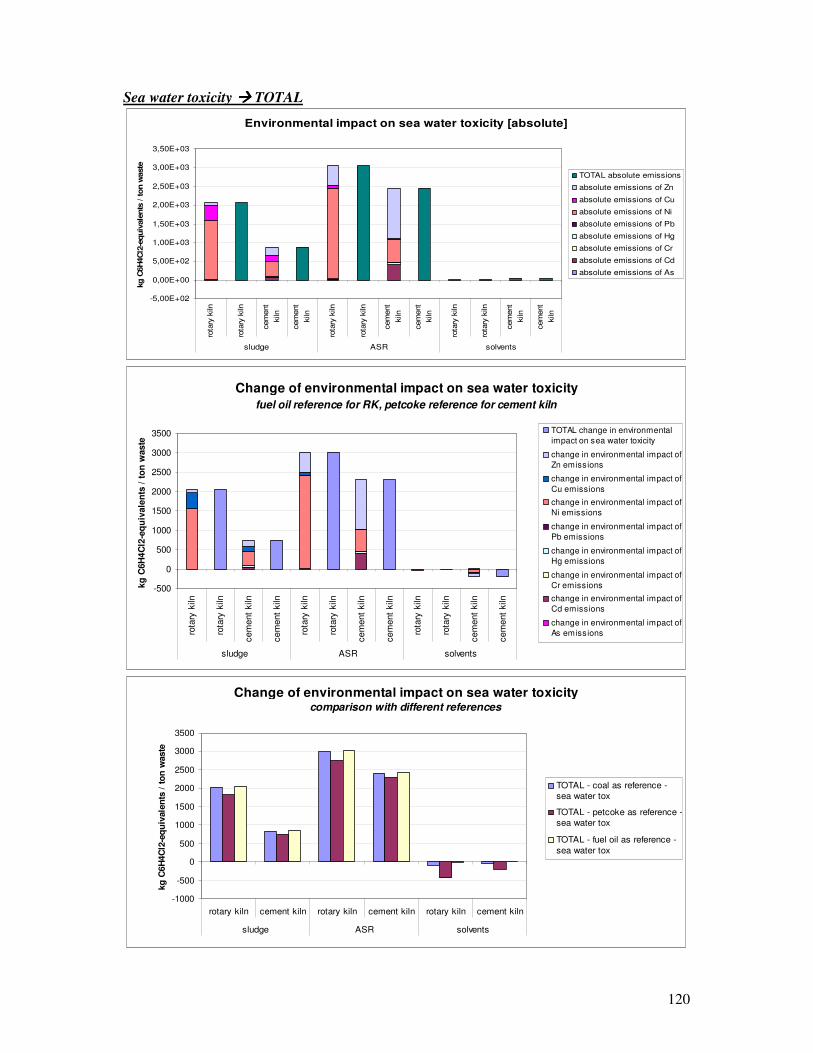
120
Sea water toxicity ���� TOTAL
Environmental impact on sea water toxicity [absolute]
-5,00E+02
0,00E+00
5,00E+02
1,00E+03
1,50E+03
2,00E+03
2,50E+03
3,00E+03
3,50E+03
rota
ry k
iln
rota
ry k
iln
cem
ent
kiln
cem
ent
kiln
rota
ry k
iln
rota
ry k
iln
cem
ent
kiln
cem
ent
kiln
rota
ry k
iln
rota
ry k
iln
cem
ent
kiln
cem
ent
kiln
sludge ASR solvents
kg C
6H
4C
l2-e
quiv
ale
nts
/ ton w
aste
TOTAL absolute emissions
absolute emissions of Zn
absolute emissions of Cu
absolute emissions of Ni
absolute emissions of Pb
absolute emissions of Hg
absolute emissions of Cr
absolute emissions of Cd
absolute emissions of As
Change of environmental impact on sea water toxicity
fuel oil reference for RK, petcoke reference for cement kiln
-500
0
500
1000
1500
2000
2500
3000
3500
rota
ry k
iln
rota
ry k
iln
cem
ent
kiln
cem
ent
kiln
rota
ry k
iln
rota
ry k
iln
cem
ent
kiln
cem
ent
kiln
rota
ry k
iln
rota
ry k
iln
cem
ent
kiln
cem
ent
kiln
sludge ASR solvents
kg
C6H
4C
l2-e
qu
ivale
nts
/ t
on
waste
TOTAL change in environmental
impact on sea water toxicity
change in environmental impact of
Zn emissions
change in environmental impact of
Cu emissions
change in environmental impact of
Ni emissions
change in environmental impact of
Pb emissions
change in environmental impact of
Hg emissions
change in environmental impact of
Cr emissions
change in environmental impact of
Cd emissions
change in environmental impact of
As emissions
Change of environmental impact on sea water toxicity comparison with different references
-1000
-500
0
500
1000
1500
2000
2500
3000
3500
rotary kiln cement kiln rotary kiln cement kiln rotary kiln cement kiln
sludge ASR solvents
kg
C6H
4C
l2-e
qu
ivale
nts
/ t
on
waste
TOTAL - coal as reference -
sea water tox
TOTAL - petcoke as reference -
sea water tox
TOTAL - fuel oil as reference -
sea water tox

121
Terrestrial toxicity ���� As
furnace type transfer coefficient As/As minimal energy demand
electrical yield
steam yield
rotary kiln 0,0002 1 14,7 0,026 0,131
cement kiln 0,0002 1 21 0 0
fuel type energetic value arsenic content
[MJ/kg] [kg/ton]
coal 29,55 1,62E-01
fuel oil 40,4 3,00E-04
petcoke 33,7 0,0009
waste type energetic value arsenic content functional unit
[MJ/kg] [kg/ton] [ton]
sludge 13,95 0,0058 1
ASR 16,5 0,0325 1
solvents 25,8 0,00245 1
electricity production average emissions As
avoided emissions [kg/GJ]
gas 0
coal 0
energetic mixture [BE] 0
steam production average emissions As
avioded emissions [kg/GJ]
gas 0
coal 0
energetic mixture [BE] 0
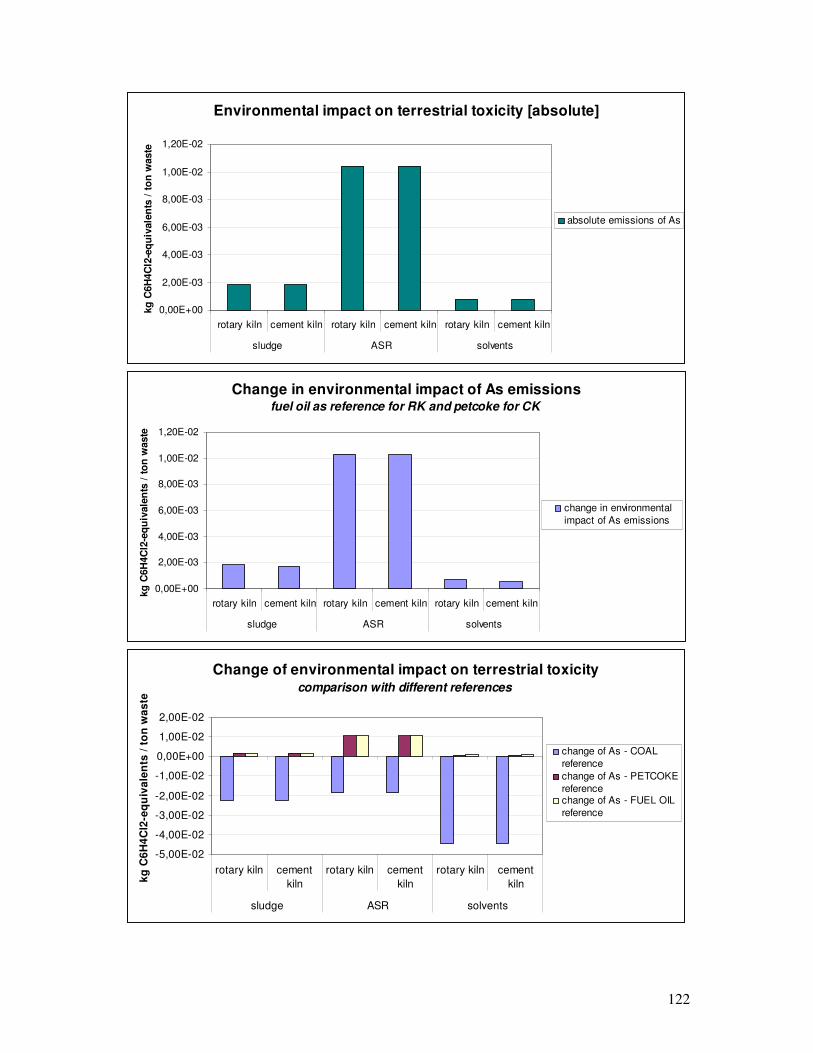
122
Environmental impact on terrestrial toxicity [absolute]
0,00E+00
2,00E-03
4,00E-03
6,00E-03
8,00E-03
1,00E-02
1,20E-02
rotary kiln cement kiln rotary kiln cement kiln rotary kiln cement kiln
sludge ASR solvents
kg
C6H
4C
l2-e
qu
ivale
nts
/ t
on
waste
absolute emissions of As
Change in environmental impact of As emissionsfuel oil as reference for RK and petcoke for CK
0,00E+00
2,00E-03
4,00E-03
6,00E-03
8,00E-03
1,00E-02
1,20E-02
rotary kiln cement kiln rotary kiln cement kiln rotary kiln cement kiln
sludge ASR solvents
kg
C6H
4C
l2-e
qu
ivale
nts
/ t
on
waste
change in environmental
impact of As emissions
Change of environmental impact on terrestrial toxicitycomparison with different references
-5,00E-02
-4,00E-02
-3,00E-02
-2,00E-02
-1,00E-02
0,00E+00
1,00E-02
2,00E-02
rotary kiln cement
kiln
rotary kiln cement
kiln
rotary kiln cement
kiln
sludge ASR solvents
kg
C6
H4
Cl2
-eq
uiv
ale
nts
/ t
on
wa
ste
change of As - COAL
reference
change of As - PETCOKE
referencechange of As - FUEL OIL
reference

123
Terrestrial toxicity ���� Cd
furnace type transfer coefficient Cd/Cd minimal energy demand
electrical yield
steam yield
rotary kiln 0,0001 1 14,7 0,026 0,131
cement kiln 0,0106 1 21 0 0
fuel type energetic value cadmium content
[MJ/kg] [kg/ton]
coal 29,55 3,40E-03
fuel oil 40,4 2,50E-04
petcoke 33,7 0,00093
waste type energetic value cadmium content functional unit
[MJ/kg] [kg/ton] [ton]
sludge 13,95 0,0053 1
ASR 16,5 0,0348 1
solvents 25,8 0,0015 1
electricity production average emissions Cd
avoided emissions [kg/GJ]
gas 0
coal 0
energetic mixture [BE] 0
steam production average emissions Cd
avioded emissions [kg/GJ]
gas 0
coal 0
energetic mixture [BE] 0
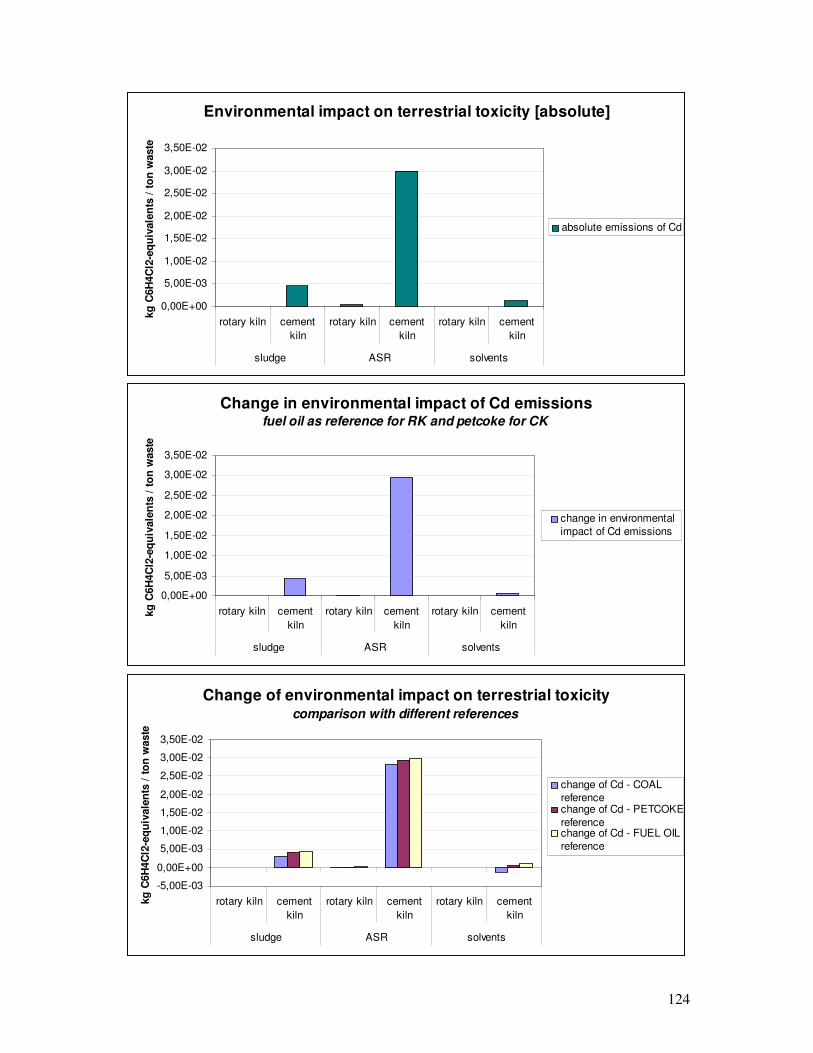
124
Environmental impact on terrestrial toxicity [absolute]
0,00E+00
5,00E-03
1,00E-02
1,50E-02
2,00E-02
2,50E-02
3,00E-02
3,50E-02
rotary kiln cement
kiln
rotary kiln cement
kiln
rotary kiln cement
kiln
sludge ASR solvents
kg
C6H
4C
l2-e
qu
ivale
nts
/ t
on
waste
absolute emissions of Cd
Change in environmental impact of Cd emissionsfuel oil as reference for RK and petcoke for CK
0,00E+00
5,00E-03
1,00E-02
1,50E-02
2,00E-02
2,50E-02
3,00E-02
3,50E-02
rotary kiln cement
kiln
rotary kiln cement
kiln
rotary kiln cement
kiln
sludge ASR solvents
kg
C6H
4C
l2-e
qu
ivale
nts
/ t
on
waste
change in environmental
impact of Cd emissions
Change of environmental impact on terrestrial toxicity comparison with different references
-5,00E-03
0,00E+00
5,00E-03
1,00E-02
1,50E-02
2,00E-02
2,50E-02
3,00E-02
3,50E-02
rotary kiln cement
kiln
rotary kiln cement
kiln
rotary kiln cement
kiln
sludge ASR solvents
kg
C6H
4C
l2-e
qu
ivale
nts
/ t
on
waste
change of Cd - COAL
referencechange of Cd - PETCOKE
referencechange of Cd - FUEL OIL
reference
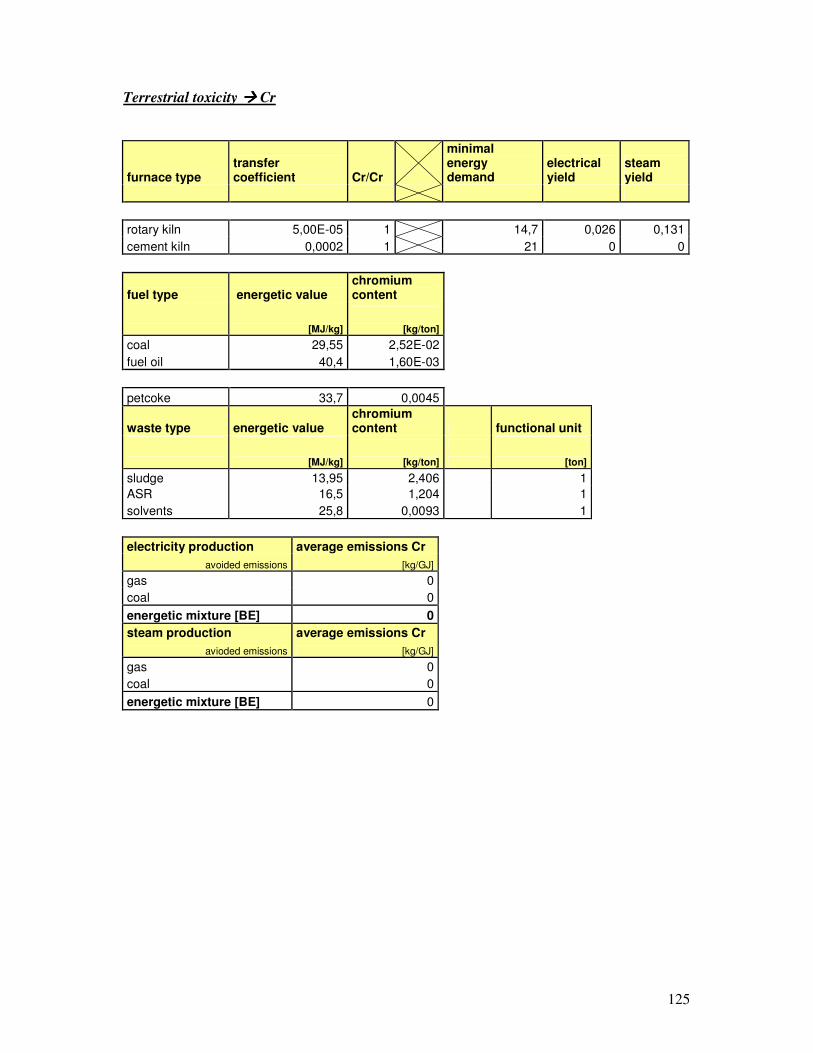
125
Terrestrial toxicity ���� Cr
furnace type transfer coefficient Cr/Cr
minimal energy demand
electrical yield
steam yield
rotary kiln 5,00E-05 1 14,7 0,026 0,131
cement kiln 0,0002 1 21 0 0
fuel type energetic value chromium content
[MJ/kg] [kg/ton]
coal 29,55 2,52E-02
fuel oil 40,4 1,60E-03
petcoke 33,7 0,0045
waste type energetic value chromium content functional unit
[MJ/kg] [kg/ton] [ton]
sludge 13,95 2,406 1
ASR 16,5 1,204 1
solvents 25,8 0,0093 1
electricity production average emissions Cr
avoided emissions [kg/GJ]
gas 0
coal 0
energetic mixture [BE] 0
steam production average emissions Cr
avioded emissions [kg/GJ]
gas 0
coal 0
energetic mixture [BE] 0
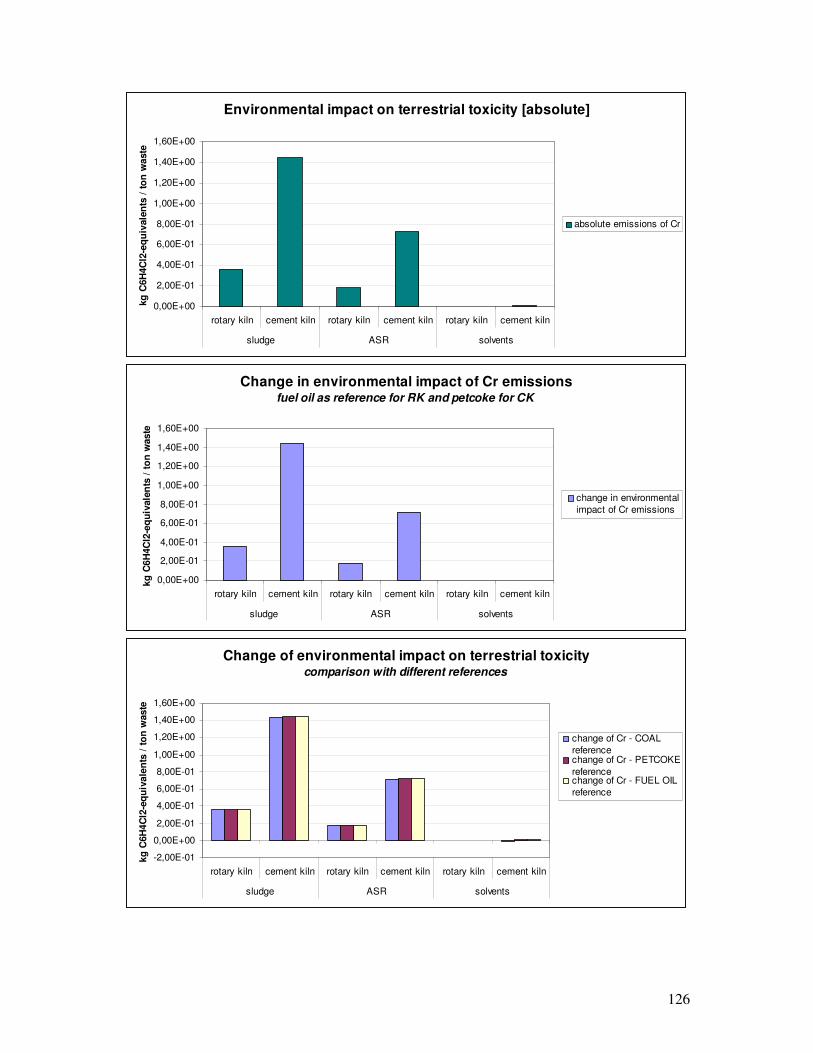
126
Environmental impact on terrestrial toxicity [absolute]
0,00E+00
2,00E-01
4,00E-01
6,00E-01
8,00E-01
1,00E+00
1,20E+00
1,40E+00
1,60E+00
rotary kiln cement kiln rotary kiln cement kiln rotary kiln cement kiln
sludge ASR solvents
kg
C6H
4C
l2-e
qu
ivale
nts
/ t
on
waste
absolute emissions of Cr
Change in environmental impact of Cr emissionsfuel oil as reference for RK and petcoke for CK
0,00E+00
2,00E-01
4,00E-01
6,00E-01
8,00E-01
1,00E+00
1,20E+00
1,40E+00
1,60E+00
rotary kiln cement kiln rotary kiln cement kiln rotary kiln cement kiln
sludge ASR solvents
kg
C6H
4C
l2-e
qu
ivale
nts
/ t
on
waste
change in environmental
impact of Cr emissions
Change of environmental impact on terrestrial toxicity comparison with different references
-2,00E-01
0,00E+00
2,00E-01
4,00E-01
6,00E-01
8,00E-01
1,00E+00
1,20E+00
1,40E+00
1,60E+00
rotary kiln cement kiln rotary kiln cement kiln rotary kiln cement kiln
sludge ASR solvents
kg
C6H
4C
l2-e
qu
ivale
nts
/ t
on
waste
change of Cr - COAL
referencechange of Cr - PETCOKE
referencechange of Cr - FUEL OIL
reference

127
Terrestrial toxicity ���� Hg
furnace type transfer coefficient Hg/Hg minimal energy demand
electrical yield
steam yield
rotary kiln 0,0022 1 14,7 0,026 0,131
cement kiln 0,3958 1 21 0 0
fuel type energetic value mercury content
[MJ/kg] [kg/ton]
coal 29,55 3,60E-04
fuel oil 40,4 2,00E-03
petcoke 33,7 0,00013
waste type energetic value mercury content functional unit
[MJ/kg] [kg/ton] [ton]
sludge 13,95 0,003 1
ASR 16,5 0,00469 1
solvents 25,8 0,0003 1
electricity production average emissions Hg
avoided emissions [kg/GJ]
gas 0
coal 0
energetic mixture [BE] 0
steam production average emissions Hg
avioded emissions [kg/GJ]
gas 0
coal 0
energetic mixture [BE] 0
Characterisation factor of mercury on terrestrial toxicity is 0.

128
Terrestrial toxicity ���� Pb
furnace type transfer coefficient Pb/Pb
minimal energy demand
electrical yield
steam yield
rotary kiln 0,0009 1 14,7 0,026 0,131
cement kiln 0,0007 1 21 0 0
fuel type energetic value lead content
[MJ/kg] [kg/ton]
coal 29,55 3,71E-02
fuel oil 40,4 3,80E-02
petcoke 33,7 0,0012
waste type energetic value lead content functional unit
[MJ/kg] [kg/ton] [ton]
sludge 13,95 0,27 1
ASR 16,5 2,394 1
solvents 25,8 0,0339 1
electricity production average emissions Pb
avoided emissions [kg/GJ]
gas 0
coal 5,35E-05
energetic mixture [BE] 1,03E-05
steam production average emissions Pb
avioded emissions [kg/GJ]
gas 0
coal 0,0000214
energetic mixture [BE] 4,11094E-06
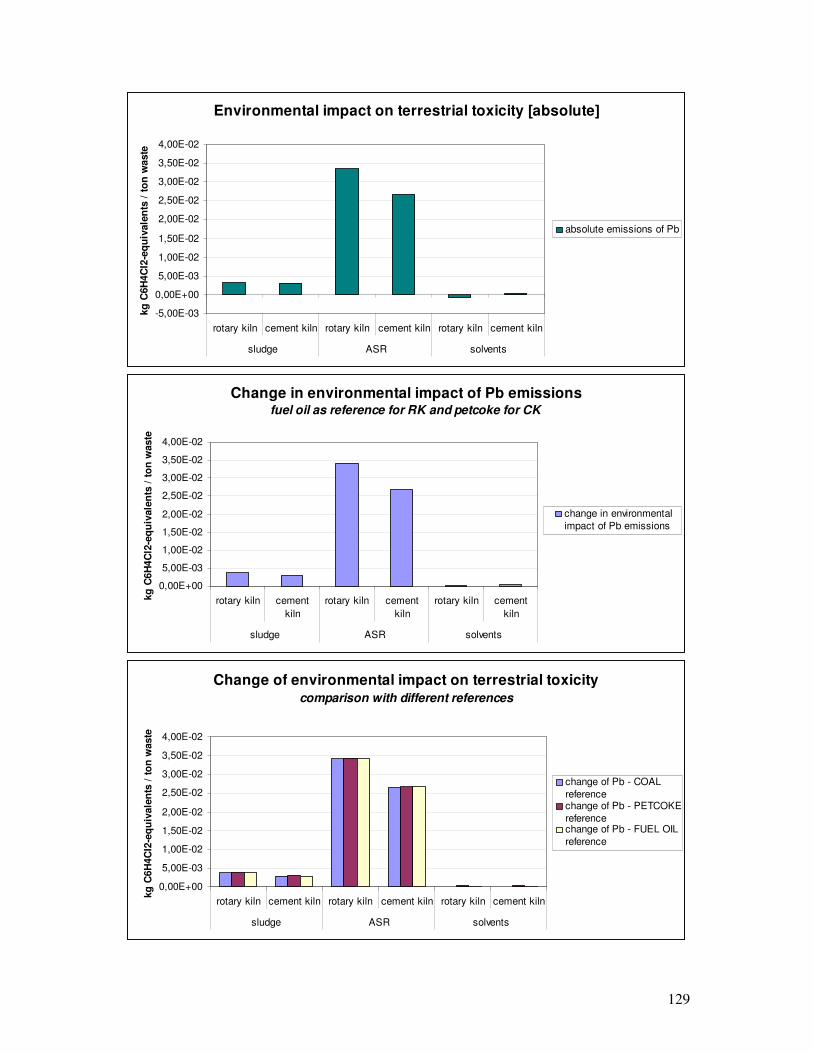
129
Environmental impact on terrestrial toxicity [absolute]
-5,00E-03
0,00E+00
5,00E-03
1,00E-02
1,50E-02
2,00E-02
2,50E-02
3,00E-02
3,50E-02
4,00E-02
rotary kiln cement kiln rotary kiln cement kiln rotary kiln cement kiln
sludge ASR solvents
kg
C6H
4C
l2-e
qu
ivale
nts
/ t
on
waste
absolute emissions of Pb
Change in environmental impact of Pb emissionsfuel oil as reference for RK and petcoke for CK
0,00E+00
5,00E-03
1,00E-02
1,50E-02
2,00E-02
2,50E-02
3,00E-02
3,50E-02
4,00E-02
rotary kiln cement
kiln
rotary kiln cement
kiln
rotary kiln cement
kiln
sludge ASR solvents
kg
C6H
4C
l2-e
qu
ivale
nts
/ t
on
waste
change in environmental
impact of Pb emissions
Change of environmental impact on terrestrial toxicity comparison with different references
0,00E+00
5,00E-03
1,00E-02
1,50E-02
2,00E-02
2,50E-02
3,00E-02
3,50E-02
4,00E-02
rotary kiln cement kiln rotary kiln cement kiln rotary kiln cement kiln
sludge ASR solvents
kg
C6H
4C
l2-e
qu
ivale
nts
/ t
on
waste
change of Pb - COAL
referencechange of Pb - PETCOKE
referencechange of Pb - FUEL OIL
reference
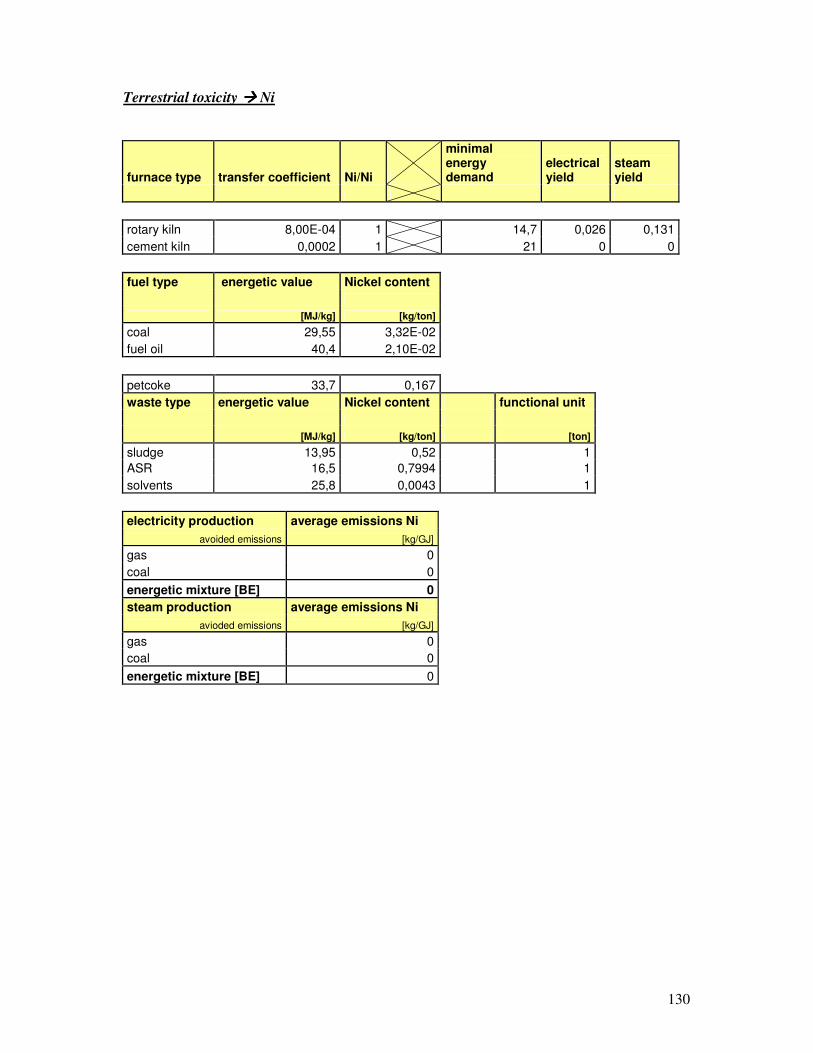
130
Terrestrial toxicity ���� Ni
furnace type transfer coefficient Ni/Ni
minimal energy demand
electrical yield
steam yield
rotary kiln 8,00E-04 1 14,7 0,026 0,131
cement kiln 0,0002 1 21 0 0
fuel type energetic value Nickel content
[MJ/kg] [kg/ton]
coal 29,55 3,32E-02
fuel oil 40,4 2,10E-02
petcoke 33,7 0,167
waste type energetic value Nickel content functional unit
[MJ/kg] [kg/ton] [ton]
sludge 13,95 0,52 1
ASR 16,5 0,7994 1
solvents 25,8 0,0043 1
electricity production average emissions Ni
avoided emissions [kg/GJ]
gas 0
coal 0
energetic mixture [BE] 0
steam production average emissions Ni
avioded emissions [kg/GJ]
gas 0
coal 0
energetic mixture [BE] 0
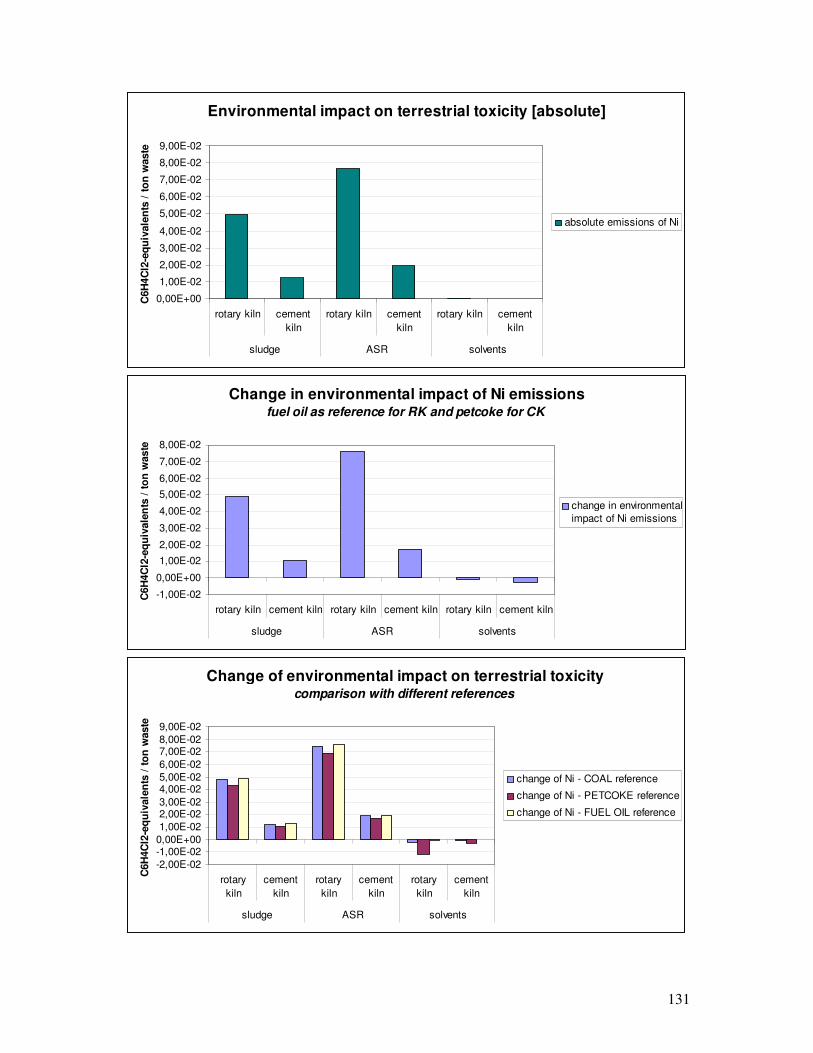
131
Environmental impact on terrestrial toxicity [absolute]
0,00E+00
1,00E-02
2,00E-02
3,00E-02
4,00E-02
5,00E-02
6,00E-02
7,00E-02
8,00E-02
9,00E-02
rotary kiln cement
kiln
rotary kiln cement
kiln
rotary kiln cement
kiln
sludge ASR solvents
C6H
4C
l2-e
qu
ivale
nts
/ t
on
waste
absolute emissions of Ni
Change in environmental impact of Ni emissionsfuel oil as reference for RK and petcoke for CK
-1,00E-02
0,00E+00
1,00E-02
2,00E-02
3,00E-02
4,00E-02
5,00E-02
6,00E-02
7,00E-02
8,00E-02
rotary kiln cement kiln rotary kiln cement kiln rotary kiln cement kiln
sludge ASR solvents
C6H
4C
l2-e
qu
ivale
nts
/ t
on
waste
change in environmental
impact of Ni emissions
Change of environmental impact on terrestrial toxicity comparison with different references
-2,00E-02
-1,00E-020,00E+00
1,00E-02
2,00E-023,00E-02
4,00E-025,00E-02
6,00E-02
7,00E-028,00E-02
9,00E-02
rotary
kiln
cement
kiln
rotary
kiln
cement
kiln
rotary
kiln
cement
kiln
sludge ASR solvents
C6H
4C
l2-e
qu
ivale
nts
/ t
on
waste
change of Ni - COAL reference
change of Ni - PETCOKE reference
change of Ni - FUEL OIL reference

132
Terrestrial toxicity ���� Cu
furnace type transfer coefficient Cu/Cu
minimal energy demand
electrical yield
steam yield
rotary kiln 5,00E-04 1 14,7 0,026 0,131
cement kiln 2,00E-04 1 21 0 0
fuel type energetic value cupper content
[MJ/kg] [kg/ton]
coal 29,55 2,00E-02
fuel oil 40,4 4,77E-03
petcoke 33,7 7,41E-02
waste type energetic value cupper content functional unit
[MJ/kg] [kg/ton] [ton]
sludge 13,95 0,913 1
ASR 16,5 0,1855 1
solvents 25,8 5,48E-03 1
electricity production average emissions Cu
avoided emissions [kg/GJ]
gas 0
coal 0
energetic mixture [BE] 0
steam production average emissions Cu
avioded emissions [kg/GJ]
gas 0
coal 0
energetic mixture [BE] 0
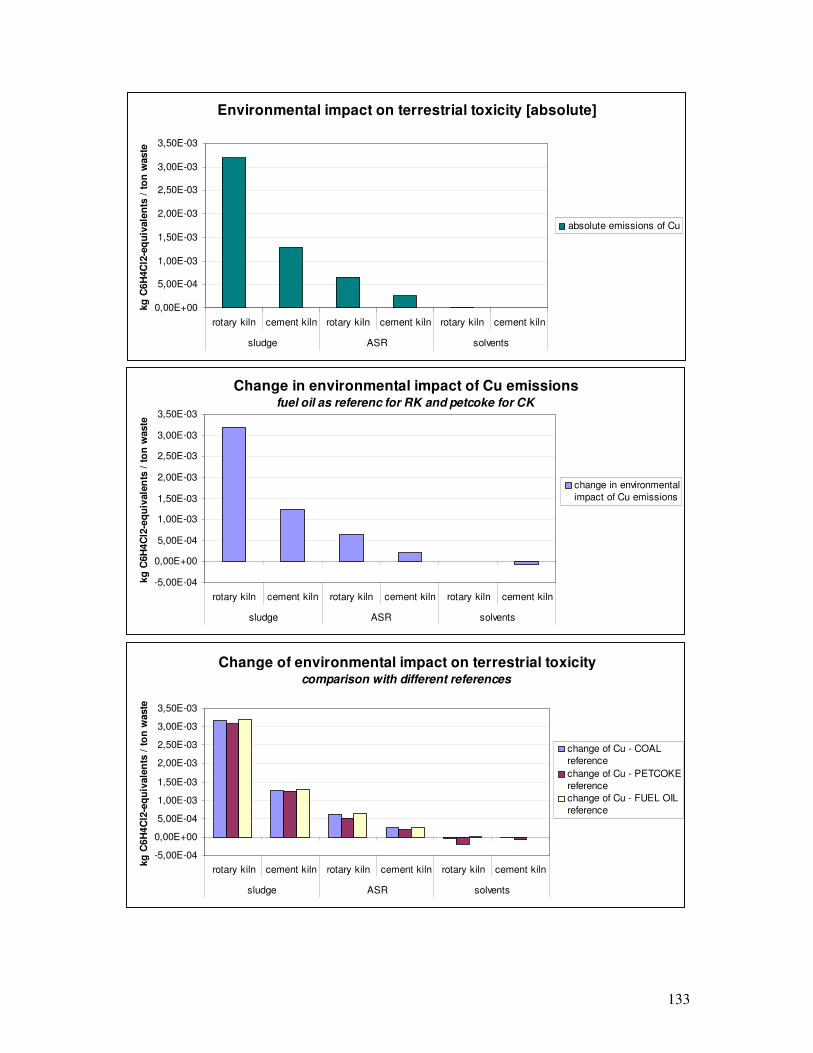
133
Environmental impact on terrestrial toxicity [absolute]
0,00E+00
5,00E-04
1,00E-03
1,50E-03
2,00E-03
2,50E-03
3,00E-03
3,50E-03
rotary kiln cement kiln rotary kiln cement kiln rotary kiln cement kiln
sludge ASR solvents
kg
C6H
4C
l2-e
qu
ivale
nts
/ t
on
waste
absolute emissions of Cu
Change in environmental impact of Cu emissionsfuel oil as referenc for RK and petcoke for CK
-5,00E-04
0,00E+00
5,00E-04
1,00E-03
1,50E-03
2,00E-03
2,50E-03
3,00E-03
3,50E-03
rotary kiln cement kiln rotary kiln cement kiln rotary kiln cement kiln
sludge ASR solvents
kg
C6H
4C
l2-e
qu
ivale
nts
/ t
on
waste
change in environmental
impact of Cu emissions
Change of environmental impact on terrestrial toxicity comparison with different references
-5,00E-04
0,00E+00
5,00E-04
1,00E-03
1,50E-03
2,00E-03
2,50E-03
3,00E-03
3,50E-03
rotary kiln cement kiln rotary kiln cement kiln rotary kiln cement kiln
sludge ASR solvents
kg
C6H
4C
l2-e
qu
ivale
nts
/ t
on
waste
change of Cu - COAL
reference
change of Cu - PETCOKE
reference
change of Cu - FUEL OIL
reference

134
Terrestrial toxicity ���� Zn
furnace type transfer coefficient Zn/Zn
minimal energy demand
electrical yield
steam yield
rotary kiln 0,0007 1 14,7 0,026 0,131
cement kiln 0,0017 1 21 0 0
fuel type energetic value Zinck content
[MJ/kg] [kg/ton]
coal 29,55 6,18E-02
fuel oil 40,4 7,73E-03
petcoke 33,7 1,31E+00
waste type energetic value Zinck content functional unit
[MJ/kg] [kg/ton] [ton]
sludge 13,95 1,758 1
ASR 16,5 11,09 1
solvents 25,8 1,57E-01 1
electricity production average emissions Zn
avoided emissions [kg/GJ]
gas 0
coal 1,35E-04
energetic mixture [BE] 2,59335E-05
steam production average emissions Zn
avioded emissions [kg/GJ]
gas 0
coal 0,000054
energetic mixture [BE] 1,03734E-05
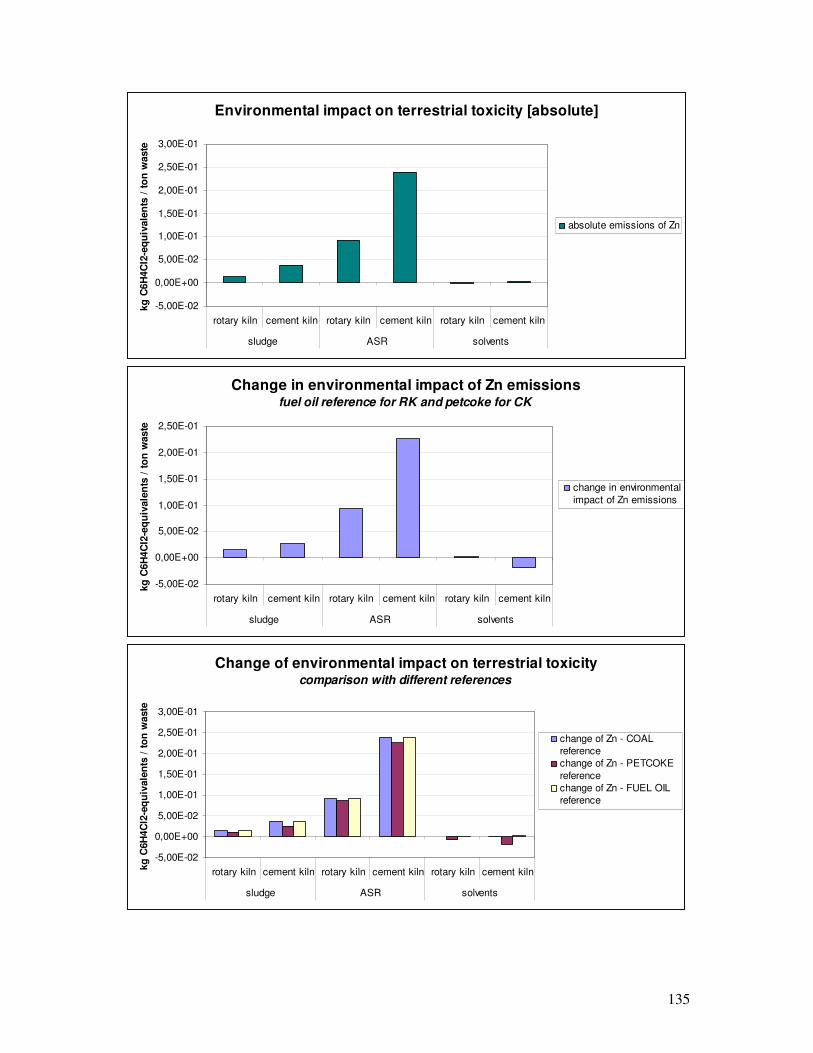
135
Environmental impact on terrestrial toxicity [absolute]
-5,00E-02
0,00E+00
5,00E-02
1,00E-01
1,50E-01
2,00E-01
2,50E-01
3,00E-01
rotary kiln cement kiln rotary kiln cement kiln rotary kiln cement kiln
sludge ASR solvents
kg
C6H
4C
l2-e
qu
ivale
nts
/ t
on
waste
absolute emissions of Zn
Change in environmental impact of Zn emissionsfuel oil reference for RK and petcoke for CK
-5,00E-02
0,00E+00
5,00E-02
1,00E-01
1,50E-01
2,00E-01
2,50E-01
rotary kiln cement kiln rotary kiln cement kiln rotary kiln cement kiln
sludge ASR solvents
kg
C6H
4C
l2-e
qu
ivale
nts
/ t
on
waste
change in environmental
impact of Zn emissions
Change of environmental impact on terrestrial toxicitycomparison with different references
-5,00E-02
0,00E+00
5,00E-02
1,00E-01
1,50E-01
2,00E-01
2,50E-01
3,00E-01
rotary kiln cement kiln rotary kiln cement kiln rotary kiln cement kiln
sludge ASR solvents
kg
C6H
4C
l2-e
qu
ivale
nts
/ t
on
waste
change of Zn - COAL
reference
change of Zn - PETCOKE
reference
change of Zn - FUEL OIL
reference
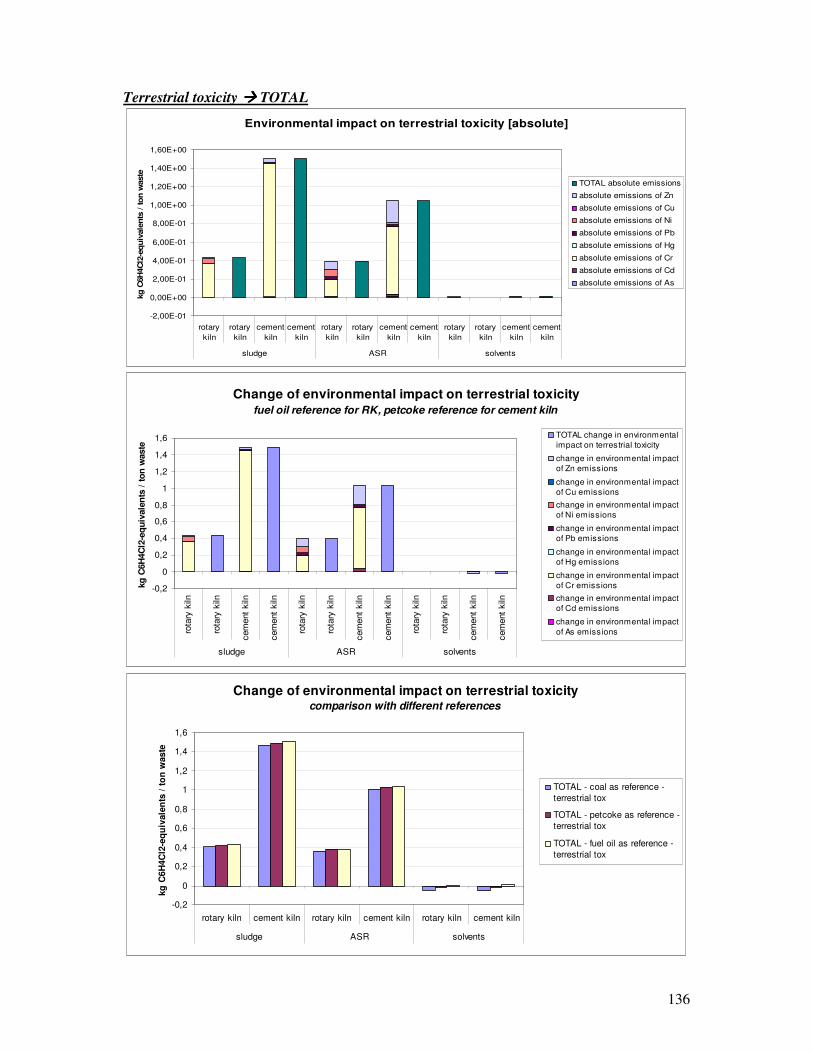
136
Terrestrial toxicity ���� TOTAL
Environmental impact on terrestrial toxicity [absolute]
-2,00E-01
0,00E+00
2,00E-01
4,00E-01
6,00E-01
8,00E-01
1,00E+00
1,20E+00
1,40E+00
1,60E+00
rotary
kiln
rotary
kiln
cement
kiln
cement
kiln
rotary
kiln
rotary
kiln
cement
kiln
cement
kiln
rotary
kiln
rotary
kiln
cement
kiln
cement
kiln
sludge ASR solvents
kg
C6H
4C
l2-e
qu
ivale
nts
/ to
n w
aste
TOTAL absolute emissions
absolute emissions of Zn
absolute emissions of Cu
absolute emissions of Ni
absolute emissions of Pb
absolute emissions of Hg
absolute emissions of Cr
absolute emissions of Cd
absolute emissions of As
Change of environmental impact on terrestrial toxicity fuel oil reference for RK, petcoke reference for cement kiln
-0,2
0
0,2
0,4
0,6
0,8
1
1,2
1,4
1,6
rota
ry k
iln
rota
ry k
iln
cem
ent
kiln
cem
ent
kiln
rota
ry k
iln
rota
ry k
iln
cem
ent
kiln
cem
ent
kiln
rota
ry k
iln
rota
ry k
iln
cem
ent
kiln
cem
ent
kiln
sludge ASR solvents
kg
C6H
4C
l2-e
qu
ivale
nts
/ t
on
waste
TOTAL change in environmental
impact on terrestrial toxicity
change in environmental impact
of Zn emissions
change in environmental impact
of Cu emissions
change in environmental impact
of Ni emissions
change in environmental impact
of Pb emissions
change in environmental impact
of Hg emissions
change in environmental impact
of Cr emissions
change in environmental impact
of Cd emissions
change in environmental impact
of As emissions
Change of environmental impact on terrestrial toxicity comparison with different references
-0,2
0
0,2
0,4
0,6
0,8
1
1,2
1,4
1,6
rotary kiln cement kiln rotary kiln cement kiln rotary kiln cement kiln
sludge ASR solvents
kg
C6H
4C
l2-e
qu
ivale
nts
/ t
on
waste
TOTAL - coal as reference -
terrestrial tox
TOTAL - petcoke as reference -
terrestrial tox
TOTAL - fuel oil as reference -
terrestrial tox
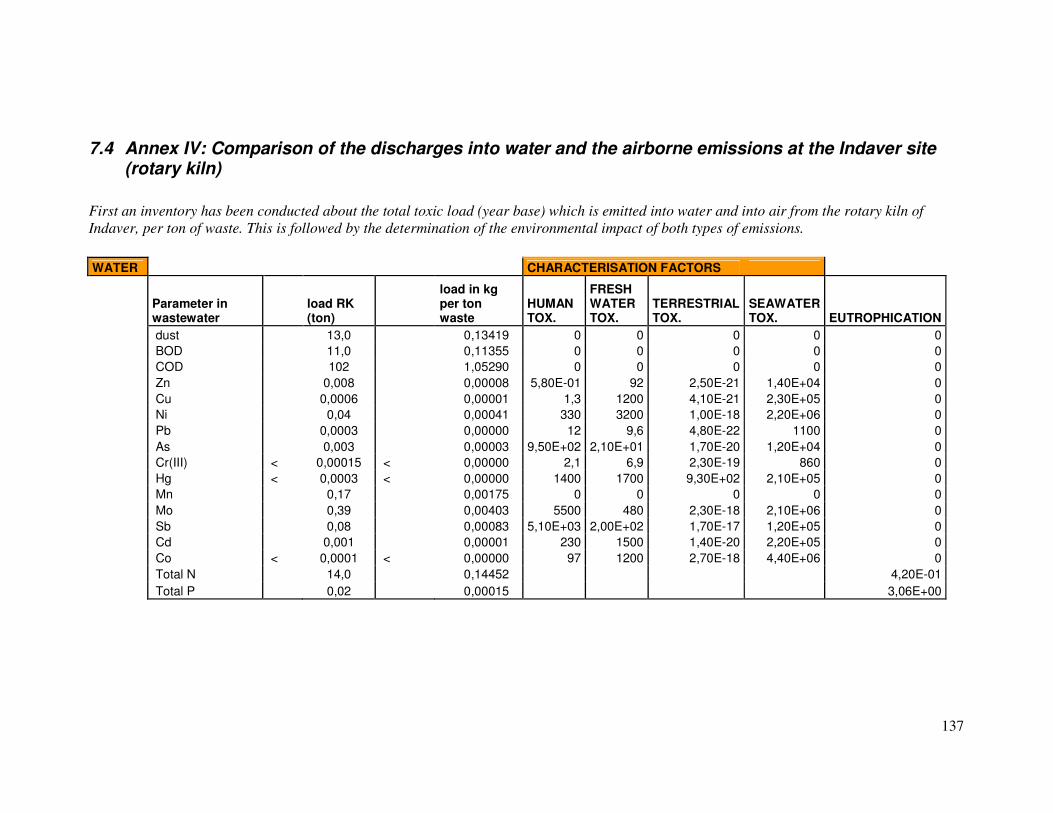
137
7.4 Annex IV: Comparison of the discharges into water and the airborne emissions at the Indaver site (rotary kiln)
First an inventory has been conducted about the total toxic load (year base) which is emitted into water and into air from the rotary kiln of
Indaver, per ton of waste. This is followed by the determination of the environmental impact of both types of emissions.
WATER CHARACTERISATION FACTORS
Parameter in wastewater
load RK (ton)
load in kg per ton waste
HUMAN TOX.
FRESH WATER TOX.
TERRESTRIAL TOX.
SEAWATER TOX. EUTROPHICATION
dust 13,0 0,13419 0 0 0 0 0
BOD 11,0 0,11355 0 0 0 0 0
COD 102 1,05290 0 0 0 0 0
Zn 0,008 0,00008 5,80E-01 92 2,50E-21 1,40E+04 0
Cu 0,0006 0,00001 1,3 1200 4,10E-21 2,30E+05 0
Ni 0,04 0,00041 330 3200 1,00E-18 2,20E+06 0
Pb 0,0003 0,00000 12 9,6 4,80E-22 1100 0
As 0,003 0,00003 9,50E+02 2,10E+01 1,70E-20 1,20E+04 0
Cr(III) < 0,00015 < 0,00000 2,1 6,9 2,30E-19 860 0
Hg < 0,0003 < 0,00000 1400 1700 9,30E+02 2,10E+05 0
Mn 0,17 0,00175 0 0 0 0 0
Mo 0,39 0,00403 5500 480 2,30E-18 2,10E+06 0
Sb 0,08 0,00083 5,10E+03 2,00E+02 1,70E-17 1,20E+05 0
Cd 0,001 0,00001 230 1500 1,40E-20 2,20E+05 0
Co < 0,0001 < 0,00000 97 1200 2,70E-18 4,40E+06 0
Total N 14,0 0,14452 4,20E-01
Total P 0,02 0,00015 3,06E+00
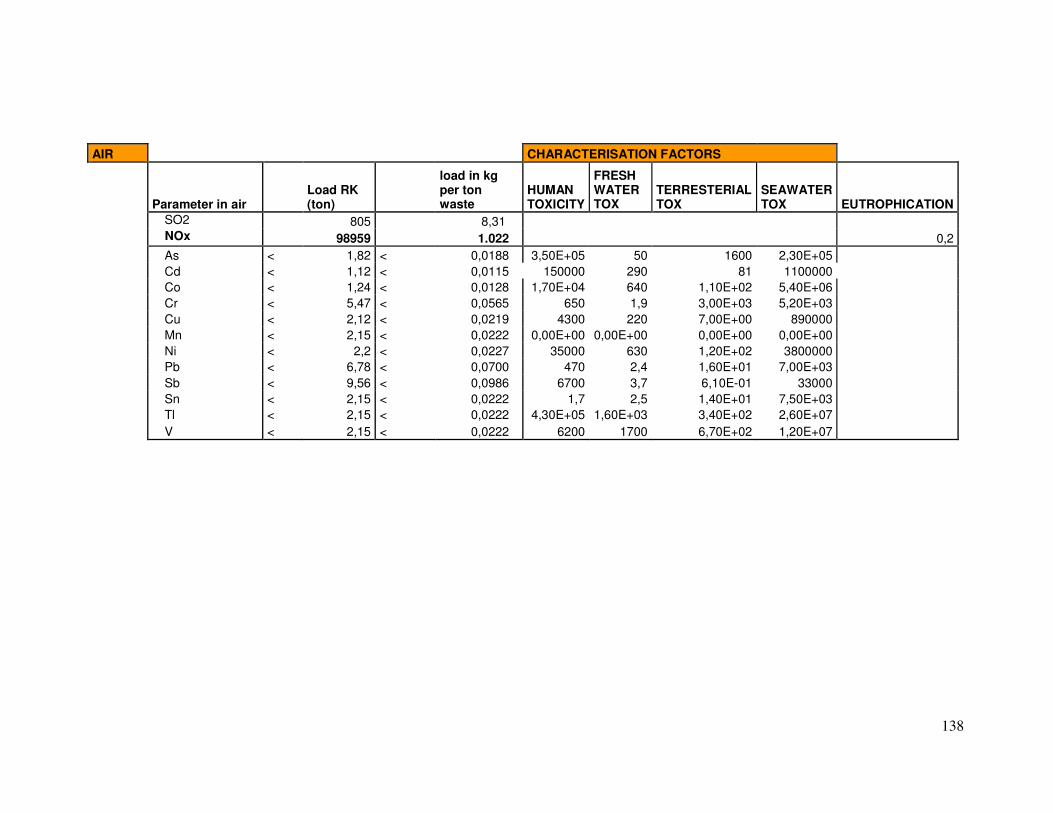
138
AIR CHARACTERISATION FACTORS
Parameter in air Load RK (ton)
load in kg per ton waste
HUMAN TOXICITY
FRESH WATER TOX
TERRESTERIAL TOX
SEAWATER TOX EUTROPHICATION
SO2 805 8,31
NOx 98959 1.022 0,2
As < 1,82 < 0,0188 3,50E+05 50 1600 2,30E+05
Cd < 1,12 < 0,0115 150000 290 81 1100000
Co < 1,24 < 0,0128 1,70E+04 640 1,10E+02 5,40E+06
Cr < 5,47 < 0,0565 650 1,9 3,00E+03 5,20E+03
Cu < 2,12 < 0,0219 4300 220 7,00E+00 890000
Mn < 2,15 < 0,0222 0,00E+00 0,00E+00 0,00E+00 0,00E+00
Ni < 2,2 < 0,0227 35000 630 1,20E+02 3800000
Pb < 6,78 < 0,0700 470 2,4 1,60E+01 7,00E+03
Sb < 9,56 < 0,0986 6700 3,7 6,10E-01 33000
Sn < 2,15 < 0,0222 1,7 2,5 1,40E+01 7,50E+03
Tl < 2,15 < 0,0222 4,30E+05 1,60E+03 3,40E+02 2,60E+07
V < 2,15 < 0,0222 6200 1700 6,70E+02 1,20E+07
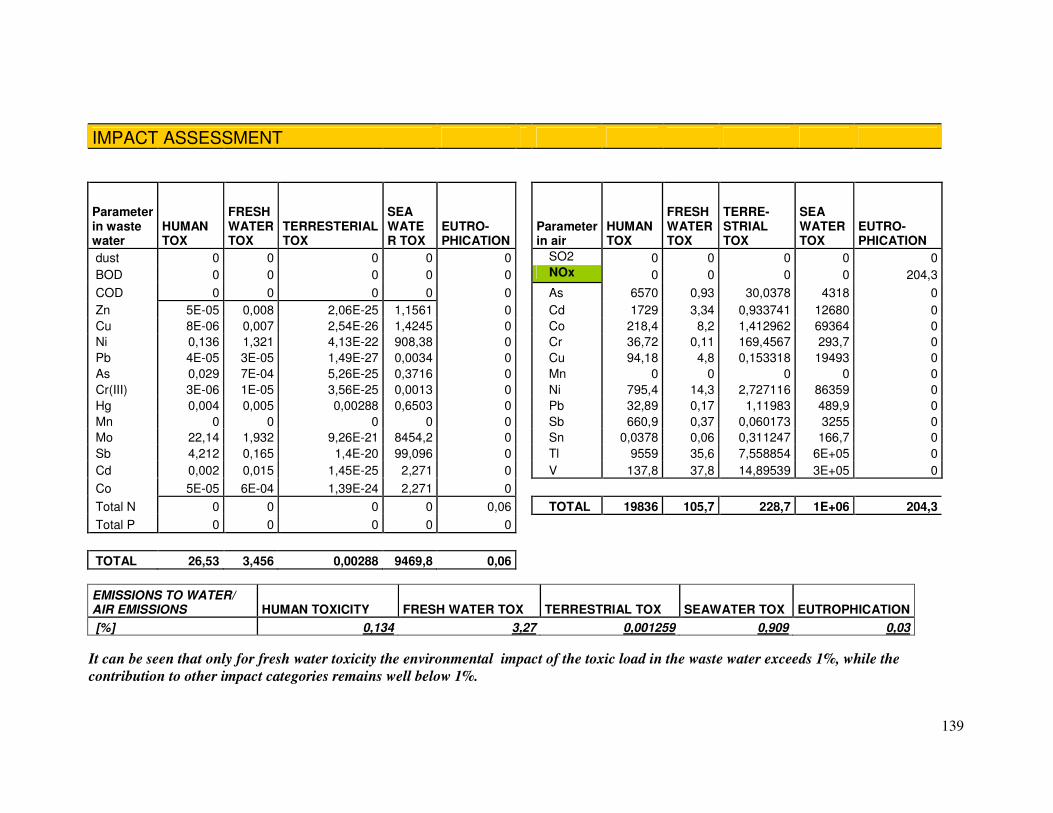
139
IMPACT ASSESSMENT
Parameter in waste water
HUMAN TOX
FRESH WATER TOX
TERRESTERIAL TOX
SEA WATER TOX
EUTRO-PHICATION
Parameter in air
HUMAN TOX
FRESH WATER TOX
TERRE-STRIAL TOX
SEA WATER TOX
EUTRO-PHICATION
dust 0 0 0 0 0 SO2 0 0 0 0 0
BOD 0 0 0 0 0 NOx 0 0 0 0 204,3
COD 0 0 0 0 0 As 6570 0,93 30,0378 4318 0
Zn 5E-05 0,008 2,06E-25 1,1561 0 Cd 1729 3,34 0,933741 12680 0
Cu 8E-06 0,007 2,54E-26 1,4245 0 Co 218,4 8,2 1,412962 69364 0
Ni 0,136 1,321 4,13E-22 908,38 0 Cr 36,72 0,11 169,4567 293,7 0
Pb 4E-05 3E-05 1,49E-27 0,0034 0 Cu 94,18 4,8 0,153318 19493 0
As 0,029 7E-04 5,26E-25 0,3716 0 Mn 0 0 0 0 0
Cr(III) 3E-06 1E-05 3,56E-25 0,0013 0 Ni 795,4 14,3 2,727116 86359 0
Hg 0,004 0,005 0,00288 0,6503 0 Pb 32,89 0,17 1,11983 489,9 0
Mn 0 0 0 0 0 Sb 660,9 0,37 0,060173 3255 0
Mo 22,14 1,932 9,26E-21 8454,2 0 Sn 0,0378 0,06 0,311247 166,7 0
Sb 4,212 0,165 1,4E-20 99,096 0 Tl 9559 35,6 7,558854 6E+05 0
Cd 0,002 0,015 1,45E-25 2,271 0 V 137,8 37,8 14,89539 3E+05 0
Co 5E-05 6E-04 1,39E-24 2,271 0
Total N 0 0 0 0 0,06 TOTAL 19836 105,7 228,7 1E+06 204,3
Total P 0 0 0 0 0
TOTAL 26,53 3,456 0,00288 9469,8 0,06
EMISSIONS TO WATER/ AIR EMISSIONS HUMAN TOXICITY FRESH WATER TOX TERRESTRIAL TOX SEAWATER TOX EUTROPHICATION
[%] 0,134 3,27 0,001259 0,909 0,03
It can be seen that only for fresh water toxicity the environmental impact of the toxic load in the waste water exceeds 1%, while the
contribution to other impact categories remains well below 1%.
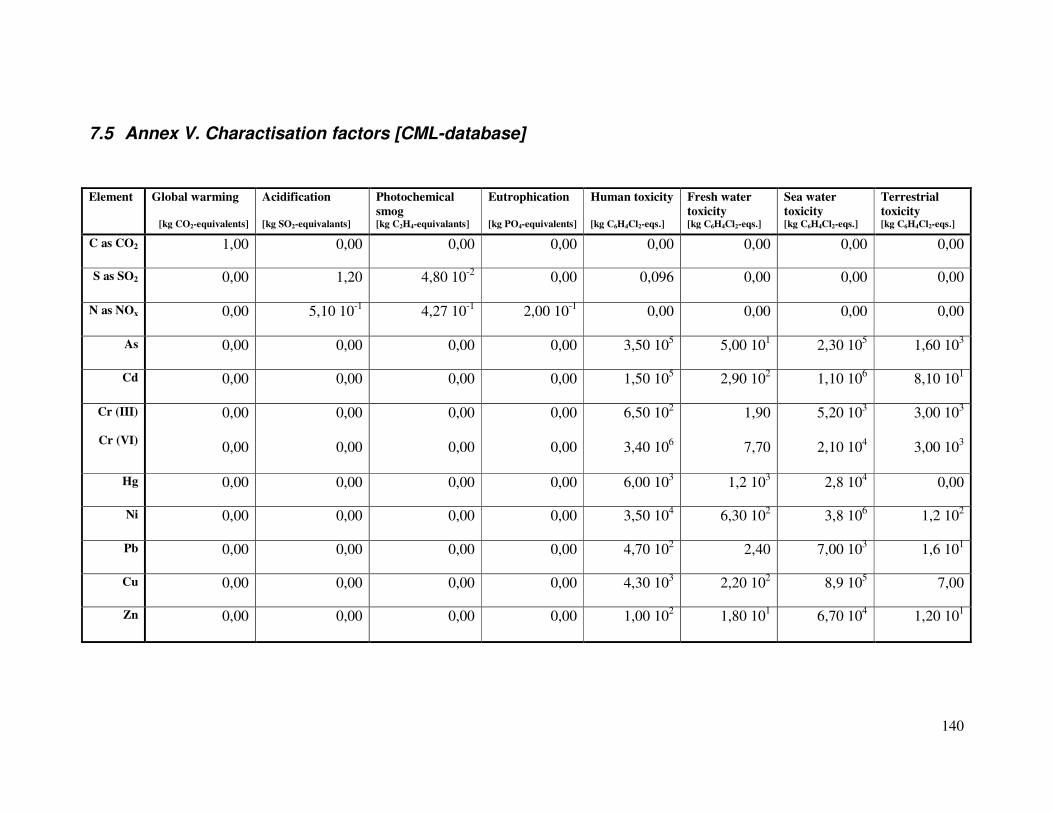
140
7.5 Annex V. Charactisation factors [CML-database]
Element Global warming
[kg CO2-equivalents]
Acidification
[kg SO2-equivalants]
Photochemical
smog [kg C2H4-equivalants]
Eutrophication
[kg PO4-equivalents]
Human toxicity
[kg C6H4Cl2-eqs.]
Fresh water
toxicity [kg C6H4Cl2-eqs.]
Sea water
toxicity [kg C6H4Cl2-eqs.]
Terrestrial
toxicity [kg C6H4Cl2-eqs.]
C as CO2 1,00 0,00 0,00 0,00 0,00 0,00 0,00 0,00
S as SO2 0,00 1,20 4,80 10-2
0,00 0,096 0,00 0,00 0,00
N as NOx 0,00 5,10 10-1
4,27 10-1
2,00 10-1
0,00 0,00 0,00 0,00
As 0,00 0,00 0,00 0,00 3,50 105
5,00 101
2,30 105
1,60 103
Cd 0,00 0,00 0,00 0,00 1,50 105
2,90 102
1,10 106
8,10 101
Cr (III)
Cr (VI)
0,00
0,00
0,00
0,00
0,00
0,00
0,00
0,00
6,50 102
3,40 106
1,90
7,70
5,20 103
2,10 104
3,00 103
3,00 103
Hg 0,00 0,00 0,00 0,00 6,00 103
1,2 103
2,8 104 0,00
Ni 0,00 0,00 0,00 0,00 3,50 104
6,30 102
3,8 106
1,2 102
Pb 0,00 0,00 0,00 0,00 4,70 102
2,40 7,00 103
1,6 101
Cu 0,00 0,00 0,00 0,00 4,30 103
2,20 102
8,9 105
7,00
Zn 0,00 0,00 0,00 0,00 1,00 102
1,80 101
6,70 104
1,20 101