Embed Size (px)
Citation preview

Comparison of the QIAcube® to manual differential separation:
Man versus Machine
Jessica Lowney, B.S., (608) 358-9400, [email protected]
FSC 630 Forensic Science Internship
Marshall University Forensic Science Graduate Program
MU Topic Advisor: Dr. Pamela Staton, Program Coordinator, 1401 Forensic Science Drive,
Huntington, WV 25701, (304) 691-8931, [email protected]
Internship Supervisor: Joshua Stewart, MSFS, Forensic DNA Analyst II, DNA Training Officer,
1401 Forensic Science Drive, Huntington, WV 25701, (304) 691-8947, [email protected]
Agency Supervisor: Dr. Mark Guilliano, Applied Testing, QIAGEN, Inc. 19300 Germantown
Rd, Germantown, MD 20874, (215) 327-3911, [email protected]

Lowney 2
Abstract
Sexual assault is a serious public safety concern worldwide, with the resulting caseload backlog
posing significant challenges for forensic laboratories. Each sexual assault kit is likely to contain
a number of samples with female-male mixtures on which a differential extraction must be
performed. Differential extraction is the process of separating sexual assault victim epithelial
cells from the perpetrator sperm cells in order to obtain an assailant profile. Unfortunately,
differential extraction is a lengthy process, requiring repeated pipetting and centrifugation.
Furthermore, due to factors such as experience, the quality and consistency of separation may be
variable between individuals. Because of the reagent cost, time, and manual work involved in
working with these cases, sexual assault backlogs have unfortunately become commonplace. In
an effort to identify ways to reduce these backlogs and benefit a scientist’s workflow, it is worth
evaluating the qualities of automated processes. This study focused on determining the utility of
the QIAGEN® (Hilden, Germany) QIAcube® for differential separation of samples, and
compared it to the current manual method. The QIAcube® was originally designed to extract
nucleic acids and proteins, and it is capable of centrifuging, vortexing, pipetting reagents, and
extracting a supernatant from a pellet. This study evaluated the QIAcube®’s abilities, using a
custom protocol, to perform differential separations on up to 12 mock sexual assault samples at a
time. Experiments included a cross-contamination study using mixed female blood and semen; a
sensitivity study based on a 1:3 serial dilution of semen, with and without female epithelial cells
present; a reproducibility study, utilizing mixed female epithelial cells and semen; as well as a
matrix or mock evidence study, consisting of a mixture of female epithelial cells and semen
pipetted onto different fabric types and swabs. All studies were performed by a novice student
using the QIAcube®. For comparison, the sensitivity and reproducibility studies were also
Lowney 3
performed by one or more experienced analysts, using a validated manual separation and wash
procedure. Each method was evaluated with respect to cost-effectiveness, time efficiency,
reproducibility, and sensitivity. The QIAcube® did prove to be a very efficient way to perform
differential separations, with excellent sensitivity, and superior reproducibility. There was no
sign of cross-contamination between samples. Conversely, more reagents were wasted with the
automated method. Furthermore, loading the instrument proved to be precarious at first; but the
ease of training a novice on the instrument had great potential, especially in comparison to
differential extraction training. The instrument may not add hours of hands-free time, with the
need to prepare the reagents and set up the instrument – but it is quite nice to push “Go” and
walk away for about half an hour while the instrument does all the centrifuging and pipetting.
Lastly, the factor of general human error – for example, bumping a tube and having to re-pellet
sperm cells – is subtracted from the extraction process. In conclusion, the use of the QIAcube®
has the potential to help a scientist work more efficiently simply by freeing an analyst or
technician from repetitious pipetting and centrifuging.
Introduction
A sexual assault is committed every two minutes in the United States, and approximately 46% of
these crimes are subsequently reported to the police (RAINN 2009). As a result, there are a large
number of sexual assault cases to be analyzed, which requires lengthy, work-intensive processing
procedures. In fact, there are so many sexual assault cases that a backlog of rape kits are held up
in evidence lockers, waiting for analysis. In an effort to handle the sheer volume of evidence
received by forensic laboratories, scientists at the Marshall University Forensic Science Center,

Lowney 4
in cooperation with Dr. Mark Guilliano from QIAGEN®, have evaluated a relatively new
instrument and its ability to perform differential separation.
Differential extraction is the process of separating cell types based on their ease of lysis, and then
extracting the DNA to obtain cell-type specific profiles. Sperm cells from the perpetrator are
more difficult to lyse than the epithelial cells of the victim due to the presence of many disulfide
bonds across the structure of the sperm cell membrane. They are also denser. In order to
separate the sample based on cell type, one can lyse the epithelial cells, centrifuge the sperm
cells into a pellet, remove the supernatant containing epithelial material, wash the sperm pellet,
and finally lyse the sperm cells. Ideally, the sperm fraction would yield a perpetrator-only
profile. For many years, this process, referred to as “differential extraction,” is what has been
performed in forensic laboratories to separate the victim’s DNA from that of the perpetrator.
Unfortunately, differential extraction is a lengthy, process involving intensive manual labor.
Due to the nature of manual techniques, error and inconsistencies between laboratories, analysts,
and individual samples may occur. This delay in processing the backlog, and the potential for
variability, provide an opportunity to explore a way to better serve the justice system, victims of
sexual assault, and wrongly accused individuals. At a roundtable meeting in Washington, DC,
led by the U.S. Department of Justice’s Office on Violence Against Women, it was determined
that “more research on how to perform DNA analyses faster, better, and at a lower cost” was
necessary to facilitate a victim-centered approach to sexual assault cases (2010). One way of
accomplishing this goal may be to investigate using automation. This study investigates the

Lowney 5
abilities of the QIAcube® to help assist technology to move forward in the field of differential
extraction and sexual assault kit processing.
In 2007, QIAGEN® released the QIAcube® (QIAGEN 2012), an instrument designed for the
lysis of cells and DNA extraction. It is capable of performing a range of functions, including
pipetting, centrifuging, vortexing, and the separation of a supernatant from pelleted material
(Figure 1).
Figure 1: Interior of the QIAcube®
Photograph by Joshua Stewart, MSFS
While the QIAcube® does come with several programs readily available for download, it is also
possible to create custom protocols to fit the diverse needs of many types of laboratories and
studies. In this study, two custom protocols were used to perform the differential separation of
sperm cells from epithelial cells – a process which would take a human hours to perform by
hand. This study aims to investigate the degree to which the QIAcube® may aid forensic DNA

Lowney 6
analysts in working more efficiently; as well as to evaluate any other possible advantages or
disadvantages to using automation to process these types of samples.
Previously, studies have been performed using the QIAcube® for medical research; for
determining time since deposition in bloodstains (Hanson et al. 2011); and in forensic validation
studies, comparing the QIAcube® to other instruments or methods of extraction (Lee et al. 2010;
Leon, Guilliano, and Della Manna; Phillips et al. 2010). One study compared the QIAcube® to
two other automated systems, the MagNA Pure LC (Roche Diagnostics, Mannheim, Germany)
and the Magtration System 12GC (Precision Science Co., Ltd., Chiba, Japan), in processing
human whole blood (Lee et al. 2010). They concluded that all three instruments performed
comparably, leaving it up to laboratories to decide which is best for their purposes. A second
validation study was performed comparing the QIAcube® to two manual methods for extracting
nucleic acids from buccal swabs and blood samples on filter paper (Phillips et al. 2010). They
concluded that the QIAcube®’s results were comparable to manual methods, but that the amount
of time and effort was reduced with the use of the automated procedure. Finally, a study was
performed to determine the feasibility of using the QIAcube® to perform differential separation
of mixed samples. The results were promising, generating profiles comparable to manual
separation with no cross-contamination between samples (Leon, Guilliano, and Della Manna).
Materials and Methods
160 µL Buffer G2, 10 µL Proteinase K, and 40 µL 1M DTT were added to to 10 µL of raw
semen sample. The mixture was vortexed vigorously for 10 seconds, then incubated at 70 °C for

Lowney 7
10 minutes at 900 rpm on a thermomixer. After the incubation, the sample was vortexed for
another 10 seconds and purified on the QIAGEN® EZ1®. Finally, it was quantitated using
Promega™ Plexor® HY.
After this initial quantitation, a semen dilution was prepared with 1X Phosphate Buffered Saline,
pH 7.2 (PBS). This dilution was used for the reproducibility study and as the starting
concentration for a 1:3 dilution series for the sensitivity studies. An approximate 1:2 dilution
with female saliva was also prepared using PBS, which was used in the sensitivity,
reproducibility, and matrix studies. For the cross-contamination study, female blood was mixed
with semen for the positive samples.
Automated Separation
Before placing them on the QIAcube®, the samples prepared for automated differential
separation and lysis each (except for the cross-contamination study) received 210 µL of a lysis
mixture, which was a ratio of 200 µL Buffer G2 to 10 µL Proteinase K to 1 µL carrier RNA.
Samples were then vortexed, incubated at 56°C on a heat block for 1.5 to 2 hours, vortexed
again, and placed on the QIAcube® for centrifugation and separation using the first custom
protocol designed by QIAGEN®. After the first protocol had finished its run, the student would
cap the epithelial cell fractions and run the QIAcube®’s second custom protocol, which would
wash the pellet with Buffer G2 and lyse the sperm cells using a mixture of 160 µL Buffer G2 to
10 µL Proteinase K to 40 µL DTT to 1 µL carrier RNA. After removing the sperm fractions
from the QIAcube®, they were vortexed for ten seconds vigorously and placed on a thermomixer

Lowney 8
for 10 minutes at 70°C and 900 rpm. All samples were then vortexed again for ten seconds and
placed on the QIAGEN® EZ1® for DNA purification.
Manual Separation
Manual samples underwent the validated procedure for differential extraction of casework
samples. 200-250 µL Buffer G2 and 10 µL Proteinase K were added to the samples, which were
incubated for 1-2 hours at 56°C. The tubes were centrifuged at 13,200 rpm for 5 minutes, and
the supernatant (the epithelial cell fraction) was transferred to an EZ1® sample tube. 1 µL of
carrier RNA was added to the epithelial cell fraction, which was then ready for EZ1® DNA
purification. The sperm fraction was washed at least three times with 500 µL Buffer G2. After
washing, 160 µL Buffer G2, 10 µL Proteinase K, 40 µL 1M DTT, and 1 µL carrier RNA were
added to the sperm fraction. It was vortexed vigorously for 10 seconds, incubated at 70°C for 10
minutes at 900 rpm, and placed on the EZ1® for DNA purification.
A cost analysis was performed by summing the initial cost of reagents and other supplies
required to perform a differential separation on one sample. The automated and manual methods
were compared.
All samples, manual and automated, were quantitated using Promega™ (Madison, WI) Plexor®
HY kits and placed on Applied Biosystems™ (Grand Island, NY) 7500 Real-Time PCR
Systems. Amplification was performed using Promega™ PowerPlex® 16 HS, and capillary
electrophoresis was performed on the Applied Biosystems™ 3130 or 3130xl.
Electropherograms were analyzed using GeneMapper™ ID version 1.2.3 with a 50 RFU analysis

Lowney 9
threshold and a marker specific stutter ratio filter. The QIAcube® was lent to the MUFSC by
QIAGEN®.
Cross-contamination study
Two runs were performed on the QIAcube® for the purpose of determining the risk of cross-
contamination between samples. One run placed positive samples in odd positions and negative
samples in even positions (Figure 2). The other run was the opposite, with positives in the even
positions and negatives in the odd positions.
Positive samples contained 20 µL of female blood, 2 µL of semen, 250 µL of G2 buffer, and 10
µL of Proteinase K. Negative samples contained 250 µL of G2 buffer and 10 µL of Proteinase
K. After the separation, sperm fractions were digested as previously described.
Figure 2: The QIAcube® centrifuge with 12 rotor positions
Photograph by Joshua Stewart, MSFS

Lowney 10
Sensitivity & linearity study
Part A: Semen only
A 1:3 semen dilution series was prepared (Table 1), and 50µL of each semen dilution was
differentially extracted.
Table 1: Semen dilution series (per Mark Guilliano from QIAGEN®)
Dilution Name Semen Serial Dilution
(ul)
PBS to Calculated Calculated ng/ul
720 ng/50ul dilution ul semen in eluate
A 720 ul of A 0ul 45.91 0.308 1.148
B 240 ul of A 480 15.30 0.103 0.383
C 240 ul of B 480 5.10 0.034 0.128
D 240 ul of C 480 1.70 0.011 0.043
E 240 ul of D 480 0.57 0.004 0.014
F 240 ul of E 480 0.19 0.001 0.005
The set of dilutions A-F was created in duplicate to test the QIAcube®’s sensitivity to decreasing
amounts of semen. A second duplicated set of dilutions A-F were separated manually for
comparison.
Part B: Semen dilution series with female saliva
A quadruplicate set of dilutions A-D (Table 1) was added to 50µL of an approximate 1:2 dilution
of female saliva. One duplicate set of dilutions was separated manually, while the second
duplicate set was separated using the QIAcube®.
Reproducibility study
Samples were prepared using 50 µL of semen dilution A (Table 1) and 50 µL of the 1:2 saliva
dilution. Six sets of three samples were separated manually by different members of the
Marshall University Forensic Science Center DNA laboratory. The rest of the samples were

Lowney 11
separated using the QIAcube® in three sets of six (minus one lost sample), for a total of 35
samples tested.
Matrix study
This study may also be referred to as a “mock evidence” type study, using several different
prepared cloth types (towel, jeans, blue sock, brown shirt, and white shirt) and a swab. The
matrices were digested at 56°C for about 1.5 hours, in a spin basket, with the same 200 µL
Buffer G2 to 10 µL Proteinase K to 1 µL carrier RNA mixture. They were then centrifuged for 5
minutes at 13,000 rpm to draw the liquid off the substrate. The baskets and substrates were
removed, and extraction continued on the QIAcube® as usual.
Results
Cross-Contamination Study
Two representative positive samples were amplified and typed. Both samples yielded the
expected profiles (Figures 3 and 4). Three of the control negative samples contained small peaks
that aligned with three allele bins: bin 30 of D21S11, bin Y of Amelogenin, and bin 17 of vWA
(Figure 5). However, neither the D21 nor the vWA suspected alleles listed match those of the
control male or female samples. No peaks were called by GeneMapper ID. The remaining 21
negative controls showed no evidence of contamination.

Lowney 12
Sensitivity Study
Semen-only samples
The samples from the QIAcube® showed full profiles in the sperm fraction through dilution D
and for one of the two E dilutions. For the other E and dilution F, dropout was noted. The
manual samples displayed dropout starting at dilution D, and seemed to have a higher level of
dropout than the automated samples. When the peak heights from capillary electrophoresis were
totaled for each dilution, the QIAcube® appeared to be more sensitive than the manual method
with overall higher peak heights (Figure 6). Both the manual and automated methods seemed to
follow the expected threefold decrease in slope.
Semen with saliva
Quantitation data for both the automated and manual methods showed the expected threefold
decrease in concentration for the sperm fractions (Figure 7). The epithelial fraction seemed to
show that more DNA may have been extracted with the use of the QIAcube®. Some dropout
was noted in some of the epithelial fractions for both the manual and automated methods.
Reproducibility Study
The quantitation of samples from the QIAcube® displayed a higher level of consistency than the
manual samples for both the epithelial and the sperm fractions (Figures 8 and 9). Both the
manual and automated methods gave the expected DNA profiles.
Lowney 13
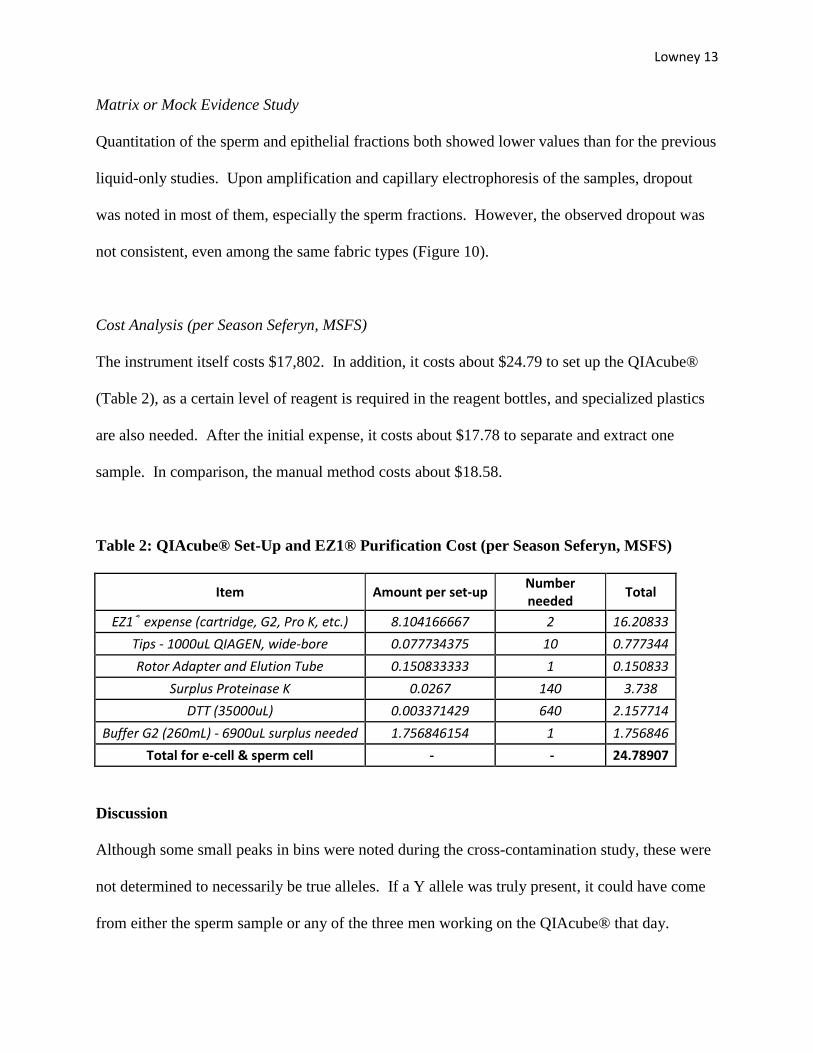
Matrix or Mock Evidence Study
Quantitation of the sperm and epithelial fractions both showed lower values than for the previous
liquid-only studies. Upon amplification and capillary electrophoresis of the samples, dropout
was noted in most of them, especially the sperm fractions. However, the observed dropout was
not consistent, even among the same fabric types (Figure 10).
Cost Analysis (per Season Seferyn, MSFS)
The instrument itself costs $17,802. In addition, it costs about $24.79 to set up the QIAcube®
(Table 2), as a certain level of reagent is required in the reagent bottles, and specialized plastics
are also needed. After the initial expense, it costs about $17.78 to separate and extract one
sample. In comparison, the manual method costs about $18.58.
Table 2: QIAcube® Set-Up and EZ1® Purification Cost (per Season Seferyn, MSFS)
Item Amount per set-up Number needed
Total
EZ1® expense (cartridge, G2, Pro K, etc.) 8.104166667 2 16.20833
Tips - 1000uL QIAGEN, wide-bore 0.077734375 10 0.777344
Rotor Adapter and Elution Tube 0.150833333 1 0.150833
Surplus Proteinase K 0.0267 140 3.738
DTT (35000uL) 0.003371429 640 2.157714
Buffer G2 (260mL) - 6900uL surplus needed 1.756846154 1 1.756846
Total for e-cell & sperm cell - - 24.78907
Discussion
Although some small peaks in bins were noted during the cross-contamination study, these were
not determined to necessarily be true alleles. If a Y allele was truly present, it could have come
from either the sperm sample or any of the three men working on the QIAcube® that day.

Lowney 14
Furthermore, since the other suspect peaks registered at very small height values, and since they
did not match the known profiles, the instrument was deemed not to be responsible for any cross-
contamination.
The results of both the sensitivity and reproducibility tests showed that the QIAcube®’s
performance at least equaled that of an experienced analyst. It may have even proved to be more
sensitive in generating a profile from a sperm pellet. Also, there was a marked improvement in
consistency with the use of the QIAcube®, which had been pitted against the combined
experience of 30 years of manual technique.
The matrix study presents many questions which could be addressed with further study. Firstly,
during incubation, the spin basket sits relatively high in the tube. It may be worth investigating
whether the sample is reaching the proper temperature during incubation. It would also be worth
comparing the results of the matrix study to a liquid-only control, as well as a manual
comparison. Lastly, it may be worth following QIAGEN’s protocol exactly, rather than making
an attempt to mirror the other methods performed during this study.
Although there is an initial set-up cost for the instrument, the amount per sample is almost a
dollar less for the automated process than the manual one. If running more than one sample, and
more than one run of the instrument per day, the set-up expenses would most certainly be
reduced. Therefore, except for the initial cost of the instrument, the expense of running the
QIAcube® is roughly equivalent to manual differential separation.

Lowney 15
Conclusions
One important way to better serve the justice system and victims of sexual assault is to “Develop
enhanced training for new DNA analysts, since training is currently a resource-heavy, time-
consuming process [and e]xplore ways to streamline training for criminalists” (US DOJ 2010).
The QIAcube® addressed this issue mainly by being easy to understand and use, as well as
allowing some hands-free time to work more efficiently. A novice could be trained very quickly
on the instrument, which could drastically reduce training time for new analysts, and allow a new
worker to progress to handling backlogged cases more quickly. The instrument introduced no
risk of contamination and general human error was eliminated. The QIAcube® is a viable
alternative to manual differential separation, reducing repetitive motions and providing equal or
greater consistency and sensitivity.
Acknowledgements
The authors would like to express their gratitude toward the Marshall University Forensic
Science Center DNA Laboratory for hosting this project and providing laboratory personnel and
equipment. Heather Harrah-Lea, MS, and Season Seferyn, MSFS, have the thanks of the authors
for performing the manual portions of the sensitivity study and for helping with cost analysis,
respectively. The authors would also like to acknowledge QIAGEN for lending the QIAcube®
to the laboratory; and the National Institute of Justice, whose generous grant made these
experiments possible.

Lowney 16
References
Hanson, E., Albornoz, A., and Ballantyne, J. 2011. Validation of the hemoglobin (Hb) hypsochromic shift assay for determination of the time since deposition (TSD) of dried bloodstains. Forensic Science International: Genetics Supplement Series 3(1): e307-e308. Available online at: http://www.sciencedirect.com/science/article/pii/S1875176811001545. Accessed May 2012.
Lee, J., Park, Y., Choi, J. R., Lee, E. K., and Kim, H. 2010. Comparisons of Three Automated Systems for Genomic DNA Extraction in a Clinical Diagnostic Laboratory. Yonsei Medical Journal 51(1): 104-110. Available online at: http://synapse.koreamed.org/DOIx.php?id=10.3349/ymj.2010.51.1.104. Accessed May 2012.
Leon, A., Guilliano, M., and Della Manna, A. “Feasibility of using the QIAGEN QIAcube® to help Automate the Differential Extraction Process.” Alabama Department of Forensic Sciences, Birmingham AL; QIAGEN, Germantown, MD.
Phillips, K., McCallum, N., and Welch, L. 2010. A comparison of methods for forensic DNA extraction: Chelex-100® and the QIAGEN DNA Investigator Kit (manual and automated). Forensic Science International: Genetics 6(2): 282-285. Available online at: http://www.sciencedirect.com/science/article/pii/S1872497311000949. Accessed May 2012.
QIAGEN. 2012. QIAcube® Wins ALA New Product Award. [Online.] Available from: http://www.qiagen.com/about/pressreleases/pressreleaseview.aspx?pressreleaseid=86. Accessed July 2012.
Rape, Abuse & Incest National Network (RAINN). 2009. Statistics. [Online.] Available from: http://www.rainn.org/statistics/. Accessed July 2012.
U.S. Department of Justice (US DOJ) Office on Violence Against Women. 2010. Eliminating the Rape Kit Backlog: A Roundtable to Explore a Victim-Centered Approach. In Summary of the Proceedings, Washington, DC, May 11-12, 2010. Available from: http://www.ovw.usdoj.gov/docs/rape-kit-roundtable-summary-10262010.pdf. Accessed July 2012.

Lowney 17
Figures 3-10
Figure 3: Cross-contamination study: epithelial cell fraction electropherogram
An example electropherogram from one of the positive controls of the cross-contamination study.
The epithelial fraction of the sample yielded the expected profiles.
Figure 4: Cross-contamination study sperm fraction electropherogram
An example electropherogram from the same positive control’s sperm fraction. The expected
profiles were generated.

Lowney 18
Figure 5: Cross-contamination study: peaks in negative controls
a.
b. c.
A few very low peaks were noticed in three negative controls of the cross-contamination study.
All three peaks were below the 50 RFU analysis threshold. Two of the bins (a. and c.) did not
match the known alleles from the blood or semen donors. It was determined that, if these were
true alleles rather than “noise,” they were not due to the performance of the QIAcube®.
Figure 6: Sensitivity study
Total peak height of two trials per test (manual and automated) was summed after capillary
electrophoresis and compared to a slope that decreased threefold. Dilutions A and B are not
shown because they were normalized before amplification. The automated extraction shows a
slightly higher peak height than the manual extraction.
1000
10000
100000
C D E F
Tota
l pea
k h
eigh
t (r
fu)
Serial semen dilution: automated versus manual extraction
Automated extraction
Manual Wash
Expected slope
1:3 Serial dilution of semen (two trials)

Lowney 19
Figure 7: Sensitivity study
Quantitation values of the sensitivity study (semen with saliva) showed that the sperm fractions
of both the manual and automated extraction methods followed the expected decreasing trend.
The automated method yielded slightly higher quantitation results in both fractions than the
manual method.
Figure 8: Reproducibility study
Quantitation values of the sperm fractions for the reproducibility study. All samples contained
approximately the same amount of sperm and saliva dilution. The quantitation values of the
automated extraction show more consistent and slightly higher quantitation results than those of
the manual extraction method. CV for manual extraction was 43%; CV for automated extraction
was 9%.
0.01
0.1
1
10
A B C D
Log
Ave
rage
qu
anti
tati
on
(n
g/µ
L)
Average Human Quantitation Values
Automated - Epithelial
Automated - Sperm
Manual - Epithelial
Manual - Sperm
Expected slope (sperm)
Serial dilution
0.000
0.200
0.400
0.600
0.800
1.000
1.200
1.400
1.600
1 2 3 4 5 6 7 8 9 10 11 12 13 14 15 16 17 18
Co
nce
ntr
atio
n o
f D
NA
(n
g/µ
L)
Quantitation of sperm fractions: manual versus automated methods
Manual extraction
Automated extraction
Replicates

Lowney 20
Figure 9: Reproducibility study
Reproducibility study: Much like the sperm fractions, the epithelial fractions showed greater
consistency with the automated method than with the manual method, although the quantitation
values are lower on average. CV for manual extraction was 20%; CV for automated extraction
was 12%.
Figure 10: Matrix study: Sample sperm fractions from two cuttings of jeans
a.
0.000
1.000
2.000
3.000
4.000
5.000
6.000
7.000
8.000
9.000
10.000
1 2 3 4 5 6 7 8 9 10 11 12 13 14 15 16 17 18
Co
nce
ntr
atio
n o
f D
NA
(n
g/µ
L)
Quantitation of epithelial fractions: manual versus automated methods
Manual extraction
Automated extraction
Replicates

Lowney 21
b.
Dropout was noted with the sperm fractions of the matrix study samples. This dropout was not
necessarily consistent within the same fabric type. This example of blue jean fabric shows that
the two samples had entirely different levels of dropout in their sperm fractions.