Embed Size (px)
Citation preview

Concrete international / June 2011 27
by RichaRd MccaRthy and Johan SilfweRbRand
Comparison of Three Methods to Measure Formwork Pressure
When Using SCC field study shows feasible alternatives to predictive methods
A lthough self-consolidating concrete (SCC) can provide an improved working environment and increased
productivity, SCC currently holds less than a 10% share of the cast-in-place concrete market in Sweden (the share in the precast concrete industry is substantially higher). One of the factors leading to this low level of acceptance is the difficulty of predicting formwork pressures associated with SCC.
The design standards for formwork were established well before SCC was developed, and the predictive equations in the standards tend to have gross simplifications of many of the parameters known to influence pressure. Also, because the plastic behavior of SCC mixtures can be very sensitive to varying properties of the constituents and varying moisture content in the fine aggregate,1,2 designers must make conservative assumptions regarding those parameters.
Many existing codes recommend designing formwork for full hydrostatic pressure unless methods based on experimental data are available. Such restrictions can result in overly conservative designs (added costs) or reduced casting rates (reduced productivity). If the actual formwork pressure can be monitored in real time, however, the concrete contractor will be able to adjust the casting rate to maintain the formwork pressure below a safe threshold. For that purpose, we compared different methods of measuring formwork pressure.
ProjeCT WallIn August 2007, NCC Construction was commissioned
by Specialfastigheter Sweden to expand an existing
prison in Härnösand, a city 450 km (280 miles) north of Stockholm. Part of the project required construction of a 0.27 m (11 in.) thick, 6 m (20 ft) tall, and 400 m (1312 ft) long security wall. Using SCC, the wall was cast in sections ranging from 10.8 to 12 m (35 to 39 ft) in length using steel-framed panels. Two sections were cast each week. We measured the pressure exerted by the SCC during the wall’s construction.
The formwork was supplied by PERIform Sverige and consisted of film-faced 15-mm (0.6-in.) thick plywood panels mounted on steel frames. The typical steel frame element was 2.4 m (8 ft) wide and 3.3 m (11 ft) high and was fabricated from two vertical hollow, cold-formed steel KKR profiles (100 x 100 x 5 mm [4 x 4 x 0.2 in.]) and multiple horizontal hollow, hot-formed steel VKR profiles (100 x 40 x 2.5 mm [4 x 1.6 x 0.1 in.]).
The ready mixed SCC was delivered by Grus & Betong i Norrland, part of the Skanska group. Wall reinforcing comprised two layers of welded-wire reinforcing and 12-mm (0.5-in.) diameter deformed reinforcing bars.
TeChnologieSFor this study, we measured lateral pressure on the
formwork (using flush-mounted pressure sensors), tension forces in the form ties, and strain in the formwork framing members.
Direct measurement of pressureFlush-mounted pressure sensors can be installed in holes
in the formwork facing, with the sensor diaphragm in direct contact with the concrete. While such sensors allow
28 June 2011 / Concrete international
pressure to be monitored directly with no conversion for tributary area, they may be difficult to install, remove, and maintain. Also, readings may not be consistent, as concrete can bridge over the sensor diaphragm or the diaphragm may not respond to decreasing pressures.3,4
Tension forces in form tiesThe tension force in a form tie can be evaluated by
measuring the compressive force developed between the formwork framing and the anchor plate on the tie. Typically, this is done using a hollow-core load cell that measures force with electrical resistance strain gauges or hydraulic pressure gauges. While load cells can be relatively easy to install on either side of the formwork, some of the form ties may be subjected to greater load than others.
Strains in the formwork framingFormwork pressure can also be determined by measuring
strains in formwork framing members. Pressure values are calculated using calibration data that correlate measured strains against pressure sensor data or the results of structural analyses of the formwork system. The strains can be measured using electrical resistance
strain gauges, fiber optic sensors, or vibrating wire strain gauges mounted on the formwork framing members.
inSTrUMenTaTionWe instrumented three identical form elements
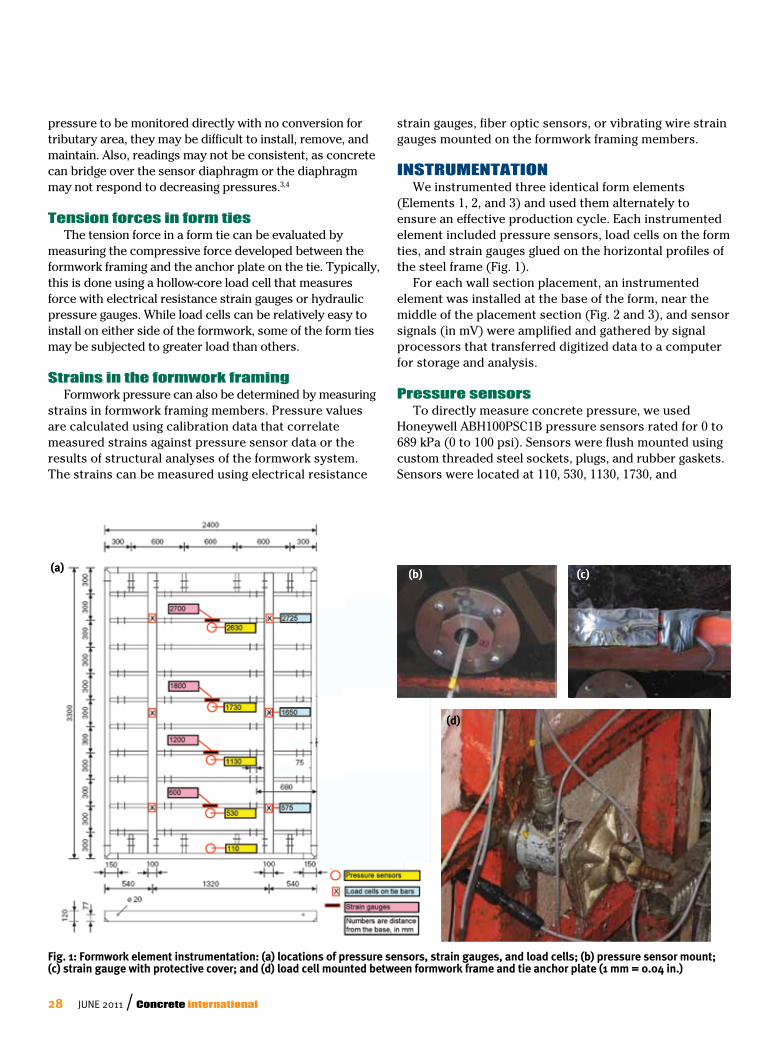
(Elements 1, 2, and 3) and used them alternately to ensure an effective production cycle. Each instrumented element included pressure sensors, load cells on the form ties, and strain gauges glued on the horizontal profiles of the steel frame (Fig. 1).
For each wall section placement, an instrumented element was installed at the base of the form, near the middle of the placement section (Fig. 2 and 3), and sensor signals (in mV) were amplified and gathered by signal processors that transferred digitized data to a computer for storage and analysis.
Pressure sensorsTo directly measure concrete pressure, we used
Honeywell ABH100PSC1B pressure sensors rated for 0 to 689 kPa (0 to 100 psi). Sensors were flush mounted using custom threaded steel sockets, plugs, and rubber gaskets. Sensors were located at 110, 530, 1130, 1730, and
Fig. 1: Formwork element instrumentation: (a) locations of pressure sensors, strain gauges, and load cells; (b) pressure sensor mount; (c) strain gauge with protective cover; and (d) load cell mounted between formwork frame and tie anchor plate (1 mm = 0.04 in.)
(a) (b) (c)
(d)

Concrete international / June 2011 29
Fig. 2: Location of an instrumented form element in a recently completed section
2630 mm (4, 21, 45, 68, and 104 in.) from the base of the form (Fig. 1).
load cells on form tiesTo measure tension in the form ties, we used custom
load cells manufactured by the staff of the Division of Structural Design and Bridges, KTH Royal Institute of Technology in Stockholm. Load cells were located 575, 1650, and 2725 mm (23, 65, and 107 in.) above the base of the formwork. The load area for each tie bar was estimated to be 1.3 m2 (14 ft2).
Strain gaugesTo measure strains in the frame members, we used
HBM K-LY41-6/120 linear metal strain gauges mounted on horizontal profiles of the formwork. The gauges were self-temperature compensated for steel and were rated for maximum elongations of 20,000 µm/m. Gauges were adhesively bonded to the profiles located at 600, 1200, 1800, and 2700 mm (24, 47, 71, and 106 in.) from the base of the form. Gauges were covered with paste and
aluminum foil for protection. The tributary width for each horizontal profile was 300 mm (12 in.).
PlacementsAbout 20 m3 (26 yd3) of SCC was placed for each
section of the wall. Concrete was delivered by four concrete trucks and was placed in lifts of about 1.5 m (5 ft) using a concrete pump. The discharge location was alternated at each lift (Fig. 3). The casting rate varied from 1 to 3.5 m (3 to 12 ft) per hour. Pressure and load values were continuously monitored on the data acquisition computer. The ready mixed concrete plant was located only 250 m (820 ft) from the building site. Direct communication with staff members at the concrete plant and the pump truck operator made it possible to reduce the casting rate if the pressure and load values were too high.
The delivered concrete had a water-cement ratio (w/c) of 0.50, a water-paste ratio of 0.33, and a paste content of 446 L/m3 (44.6% by volume). The mixture proportions are shown in Table 1. The amounts of

30 June 2011 / Concrete international
TabLe 1:Mixture proportions for the sCC Mixture, quantities are per M3
ceM ii (portland-limestone), kg (lb/yd3) 400 (674)
limestone filler, kg (lb/yd3) 200 (337)
aggregate 0 to 8 mm (natural sand), kg (lb/yd3) 1015 (1711)
aggregate 8 to 16 mm (crushed), kg (lb/yd3) 485 (817)
water, kg (lb/yd3) 200 (337)
high-range water-reducing admixture, kg (lb/yd3) approximately 2.5 (4.2)
air-entraining agent, kg (lb/yd3) approximately 1.1 (1.9)
TabLe 2:plaCeMent data
Date elementOutside air temperature
(mean value), °C (°F) Placement rate,
m/h (ft/h)
1 2 3
10/8/08 — X — 6 (43) 1.4 (4.6)
10/10/08 X — — 8 (46) 1.5 (4.9)
10/15/08 — X — 1.5 (4.9)
10/22/08 X — — 7 (45) 1.3 (4.3)
11/7/08 — X — 3 (37) 1.5 (4.9)
11/14/08 — — X 2 (36) 1.5 (4.9)
11/19/08 — X — –2 (28) 1.3 (4.3)
1/14/09 X — — –2 (28) 1.3 (4.3)
1/28/09 — X — –1 (30) 1.7 (5.6)
2/11/09 — X — –10 (14) 2.5 (8.2)
3/25/09 — X — –4 (25) 3.5 (11.5)
4/27/09 — X — — 3.3 (10.8)
Fig. 3: Panel layout and pump hose discharge locations. Panel widths and heights are shown in m. The middle panel (*) was 1.2 m (3.9 ft) wide for some placements (1 m = 3.3 ft)
admixtures varied somewhat to maintain uniform fresh concrete properties. All placements had sufficient flow to be classified as SCC.
The wall was built between August 2008 and May 2009. Measurements were made during 12 (of a total of 33) placements (Table 2). After the con-crete wall was completed, two of the instrumented form elements were mounted together to create a 3.3 m (11 ft) high wall form. This form was then filled with water (the water temperature measured 9°C [48°F]) to an elevation of 2.7 m (9 ft). Readings were then taken using the sensors on Element 1.
reSUlTSVerification of the pressure sensors using water in the formwork
Figure 4 shows water pressure as a function of water depth (head), using pressure values from the pressure sensors and using calculated values based on the density of water. The measured water pressure correlates well with the calculated water pressure. These values were within 0.17% at 110 mm (4 in.) from the base. The largest difference, 4.11%, was at 2630 mm (104 in.) from the base, where the water pressure was very small.
Strain in steel frames and form tie tension force
Figure 5 provides example plots of strain in the steel frame member versus pressure sensor readings. A trend line and the coefficient of determination (R2) are shown on each plot. The R2 values are very close to 1, indicating a very strong correlation. Based on all of the placements, the relationship between strain and measured pressure was found to have a slope ranging from 4.6 to 9.5 (µm/m)/kPa. Figure 6 shows example plots of form tie tension versus pressure sensor readings. The data show that the relationship between tie tension and measured pressure is slightly progressive.

Concrete international / June 2011 31
analySeSrelationship between pressure sensor values and strain in steel frames
The relationship between pressure sensor values and strain in the steel frames showed very good correlation throughout the whole series of placements, regardless of form element and level. We observed that the relationships between sensor values and strains were linear and the associated trend line tended to go through the origin (Fig. 5).
The trend line for each form element and level, however, has its own slope. Because the formwork comprises a statically indeterminate system and there are imperfections in the plywood panels, the tributary width for the load varies from level to level and from form element to form element. Even so, the repeatability is good from day to day at a particular form element and level. After calibration of the form element, it’s therefore possible to estimate the formwork pressure with sufficient accuracy by measuring the strain in the steel frame.
relationship between pressure sensor values and form tie tension force
While relatively good repeatability was observed (Fig. 6), one cannot expect a linear relationship between pressure sensor values and tie force. The tension force in the tie depends not only on the pressure at a specific level, but also on the total distribution of pressure and the geometry of the framing.
ConClUDing reMarkSThe Site Foreman and the Site Manager reported that
the rapid placement allowed by SCC led to about a 10% reduction in installation cost relative to a wall placed with
conventional concrete. It took only 8 months to finish the wall with SCC, and it was estimated that construction with conventional concrete would have taken twice as long. The foreman and manager indicated that SCC improved the working environment, and the contractor was very satisfied with the quality of the finished surface.
During this field study, pressure sensor values, strains in the form members, and form tie tension force were measured. The measurements displayed very good correlation between pressure and strain and good correlation between pressure and form tie tension force. This means that any of the methods could be used to estimate the load on the formwork. We believe the most practical (and accurate) method, however, is to measure the strain in steel-framed formwork that has been calibrated using a known water pressure head.
acknowledgmentsThe authors wish to acknowledge the financial support provided
by the Swedish Road Administration, the Development Fund of the
Swedish Construction Industry (SBUF), and the Swedish Consortium
Pressure, kPa
Hydrostatic pressurePressure sensor data
0.0
1.0
2.0
2.73.0
0 10 20 30
Total
head
, m
Formwork base
200 40 60 80 100
Strain
, µm/
m
Sensor pressure, kPa
600500400300200100
0
200 40 60 80 100
Strain
, µm/
m
Sensor pressure, kPa
600500400300200100
0
15 Oct 200814 Nov 20082.7 m water
R2 = 0.9988
R2 = 0.9975
R2 = 0.9707
R2 = 0.9592
R2 = 0.9511
R2 = 0.9979
R2 = 0.9982 10 Oct 2008
14 Jan 20092.7 m water
22 Oct 2008
Fig. 4: Pressure data obtained using pressure sensors in element 1. The form was filled with water to an elevation of 2.7 m (9 ft). (1 kPa = 0.145 psi; 1 m = 3.3 ft)
Fig. 5: Relationship between strain in the steel frame element and pressure sensor values: (a) data from element 1, with strain data taken at 600 mm (24 in.) from the base and pressure data taken at 530 mm (21 in.) from the base; and (b) data from element 3, with strain data taken at 1200 mm (47 in.) from the base and pressure data taken at 1130 mm (45 in.) from the base. (1 kPa = 0.145 psi)
(a)
(b)
Pressure, kPa
Hydrostatic pressurePressure sensor data
0.0
1.0
2.0
2.73.0
0 10 20 30
Total
head
, m
Formwork base
200 40 60 80 100
Strain
, µm/
m
Sensor pressure, kPa
600500400300200100
0
200 40 60 80 100
Strain
, µm/
m
Sensor pressure, kPa
600500400300200100
0
15 Oct 200814 Nov 20082.7 m water
R2 = 0.9988
R2 = 0.9975
R2 = 0.9707
R2 = 0.9592
R2 = 0.9511
R2 = 0.9979
R2 = 0.9982 10 Oct 2008
14 Jan 20092.7 m water
22 Oct 2008

32 June 2011 / Concrete international
200 40 60 80
Form
tie te
nsion
, kN
Sensor pressure, kPa
605040
8070
90
3020100
14 Jan 20092.7 m water
22 Oct 2008
200 40 60 80
Form
tie te
nsion
, kN
Sensor pressure, kPa
605040
8070
90
3020100
14 Jan 20092.7 m water
22 Oct 2008
200 40 60 80
Form
tie te
nsion
, kN
Sensor pressure, kPa
605040
8070
90
3020100
14 Jan 200922 Oct 2008
200 40 60 80
Form
tie te
nsion
, kN
Sensor pressure, kPa
605040
8070
90
3020100
2.7 m water14 Nov 2008
200 40 60 80
Form
tie te
nsion
, kN
Sensor pressure, kPa
605040
8070
90
3020100
14 Jan 20092.7 m water
22 Oct 2008
200 40 60 80
Form
tie te
nsion
, kN
Sensor pressure, kPa
605040
8070
90
3020100
14 Jan 20092.7 m water
22 Oct 2008
200 40 60 80
Form
tie te
nsion
, kN
Sensor pressure, kPa
605040
8070
90
3020100
14 Jan 200922 Oct 2008
200 40 60 80
Form
tie te
nsion
, kN
Sensor pressure, kPa
605040
8070
90
3020100
2.7 m water14 Nov 2008
Fig. 6: Relationship between pressure sensor values and form tie tension force: (a) data from element 1, with pressure data taken at 530 mm (21 in.) from the base and form tie load taken at 575 mm (23 in.) from the base; (b) data from element 1, with pressure data taken at 1730 mm (68 in.) from the base and form tie load taken at 1650 mm (65 in.) from the base; (c) data from element 1, with pressure data taken at 2630 mm (104 in.) from the base and form tie load taken at 2725 mm (107 in.) from the base; and (d) data from element 3, with pressure data taken at 530 mm (21 in.) from the base and form tie load taken at 575 mm (23 in.) from the base. (1 kPa = 0.145 psi; 1 kN = 0.225 kip)
aci member Richard McCarthy is Managing director at the Swedish concrete association and Manager of the dissemination of Knowledge Section of the Swedish cement and concrete Research institute. he is a member of aci committees 237, Self- consolidating concrete; 238, workability of fresh concrete; and 347, formwork for concrete. his interests include research,
new technologies, project development and management, education and training, marketing, and professional networking.
Johan Silfwerbrand, faci, is President of the Swedish cement and concrete Research institute and Professor in Structural design and bridges at Kth Royal institute of technology. he is a member of aci committees 342, evaluation of concrete bridges and bridge elements; 345, concrete bridge construction, Maintenance, and Repair; international Partnerships & Publications; and Membership.
for Financing Basic Research in the Concrete Field. Special thanks go to
those who contributed with expert help regarding measurements: S.
Trillkott and C. Kullberg at the Division of Structural Design and Bridges,
KTH Royal Institute of Technology in Stockholm. The great support from
NCC Construction, especially L. Vestman and P.-A. Källman, made this
project possible and very rewarding. Finally, thanks to PERIform Sverige
and Grus & Betong i Norrland for technical support.
references1. Billberg, P., and Westerholm, M., “Robustness of Fresh
VMA-Modified SCC to Varying Aggregate Moisture,” Nordic Concrete
Research, V. 38, No. 2, Norsk Betongforening, Oslo, Norway, 2008,
pp. 103-119.
2. Wallevik, O.H.; Kubens, S.; and Müller, F., “Influence of Cement-
Admixture Interaction on the Stability of Production Properties of
SCC,” Proceedings of the Fifth International RILEM Symposium on
Self-Compacting Concrete, V. 1, G. De Schutter and V. Boel, eds., RILEM
Publications SARL, Bagneux, France, 2007, pp. 211-216.
3. Gardner, N.J., “Pressure of Concrete on Formwork—A Review,”
ACI Journal Proceedings V. 82, No. 5, American Concrete Institute,
Farmington Hills, MI, Sept.-Oct. 1985, pp. 744-753.
4. Khayat, K.H., “Self-Consolidating Concrete Formwork Pressure
Research Final Report,” 2009, www.concretesdc.org/projects/
SCC_Form_Pressure_Research.htm.
Selected for reader interest by the editors.
200 40 60 80
Form
tie te
nsion
, kN
Sensor pressure, kPa
605040
8070
90
3020100
14 Jan 20092.7 m water
22 Oct 2008
200 40 60 80
Form
tie te
nsion
, kN
Sensor pressure, kPa
605040
8070
90
3020100
14 Jan 20092.7 m water
22 Oct 2008
200 40 60 80
Form
tie te
nsion
, kN
Sensor pressure, kPa
605040
8070
90
3020100
14 Jan 200922 Oct 2008
200 40 60 80
Form
tie te
nsion
, kN
Sensor pressure, kPa
605040
8070
90
3020100
2.7 m water14 Nov 2008
(a)
(b)
(c)
(d)