Embed Size (px)
Citation preview

J Am Acad Audiol 2 : 134-145 (1991)
Comparison of Two Questionnaires for Patient-Assessed Hearing Aid Benefit Robyn M. Cox* Christine Gilmore t Genevieve C. Alexander t
Abstract Two questionnaires, the Profile of Hearing Aid Benefit (PHAB) and the Intelligibility Rating Improvement Scale (IRIS), were developed to measure self-assessed hearing aid benefit. The response format differed in the two instruments : the PHAB required estimation of the proportion of time that certain situations presented communication problems, whereas the IRIS required estimation of the percentage of speech that could be understood in the same situations . The purpose of the study was to evaluate the potential of each questionnaire for clinical and research applications . They were compared in terms of the amount of self-assessed benefit they produced and their sensitivity to benefit differences in different listening situations . Both questionnaires were completed by 42 hearing aid wearers. Analyses of the results indicated that (1) the PHAB produced a significantly lower overall estimate of hearing aid benefit than the IRIS ; (2) the PHAB was more sensitive than the IRIS to benefit differences in different listening situations ; and (3) the pattern of self-assessed benefit determined with the PHAB was in agreement with previous investigations, whereas the pattern derived from the IRIS scores was not.
Key Words: Hearing aids, self-assessment, questionnaire, hearing loss
P rovision of a hearing aid is the first, and arguably the most important, step in the rehabilitation of acquired hearing
loss in elderly persons . Much research effort has been devoted to the development of meth-ods to select and fit hearing aids . Most proce-dures rely on clinical measures of real ear gain and/or speech intelligibility improvement as a basis for instrument selection because these variables are assumed to be related to the benefit furnished by the hearing aid in daily life . However, because there is no consensus about how to measure hearing aid benefit in daily life, it is difficult to verify this assumption or to evaluate the ultimate effectiveness of any spe-cific hearing aid fitting. Moreover, although
. Memphis State University ; and Department of Veterans Affairs Medical Center, Memphis, Tennessee
(Department of Veterans Affairs Medical Center, Mem-phis, Tennessee
Reprint requests : Robyn M . Cox, Memphis Speech and Hearing Center, 807 Jefferson Ave ., Memphis TN 38105
there are always several choices that must be made in a hearing aid fitting (e .g., prescription procedure, amplifier characteristics, noise re-duction circuitry), there is currently no widely accepted instrument for empirical "real world" comparisons of the various alternatives . Clini-cians attempting to optimize hearing aid fit-tings and researchers investigating new ap-proaches have few empirical tools available to quantify the benefit obtained in everyday life with any particular combination of hearing aid characteristics. The work reported in this pa-per was undertaken as part of a project to develop and evaluate such a tool .
In the earliest assessments of amplifica-tion (e.g., Carhart, 1946), it was assumed that the most important problem experienced by hearing-impaired persons is difficulty in under-standing everyday speech . This assumption has been substantiated by more recent research. When groups of wearers (or potential wearers) of amplification are asked to identify the areas in which they require help from their hearing
134
aids, their responses always indicate that im-proved communication via speech is their pri-mary need and significantly overshadows all other concerns (Barcham and Stephens, 1980; Hagerman and Gabrielsson, 1984; Golabek et al, 1988). Thus, it is reasonable to assert that the benefit delivered by a hearing aid is prima-rily determined by the extent to which it facili-tates everyday communication. Based on these considerations, we determined to develop a benefit measure that would quantify hearing aid-related improvement in speech communi-cation abilities in daily life .
Investigators attempting to quantify the positive and negative effects of amplification in daily life have typically used one or more of three measures : (1) hours of use per day, (2) overall satisfaction rating, and (3) estimated performance in specific situations . A review of the literature suggests that only the last of these measures can be used to quantify hearing aid benefit in terms of improved ability to un-derstand speech . Ewertsen (1974), Kapteyn (1977a ; b), Haggard et al (1981), Brooks (1983), Hutton (1983), Oja and Schow (1984), and oth-ers, have evaluated aided benefit in terms of hours of daily use. Taken together, these stud-ies reveal that this measure is not a good esti-mator of improvement in speech communica-tion for the following reasons : reported use of the hearing aid may be quite different from actual use (Brooks, 1983); use of the hearing aid is only weakly associated with the wearer's estimate of the extent to which the instrument facilitates speech understanding (Kapteyn, 1977a; Oja and Schow, 1984); and, daily use is more closely related to the severity of the hear-ing loss than to the subjective benefits of the aid in speech understanding (Kapteyn,1977a ; Hag-gard et al, 1981; Hutton, 1983).
Kapteyn (1977c), Nielsen (1980), Scherr et al (1983), Hutton and Canahl (1985), and others have assessed the effectiveness of the hearing aid by asking subjects to rate their satisfaction with the aid on a categorical scale (very satis-fied, slightly satisfied, etc.) . Overall, these stud-ies indicate that the improvement in speech understanding attributed to the hearing aid accounts for less than 40 percent of the variance in users' general satisfaction with the aid, and that numerous nonspeech-related issues such as ear mold discomfort, acoustic feedback, ini-tial expectations, and dexterity problems figure importantly in this rating. While these are significant factors in overall rehabilitation, they are not relevant to quantifying the extent to
Patient-Assessed Benefit/Cox et al
which amplification facilitates understanding of everyday speech .
The third technique used to quantify hear-ing aid effectiveness has employed the hearing aid user's responses to questionnaires in which the items assess functioning in specific situa-tions. If questionnaire items directly address everyday situations in which speech under-standing can be a problem, this approach has the potential for producing communication-based measures of hearing aid benefit. Some hearing handicap scales include assessment of communication problems, and several investi-gators have used handicap reduction as a glo-bal, or overall, measure of the advantage de-rived from a hearing aid (e.g ., Nielsen, 1974; Tannahill,1979 ; Newman and Weinstein,1988) .
Although global measures of benefit have useful applications, an analytic measure that partitions benefit into several components would have the advantage of producing indications of specific deficit areas. Such a measure would generate a profile of scores to reflect benefit in different types of listening situations . These data could provide a basis for selective efforts to improve individual hearing aid fittings or they could be useful for analyzing benefit differences attributable to different hearing aid treatments . As suggested above, such differences might arise from competing fitting philosophies, cir-cuit designs, rehabilitative counseling pro-grams, etc. Several studies have been reported in which benefit for different types of listening situations has been examined (e.g ., Scherr et al, 1983 ; von Wedel and Bottinger,1983 ; Walden et al, 1984). For the most part, however, investiga-tors have developed a questionnaire specifi-cally designed to address the issues of interest in a particular study. Thus, the psychometric properties of these instruments (mean scores, standard deviations, internal and test-retest reliability, and critical differences) typically have not been reported.
Two analytic inventories for assessing daily life experiences with hearing aids have been developed: the Hearing Aid Performance Inven-tory, or HAPI (Walden et al, 1984), and the Profile of Hearing Aid Performance, or PHAP (Cox and Gilmore,1990). The HAPI is a 64-item inventory that measures hearing aid benefit on a five-point category scale. It produces a four-score profile depicting benefit in different types of situations . The PHAP is a 66-item inventory that assesses performance with the hearing aid on a seven-point percentage scale. It produces both seven- and four-score profiles quantifying
135

Journal of the American Academy of Audiology/Volume 2, Number 3, July 1991
the proportion of times that certain everyday listening situations present problems for the hearing-impaired individual . The PHAP differs from the HAPI in that it generates measures of performance rather than benefit (performance is measured on an absolute scale whereas bene-fit is the difference between aided and unaided performance) ; uses more response categories to quantify performance ; produces a seven-score profile; and specifically evaluates reactions to amplified environmental sounds in addition to assessing speech communication. One of the goals in development of the PHAP was to pro-duce an analytic inventory to measure perform-ance that could, with minor modifications, be used to measure hearing aid benefit also .
In the study reported in this article, the items of the PHAP were adapted for measure-ment of hearing aid benefit. Two different bene-fit questionnaires were constructed. The use of two questionnaires allowed us to evaluate the effect of questionnaire response mode on self-assessed benefit. One questionnaire required the hearing aid wearer to estimate the propor-tion of times the situation described by an item presented problems . The other called for an estimation of the proportion of speech under-stood in the described situation (these are de-scribed in more detail below) . Hearing aid bene-fit was measured using both questionnaires . The primary research questions were : 1. Is self-assessed hearing aid benefit equiva-
lent for the two questionnaires? In other words, is estimated proportion of speech intelligibility improvement functionally equivalent to estimated proportion of situ-ations in which intelligibility is improved?
quency with which the statement is true, using a seven-point scale ranging from "always" (99%) to "never" (1%) . Each response choice includes both a descriptor and a percentage . Answers are scored in terms of the percentage . To quan-tify hearing aid benefit, each item was an-swered twice, once for "without my hearing aid" and once for "with my hearing aid." Hearing aid benefit was defined as the difference between the two responses.
The PHAP can be scored in terms of seven subscales or four scales . In the present study, scoring was accomplished using the subscales because they identify more types of listening situations and sensitivity to different types of listening situations was under investigation. The test items and details of subscale develop-ment may be found in Cox and Gilmore (1990) . The subscales are briefly described below.
Familiar Talkers (FT). Seven items de-scribing communication under relatively easy listening conditions with persons whose voices are known.
Ease ofCommunication(EC). Sevenitems describing the effort involved in communi-cation under relatively easy listening con-ditions.
Reverberation (RV) . Nine items describ-ing speech understanding in moderately reverberant rooms.
Reduced Cues (RC). Nine items describ-ing communication without visual cues or when intensity is low.
2. Does self-assessed hearing aid benefit vary significantly in different types of listening situations? If so, is either questionnaire more sensitive to situational differences?
In addition, means, standard deviations, and internal consistency reliability of the subscales were determined for each question-naire. The overall purpose was to evaluate the potential of the two questionnaires for clinical and research applications in self-assessment of hearing aid benefit.
METHOD
n the PHAP, each item is a statement, such as "I find that most people speak too softly ."
The respondent's task is to indicate the fre-
Background Noise (BN) . Sixteen items describing speech understanding in the presence of multitalker babble or other environmental competing noise.
Averseness of Sounds (AV) . Twelve items describing negative reactions to environ-mental sounds .
Distortion of Sounds (DS) . Six items de-scribing the quality of voices and other sounds .
Questionnaires
One questionnaire was very similar to the PHAP and was dubbed the Profile of Hearing Aid Benefit (PHAB) . The wording of items was
136
Patient-Assessed Benefit/Cox et al
unchanged and all 66 items were used . In the PHAP, the items are preceded by the stem "When I wear my hearing aid:" . In the PHAB, this stem was deleted and, instead, two sets of response alternatives were provided, designated "with my hearing aid" and "without my hearing aid." Subjects selected the best answer from each set of alternatives in responding to each item . A portion of the questionnaire is repro-duced in Appendix A, for illustration .
In the second questionnaire, subjects were required to estimate the proportion of speech understood in each situation described. This questionnaire was named the Intelligibility Rating Improvement Scale (IRIS) . Each item was provided with a response scale from 0 to 100 and the subject was required to mark the scale twice, once to estimate understanding without a hearing aid and again to estimate under-standing with a hearing aid. A portion of the IRIS is reproduced in Appendix B, for illustra-tion .
Subjective intelligibility estimations simi-lar to those used for the IRIS have been used extensively in hearing aid research . Typically, the subject has listened to a passage of con-nected speech and, immediately thereafter, es-timated the proportion of it that was under-stood. This approach has provided valid and reliable measures of speech intelligibility in laboratory situations (Speaks et al, 1972 ; Cox and McDaniel,1984) . The Speech Intelligibility Rating (SIR) test (Cox and McDaniel,1989) has been developed to utilize subjective intelligibil-ity estimations in clinical hearing aid evalua-tions. We reasoned that self-assessed benefit obtained using this type of response mode could potentially be directly compared with objective measurements of intelligibility obtained in the clinic or laboratory . Thus, with the IRIS, the present study explored the use of subjective intelligibility estimations for recalled speech stimuli.
For the IRIS, each item of the PHAP was slightly reworded. Whereas the original item made a statement about functioning in a situa-tion, the reworded item only described the situ-ation. Thus, the original item "I miss a lot of information when I'm listening to a lecture" was reworded to read "Listening to information given during a lecture." Some PHAP items, principally those dealing with responses to en-vironmental sounds, could not be appropriately reworded for the IRIS format . These were omit-ted. Furthermore, recall that the PHAP FT subscale describes communication in easy lis-
tening conditions whereas the EC subscale de-scribes the effort involved in this communica-tion . In the rewording process necessary to create the IRIS, the distinction between items contributing to the FT and EC subscales disap-peared . Thus, although the two subscales were retained in the IRIS, they both evaluated speech understanding in relatively easy listening situ-ations . The final number of items was 47 .
Subjects
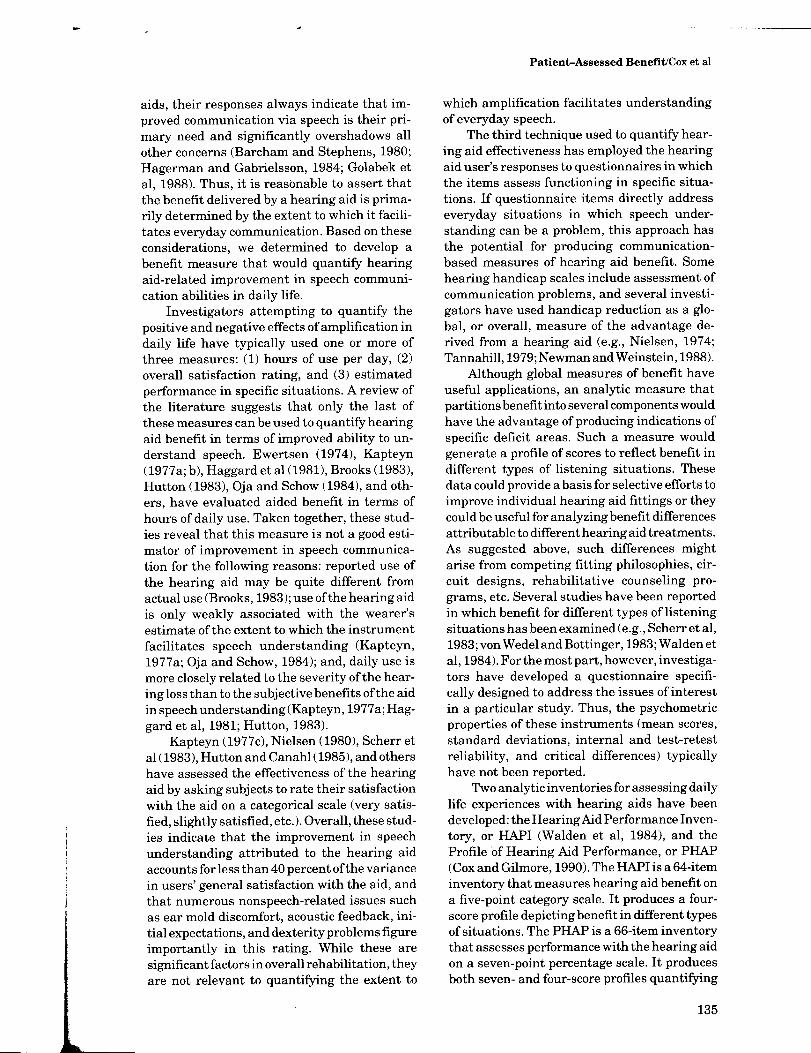
The two questionnaires were completed by 42 hearing aid users. The mean age of the group was 69 years. Ages were distributed as follows: 35 to 49 years = 2 ; 50 to 64 years = 9; and more than 65 years = 31 . Reported hearing aid use was: < 1 hr/day = 5 percent; 1 to 7 hr/day = 52 percent, and 8 to 16 hr/day = 43 percent. Re-ported hearing aid experience was : 6 wk to 11 mo = 57 percent; 1 to 10 yr = 31 percent, and more than 10 yr = 12 percent. Information about hearing loss extent and configuration was available for 39 (93%) of these individuals. These data are given in Table 1. As the Table shows, most of the subjects had mild or moder-ate hearing losses . Audiogram slopes ranged from flat to steep.
Procedure
Subjects completed the two questionnaires by mail . Names of 100 potential subjects were compiled from the files of a VA medical center and a community speech and hearing center . The only selection requirement was that sub-jects were known to have been fitted with new or replacement hearing aid(s) within the past few years. These individuals received the initial mailing consisting of one of the two question-
Table 1 Classification of Hearing Losses
Slope
SRT <6 6-14 >14 Total
<40 15 26 26 67 40-60 15 10 5 30 >60 3 0 0 3 Total 33 36 31 100
Data are for 93% of the subjects . Data are in percentages and depict functioning of the
better ear of each subject . SRT = speech reception threshold for spondee words
(dI3 HL re ANSI, 1989) . Slope = slope of audiogram from 500 to 4000 Hz in dB/octave .
137

Journal of the American Academy of Audiology/Volume 2, Number 3, July 1991
naires (randomly chosen) and a letter asking if they would be willing to complete both ques-tionnaires. Subjects were informed that they were eligible for the study if they had enough experience with their hearing aid to have formed an opinion about its effectiveness . They were not required to be frequent or satisfied hearing aid wearers. Subjects who completed and re-turned the first questionnaire were sent the second to complete . Usable data were obtained from 42 subjects as described above.
100
80
60
40
20
RESULTS
T he PHAB questionnaire yielded two re-sponses (aided and unaided) to each of 66
items, scored in terms of the percentage of time that the described situation presented prob-lems . The 66 items were distributed among seven subscales as previously described. The IRIS questionnaire yielded two responses (aided and unaided) to each of 47 items, scored in terms of estimated speech intelligibility, in percent, in the situations described. The items were distributed among five subscales (as noted earlier, PHAP subscales relating to environ-mental sounds were not represented in this questionnaire) .
For each questionnaire, each subject's subscale scores were determined for both aided and unaided responses. Mean aided and un-aided subscale scores for each questionnaire are illustrated in Figures 1 and 2 . Error bars depict 1 standard deviation (SD) . Multiple T-tests with alpha level = 0.01 revealed that in both questionnaires, all subscales except DS (distortion, PHAB only) yielded a significant difference between mean aided and unaided responses.
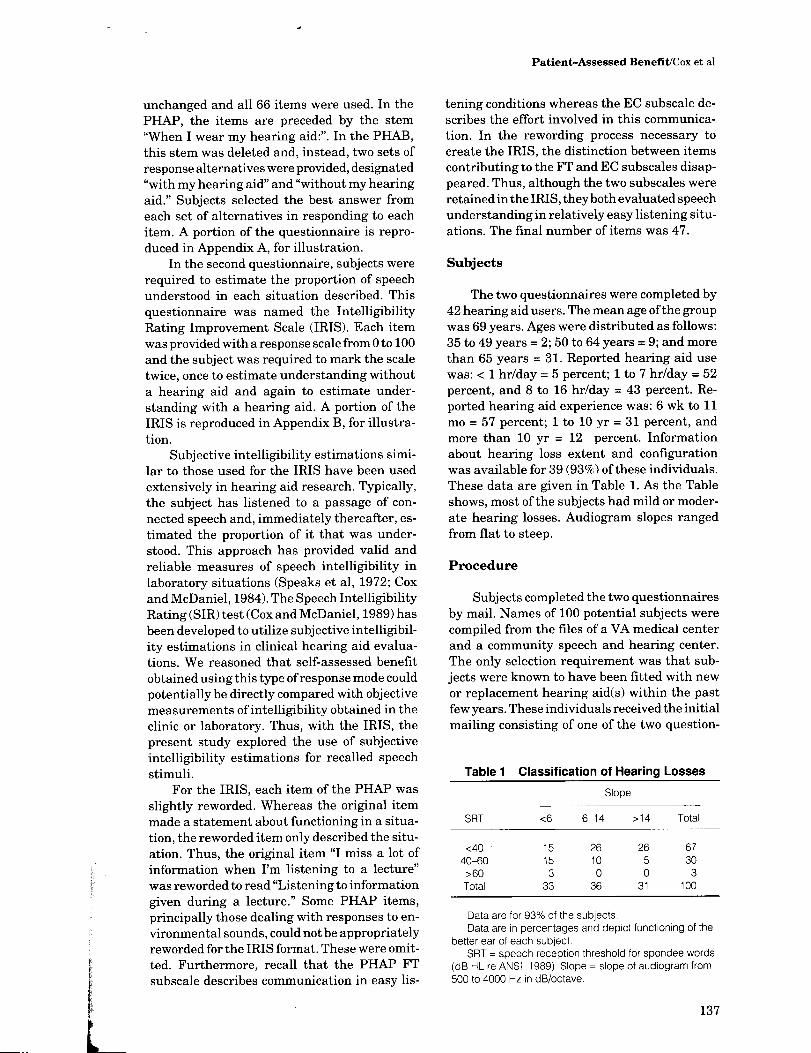
For the PHAB data, benefit for each subscale was derived by subtracting aided scores from unaided scores . Thus, PHAB benefit scores ex-pressed the percent of time that performance was improved when the hearing aid was worn . For the IRIS data, benefit was derived by sub-tracting unaided scores from aided scores . Thus, IRIS benefit scores reflected estimated improve-ment in intelligibility when the hearing aid was worn . Mean benefit scores for the two invento-ries are compared in Figure 3. The two PHAB subscales addressing perception of environmen-tal sounds, DS and AV, are illustrated in Figure 3 for completeness . Although DS showed no significant change from unaided to aided condi-tions, AV (aversiveness of environmental
0 FT EC RV RC BN DS AV
SUBSCALE
Figurel Mean "with hearing aid" and "without hearing
aid" scores for each of the subscales of the PHAB . Error
bars depict 1 SD . FT = Familiar Talkers, EC = Ease of
Communication, RV = Reverberation, RC = Reduced
Cues, BN = Background Noise, DS = Distortion of Sounds,
AV = Aversiveness of Sounds .
/\ 100
OC I I J
80 I m r I 60
J W F_ z 40 0 W 0 UNAIDED H Q 20 V AIDED
E_ V) w i i i i i 0
F7 EC RV RC BN
SUBSCALE
Figure2 Mean "with hearing aid" and "without hearing
aid" scores for each of the subscales of the IRIS . Error bars
depict 1 SD . FT = Familiar Talkers, EC = Ease of Commu-
nication, RV = Reverberation, RC = Reduced Cues, BN =
Background Noise.
sounds) registered a large decrement when aided performance was compared to unaided performance. Because there were no correspond-ing IRIS subscales, data for DS and AV could not be used in the comparisons between the two questionnaires reported below.
Both questionnaires yielded substantial benefit for all five speech communication
138
Patient-Assessed Benefit/Cox et al
60
w w z w m
40
20
0
-20
-40
FT EC RV RC BN DS AV
SUBSCALE
Figure 3 Mean hearing aid benefit for each subscale of the PHAB and the IRIS . Error bars depict 1 SD . FT Familiar Talkers, EC = Ease of Communication, RV = Reverberation, RC = Reduced Cues, BN = Background Noise, DS = Distortion of Sounds, AV = Aversiveness of Sounds .
subscales (FT, EC, RV, RC, and BN). However, the pattern of benefit appeared different for the two questionnaires . For the PHAB, maximum benefit was seen for the two subscales evaluat-ing speech communication in relatively easy listening conditions (EC and FT), and for the RV subscale . For the IRIS, maximum benefit was seen for the three subscales evaluating speech understanding in relatively difficult listening conditions (RV, RC, and BN). To explore the significance of these apparently different out-comes, the benefit data were entered into a repeated-measures analysis of variance with variables for questionnaire (PHAB and IRIS) and subscale (five) . The results indicated that the mean PHAB benefit of 29.7 percent was significantly less than the mean IRIS benefit of 44.5 percent (F[1,41] = 21.13, p < 0.01) . There was also a significant main effect for subscale (F[4,164] = 3.2, p = 0.01) and a significant interaction between questionnaire and subscale (F[4,164] = 6.9, p < 0.01) . The interaction was further explored using the Student-Newman-Keuls test (a = 0.05) . The results revealed that for the PHAB, subscales FT, EC, and RV pro-duced significantly more hearing aid benefit than subscales RC and BN. For the IRIS, on the other hand, there were no significant differ-ences in benefit across the five subscales.
The benefit data were further evaluated to determine whether individuals maintained their relative position on a given subscale across the two questionnaires : that is, whether those who produced relatively large benefit for a par-ticular subscale on one questionnaire also pro-duced relatively large benefit for the same subscale on the other questionnaire. Linear correlations were computed between PHAB and IRIS benefit data for each speech understand-ing subscale . The correlation coefficients were 0.76, 0.39, 0.34, 0.29, and 0.54 for subscales FT, EC, RV, RC, and BN, respectively . These corre-lations were significantly different from zero for FT, EC, and BN (df = 40, p < 0.01, 1-tailed test).
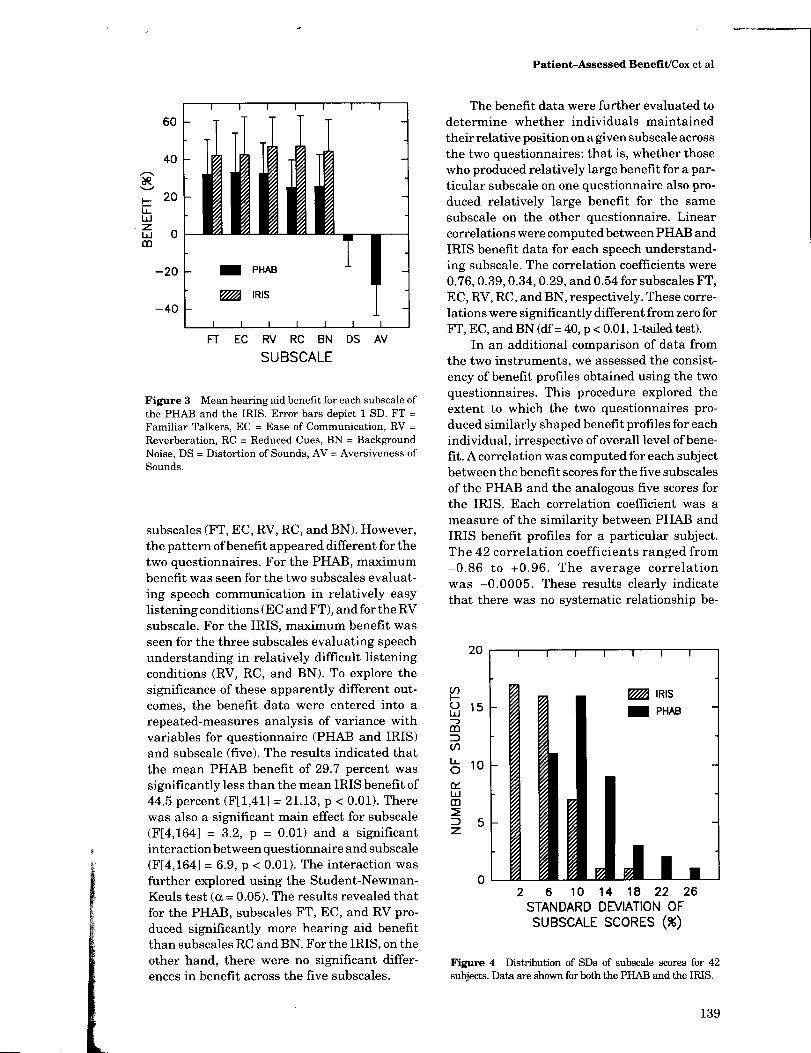
In an additional comparison of data from the two instruments, we assessed the consist-ency of benefit profiles obtained using the two questionnaires . This procedure explored the extent to which the two questionnaires pro-duced similarly shaped benefit profiles for each individual, irrespective of overall level of bene-fit . A correlation was computed for each subject between the benefit scores for the five subscales of the PHAB and the analogous five scores for the IRIS . Each correlation coefficient was a measure of the similarity between PHAB and IRIS benefit profiles for a particular subject. The 42 correlation coefficients ranged from -0.86 to +0 .96 . The average correlation was -0.0005 . These results clearly indicate that there was no systematic relationship be-
20
15
10
5
0 2 6 10 14 18 22 26 STANDARD DEVIATION OF SUBSCALE SCORES (%)
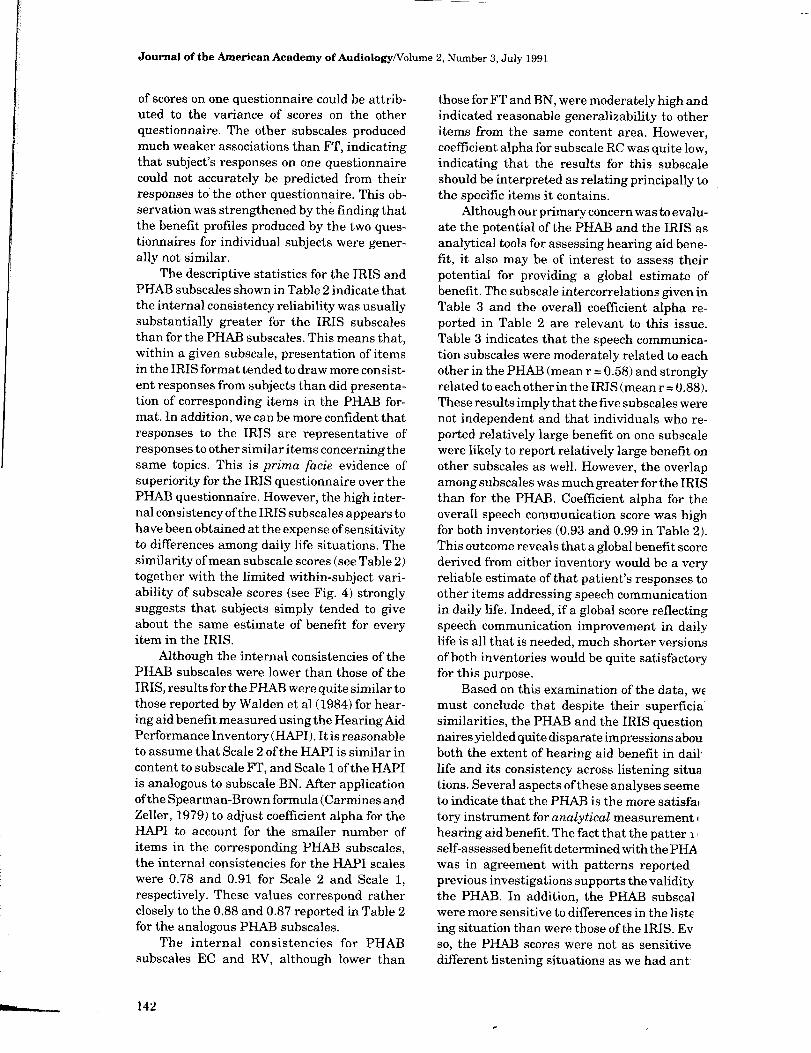
Figure 4 Distribution of SDs of subscale scores for 42 subjects. Data are shown for both the PHAB and the IRIS .
139
Journal of the American Academy of Audiology/Volume 2, Number 3, July 1991
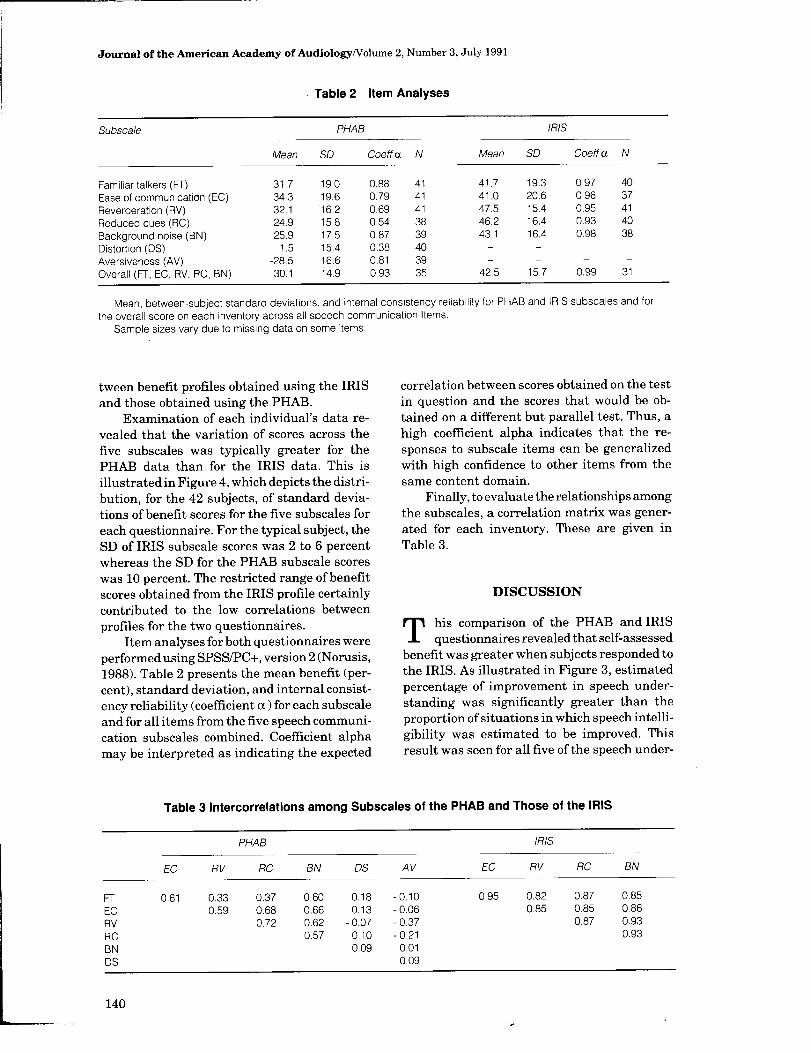
Table 2 Item Analyses
Subscale
Mean
PHAB
SD Coeff a N Mean
IRIS
SD Coeff a N
Familiar talkers (FT) 31 .7 19 .0 0 .88 41 41 .7 19 .3 0 .97 40 Ease of communication (EC) 34 .3 19 .6 0 .79 41 41 .0 20 .6 0 .96 37 Reverberation (RV) 32 .1 16 .2 0 .69 41 47.5 15 .4 0.95 41 Reduced cues (RC) 24 .9 15 .8 0 .54 38 46.2 16 .4 0.93 40 Background noise (BN) 25 .9 17 .5 0 .87 39 43 .1 16 .4 0.98 38 Distortion (DS) 1 .5 15 .4 0 .38 40 - - - - Aversiveness (AV) -28 .5 16 .6 0 .81 39 - - - - Overall (FT, EC, RV, RC, BN) 30 .1 14 .9 0.93 35 42 .5 15 .7 0.99 31
Mean, between-subject standard deviations, and internal consistency reliability for PHAB and IRIS subscales and for the overall score on each inventory across all speech communication Items .
Sample sizes vary due to missing data on some items .
tween benefit profiles obtained using the IRIS and those obtained using the PHAB.
Examination of each individual's data re-vealed that the variation of scores across the five subscales was typically greater for the PHAB data than for the IRIS data . This is illustrated in Figure 4, which depicts the distri-bution, for the 42 subjects, of standard devia-tions of benefit scores for the five subscales for each questionnaire . For the typical subject, the SD of IRIS subscale scores was 2 to 6 percent whereas the SD for the PHAB subscale scores was 10 percent. The restricted range of benefit scores obtained from the IRIS profile certainly contributed to the low correlations between profiles for the two questionnaires .
Item analyses for both questionnaires were performed using SPSS/PC+, version 2 (Norusis, 1988). Table 2 presents the mean benefit (per-cent), standard deviation, and internal consist-ency reliability (coefficient u. ) for each subscale and for all items from the five speech communi-cation subscales combined . Coefficient alpha may be interpreted as indicating the expected
correlation between scores obtained on the test in question and the scores that would be ob-tained on a different but parallel test . Thus, a high coefficient alpha indicates that the re-sponses to subscale items can be generalized with high confidence to other items from the same content domain .
Finally, to evaluate the relationships among the subscales, a correlation matrix was gener-ated for each inventory. These are given in Table 3 .
DISCUSSION
T his comparison of the PHAB and IRIS questionnaires revealed that self-assessed benefit was greater when subjects responded to the IRIS . As illustrated in Figure 3, estimated percentage of improvement in speech under-standing was significantly greater than the proportion of situations in which speech intelli-gibility was estimated to be improved . This result was seen for all five of the speech under-
Table 3 Intercorrelations among Subscales of the PHAB and Those of the IRIS
EC
PHAB
RV RC BN DS AV EC
IRIS
RV RC BN
FT 0.61 0 .33 0.37 0.60 0.18 -0.10 0.95 0.82 0.87 0 .85 EC 0.59 0.68 0.66 0.13 -0.06 0.85 0.85 0.86 RV 0.72 0.62 -0.07 -0.37 0.87 0.93 RC 0.57 0.10 -0.21 0.93 BN 0.09 0 .01 DS 0.09
140

Patient-Assessed Benefit/Cox et al
standing subscales. Because the two invento-ries contained items addressing the same daily life situations, using very similar wording, the outcome must be attributed to their different response formats.
At first, the results for the IRIS seem rather optimistic . The average subject indicated that, with amplification, he or she understands al-most 80 percent of the words spoken, even in difficult listening situations such as those pre-sented in the BN subscale (see Fig. 2) . Our experience suggests that elderly patients seen in an audiology clinic for hearing aid follow-up services do not seem as sanguine as these re-sults suggest (however, patients who present themselves for follow-up services maybe mostly representative of relatively unsatisfied hearing aid users) . The data for the PHAB, on the other hand, seem distinctly less upbeat, with average subjects indicating that they have trouble com-municating in difficult listening situations about 40 percent ofthe time (see Fig. 1) . Nevertheless, it is not impossible to reconcile the two sets of results. For instance, hearing aid wearers may understand 95 percent (no communication prob-lems) of the words spoken in 60 percent of situations with background noise, and only about 55 percent (definite communication prob-lems) of the words spoken in the other 40 percent of background noise situations . These circumstances would be consistent with the data .
The two questionnaires also differed sig-nificantly in their sensitivity to the different types of listening situations addressed. The PHAB produced scores that were indicative of significantly different benefit in different situ-ations whereas the IRIS benefit scores were essentially independent of the listening envi-ronment. The literature provides several previ-ous investigations in which hearing aid benefit has been measured for a variety of everyday situations (e .g ., Nielsen, 1980 ; Scherr et al, 1983 ; and Walden et al, 1984). These studies suggest that situational differences do have an effect on hearing aid benefit, although the sta-tistical significance of observed benefit differ-ences has typically not been reported . In addi-tion, the earlier studies are consistent in re-porting that benefit in situations similar to those assessed by subscale FT is greater than benefit in situations similar to those assessed by subscale BN. Thus, the pattern of benefit measured by the PHAB was relatively similar to the results of previous investigators whereas this was not true for the IRIS data .
The finding that the IRIS questionnaire was relatively insensitive to situational differ-ences was surprising in view of the generally positive outcomes of previous studies in which speech understanding ability has been self-assessed on a percentage-like scale . Cox and McDaniel (1984) and McDaniel (1988) reported that this measurement approach was quite sensitive to differences in speech intelligibility produced by different hearing aids . Cox et al, (1991), determined that self-assessment ofhear-ing aid benefit was fairly accurate in a labora-tory setting. These outcomes supported the conjecture that the response format used in the IRIS would result in sensitive and accurate estimates ofbenefit in everyday life . The results of the present study did not support this hy-pothesis, suggesting that recollections of speech understanding in daily life are not as accurate as laboratory estimations that closely follow exposure to the speech in question .
In evaluating the results for the IRIS ques-tionnaire, three factors should be kept in mind . First, the above interpretation of the IRIS data involves the assumption that hearing aid bene-fit really does differ across different types of listening situations. This assumption is sup-ported by the previous investigations cited ear-lier. Second, the items for the IRIS were actu-ally adapted from a questionnaire (the PHAP) that had been developed using a different re-sponse format . This may explain the general lack of sensitivity to different situations seen with the IRIS in the present study. It is possible that a new questionnaire developed using the IRIS response format from the beginning would be more satisfactory . Third, examination of Figure 2 suggests that responses for subscales FT and EC in the aided condition may have been influenced by the upper limit of the response scale. Note that the mean aided scores for both subscales were near 90 percent, indicating that many subjects awarded themselves near maxi-mum scores for the items in these subscales. If this limit had not been present, it is possible that IRIS benefit scores would have been greater for the FT and EC subscales, which might have produced an outcome more similar to that seen for the PHAB.
Further evidence of a fundamental differ-ence between the two questionnaires was seen in the correlational analyses . There was only one subscale, FT, for which the scores on the PHAB and the IRIS were even moderately re-lated. The correlation of 0.76 for subscale FT indicated that about 58 percent of the variance
141
Journal of the American Academy of Audiology/Volume 2, Number 3, July 1991
of scores on one questionnaire could be attrib-uted to the variance of scores on the other questionnaire. The other subscales produced much weaker associations than FT, indicating that subject's responses on one questionnaire could not accurately be predicted from their responses to the other questionnaire. This ob-servation was strengthened by the finding that the benefit profiles produced by the two ques-tionnaires for individual subjects were gener-ally not similar.
The descriptive statistics for the IRIS and PHAB subscales shown in Table 2 indicate that the internal consistency reliability was usually substantially greater for the IRIS subscales than for the PHAB subscales . This means that, within a given subscale, presentation of items in the IRIS format tended to draw more consist-ent responses from subjects than did presenta-tion of corresponding items in the PHAB for-mat. In addition, we can be more confident that responses to the IRIS are representative of responses to other similar items concerning the same topics . This is prima facie evidence of superiority for the IRIS questionnaire over the PHAB questionnaire. However, the high inter-nal consistency ofthe IRIS subscales appears to have been obtained at the expense of sensitivity to differences among daily life situations . The similarity of mean subscale scores (see Table 2) together with the limited within-subject vari-ability of subscale scores (see Fig. 4) strongly suggests that subjects simply tended to give about the same estimate of benefit for every item in the IRIS .
Although the internal consistencies of the PHAB subscales were lower than those of the IRIS, results for the PHAB were quite similar to those reported by Walden et al (1984) for hear-ing aid benefit measured using the Hearing Aid Performance Inventory (HAPI) . It is reasonable to assume that Scale 2 of the HAPI is similar in content to subscale FT, and Scale 1 of the HAPI is analogous to subscale BN. After application ofthe Spearman-Brown formula (Carmines and Zeller, 1979) to adjust coefficient alpha for the HAPI to account for the smaller number of items in the corresponding PHAB subscales, the internal consistencies for the HAPI scales were 0.78 and 0.91 for Scale 2 and Scale 1, respectively . These values correspond rather closely to the 0.88 and 0.87 reported in Table 2 for the analogous PHAB subscales.
The internal consistencies for PHAB subscales EC and RV, although lower than
those for FT and BN, were moderately high and indicated reasonable generalizability to other items from the same content area . However, coefficient alpha for subscale RC was quite low, indicating that the results for this subscale should be interpreted as relating principally to the specific items it contains .
Although our primary concern was to evalu-ate the potential of the PHAB and the IRIS as analytical tools for assessing hearing aid bene-fit, it also may be of interest to assess their potential for providing a global estimate of benefit. The subscale intercorrelations given in Table 3 and the overall coefficient alpha re-ported in Table 2 are relevant to this issue. Table 3 indicates that the speech communica-tion subscales were moderately related to each other in the PHAB (mean r = 0.58) and strongly related to each other in the IRIS (mean r = 0.88) . These results imply that the five subscales were not independent and that individuals who re-ported relatively large benefit on one subscale were likely to report relatively large benefit on other subscales as well . However, the overlap among subscales was much greater for the IRIS than for the PHAB. Coefficient alpha for the overall speech communication score was high for both inventories (0.93 and 0.99 in Table 2) . This outcome reveals that a global benefit score derived from either inventory would be a very reliable estimate of that patient's responses to other items addressing speech communication in daily life . Indeed, if a global score reflecting speech communication improvement in daily life is all that is needed, much shorter versions of both inventories would be quite satisfactory for this purpose.
Based on this examination of the data, we must conclude that despite their superficia similarities, the PHAB and the IRIS question naires yielded quite disparate impressions abou both the extent of hearing aid benefit in dail; life and its consistency across listening situa tions. Several aspects of these analyses seeme to indicate that the PHAB is the more satisfai tory instrument for analytical measurement i hearing aid benefit. The fact that the patter i self-assessed benefit determined with the PHA was in agreement with patterns reported previous investigations supports the validity the PHAB. In addition, the PHAB subsea] were more sensitive to differences in the liste ing situation than were those of the IRIS. Ev so, the PHAB scores were not as sensitive different listening situations as we had ant:
142
Patient-Assessed Benefit/Cox et al
pated since they yielded only two significantly different groups of speech communication subscales. It should be noted that the data for individual subjects displayed many different benefit profile shapes across the five speech communication subscales . All of the subscales displayed sizable between-subject variations (see Table 2), indicating that some individuals reported considerably more benefit than oth-ers. Further research is needed to define the limits within which different profiles can val-idly be interpreted as indicative of real differ-ences among subjects and among subscales within a subject.
Potential research applications for the speech communication subscales of the PHAB include: (1) use as an outcome measure to evalu-ate the relative effectiveness of different hear-ing aid treatments, and (2) use as a criterion variable to evaluate the accuracy of objective methods of predicting hearing aid benefit, per-haps based on pre-fitting clinical test data . Moreover, individual responses to the PHAB may be useful in identifying unsatisfactory as-pects of existing hearing aid fittings . For exam-ple, adequate benefit in quiet environments (FT and EC subscales) combined with unusually low benefit in background noise (BN subscale) may be an indication of a need for a different frequency response, or perhaps a multi-memory instrument that can be programmed differently for different listening environments . An unex-pectedly low score for speech understanding in reverberant or reduced cue environments (RV and RC subscales) may suggest a need for addi-tional counselling on strategies to compensate for hearing impairment .
The ability of the PHAB questionnaire to quantify hearing-aid related changes in percep-tion of environmental sounds is also a positive feature . The distortion subscale (DS) did not seem to yield useful information due to a gen-eral lack of aided effect and a low internal consistency reliability coefficient . However, the aversiveness subscale (AV) revealed that hear-ing aid wearers in general report a significant increase in negative responses to environmen-tal sounds when they wear their instruments. The internal consistency reliability of this subscale was quite high indicating that respon-ses are generally fairly representative of that individual's responses to other items about per-ception of environmental sounds . In addition, the dispersion of AV decrement scores across subjects was quite wide, as shown in Table 2,
indicating that some individuals report far more aversiveness caused by amplification than oth-ers. This subscale may prove useful for assess-ing the effects in daily life of hearing aid satu-ration variables, or the effectiveness of noise-reduction schemes .
Although results for the IRIS were not encouraging regarding its potential as an ana-lytical instrument, the data strongly suggest that a shortened version of the IRIS would yield a reliableglobal estimate of self-assessed change in speech communication due to amplification. For example, application of the Spearman-Brown formula to the overall coefficient alpha for the IRIS suggests that a 10-item IRIS would have a coefficient alpha of 0.95. Because the between-subject variation in overall IRIS scores was fairly large, as seen in Table 2, it would be expected that a wide range of global benefit scores would be obtained from clinic patients. Such a measure could have substantial poten-tial for clinical evaluation of hearing aid effec-tiveness .
Further research is needed to determine the test-retest reliability of hearing aid benefit measured using the PHAB and the IRIS. In addition, the effects of nonauditory variables on self-assessed benefit should be explored . It is possible, for example, that an individual who feels very negative about his or her hearing loss may tend to underestimate the benefit provided by a hearing aid. An understanding of the rela-tionships between nonauditory variables and self-assessed benefit may be important in inter-preting benefit data in both clinical and re-search applications .
Acknowledgment. This work was supported by funding from the Department of Veterans Affairs Rehabilitation Research and Development Service.
REFERENCES
ANSI . (1989) . American National Standard Specification for Audiometers. New York: American National Stand-ards Institute . ANSI S3.6-1989.
Barcham LJ, Stephens SDG. (1980) . The use of an open-
ended problems questionnaire in auditory rehabilitation. Br J Audiol 14:49-51 .
Brooks DN . (1983) . Use of post-aural aids by National Health Service patients. Audecibel Spring:21-27 .
Carhart R. (1946) . Tests for selection of hearing aids . Laryngoscope 56:780-794.
143
Journal of the American Academy of AudiologyNolume 2, Number 3, July 1991
Carmines EG, Zeller RA . (1979) . Reliability and Validity Assessment. Beverly Hills: Sage Publications .
Kapteyn TS. (1977c). Satisfaction with fitted hearing aids . 11 . Scand Audiol 6:171-177 .
Cox RM, Alexander GC, Rivera IM . (1991). Comparison of objective and subjective measures of speech intelligibility in elderly hearing-impaired listeners. J Speech Hear Res (in press) .
Cox RM, Gilmore C. (1990). Development of the Profile of Hearing Aid Performance (PHAP) . J Speech Hear Res 33:343-357.
Cox RM, McDaniel DM. (1984) . Intelligibility ratings of continuous discourse: application to hearing aid selection JAcoust SocAm 76:758-766 .
Cox RM, McDaniel DM. (1989) . Development ofthe Speech Intelligibility Rating (SIR) Test for Hearing Aid Compari-sons . J Speech Hear Res 32:347-352 .
Ewertsen HW. (1974) . Use of hearing aids (always, often, rarely, never) . Scand Audiol 3:173-176 .
Golabek W, Nowakowska M, Siwiec H, Stephens SDG. (1988) . Self-reported benefits of hearing aids by the hear-ing impaired . Br J Audiol 22:183-186 .
Hagerman B, Gabrielsson A. (1984). Questionnaires on Desirable Properties of Hearing Aids . Stockholm, Swe-den: Karolinska Inst . Report TA109.
Haggard MP, Foster JR, Iredale FE . (1981). Use and benefit of postaural aids in sensory hearing loss . Scand Audiol 10:45-52 .
Hutton CL . (1983) . Hearing aid wear times for planning and intervention in aural rehabilitation. JAcad Rehabil Audiol 16:182-201 .
Hutton CL, Canahl JA. (1985) . Scaling patient reports of hearing aid benefit. J Aud Res 25:255-269 .
Kapteyn TS . (1977a). Factors in the appreciation of a prosthetic rehabilitation . Audiology 16:446-452.
Kapteyn TS . (1977b). Satisfaction with fitted hearing aids . I. Scand Audiol 6:147-156 .
McDaniel DM. (1988) . Evaluation of the Speech Intelligi-bility Rating (SIR) Test in Hearing Aid Selection. Unpub-lished Doctoral Dissertation . Memphis State University.
Nielsen HB . (1974) . Effect of monaural versus binaural hearing aid treatment. Scand Audiol 3:183-187 .
Nielsen HB . (1980) . Rehabilitation of hearing-impaired adults : use of and benefit from hearing aids . In : Taylor I, Markides A, eds. Disorders of Auditory Function . Vol. 3. New York : Academic Press, 249-256.
Newman CW, Weinstein BE . (1988) . The Hearing Handi-cap Inventory for the Elderly as a measure of hearing aid benefit. Ear Hear 9:81-85 .
Norusis MJ . (1988) . SPSSIPC + Advanced Statistics V2.0 . (Computer program Manual). Chicago, IL: SPSS Inc.
Oja GL, Schow RL. (1984) . Hearing aid evaluation based on measures of benefit, use, and satisfaction . Ear Hear 5 :77-86 .
Scherr CK, Schwartz DM, Montgomery AA . (1983) . Fol-low-up survey of new hearing aid users. JAcad Rehabil Audiol 16:202-209 .
Speaks C, Parker B, Harris C, Kuhl P. (1972) . Intelligibil-ity of connected discourse. J Speech Hear Res 15:590-602 .
Tannahill JC . (1979). The Hearing Handicap Scale as a measure of hearing aid benefit. J Speech Hear Disord XLIV:91-99 .
von Wedel H, Bottinger M. (1983). Screening and assess-ment of the "social hearing ability" in patients wearing hearing aids. Part 1. Audiol Acoust 22:134-149 .
Walden BE, Demorest ME, Hepler EL . (1984) . Self-report approach to assessing benefit derived from amplification . J Speech Hear Res 27:49-56 .
Patient-Assessed Benefit/Cox et al
APPENDIX A
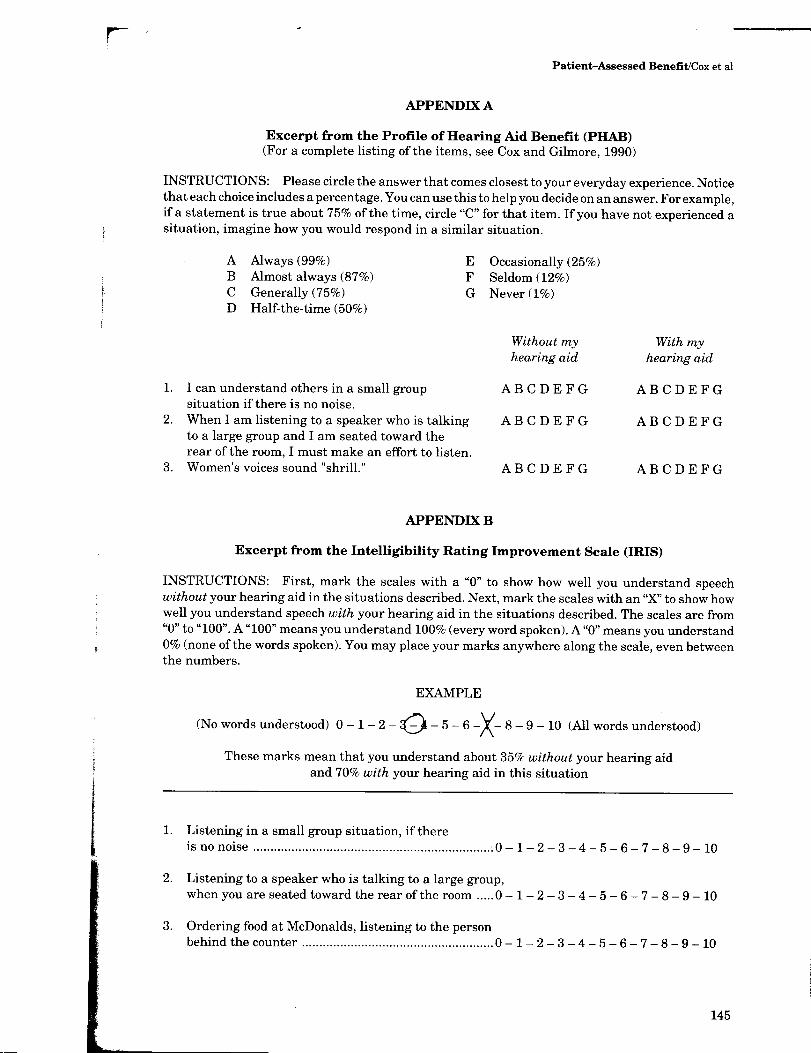
Excerpt from the Profile of Hearing Aid Benefit (PHAB) (For a complete listing of the items, see Cox and Gilmore, 1990)
INSTRUCTIONS : Please circle the answer that comes closest to your everyday experience . Notice that each choice includes a percentage . You can use this to help you decide on an answer . For example, if a statement is true about 75% of the time, circle "C" for that item . If you have not experienced a situation, imagine how you would respond in a similar situation.
A Always (99%) E Occasionally (25%) B Almost always (87%) F Seldom (12%) C Generally (75%) G Never (1%) D Half-the-time (50%)
Without my With my hearing aid hearing aid
1. I can understand others in a small group A B C D E F G A B C D E F G situation if there is no noise.
2. When I am listening to a speaker who is talking A B C D E F G A B C D E F G to a large group and I am seated toward the rear of the room, I must make an effort to listen .
3 . Women's voices sound "shrill ." A B C D E F G A B C D E F G
APPENDIX B
Excerpt from the Intelligibility Rating Improvement Scale (IRIS)
INSTRUCTIONS : First, mark the scales with a "0" to show how well you understand speech without your hearing aid in the situations described. Next, mark the scales with an "X" to show how well you understand speech with your hearing aid in the situations described. The scales are from "0" to "100". A "100" means you understand 100% (every word spoken) . A "0" means you understand 0% (none of the words spoken). You may place your marks anywhere along the scale, even between the numbers.
EXAMPLE
(No words understood) 0 - 1- 2 - ~(-4 - 5 - 6 -X- 8 - 9 - 10 (All words understood)
These marks mean that you understand about 35% without your hearing aid and 70% with your hearing aid in this situation
1. Listening in a small group situation, if there is no noise . . . . . . . . . . . . . . . . . . . . . . . . . . . . . . . . . . . . . . . . . . . . . . . . . . . . . . . . . . . . . . . . . . . ..0-1-2-3-4-5-6-7-8-9-10
2. Listening to a speaker who is talking to a large group, when you are seated toward the rear of the room . . . . . 0-1-2-3-4-5-6-7-8-9-10
3. Ordering food at McDonalds, listening to the person behind the counter . . . . . . . . . . . . . . . . . . . . . . . . . . . . . . . . . . . . . . . . . . . . . . . . . . . . . ..0-1-2-3-4-5-6-7-8-9-10