Embed Size (px)
Citation preview

Comparison of V50 Shot Placement on Final Outcome
by R Kinsler and J Collins
ARL-RP-0506 November 2014
A reprint from Proceedings of the PASS 2012 Personal Armour Systems Symposium, Nuremberg, Germany, 17–20 September 2012.
Approved for public release; distribution is unlimited.

NOTICES
Disclaimers The findings in this report are not to be construed as an official Department of the Army position unless so designated by other authorized documents. Citation of manufacturer’s or trade names does not constitute an official endorsement or approval of the use thereof. Destroy this report when it is no longer needed. Do not return it to the originator.

Army Research Laboratory Aberdeen Proving Ground, MD 21005-5068
ARL-RP-0506 November 2014
Comparison of V50 Shot Placement on Final Outcome
R Kinsler and J Collins Survivability/Lethality Analysis Directorate, ARL
A reprint from Proceedings of the PASS 2012 Personal Armour Systems Symposium, Nuremberg, Germany, 17–20 September 2012.
Approved for public release; distribution is unlimited.
ii
REPORT DOCUMENTATION PAGE Form Approved OMB No. 0704-0188
Public reporting burden for this collection of information is estimated to average 1 hour per response, including the time for reviewing instructions, searching existing data sources, gathering and maintaining the data needed, and completing and reviewing the collection information. Send comments regarding this burden estimate or any other aspect of this collection of information, including suggestions for reducing the burden, to Department of Defense, Washington Headquarters Services, Directorate for Information Operations and Reports (0704-0188), 1215 Jefferson Davis Highway, Suite 1204, Arlington, VA 22202-4302. Respondents should be aware that notwithstanding any other provision of law, no person shall be subject to any penalty for failing to comply with a collection of information if it does not display a currently valid OMB control number. PLEASE DO NOT RETURN YOUR FORM TO THE ABOVE ADDRESS. 1. REPORT DATE (DD-MM-YYYY)
November 2014 2. REPORT TYPE
Reprint 3. DATES COVERED (From - To)
January 2012–September 2012 4. TITLE AND SUBTITLE
Comparison of V50 Shot Placement on Final Outcome 5a. CONTRACT NUMBER
5b. GRANT NUMBER
5c. PROGRAM ELEMENT NUMBER
6. AUTHOR(S)
R Kinsler and J Collins 5d. PROJECT NUMBER
5e. TASK NUMBER
5f. WORK UNIT NUMBER
7. PERFORMING ORGANIZATION NAME(S) AND ADDRESS(ES)
US Army Research Laboratory ATTN: RDRL-SLB-D Aberdeen Proving Ground, MD 21005-5068
8. PERFORMING ORGANIZATION REPORT NUMBER
ARL-RP-0506
9. SPONSORING/MONITORING AGENCY NAME(S) AND ADDRESS(ES)
10. SPONSOR/MONITOR'S ACRONYM(S)
11. SPONSOR/MONITOR'S REPORT NUMBER(S)
12. DISTRIBUTION/AVAILABILITY STATEMENT
Approved for public release; distribution is unlimited.
13. SUPPLEMENTARY NOTES
A reprint from Proceedings of the PASS 2012 Personal Armour Systems Symposium, Nuremberg, Germany, 17–20 September 2012. 14. ABSTRACT
When characterizing ballistic performance of armor materials, V50 is a standard performance metric to consider. The V50 is the velocity at which a given projectile is expected to completely penetrate the material 50% of the time. The definition of a fair hit per MIL-STD-662F regarding shot placement states that the projectile must impact at least two projectile diameters away from any previous impact or disturbed area resulting from an impact. While this may work with ceramics or metal armor, it is inappropriate for use on composite armors like ultra-high-molecular-weight polyethylene (UHMWPE). In V50 testing of those types of materials, large delaminations may occur that influence the results. This report will expose the shortcomings of placing shots that result in delamination overlap in addition to other effects not mentioned in MIL-STD-662F. It will illustrate the possible differences in V50 results between virgin armor panels shot with and without resultant delamination overlap. These differences are important because an armor with a reported V50 resulting from numerous impacts in the same delamination area might give inaccurate results leading to false confidence as to the level of protection offered by the armor to the first impact. Generally speaking, with these types of composite armors, the V50 is lower when delamination overlap is avoided compared to the V50 resulting when the overlaps occur. Without knowledge of shot placement, a proper evaluation of materials may not be possible. 15. SUBJECT TERMS
ballistics, V50 test, logistic regression, statistical inference, hypothesis tests
16. SECURITY CLASSIFICATION OF: 17. LIMITATION OF ABSTRACT
UU
18. NUMBER OF PAGES
14
19a. NAME OF RESPONSIBLE PERSON J Collins
a. REPORT
Unclassified b. ABSTRACT
Unclassified c. THIS PAGE
Unclassified 19b. TELEPHONE NUMBER (Include area code) 410-278-6832
Standard Form 298 (Rev. 8/98) Prescribed by ANSI Std. Z39.18
1
Comparison of V50 Shot Placement on Final Outcome R. Kinsler1, J. Collins2 1 US Army Research Lab, RDRL-SLB-D, Bldg 1196, APG, MD 21005, [email protected] 2 US Army Research Lab, RDRL-SLB-D, Bldg 1068, APG, MD 21005 Abstract. When characterizing ballistic performance of armor materials, V50 is a standard performance metric to consider. The V50 is the velocity at which a given projectile is expected to completely penetrate the material 50% of the time. The definition of a fair hit per MIL-STD-662F regarding shot placement states that the projectile must impact at least two projectile diameters away from any previous impact or disturbed area resulting from an impact. While this may work with ceramics or metal armor, it is inappropriate for use on composite armors like ultra-high-molecular-weight polyethylene (UHMWPE). In V50 testing of those types of materials, large delaminations may occur that influence the results. This paper will expose the shortcomings of placing shots that result in delamination overlap in addition to other effects not mentioned in MIL-STD-662F. It will illustrate the possible differences in V50 results between virgin armor panels shot with and without resultant delamination overlap. These differences are important because an armor with a reported V50 resulting from numerous impacts in the same delamination area might give inaccurate results leading to false confidence as to the level of protection offered by the armor to the first impact. Generally speaking, with these types of composite armors, the V50 is lower when delamination overlap is avoided compared to the V50 resulting when the overlaps occur. Without knowledge of shot placement, a proper evaluation of materials may not be possible.
1. BACKGROUND
When characterizing ballistic performance of armor materials, V50 is a standard performance metric to consider. The V50 is the velocity at which a given projectile is expected to completely penetrate the material 50% of the time.
For years, MIL-STD-662F [1] has been the accepted standard in the USA for V50 testing of materials. Recently there have been proposals to ballistically evaluate materials using different methodologies for obtaining V50 data. While each methodology has its strong-points, they do not completely address the fundamental issue of how to determine appropriate shot placement on different materials. This paper will mostly concentrate on the MIL-STD-662F method of determining V50s.
The definition of a fair hit per MIL-STD-662F regarding shot placement states that the projectile must impact at least two projectile diameters away from any previous impact or disturbed area resulting from an impact. STANAG-2920 is similar to MIL-STD-662F with the exception that the recommended distance is at least five projectile calibers from any previous impact. [2]. It also states that the impacted areas must be a sufficient distance such that the damaged areas don’t overlap, but doesn’t give guidance as to how to check for overlaps except for visually examining the impact points. While this may work with ceramic or metal armors, sometimes it is hard to visually determine damaged areas on composite armors like ultra-high-molecular-weight polyethylene (UHMWPE). In V50 testing of those types of composite materials, large delamination overlaps may occur that influence the results by making an armor appear to have a higher V50 than one where care has been taken to avoid the overlaps.
Over the years, when doing V50 testing of UHMWPE, we have qualitatively noticed that when delamination overlaps occur, the velocity it takes to get a complete penetration starts to rise. This paper documents a first attempt to quantify the potential change in V50 when delamination overlap takes place. It is a preliminary look at the problem and only uses three armor panels for input.
2. APPROACH
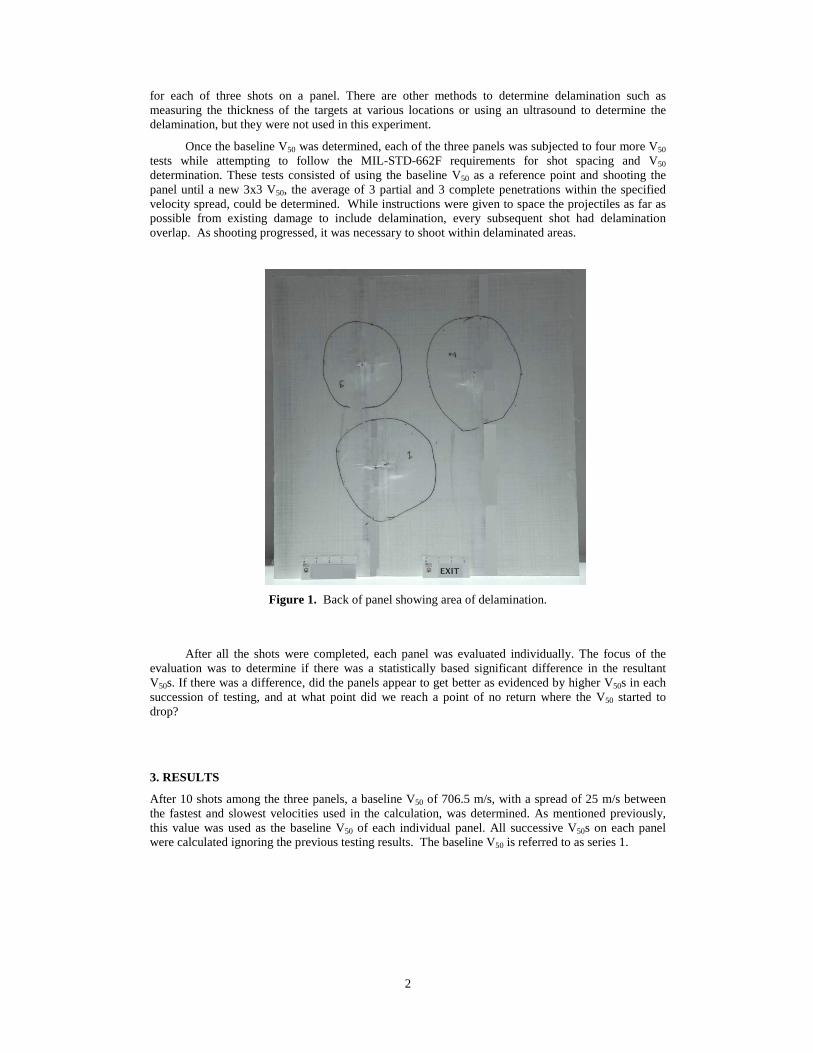
For the purpose of this test, three (3) UHMWPE panels from the same manufacture lot were chosen. An overall baseline V50 was determined by only shooting three or four impacts on each panel, ensuring that the resultant delaminations did not overlap. The size of the delamination was determined both acoustically and visually. It was determined acoustically by tapping around the edge of the damaged area and marking the spot where the sound changed. The visual determination was accomplished by placing the panels on a light table and observing the shadows. Figure 1 shows the area of delamination
2
for each of three shots on a panel. There are other methods to determine delamination such as measuring the thickness of the targets at various locations or using an ultrasound to determine the delamination, but they were not used in this experiment.
Once the baseline V50 was determined, each of the three panels was subjected to four more V50 tests while attempting to follow the MIL-STD-662F requirements for shot spacing and V50 determination. These tests consisted of using the baseline V50 as a reference point and shooting the panel until a new 3x3 V50, the average of 3 partial and 3 complete penetrations within the specified velocity spread, could be determined. While instructions were given to space the projectiles as far as possible from existing damage to include delamination, every subsequent shot had delamination overlap. As shooting progressed, it was necessary to shoot within delaminated areas.
Figure 1. Back of panel showing area of delamination.
After all the shots were completed, each panel was evaluated individually. The focus of the evaluation was to determine if there was a statistically based significant difference in the resultant V50s. If there was a difference, did the panels appear to get better as evidenced by higher V50s in each succession of testing, and at what point did we reach a point of no return where the V50 started to drop?
3. RESULTS
After 10 shots among the three panels, a baseline V50 of 706.5 m/s, with a spread of 25 m/s between the fastest and slowest velocities used in the calculation, was determined. As mentioned previously, this value was used as the baseline V50 of each individual panel. All successive V50s on each panel were calculated ignoring the previous testing results. The baseline V50 is referred to as series 1.
3
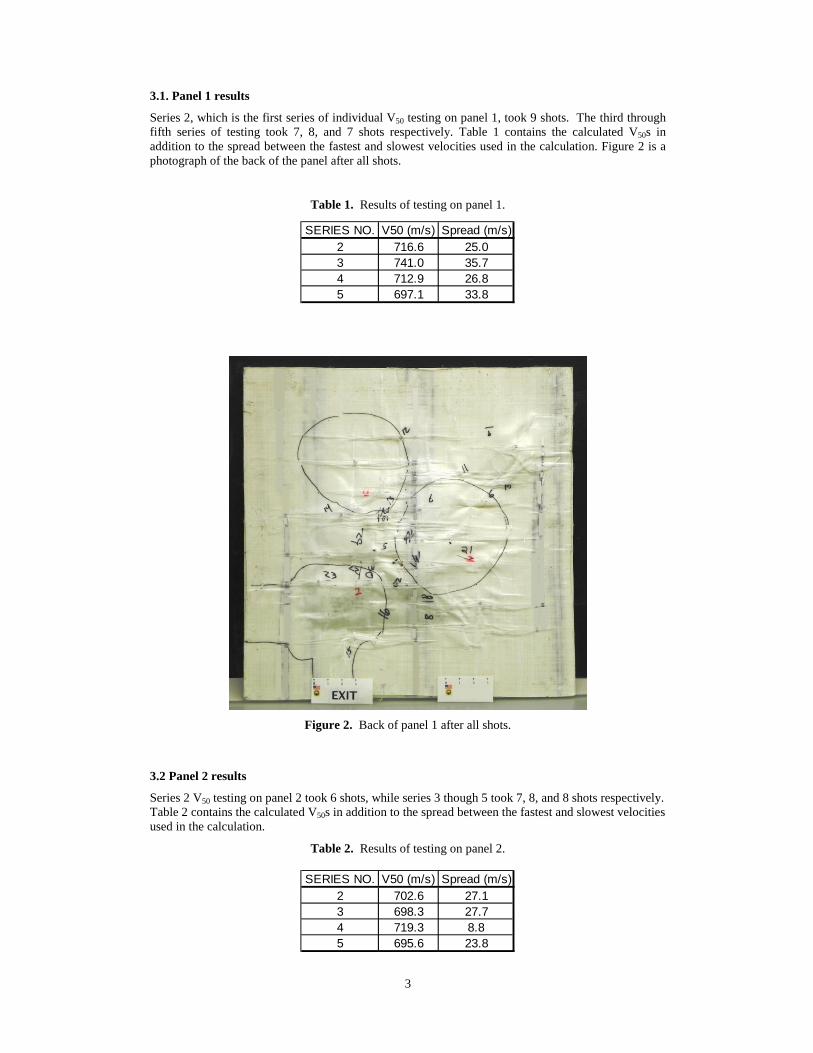
3.1. Panel 1 results
Series 2, which is the first series of individual V50 testing on panel 1, took 9 shots. The third through fifth series of testing took 7, 8, and 7 shots respectively. Table 1 contains the calculated V50s in addition to the spread between the fastest and slowest velocities used in the calculation. Figure 2 is a photograph of the back of the panel after all shots.
Table 1. Results of testing on panel 1.
Figure 2. Back of panel 1 after all shots.
3.2 Panel 2 results
Series 2 V50 testing on panel 2 took 6 shots, while series 3 though 5 took 7, 8, and 8 shots respectively. Table 2 contains the calculated V50s in addition to the spread between the fastest and slowest velocities used in the calculation.
Table 2. Results of testing on panel 2.
SERIES NO. V50 (m/s) Spread (m/s)2 716.6 25.03 741.0 35.74 712.9 26.85 697.1 33.8
SERIES NO. V50 (m/s) Spread (m/s)2 702.6 27.13 698.3 27.74 719.3 8.85 695.6 23.8
4
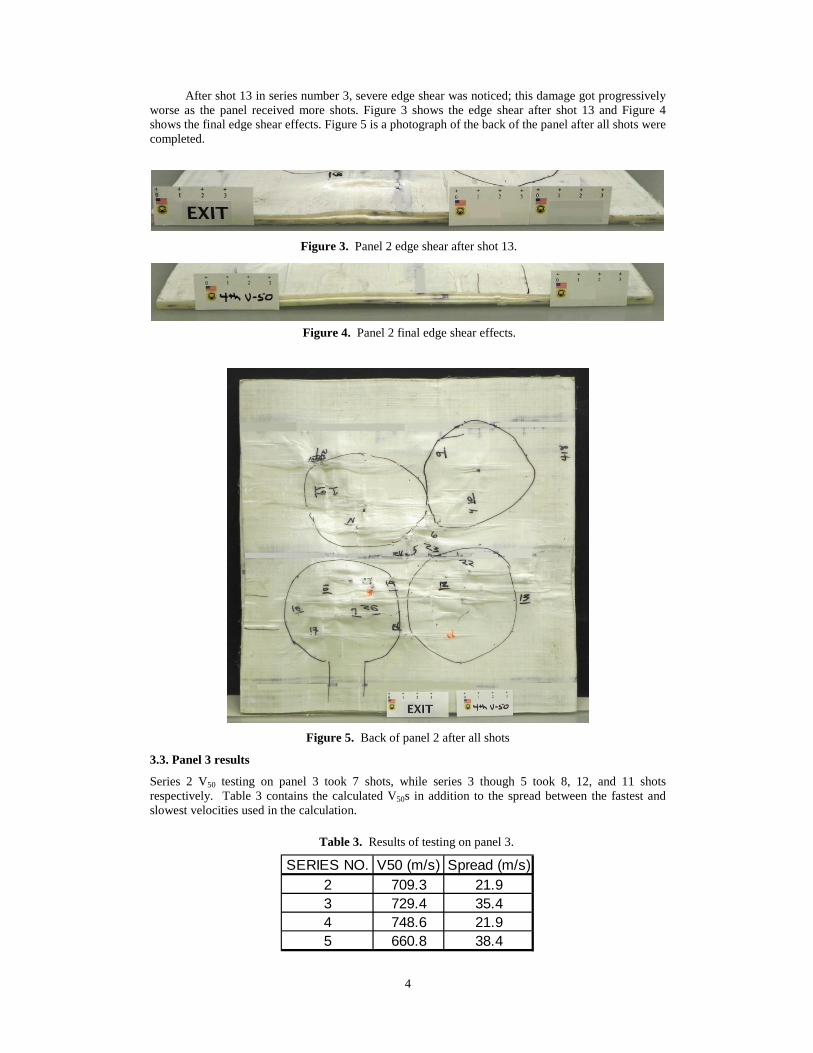
After shot 13 in series number 3, severe edge shear was noticed; this damage got progressively worse as the panel received more shots. Figure 3 shows the edge shear after shot 13 and Figure 4 shows the final edge shear effects. Figure 5 is a photograph of the back of the panel after all shots were completed.
Figure 5. Back of panel 2 after all shots
3.3. Panel 3 results
Series 2 V50 testing on panel 3 took 7 shots, while series 3 though 5 took 8, 12, and 11 shots respectively. Table 3 contains the calculated V50s in addition to the spread between the fastest and slowest velocities used in the calculation.
SERIES NO. V50 (m/s) Spread (m/s)2 709.3 21.93 729.4 35.44 748.6 21.95 660.8 38.4
Table 3. Results of testing on panel 3.
Figure 3. Panel 2 edge shear after shot 13.
Figure 4. Panel 2 final edge shear effects.
5
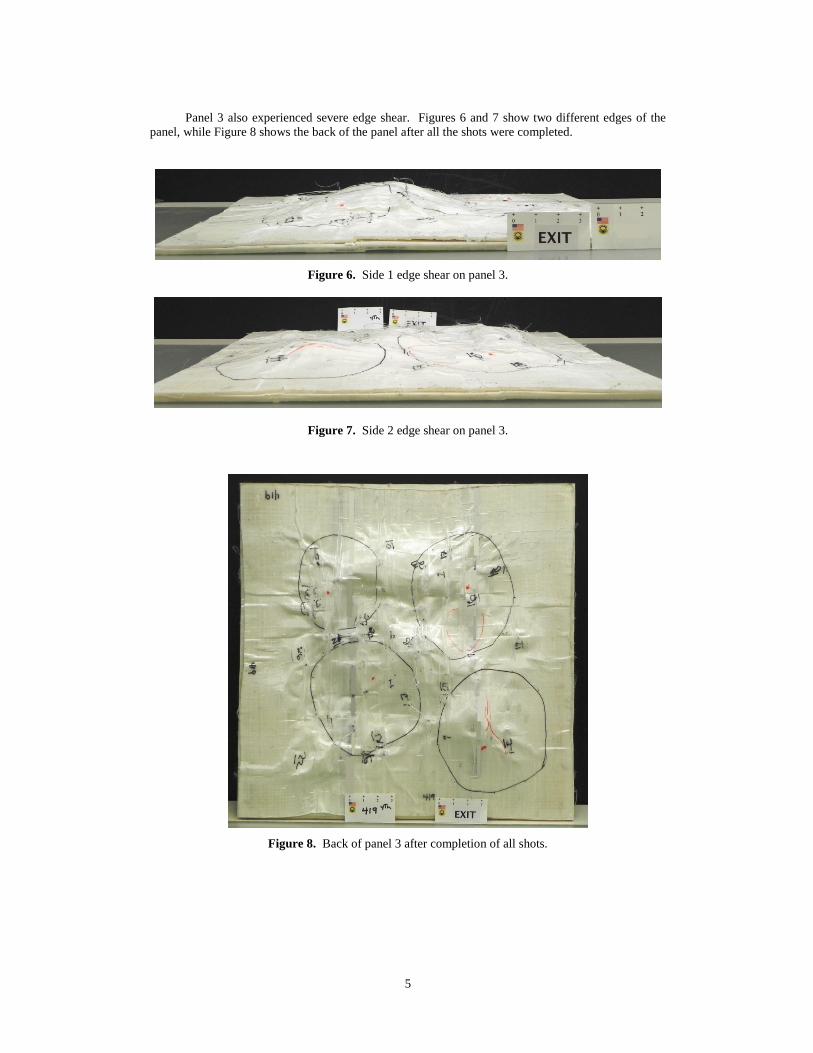
Panel 3 also experienced severe edge shear. Figures 6 and 7 show two different edges of the panel, while Figure 8 shows the back of the panel after all the shots were completed.
Figure 6. Side 1 edge shear on panel 3.
Figure 7. Side 2 edge shear on panel 3.
Figure 8. Back of panel 3 after completion of all shots.

6
4. ANALYSIS
Statistical testing for ballistic 𝑉50 comparison is conducted in the framework of logistic regression [3]. The response (penetration) 𝑦 is a binary random variable, taking values in {0,1}, and the probability of complete penetration is a function of velocity 𝑣.
𝑝 = Pr[𝑦 = 1 ∣ 𝑣] = 𝐺(𝑣). (1)
𝐺 is defined in terms of the standard logistic link (logistic cumulative distribution function)
𝐺𝑜(𝑧) = 11+exp(−𝑧)
(2)
or, equivalently, its inverse (logistic quantile) function
𝑄𝑜(𝑢) = log � 𝑢1−𝑢
� (3)
through parameterization 𝑧 = 𝑏0 + 𝑏1𝑣 = (𝑣 −𝑚)/𝑠 of the response probability
𝑝 = 𝐺(𝑣) = 𝐺𝑜(𝑏0 + 𝑏1𝑣) = 𝐺𝑜 �𝑣−𝑚𝑠� (4)
or, equivalently, its inverse
𝑄𝑜(𝑝) = 𝑏0 + 𝑏1𝑣 = 𝑣−𝑚𝑠
. (5)
The linear parameterization (𝑏0, 𝑏1) is used in computation and the location-scale parameterization (𝑚, 𝑠) is indicated in this application. They are related by 𝑠𝑏0 = −𝑚 and 𝑠𝑏1 = 1. Since 𝐺(𝑚) = 𝐺𝑜(0) = 0.5, it follows that 𝑚 = 𝑉50. Hence, inferences on the parameter 𝑚 are in fact inferences on the ballistic limit 𝑉50. Data consist of velocity and penetration pairs (𝑣1,𝑦1), … , (𝑣𝑛 ,𝑦𝑛). Let each 𝑝𝑖 = 𝐺(𝑣𝑖) = 𝐺𝑜(𝑧𝑖) where 𝑧𝑖 = 𝑏0 + 𝑏1𝑣𝑖 = (𝑣𝑖 − 𝑚)/𝑠. Estimation of a parameter vector 𝜓, either 𝜓 = (𝑏0, 𝑏1) or 𝜓 = (𝑚, 𝑠), is accomplished by maximizing the likelihood (joint probability density of the data as a function of 𝜓) [4]
𝐿(𝜓) = ∏ 𝑝𝑖𝑦𝑖(1 − 𝑝𝑖)1−𝑦𝑖 𝑛𝑖=1 . (6)
Let Ψ be the complete parameter space and Ψ0 ⊆ Ψ be a subset of interest. The hypothesis test
𝐻0:𝜓 ∈ Ψ0𝐻1:𝜓 ∉ Ψ0
(7)
is conducted using the generalized likelihood ratio (LR) [5] test statistic
𝜆 = sup{𝐿(𝜓)|𝜓∈Ψ0}sup{𝐿(𝜓)|𝜓∈Ψ}
(8)
and the large-sample chi-squared distribution with 𝑟 = dim Ψ − dim Ψ0 degrees of freedom [6] of
−2 log 𝜆 ∼ 𝜒𝑟2 (9)
by the method of profile likelihood [7].
Let 𝑉𝑚𝑎𝑥0 denote the highest partial penetration velocity, and let 𝑉𝑚𝑖𝑛1 denote the lowest complete penetration velocity. If 𝑉𝑚𝑖𝑛1 < 𝑉𝑚𝑎𝑥0, the experiment has a zone of mixed results (zmr) which is the interval [𝑉𝑚𝑖𝑛1,𝑉𝑚𝑎𝑥0]. Thus, unique parameter estimates are obtained, and the response is a smooth S-shaped curve. Otherwise, there is an empty gap [𝑉𝑚𝑎𝑥0,𝑉𝑚𝑖𝑛1] separating the partial penetrations and complete penetrations, and there is no unique parameter estimate. However, statistical inference is possible in all cases.

7
The relevant test for comparing ballistic limits of two experiments is
𝐻0:𝑚1 = 𝑚2𝐻1:𝑚1 < 𝑚2
(10)
and rejection of 𝐻0 is tantamount to concluding that experiment 2 yields a higher ballistic limit than experiment 1. The result of the test is presented as a p-value, which is the probability of rejecting 𝐻0 in error. The decision is to reject 𝐻0 when the p-value is small (p ≈ 0.1 or less).
To identify experiment sequences with increasing ballistic limits, consider the following graphs located in Figure 9. Each graph depicts the data from the five series (K1 through K5) on a panel (N1, N2, or N3). The baseline is series K1 on all three panels. Each boxplot depicts a single series. The box center (horizontal black line) is the 3x3 𝑉50, the box extend represents the six velocities used in its computation. The upper and lower whiskers are the extreme velocities from the series. If a series has a zmr, this is depicted as green I-beam with the 𝑉50 parameter estimate 𝑚 shown as a wider green horizontal line. Otherwise, the series has a gap, which is shown as a red I-beam. This number below each box is the number of shots in that series.
For each panel, consider comparison of the baseline to that series with the highest ballistic limit.
For panel 1, the test of K1 (baseline) vs. K3 gives p=0.114, a marginal indication of 𝑉50 increase from series 1 to series 3.
For panel 2, the test of K1 (baseline) vs. K4 gives p=0.103, a good indication of 𝑉50 increase from series 1 to series 4.
For panel 3, the test of K1 (baseline) vs. K3 gives p=0.049, a strong indication of 𝑉50 increase from series 1 to series 3.
Following the boxplots are graphs of these 3 significant comparison data and estimated response curves. These graphs are located in Figure 10. The baseline (red, no zmr) is depicted as a pair of vertical shifted step functions with steps at the gap edges. The significant series (green) all have a zmr, so they appear as S-shaped curves. Each horizontal black line segment depicts the 𝑉50 shift which is the subject of statistical testing. The segment starts at the rightmost vertical line to simulate worse case V50 value. The length of the black line segment and the slope of the curve are used to determine the significance of the differences.
The bottom right plot in Figure 10 is an example of a comparison which is not significant: panel N1, K1 (baseline) vs. series K4. This has a p-value of 0.322, so these 𝑉50 values are indistinguishable.
This supports the observation that ballistic limit increases to a point with repeated experimentation on a panel. After it reaches that point, the ballistic limit starts to decline. In fact, for each plate there is a significant decrease in V50 from the highest series to the final series.
For panel 1, the test of K3 vs. K5 gives p=0.102, indicating a decrease in V50 from series 3 to series 5.
For panel 2, the test of K4 vs. K5 gives p=0.058, indicating a decrease in V50 from series 4 to series 5.
For panel 3, the test of K3 vs. K5 gives p=0.015, indicating a decrease in V50 from series 3 to series 5

8
Figure 9. Data from five series on panels 1 - 3.
Figure 10. Significant comparison data and estimated response curves.
650
700
750
800
series
velocity, m/s
K1 K2 K3 K4 K5
panel N1650
700
750
800
10
650
700
750
800
9
650
700
750
800
7
650
700
750
800
8
650
700
750
800
7
650
700
750
800
series
velocity, m/s
K1 K2 K3 K4 K5
panel N2650
700
750
800
10
650
700
750
800
6
650
700
750
800
7
650
700
750
800
8
650
700
750
800
8
650
700
750
800
series
velocity, m/s
K1 K2 K3 K4 K5
panel N3650
700
750
800
10
650
700
750
800
7
650
700
750
800
8
650
700
750
800
12
650
700
750
800
11
680 700 720 740 760 780
0.0
0.2
0.4
0.6
0.8
1.0
velocity, m/s
probability
N1: K1 vs. K3
p = 0.114
680 700 720 740 760 780
0.0
0.2
0.4
0.6
0.8
1.0
velocity, m/s
probability
N2: K1 vs. K4
p = 0.103
680 700 720 740 760 780
0.0
0.2
0.4
0.6
0.8
1.0
velocity, m/s
probability
N3: K1 vs. K3
p = 0.049
680 700 720 740 760 780
0.0
0.2
0.4
0.6
0.8
1.0
velocity, m/s
probability
N1: K1 vs. K4
p = 0.332
9
5. SUMMARY/CONCLUSIONS
One of the interesting observations was that the first panel only took three series before reaching the maximum V50 for that panel versus four series for the next two panels. While the spacing between subsequent shots on all the panels is similar, the first panel didn’t have the edge effects that the next two panels had. This difference may have been enough to restrict the delamination so that it took fewer shots to reach the point where the V50s start to fall off.
While this was a preliminary attempt at quantifying the effect of shot placement on UHMWPE ballistic limits, it shows a definite possibility of higher V50 values if you have delamination overlap. Since armor panels are usually evaluated on the V50 results, the potential for misleading V50s exists.
If the manufacturer is not aware that delamination overlap changes the V50, they could ask to put the maximum amount of shots on a plate to get what they see as a more statistically valid V50. Then, when they submit their panel for acceptance testing, they could experience a lower V50 because fewer shots were taken, causing the panel to fail the requirements. This has the potential of having the manufacturer investing large sums of money in testing a panel that they were sure was going to pass, but did not.
A more comprehensive study could better quantify the effect that overlapping delamination has on the V50. Besides removing the potential for V50 manipulation and the potential for investing heavily in a panel that will not pass the requirements, the study of delamination overlap could lead to a panel that is designed to take advantage of the effect which could lead to lighter, more protective armor panels.
References
[1] Department of Defense Test Method Standard, V50 Ballistic Test For Armor, MIL-STD-662F, dtd Dec 1997.
[2] Ballistic Test Method for Personal Armour Materials and Combat Clothing, STANAG-2920, dtd July 2003.
[3] Hosmer D. and Lemeshow S. Applied Logistic Regression, 2nd ed, John Wiley & Sons, New York, 2000, p. 6.
[4] McCullagh P. and Nelder J., Generalized Linear Models, 2nd ed, Chapman and Hall, New York, 1989, p. 24.
[5] Stuart A. and Ord J., Kendall’s Advanced Theory of Statistics, 5th ed, Volume 2. Oxford University Press, New York, 1991, p.861.
[6] Wilks S., The Large-Sample Distribution of the Likelihood Ratio for Testing Composite Hypotheses, Ann. Math. Statist., Volume 9, Number 1 (1938), pp. 60-62.
[7] McCullagh P. and Nelder J., Generalized Linear Models, 2nd ed, Chapman and Hall, New York, 1989, p. 254.
10
1 DEFENSE TECHNICAL (PDF) INFORMATION CTR DTIC OCA 2 DIRECTOR (PDF) US ARMY RESEARCH LAB RDRL CIO LL IMAL HRA MAIL & RECORDS MGMT 1 GOVT PRINTG OFC (PDF) A MALHOTRA 1 DIR US ARMY EVALUATION CTR HQ (HC) TEAE SV P A THOMPSON 2202 ABERDEEN BLVD 2ND FL APG MD 21005-5001 13 DIR USARL (2 HC RDRL SL 11 PDF) J BEILFUSS (HC) P TANENBAUM (HC) RDRL SLB R BOWEN RDRL SLB A G MANNIX RDRL SLB D J COLLINS R GROTE L MOSS J POLESNE RDRL SLB E M MAHAFFEY RDRL SLB G P MERGLER RDRL SLB S M PERRY RDRL SLB W S SNEAD RDRL SLE R FLORES