Embed Size (px)
Citation preview

Comparison of wastewater treatment plants basedon the emissions of microbiological contaminants
Michał Michałkiewicz
Received: 23 April 2018 /Accepted: 8 October 2018 /Published online: 18 October 2018# The Author(s) 2018
Abstract This article presents the current and importantresults of bioaerosol studies which allow for the compar-ison of microbial contamination of air in 11 wastewatertreatment plants (WWTPs), which differed in terms ofcapacity from 350 to 200,000 m3/day. The abundance ofmesophilic bacteria, M+ and M− Staphylococcus, Pseu-domonas fluorescens, Actinobacteria, coliform and psy-chrophilic bacteria, and microscopic fungi was deter-mined. Additionally, the air temperature, relative humid-ity, wind velocity, and direction were also analyzed ateach research station. The obtained very numerous re-sults of bioaerosol and climate parameter studies weresubjected to statistical analysis. The results regarding theminimum, maximum, and median abundance of thestudied bacteria and microscopic fungi at 11 WWTPsand in background studies at control stations were pre-sented in tables. Additionally, basic descriptive statisticsfor all studied microorganisms at specific seasons werepresented. It was established that at the areas ofWWTPs,the microscopic fungi were present that the highest con-centrations (ranging from 0 to 1,148,530 CFU m−3),followed by psychrophilic bacteria (ranging from 40 to225,000 CFU m−3) and mesophilic bacteria (rangingfrom 0 to 195,000 CFU m−3). The novel elaboration of
bioaerosol study results based on cluster analysis anddetermination of a dendrogram allowed to compare thestudied WWTPs. The similarity was decided based onthe type of studied microorganisms and their dominanceand abundance, while no similarities were observed interms of capacity. In order to investigate the relationbetween the abundance of bacterial groups as well asmicroscopic fungi and microclimatic parameters (airtemperature and humidity), a calculation of Spearman’srange correlation coefficients was conducted.
Keywords Bioaerosols . Air contamination .
Wastewater treatmentplants .Emission factor . Statisticalanalysis
AbbreviationsAU AutumnCDT Closed digester tanksCFU m−3 Colony forming unitsEC Electrocoagulation processECP Electrochemical peroxidation
processEF Electro-Fenton processH Value of Kruskal-Wallis testKO Composting plantL Hydrobotanic Lemna-type treat-
ment plantM− staphylococci Mannitol-negative staphylococci
(Staphylococcus)M+ staphylococci Mannitol-positive staphylococci
(Staphylococcus)Max. Maximum value
Environ Monit Assess (2018) 190: 640https://doi.org/10.1007/s10661-018-7035-2
Electronic supplementary material The online version of thisarticle (https://doi.org/10.1007/s10661-018-7035-2) containssupplementary material, which is available to authorized users.
M. Michałkiewicz (*)Institute of Environmental Engineering, Poznan University ofTechnology, Berdychowo 4, 61-138 Poznan, Polande-mail: [email protected]
MB Mechanical-biological Wastewa-ter Treatment Plants
Med. Median valueMin. Minimum valuen Number of measurementsn.a. Not analyzedns Not studiedODT Open digester tanksp Probability value for statistical
significance testingPE Population equivalentQ1 Bottom quartileQ3 Upper quartiler Spearman’s rank correlation
coefficientsR RangeRH Relative humiditySD Standard deviationSP SpringSU SummerUV UV radiationWI WinterWWTPs Wastewater treatment plantsx̅ Average valueβ Regression coefficient
Introduction
The problems associated with the contamination of at-mospheric air are becoming increasingly important inthe modern world. Among several scientific fields, aero-biology has been distinguished as an interdisciplinaryscience dealing with the study of bioaerosols, microor-ganisms, and biological materials associated with atmo-spheric air. Biological aerosols, often called bioaerosols,are colloidal systems in which the dispersed phase con-sists of microorganisms (bacteria, fungi, and viruses),their metabolites, toxins, and fragments which occur inthe form of fine droplets or solid particles suspended inair, which serves as the dispersive phase (Bauer et al.2002; Fuzzi et al. 2006; Tomasi and Lupi 2017). Theparticle diameters of bioaerosols commonly range fromapprox. several nanometers to approx. 100 μm, with thesize of virus particles serving as the lower limit andstructures of pollen or seeds being the upper limit. Theproblem of bioaerosols concerns several scientificfields, beginning with medicine, through botany,
zoology, environmental engineering, and ecology andending with typical microbiology (Roodbari et al. 2013;O’Connor et al. 2015). The studies conducted in Polandand throughout the world are focused on, e.g., themechanisms of bioaerosol formation (Mandal andBrandl 2011; Tomasi and Lupi 2017; Blanchard andSyzdek 1970), bioaerosol content (Fuzzi et al. 2006;Tomasi and Lupi 2017), methods of sampling air forstudies (Pastuszka et al. 2013; Gregová et al. 2008), andabundance and type of microorganisms in the indoorand outdoor environment as well as the influence ofdifferent objects on the air contamination level(Mentese and Tasdibi 2016; Dungan 2012; Wéry2014; Górny and Dutkiewicz 2002). Bioaerosols maybecome a serious risk to the health of the population,mainly because airborne bacteria and fungi can causeinfectious diseases as well as allergic and toxic effects. Itwas simultaneously established that there is a funda-mental difference in the quality and quantity of micro-organisms in the external and internal environment(Brągoszewska et al. 2018).
An important role in the emission of bioaerosols isplayed, among other, by municipal facilities includingwastewater treatment plants (WWTPs). The range ofinfluence of a WWTP on its surroundings may differnotably and the composition of wastewater, the technol-ogy used for treatment, plant capacity, and method ofsecuring each treatment step from the spread of micro-organisms to the surrounding area play a crucial role inthe potential emission of bioaerosol to atmospheric air(Sánchez-Monedero et al. 2008; Korzeniewska et al.2009; Li et al. 2012). Municipal wastewater whichenters theWWTP contains numerous pathogenic micro-organisms which may form bioaerosols and be liftedinto atmospheric air as a result of flow, turbulence, andaeration of wastewater (Carducci et al. 2000; Thornet al. 2002; Maki et al. 2017). Moreover, side-productssuch as screenings, sand, or sewage sludge formedduring subsequent stages of treatment also contain haz-ardous, often pathogenic microorganisms which mayhave a negative impact on the environment, WWTPemployees, and the inhabitants of local areas(Uhrbrand et al. 2011; Pringle 2013; Roodbari et al.2013).
In classical methods of biological treatment of waste-water using activated sludge, there is no possibility toeliminate numerous chemical compounds from thewastewater, including some pharmaceuticals whichmay be a potential hazard for surface, ground, and
640 Page 2 of 16 Environ Monit Assess (2018) 190: 640
drinking water. Due to this reason, it is necessary tointroduce additional methods for removing contami-nants, such as coagulation, membrane filtration, adsorp-tion, or advanced oxidation processes. The literatureindicates that wastewater treatment using these process-es allows for satisfactory removal of many pharmaceu-ticals from wastewater; however, the generation ofsludge and the necessity to regenerate the adsorbentare major flaws of using such processes (Ahmadzadehand Dolatabadi 2018a). Industrial, agricultural, and hos-pital wastewater include numerous, difficult to removesubstances, the neutralization of which requires the mostnovel, effective, and efficient techniques, which arefriendly for the environment. The literature providesexamples of new methods used for the removal ofdifferent contaminants from the wastewater, includingpharmaceuticals and germicides, using processes suchas electrochemical treatment with the use of the electro-Fenton (EF) process, electrocoagulation (EC) with alu-minum electrodes, electrocoagulation with iron elec-trodes, flocculation and adsorption, or electrochemicalperoxidation (ECP), which is an effective combinationof the advanced oxidation process and Fenton(Ahmadzadeh and Dolatabadi 2018b; Ahmadzadehet al. 2017a; Yoosefian et al. 2017; Ahmadzadeh andDolatabadi 2018c; Ahmadzadeh et al. 2017b).
Aside from contaminant removal methods, themethods of determination of some wastewater parame-ters using electrochemical and optical methods are alsoused, e.g., determination of the pH value, conductivity,redox potential, wastewater temperature, oxygen con-centration, nitrate compounds, turbidity, heavy metalions content, pharmaceuticals, and biological com-pounds. Indicators, probes, and electrodes are used formeasurements. An example of novel measurementmethods includes, e.g., modification of carbon pasteelectrode with NiO nanoparticles and an ionic liquidand the use of ion selective electrodes with novel mem-branes. The used electrochemical sensors are effectiveand offer advantages such as low cost, rapid analysis,high sensitivity, and selectivity compared to instrumen-tal analysis (Fouladgar and Ahmadzadeh 2016;Pardakhty et al. 2016; Soltani et al. 2016; Kassim et al.2011).
The aim of this study was to compare 11 wastewatertreatment plants based on the current bioaerosol studyresults, to indicate the variations in the emissions of bacte-ria and microscopic fungi and to determine the group ofmicroorganisms which causes the highest contamination
of air. The abundance of bacteria and microscopic fungirecommended by Polish Standards was analyzed at sta-tions located at different treatment stages in 11WWTPs aswell as at a control station, the so-calledbackground study,which was always located on the windward side of thestudied WWTP (PN-89/Z-04111/02 1989; PN-89/Z-04111/03 1989). Such selection of the control stationallowed to compare the microbial emission levels fromthe WWTP area in relation to uncontaminated air, whichwas not under the influence of the communal object.
The results of bioaerosol studies are important andnovel; since they were obtained from the area of 11different WWTPs, they were subjected to a detailedstatistical analysis and they were conducted in an annualcycle during all seasons, taking the variability of climateparameters into account. All the studies were conductedin accordance with the guidelines of Polish Standardsand the obtained results were used to compare of mu-nicipal objects and indicate correlations between theemissions of microorganisms and the microclimatic pa-rameters of air.
Materials and methods
Characterization of the studied WWTPs
Eleven WWTPs were selected for studies of the micro-bial contamination of air, which differed in terms ofcapacity from 350 to 200,000 m3/day. Ten objects weremechanical-biological WWTPs with enhanced phos-phorous removal, whereas one was a hydrobotanicLemna-type treatment plant (no. 6). Additionally, asludge composting plant was present on the area oftwo WWTPs (no. 1 and 11). Table 1 presents the num-ber, type, and capacity of the studied WWTPs as well asthe population equivalent (PE) and the number of re-search stations along with background research.
The majority of WWTPs were localized outside thedirect urban area; nevertheless, some of them borderedwith single residential buildings. Such localization mayhave caused a different influence of bioaerosol emissionon the surrounding areas. The technological system ofthe majority of WWTPs was very similar, as presentedin Fig. 1.
Additionally, a storage point for supplied wastewaterwas present on the area of the majority of WWTPs or intheir direct vicinity. Raw wastewater flowing into theWWTPwas directed to the grate building, which mostly
Environ Monit Assess (2018) 190: 640 Page 3 of 16 640

contained mechanical, self-clearing grates with a 6-mmclearance and emergency grates with a clearance of 7 to40 mm. The screenings detained on the grates werecontained in containers and sprinkled with chlorinatedlime for hygienization. Next, the wastewater entered thegrit separator and the solids (sands) were transferred to afree-standing storage container. The wastewater fromthe grit separator entered the primary settling tanks inwhich the sedimentation and flotation suspensions wereremoved. The separated primary sludge was directed tothe sludge management stage. Next, the mechanicallytreated wastewater entered the biological treatment areaof the WWTP.
Biological treatment of wastewater was mostly car-ried out in bioreactors with a differing construction,which con ta ined chambers used fo r, e .g . ,dephosphatation, denitrification, and nitrification. A sin-gle WWTP (no. 6) contained a Lemna-type aeratedpond. In the majority of WWTPs, a fine bubble aerationsystem was used in the nitrification chambers, whereasin a single WWTP (no. 1), old Silesia 270 APC-typesurface aerations were used. After the biological treat-ment, the wastewater was directed into secondary set-tling tanks in which the treated wastewater was separat-ed from the sludge, which was recirculated into thebioreactor and in the case of a single WWPT (no. 6), aLemna-type aerated pond was used. The excessivesludge was directed to sludge management stages. Thetreated wastewater entered the receiving point, which inmost cases was a river or a channel flowing into theriver. Within each WWTP, a more or less developedsludge management was conducted. Primary sludge
and the mechanically concentrated excessive sludgewere pumped into open digester tanks (ODT) or closeddigester tanks (CDT), where they were subjected tofermentation. The sludge after settling was subjectedto dehydration and hygienization using quicklime. Next,it was stored on a sludge storing site (no. 2, 3, 4, 7, 9),pounds (no. 1, 3, 5, 8, 10), or lagoons (no. 1, 6) andsubjected to a thermal drying process (no. 8, 10) orcomposting (no. 1, 11). In most cases, it was periodical-ly exported or used for the reclamation of the WWTParea (no. 2, 4, 5) and served as an organic fertilized forthe production of energy willow (no. 9). On the area oftwo WWTPs (no. 1 and 11), there was an additionalcomposting site for sludge and waste.
Research method
Microbial assessment of air was conducted on the areaof 11 WWPTs during an annual cycle in each season.Several air sampling stations (from 5 to 16 in Table 1)were established on the area of each WWTP, whichwere located on all wastewater treatment stages. Thesestations were located near objects (devices) which couldpotentially be a source of bioaerosol emissions. In mostcases, the stations were located in the outdoor environ-ment; however, they were also inside some closed ob-jects (e.g., the hermetic grate building, enclosed biore-actor, sludge concentration building). In some cases, theair from the hermetic objects was directed to biofilters(e.g., WWTP no. 2, 8, 10). In most cases, the emissionnear the research stations could occur due to intenseflow, transfer, aeration, or turbulence of wastewater as
Table 1 Number, type, and capacity of studied wastewater treatment plants, population equivalent (PE), and number of research stations
WWTP no. WWTP type Capacity (m3/day) Population equivalent (PE) Number of research stations
1 MB+KO 9360 140,000 5
2 MB 9602–16,000 126,500 16
3 MB 2300 18,200 8
4 MB 5883 35,700 8
5 MB 1138 12,300 6
6 L 350 6200 7
7 MB 500 4150 8
8 MB 200,000 1,000,000 7
9 MB 5600–8000 33,000 11
10 MB 50,000 – 80,000 63,300 9
11 MB+KO 12,438 – 17,307 51,800 10
MB, mechanical-biological; KO, composting plant; L, Lemna-type
640 Page 4 of 16 Environ Monit Assess (2018) 190: 640

well as treatment of sludge and storage of screeningsand grit. Precise identification of bioaerosol sources isthe basis for conducting appropriate actions focused onthe elimination of the causes of their formation (e.g.,reducing the flow intensity and turbulence, change ofthe aeration system, partial or complete hermetization).During the studies, at least a single control station (so-called background research) was designated, which waslocated at a distance of 150–200m on the windward siderelative to the WWTP border. This allowed to confirmthat the WWTP is the source of bioaerosol emissions.Microbial contamination of air was analyzed in accor-dance with Polish Standards: PN-89/Z-04111/02 andPN-89/Z-04111/03. Since the above-mentioned stan-dards were invalidated in 2015 and were not replacedby new standards, the assessment of air purity may bestill conducted according to these Standards. Based onthe guidelines in these Standards, the following micro-organisms were studied: mesophilic bacteria, hemolyticmannitol-positive (M+) and mannitol-negative (M−)staphylococci (Staphylococcus), Pseudomonasfluorescens, actinomycetes (Actinobacteria), and micro-scopic fungi. Due to the fact that the studies were carriedout on the area of WWTPs, in which the municipalwastewater which contains bacteria present in humandigestive tract is the main source of bioaerosols, thestudies also included coliform and psychrophilic bacte-ria. Such microorganisms are a good indicator of aircontamination and were also studied by several otherauthors (Carducci et al. 2000; Korzeniewska et al. 2009;Michałkiewicz et al. 2011).
The air samples (50–100 dm3) were collected using thesedimentation, aspiration, and impaction methods using aMAS 100-Eco microbial air sampler (Merck). During thesampling of air for microbial studies, the microclimaticparameters such as temperature (°C) and relative humidity(%) as well as wind velocity (m/s) and direction were alsoanalyzed. The measurements were carried out using anAZ8911 anemo-psychrometer (AZ Instrument Corp.).After collecting the air samples, all Petri dishes with theappropriate media were placed in incubators in order toensure incubation of microorganisms. The type of
medium, growth time, and the temperature was in accor-dance with the guidelines of Polish Standards. Mesophilicbacteria were grown using nutrient agar at 37 °C for 48 h,M+ and M− staphylococci were grown using Chapmanmedium at 37 °C for 48 h, Actinobacteria were grownusing a Pochonmedium at 26 °C for 120 h,Pseudomonasfluorescens was grown using a King B medium at 26 °Cfor 120 h and at 4 °C for 168 h with additional identifica-tion of colonies in UV rays, and microscopic fungi weregrown on Waksman and Czapek-Dox media at 26 °C for168 h. The coliform bacteria, which were not included inthese standards, were grown on an Agar Endo medium at37 °C for 48 h while psychrophilic bacteria were grownon nutrient agar at 20 ± 2 °C for 72 h. After the incubationperiod, the colonies were counted and the final result wasexpressed as the number of colony forming units calcu-lated per a single cubic meter of air (CFUm−3). In the caseof samples collected using the impaction method, theobtained results were corrected in accordance with Fellersconversion table. The obtained results were subjected tostatistical analysis based on the Kruskal-Wallis test andanalysis of Spearman’s rank correlation coefficients. Allstatistical analyses were carried out using theSTATISTICA 10 PL software.
Results and discussion
Table 2 presents the minimum (Min.), maximum(Max.), and median (Med.) abundance of the studiedbacteria and microscopic fungi (CFU m−3) obtained inthe research stations throughout the annum, whereasTable 3 presents the same measurements but obtainedat the control stations, in the background studies. Due tothe lack of a normality of abundance of bacteria andmicroscopic fungi, a non-parametric Kruskal-Wallis testwas used to compare the microorganisms during thefour seasons and in the annual cycle in the 11 studiedWWTPs in order to investigate the differences in theaverage abundance level of these microorganisms. Thevalue of p < 0.05 was assumed as statistically signifi-cant. Based on the comparison of results obtained
Fig. 1 Diagram of the technological wastewater treatment system on the analyzed wastewater treatment plants
Environ Monit Assess (2018) 190: 640 Page 5 of 16 640

during studies of bacteria and microscopic fungi at theresearch stations located in WWTPs (Table 2) with theresults of background studies (Table 3), it can beestablished that the lowest microbial abundance andthe lowest microbiological contamination of air wasusually observed at the control stations (CFU m−3).The maximum abundance of selected bacteria, e.g.,mesophilic bacteria, was lower at control stations by 7(no. 11) to 2438 times (no. 1) compared to the WWTPs,while in the case of fungi grown on the Waksman
medium, the abundance was lower by 2 (no. 8) to 121times (no. 11). Even higher differences occurred in thecase of coliform bacteria and Pseudomonas fluorescens.These values indicate that wastewater treatment plantsare a significant source of air contamination.
Occasional occurrence of slightly higher quantities ofsome microorganisms at control stations (e.g., psychro-philic bacteria or microscopic fungi) may be associatedwith the change of wind direction or accidental transfer ofmicroorganisms from other areas. In the case ofWWTPs,
Table 2 The minimum (Min.), maximum (Max.), and median (Med.) values of the number of bacteria and microscopic fungi tested(CFU m−3) in the treatment plants studied throughout the year
Microorganismsand determination
WWTP no. (research station on the WWTP area)
1 2 3 4 5 6 7 8 9 10 11
Mesophilic bacteria Min. 50 20 80 80 0 80 10 40 10 80 30
Max. 195,000 124,000 70,780 16,990 8340 16,500 16,500 3200 8040 89,120 3400
Med. 320 200 590 790 1180 550 1300 360 160 670 184
Psychrophilicbacteria
Min. 80 40 80 1020 320 700 650 140 40 50 530
Max. 225,000 157,800 84,230 15,100 29,260 19,000 38,000 7320 48,640 55,180 307,600
Med. 1350 1250 2280 3615 4800 2400 3700 760 820 1180 2983
Coliform bacteria Min. 0 0 0 0 0 0 0 0 0 0 0
Max. 1150 57,800 87,530 3000 660 3000 3900 500 80 7320 200
Med. 26 0 0 0 0 0 26 10 0 5 10
M− staphylococci Min. 0 0 0 0 0 0 0 0 0 0 0
Max. 470 120 320 160 80 160 240 170 60 930 200
Med. 0 0 0 0 0 0 0 0 0 0 10
M+ staphylococci Min. 0 0 0 0 0 0 0 0 0 0 0
Max. 262 50 600 130 110 680 1400 110 150 40 160
Med. 26 0 79 0 26 0 26 10 20 0 10
Pseudomonasfluorescens at 26 °C
Min. 0 0 0 0 0 0 0 0 0 0 0
Max. 990 1570 3150 130 1210 80 80 20 120 460 80
Med. 26 0 0 0 0 0 0 0 0 0 0
Pseudomonasfluorescens at 4 °C
Min. ns 0 0 0 0 0 0 0 0 0 0
Max. ns 10 80 0 0 0 0 0 0 0 0
Med. ns 0 0 0 0 0 0 0 0 0 0
Actinobacteria Min. ns ns ns ns ns ns ns 0 0 0 0
Max. ns ns ns ns ns ns ns 380 6200 330 1600
Med. ns ns ns ns ns ns ns 80 75 10 40
Microscopic fungi:Waksman
Min. 160 40 160 160 390 80 650 500 40 40 530
Max. 265,000 90,800 65,740 46,630 44,120 9700 34,000 6560 26,000 6040 1,148,530
Med. 2670 1780 2125 4440 2830 1500 3900 1300 1120 740 3334
Microscopic fungi:Czapek-Dox
Min. ns 40 0 0 390 240 1100 260 10 40 130
Max. ns 157,800 50,170 16,670 33,660 22,400 59,000 11,900 12,440 89,120 1,034,270
Med. ns 1250 1610 4325 2280 2000 6700 1010 740 840 2250
ns, not studied
640 Page 6 of 16 Environ Monit Assess (2018) 190: 640

usually the microscopic fungi were present at highestconcentrations (Max. 1,148,530 CFU m−3), followed bypsychrophilic bacteria (Max. 307,600 CFU m−3) andmesophilic bacteria (Max. 195,000 CFU m−3). The coli-form bacteria were also present on the area of eachWWTP (Max. 57,800 CFU m−3), which is a good indi-cator of the presence of bioaerosol originating fromwastewater or sludge. The staphylococci and Pseudomo-nas fluorescenswere present at considerably lower levels.Actinobacteria were detected only in four WWTPs and
their abundance was variable. Considering the maximumabundances of the studied bacteria and microscopic fungiin the annual cycle and the assessment of air in accor-dance with Polish Standards PN-89/Z-04111/02 and PN-89/Z-04111/03, it can be established that a periodic strongcontamination of air with bacteria as well as contamina-tion which is hazardous for the human environment dueto the presence of microscopic fungi was confirmed onthe area of each WWTP. Adamus-Białek et al. (2015)reported that the results of their studies indicate a high
Table 3 The minimum (Min.), maximum (Max.), and median (Med.) values of the counted bacteria and microscopic fungi (CFU m−3) atcontrol positions throughout the year
Microorganismsand determination
WWTP no. (control station)
1 2 3 4 5 6 7 8 9 10 11
Mesophilic bacteria Min. 0 40 79 0 52 40 80 60 20 40 33
Max. 80 140 430 240 540 225 400 160 120 320 467
Med. 78 40 160 54 205 60 160 90 60 190 150
Psychrophilic bacteria Min. 0 60 200 650 300 400 550 40 60 240 333
Max. 3500 820 1340 1260 780 1000 2400 860 1780 740 4400
Med. 167 390 770 840 545 550 750 250 470 610 2684
Coliform bacteria Min. 0 0 0 0 0 0 0 0 0 0 0
Max. 0 0 0 79 0 0 0 0 0 0 60
Med. 0 0 0 0 0 0 0 0 0 0 10
M− staphylococci Min. 0 0 0 0 0 0 0 0 0 0 0
Max. 0 0 26 0 0 0 0 0 10 20 60
Med. 0 0 0 0 0 0 0 0 0 10 10
M+ staphylococci Min. 0 0 0 0 0 0 0 0 0 0 0
Max. 0 0 52 0 0 0 0 0 0 0 20
Med. 0 0 26 0 0 0 0 0 0 0 0
Pseudomonasfluorescens at 26 °C
Min. 0 0 0 0 0 0 0 0 0 0 0
Max. 52 0 0 0 0 0 0 0 0 0 0
Med. 0 0 0 0 0 0 0 0 0 0 0
Pseudomonasfluorescens at 4 °C
Min. ns 0 0 0 0 0 0 0 0 0 0
Max. ns 0 0 0 0 0 0 0 0 0 0
Med. ns 0 0 0 0 0 0 0 0 0 0
Actinobacteria Min. ns ns ns ns ns ns ns 30 0 0 0
Max. ns ns ns ns ns ns ns 50 3780 140 520
Med. ns ns ns ns ns ns ns 40 560 10 50
Microscopic fungi:Waksman
Min. 0 40 260 150 200 40 325 340 100 160 733
Max. 13,600 1840 3790 3540 5380 1300 3200 3340 2020 840 9500
Med. 315 370 1240 1355 1520 380 950 470 840 785 5233
Microscopic fungi:Czapek-Dox
Min. ns 80 100 120 210 150 800 120 40 100 267
Max. ns 540 7540 2590 1610 1000 2400 3500 1440 710 3733
Med. ns 160 980 1410 1080 638 875 290 940 520 1750
ns, not studied
Environ Monit Assess (2018) 190: 640 Page 7 of 16 640

number of bacteria even at a relatively far distance fromWWTPs, which allows these municipal objects to have anegative influence on the contamination of air in thesurrounding areas, whereas M+ staphylococci as well asPseudomonas fluorescens may be a notable componentof the bioaerosol, which is hazardous for WWTP em-ployees as well as other people in the surrounding areas.
On the basis of the Kruskal-Wallis test (statisticalsignificance at p < 0.05), the comparison of medianabundance values of mesophilic bacteria (p = 0.0000),psychrophilic bacteria (p = 0.0000), coliform bacteria(p = 0.0010), mannitol-negative (p = 0.0252) andmannitol-positive (p = 0.0000) staphylococci, Pseudo-monas fluorescens cultivated at 26 °C (p = 0.0000),and Actinobacteria (p = 0.0309) during the annual cyclerevealed statistically significant differences among thestudied groups. A similar relation (p < 0.05) was alsonoted on the areas of studied WWTPs in each season(spring, summer, autumn, and winter), with the excep-tion of coliform bacteria in summer (p = 0.0810). Due tothe fact that Pseudomonas fluorescens cultivated at 4 °Cwas present only in three measurements in the area oftwoWWTPs, in this case, no detailed statistical analysiswas carried out. The comparison of median abundancevalues of microscopic fungi in the annual cycle cultivat-ed using the Czapek-Dox and Waksman media alsorevealed statistically significant differences among them(p = 0.0000). A similar relation was also noted in thecase of fungi during specific seasons.
In order to present the changes of abundance ofbacteria and microscopic fungi during specific seasons(spring, summer, autumn, winter) at the area of allstudied wastewater treatment plants, the results of sta-tistical calculations and Kruskal-Wallis test at appropri-ate research stations are presented in Table 4. The as-sumed level of statistical significance for the calcula-tions was p < 0.05.
The highest median value for the majority of micro-organisms (mesophilic bacteria, psychrophilic bacteria,Actinobacteria, fungi grown on Waksman and Czapek-Dox media) occurred in summer or autumn (coliformbacteria), whereas the lowest occurred in winter (psy-chrophilic bacteria, microscopic fungi grown on bothmedia). In the case of some microorganisms (M− staph-ylococci, Pseudomonas fluorescens at 26 °C and 4 °C),the median value for all seasons was equal to 0. Thecomparison ofmedian abundance ofmesophilic bacteria(p = 0.0083), psychrophilic bacteria (p = 0.0000), coli-form bacteria (p = 0.0002), and Actinobacteria (p =
0.0000) as well as fungi grown on the Waksman medi-um (p = 0.0000) and the Czapek-Dox medium (p =0.0000) during four seasons indicated statistically sig-nificant differences among them (p < 0.05). On the otherhand, the comparison of median abundance of M+staphylococci (p = 0.4284), M− staphylococci (p =0.8482) and Pseudomonas fluorescens grown at 26 °C(p = 0.7393) during four seasons based on the Kruskal-Wallis test did not reveal any statistically significantdifferences among them. After analysis of averagevalues, it was established that their highest values donot always match the highest median values. In mostcases, the highest average values occurred during au-tumn (mesophilic bacteria, coliform bacteria, M− staph-ylococci, Pseudomonas fluorescens at 26 °C) or spring(psychrophilic bacteria, Pseudomonas fluorescens at4 °C, microscopic fungi: Waksman and Czapek-Doxmedium) at slightly lower temperatures of theenvironment.
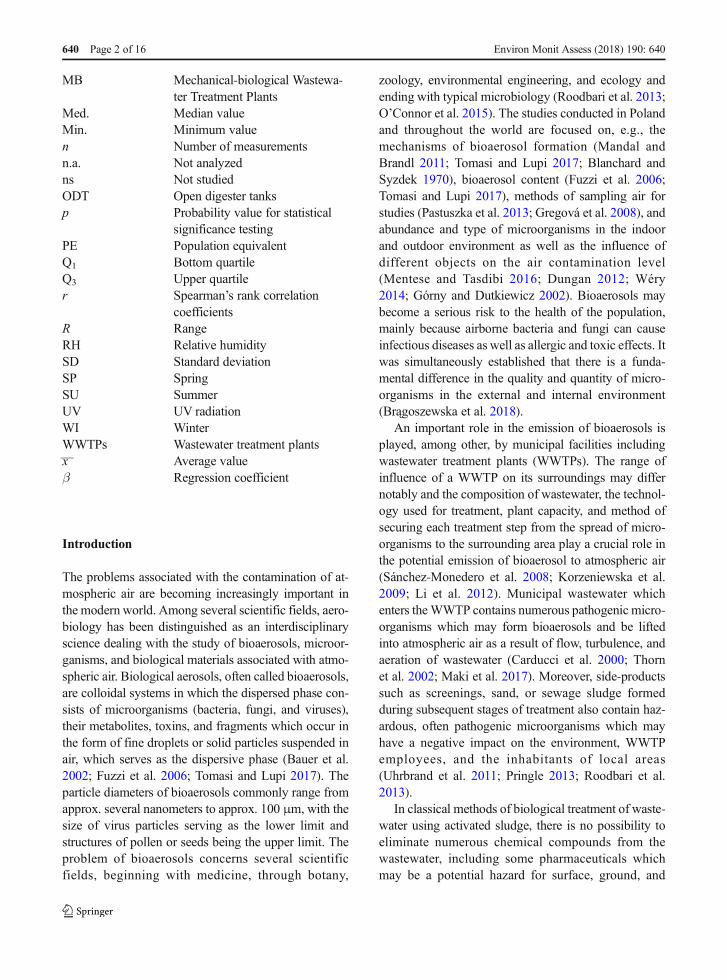
Based on the median abundance value for bacteriaand microscopic fungi (CFU m−3) from all stations in agiven location during the annual cycle (Table 2), acluster analysis and comparison of the studied WWTPswere conducted. Due to the fact that all types of studiedmicroorganisms were not always present on the areas ofthe analyzed WWTPs, the comparison was conductedonly in terms of 7 microbial groups which were presentin all 11 studied locations. The comparison includedmesophilic bacteria, psychrophilic bacteria, coliformbacteria, M− and M+ staphylococci, Pseudomonasfluorescens cultivated at 26 °C, and microscopic fungicultivated using Waksman media. The dendrogram de-termined by full binding method for all (11) studiedlocations was presented in Fig. 2.
On the basis of calculations and Fig. 2, there werefour clusters of WWTPs at a binding distance levelequal to 4:
1. WWTP in location no. 112. WWTPs in locations no. 7, 5 and 43. WWTPs in locations no. 3, 6, 10, 8, 9 and 24. WWTP in location no. 1
In contrast, there were six WWTPs at a bindingdistance level equal to 2.5:
1. WWTP in location no. 112. WWTP in location no. 73. WWTPs in locations no. 5 and 4
640 Page 8 of 16 Environ Monit Assess (2018) 190: 640

Table 4 Basic descriptive statistics and Kruskal-Wallis test results for the abundance of bacteria and microscopic fungi during the fourseasons at the area of all studied wastewater treatment plants (no. 1–11)
Season n Averagevalue (x)
Standarddeviation(SD)
Medianvalue(Med.)
Minimumvalue(Min.)
Maximumvalue(Max.)
BottomquartileQ1 (25%)
UpperquartileQ3 (75%)
Range(R)
Kruskal-Wallis test
H p
Mesophilic bacteria (CFU m−3)
SP 81 925 1470 280 33 7390 120 1100 7357 11.74 0.0083*SU 89 3654 11,356 550 79 89,120 220 2000 89,041
AU 98 5614 25,117 315 10 195,000 120 790 194,990
WI 93 3334 9779 325 0 70,780 120 1940 70,780
Psychrophilic bacteria (CFU m−3)
SP 81 9263 42,444 1220 40 307,600 520 3867 307,560 27.38 0.0000*SU 89 7638 13,654 3000 280 82,780 1460 7020 82,500
AU 98 9073 30,649 1670 40 225,000 820 3700 224,960
WI 93 5801 18,695 1100 40 157,800 600 3560 157,760
Coliform bacteria (CFU m−3)
SP 81 92 443 0 0 3900 0 26 3900 20.11 0.0002*SU 89 117 572 0 0 4480 0 26 4480
AU 98 1721 10,553 20 0 87,530 0 52 87,530
WI 85 49 170 0 0 1080 0 10 1080
M− staphylococci (CFU m−3)
SP 81 17 33 0 0 180 0 20 180 0.81 0.8482SU 89 24 47 0 0 240 0 26 240
AU 98 31 110 0 0 930 0 26 930
WI 93 20 42 0 0 240 0 20 240
M+ staphylococci (CFU m−3)
SP 81 29 65 10 0 390 0 26 390 2.77 0.4284SU 89 20 30 0 0 130 0 26 130
AU 98 43 96 10 0 600 0 40 600
WI 93 69 178 10 0 1400 0 52 1400
Pseudomonas fluorescens at 26 °C (CFU m−3)
SP 81 20 48 0 0 314 0 26 314 1.26 0.7393SU 89 17 54 0 0 460 0 10 460
AU 98 77 379 0 0 3150 0 20 3150
WI 93 51 160 0 0 990 0 13 990
Pseudomonas fluorescens at 4 °C (CFU m−3)
SP 74 1,1 9,2 0 0 80 0 0 80 n.a. n.a.SU 79 0,1 1,1 0 0 10 0 0 10
AU 79 0,0 0,0 0 0 0 0 0 0
WI 79 0,1 1,1 0 0 10 0 0 10
Actinobacteria (CFU m−3)
SP 32 113 123 70 0 580 35 160 580 63.83 0.0000*SU 32 1006 1384 400 0 6200 130 1620 6200
AU 32 21 34 0 0 160 0 35 160
WI 32 42 85 5 0 380 0 45 380
Microscopic fungi: Waksman (CFU m−3)
SP 81 25,327 141,609 920 40 1,148,530 360 1800 1,148,490 85.66 0.0000*SU 89 9179 16,173 4467 80 119,667 2310 7940 119,587
AU 98 7926 28,273 2700 200 265,000 1700 5600 264,800
WI 93 4911 21,087 800 40 188,700 390 1467 188,660
Environ Monit Assess (2018) 190: 640 Page 9 of 16 640

4. WWTP in location no. 35. WWTPs in locations no. 6, 10, 8, 9 and 26. WWTP in location no. 1
In both analyzed cases, it is clearly visible thatWWTPs in location nos. 11 and 1 differ from the rest.These are mechanical-biological treatment plants, whichcomprise additional composting stations, big open di-gesters and use a surface aeration system (no. 1) andposses a big, partially open sludge dehydration station(no. 11). In the case ofWWTP no. 11, the presence ofM− staphylococci was detected in more than half of themeasurements, whereas inWWTP no. 1, more than halfof the measurements indicated the presence of Pseudo-monas fluorescens grown at 26 °C.WWTP nos. 6, 10, 8,9, and 2 were the most similar in terms of abundanceand presence of specific groups of microorganisms.Despite the fact that these objects are characterized by
different capacity (no. 6–350m3/day, no. 8–200,000m3/day), their microbial similarity is high. Some of theobjects were hermetized; biological treatment was con-ducted in Bardenpho-type bioreactors, modifiedBardenpho systems, LANR II, and Lemna-type ponds;and fine bubble aeration systems (membrane and tubeMagnum- and HAFI-type diffusers) were used for aer-ation. The similarity and formation of clusters of specif-ic WWTPs were decided based on the type of studiedmicroorganisms and their domination and abundance aswell as any additional sources of air contamination (inthis case, the presence of, e.g., composting stations),while no similarity in terms of capacity was observedfor these objects.
During the collection of air samples, the microclimat-ic conditions at specific stations were investigated aswell. All research stations were taken into account dur-ing the statistical analysis, including background
Table 4 (continued)
Season n Averagevalue (x)
Standarddeviation(SD)
Medianvalue(Med.)
Minimumvalue(Min.)
Maximumvalue(Max.)
BottomquartileQ1 (25%)
UpperquartileQ3 (75%)
Range(R)
Kruskal-Wallis test
H p
Microscopic fungi: Czapek-Dox (CFU m−3)
SP 73 35,655 158,170 1580 40 1,034,270 680 4780 1,034,230 88.73 0.0000*SU 79 10,975 18,524 4420 440 89,120 2000 9830 88,680
AU 79 5745 21,003 1560 560 157,600 960 3780 157,040
WI 79 3794 18,139 533 0 157,800 160 1000 157,800
n, number of measurements; H, value of Kruskal-Wallis test; p, test probability level; n.a., not analyzed; SP, spring; SU, summer; AU,autumn; WI, winter; *statistically significant difference, p < 0.05
Fig. 2 Dendrogram determinedby the full binding method for 11locations
640 Page 10 of 16 Environ Monit Assess (2018) 190: 640

studies. Table 5 presents the basic descriptive statistics(n, number of measurements; x, average value; SD,standard deviation; Med., median value; Min., mini-mum value; Max., maximum value; Q1 bottom and Q3
upper quartile; R, range) regarding microclimatic pa-rameters at specific study periods (seasons) and theannum. The air temperature was diverse and in mostcases ranged from 10 to 20 °C (42.7% of all measure-ments). Air humidity was very variable and in mostcases ranged between 50 and 60% (23.1% of all mea-surements), whereas the wind velocity in most casesreached up to 1 m/s (43.6% of all measurements).
In order to check the relations occurring between theabundance of studied groups of bacteria as well asmicroscopic fungi and the microclimatic parameters(air temperature and humidity), calculations ofSpearman’s rank correlation coefficients for specificWWPTs (locations) were carried out. Positive correla-tions indicate that the higher the analyzed parameters,the higher the abundance of specific microorganisms,whereas negative correlations indicate that the abun-dance of microorganisms is lower with higher parame-ters. Interpretation of results was based on the classifi-cation of Spearman’s rank correlation coefficients ac-cording to Guilford (Świechowski et al. 2015): |r| = 0variables are not correlated; 0.0 < |r| ≤ 0.1 dim correla-tion; 0.1 < |r| ≤ 0.3 weak correlation; 0.3 < |r| ≤ 0.5 aver-age correlation; 0.5 < |r| ≤ 0.7 strong correlation; 0.7< |r| ≤ 0.9 very strong correlation; 0.9 < |r| < 1.0 almostcomplete correlation; and |r| = 1 complete correlation.
The highest number of correlations between theabundance of the studied microorganisms and air tem-perature was observed in the case of microscopic fungi.In this case, all correlation coefficients were significantat p < 0.05. For fungi which were grown using theWaksman medium, average and high positive correla-tions (coefficients ranging from 0.409 to 0.700) at thearea of 7 WWTPs and a negative correlation (− 0.559)for a single WWTP were observed. In general, a weakpositive correlation was observed (0.352) for all theWWTPs. In the case of cultivation on the Czapek-Doxmedium, only positive correlations (from weak to verystrong, ranging from 0.280 to 0.857) and an averagepositive correlation (0.562) was established in general.Among the studied groups of bacteria, the most signif-icant correlations between the bacterial abundance andair temperature occurred at the smallest WWTP. In fourWWTPs, a positive correlation among psychrophilicbacteria was observed, for which the Spearman’s range
of correlation coefficient ranged from 0.280 to 0.712and an average positive correlation (0.352) was ob-served for all WWTPs in general. Additionally, in thecase of four WWTPs, significant correlations for M−staphylococci were observed as well. Three were posi-tive, average, and high (from 0.433 to 0.588) and asingle was negative and weak (− 0.277). A lower num-ber of significant correlations (for two or threeWWTPs)was observed in the case of mesophilic bacteria (−0.386, 0.293 and 0.345), coliform bacteria (0.433 and0.642), Actinobacteria (0.425 and 0.846) or M+ staph-ylococci (− 0.467 and − 0.650), and air temperature. Aweak negative correlation (− 0.378) between the abun-dance of Pseudomonas fluorescens and air temperaturewas observed only in a single WWTP.
By analyzing the significant correlations between theabundance of the studied microorganisms and air hu-midity, it can be established that the highest numbersoccurred in the case of microscopic fungi grown usingthe Waksman medium. This included average and highcorrelations noted for five WWTPs, for which theSpearman’s range of correlation coefficients rangedfrom 0.417 to 0.601, and negative correlations for twoWWTPs (− 0.436 and − 0.651). In the case of cultiva-tion using the Czapek-Dox medium, only a single sig-nificant negative correlation was observed (− 0.693).Among bacteria, the highest number of significant cor-relations between the microbial abundance and air hu-midity occurred only in three WWTPs and concernedcoliform bacteria (− 0.488, 0.393, and 0.468) as well asM− staphylococci (− 0.586, − 0.488, and 0.414). Incontrast, there was no significant correlation betweenthe M+ staphylococci and air humidity in any of theWWTPs. Between the remaining bacterial groups(mesophilic and psychrophilic bacteria, P. fluorescens,Actinobacteria) and air humidity in most cases, therewere positive and/or negative weak, average, or strongcorrelation in the case of a single WWTP (Spearman’srange of correlation coefficients ranged from − 0.609 to0.492). The studies of other authors indicate that corre-lations between the microorganisms and climatic param-eters are very diverse.
During their studies regarding bacterial aerosols inGliwice (Upper Silesia, Poland), Brągoszewska et al.(2017) established that the main meteorological factorswith major roles to play in bioaerosol concentration andtheir transport are air temperature, relative humidity,wind velocity, UV radiation, and seasonal variations ofmicrobial abundance. Statistically, temperature and UV
Environ Monit Assess (2018) 190: 640 Page 11 of 16 640

radiation were the most important meteorological fac-tors in the viability of airborne bacteria. Wind velocitywas found to have no statistically significant correlationwith bacterial aerosol concentrations. Brągoszewskaand Pastuszka (2018) reported that the average concen-tration of bacteria in the air in Gliwice (Poland) differedsignificantly between each season. In this case, positivecorrelations between the air temperature and bacterialbioaerosol were established in fall and winter(Spearman’s range of correlation coefficients was at0.499 and 0.762, respectively) and negative correlationswere observed in spring and summer (− 0.284 and −0.687 for p < 0.05). A significantly higher positive cor-relation between the bacterial abundance and humidity(0.476) was observed only in winter. Partially similarcorrelations were noted in my studies in the case ofselected groups of bacteria and air temperature, whereasno similar correlations were observed between bacterialabundance and air humidity.
Niazi et al. (2015) report that the highest emission ofbacteria to air was observed during summer, whereas theemission of fungi was associated with mechanical treat-ment of wastewater. Overall, a significant relationshipwas observed between meteorological parameters and
the concentration of bacterial and fungal aerosols. Theauthors found a significant correlation between the con-centration of detected bacteria and temperature, UVindex, and wind speed. Based on these results, temper-ature seems to have the highest correlation with bacterilaconcentration (R = 0.613, p < 0.001, n = 120). The stud-ies of Kristanto and Rosana (2017) confirm that there isa significant correlation between air temperature and airhumidity as well as wind speed and bacterial concentra-tion (p = 0.012; p = 0.001; p = 0.015, respectively) andas for fungal concentration, there is only a significantcorrelation with air humidity (p = 0.000). Air humidityhas the highest correlation with both the concentrationof bacteria and fungi indicating that air humidity caninfluence bioaerosol concentration (the higher the hu-midity, the higher the concentration of bioaerosol).Mouli et al. (2005) also discussed the influence ofmeteorological factors (temperature, relative humidity,and wind velocity) on the occurrence of bacteria inTirupati (India). Among these factors, wind speed hadthe highest influence on bacterial concentration with aregression coefficient (β) ranging from 0.225 to 2.092,followed by temperature, for which the regression coef-ficient (β) ranged from 0.740 to − 0.745. Wind speed
Table 5 Descriptive statistics of microclimatic parameters
Study period n Averagevalue (x)
Standarddeviation(SD)
Medianvalue (Med.)
Minimumvalue (Min.)
Maximumvalue (Max.)
BottomquartileQ1 (25%)
UpperquartileQ3 (75%)
Range (R)
Temperature (°C)
Spring 94 16.0 5.3 16.9 3.0 25.3 12.7 20.1 22.3
Summer 102 23.6 5.9 21.7 15.4 39.3 19.4 27.0 23.9
Autumn 114 11.3 5.2 11.8 − 1.0 22.5 7.9 14.6 23.5
Winter 105 5.8 5.8 6.5 − 13.5 17.8 4.3 9.1 31.3
Total annum 415 14.0 8.6 13.6 − 13.5 39.3 7.8 19.8 52.8
Humidity (%)
Spring 94 43.6 12.9 41.0 24.0 74.0 33.0 50.0 50.0
Summer 102 47.7 14.0 50.5 24.0 81.0 36.0 57.0 57.0
Autumn 114 69.9 13.7 70.5 37.0 99.8 59.2 79.0 62.8
Winter 105 64.1 12.9 62.0 42.0 94.0 55.0 73.0 52.0
Total annum 415 57.0 17.3 56.0 24.0 99.8 44.0 69.0 75.8
Wind velocity (m/s)
Spring 82 1.2 0.9 0.8 0.0 3.5 0.5 1.5 3.5
Summer 90 1.3 0.7 1.3 0.0 3.5 0.8 1.6 3.5
Autumn 102 1.3 1.0 1.2 0.0 3.4 0.5 2.0 3.4
Winter 93 1.8 1.2 1.4 0.1 5.3 0.9 2.6 5.2
Total annum 367 1.4 1.0 1.2 0.0 5.3 0.6 2.0 5.3
640 Page 12 of 16 Environ Monit Assess (2018) 190: 640

showed a very good positive correlation at each locationsignifying that the bacteria concentration will increasewith increasing wind velocity. In contrast, relative hu-midity (RH) showed a relatively low influence on air-borne bacteria. The results of my studies did not confirmthe statements of Mouli et al. (2005) regarding theexistence of a significant correlation between windspeed and microbial abundance.
During the study of bioaerosols on aircraft boards,Stobnicka et al. (2016) observed relatively low shifts oftemperature (11.1–15.7 °C) and humidity (20–45%).Based on the results of Spearman’s correlations, theauthors established that the air temperature had a signif-icant influence on the concentration of bacteria in the air(p < 0.05), whereas it had no impact on the concentra-tion of fungi (p > 0.05). The relative humidity did notdetermine the concentrations of bioaerosols in a signif-icant manner (p > 0.05). According to Shravanthi et al.(2016), the number and composition of the air micro-flora in the premises of sewage treatment plants dependon the area of sewage exposed to atmospheric factors,the type and degree of sewage contamination, means ofsewage management, atmospheric and climatic condi-tions, mixing and transportation of sewage, and gather-ing and lengthy storage of unstable biomass as well aselevated temperature are conducive to bioaerosols for-mation. While analyzing the levels of microbiologicalload in the air of a particular WWTP area (Visakhapat-nam, India) depending on climatic conditions, a greaternumber of microbes was usually observed in the monthsof lower temperatures (winter) and stronger winds. Onthe contrary, Carducci et al. (2000) did not find anysignificant relationship between meteorological param-eters and the number of bacterial colonies. A differentset of data was reported by Korzeniewska et al. (2009),concluding that the majority of the analyzed groups ofmicroorganisms was strongly correlated with the airtemperature (with the exception of staphylococci andenterococci) or weakly correlated with air humidity(with the exception of fungi, yeast, psychrophilic andhemolytic bacteria). Partially different relations wereobserved in the framework of this study. In most cases,the temperature had a significant influence on the abun-dance of fungi (the higher the temperature, the higherthe concentration of fungi), whereas in the case ofbacteria, both negative and positive correlations wereobserved in some WWTPs (values ranging from −0.650 to 0.846; p < 0.05). In several WWTPs, the rela-tive humidity also had a significant positive influence on
the concentration of fungi grown using the Waksmanmedium (from 0.417 to 0.601), whereas in the case ofbacteria, the correlations were notably more rare andmore diverse (both positive and negative). According toHan et al. (2018), the capacity of WWTP, distance fromthe emission source, the type and performance of de-vices used to separate the sludge, quality of wastewater,and possible hermetization of treatment stages had aninfluence on the emission of bioaerosols. The highestconcentrations of bacteria were observed during sum-mer at high temperature (above 28 °C) and humidity(55–85%). Therefore, it was concluded that humidity ispositively correlated with microbial abundance. Thestudies of Fernando and Fedorak (2005) indicate thathermetization of objects and fine bubble aeration nota-bly decrease the emission of microorganisms to air,whereas an intense, turbulent flow of wastewater andlack of ventilation increase the emission of bioaerosols.All research results obtained after the modernization ofWWTP were statistically lower (p < 0.05). The authorsconcluded that the decrease of bioaerosol emission willpositively affect the health of employees, which areexposed to pathogens.
The studies of Sabariego et al. (2000) were focusedon the influence of meteorological factors on the chang-es of abundance of spores of different genera of airbornefungi in Granda (southern Spain). The results showedthat the genera Alternaria and Cladosporium were pos-itively correlated (p ≤ 0.01) with the temperature andsunlight. In contrast, the genera Ustilago showed nega-tive correlation coefficients with temperature, sunlight,and wind speed and positive coefficients with relativeair humidity. In my studies, it was established that theabundance of fungi was usually the highest in all waste-water treatment plants and in most cases, it was posi-tively correlated with both temperature and air humidity.
Conclusions
Studies of bioaerosol emission in 11 WWTPs indicat-ed that a diverse abundance of bacteria and micro-scopic fungi emitted to the air environment can beobserved at the subsequent wastewater treatmentstages. In general, the microscopic fungi occurred athighest concentration, followed by psychrophilic andmesophilic bacteria, the abundance of which was veryhigh at times. The maximum concentrations of micro-scopic fungi on the WWTPs ranged from 6040 to
Environ Monit Assess (2018) 190: 640 Page 13 of 16 640

1,148,530 CFU m−3 using the Waksman medium andfrom 11,900 to 1,034,270 CFUm−3 using the Czapek-Doxmedium. Themaximum concentration of bacteriavaried for specific groups and ranged from 7320 to307,600 CFU m−3 for psychrophilic bacteria, from3200 to 195,000 CFU m−3 for mesophilic bacteria,and from 80 to 87,530 CFU m−3 in the case of coliformbacteria. The median values for fungi were more similarand oscillated between 740 and 6700 CFU m−3, whereasin the case of bacteria, the values were considerably lowerand reached from 760 to 4800 CFU m−3 in the case ofpsychrophilic bacteria, from 160 to 1300 CFUm−3 in thecase of mesophilic bacteria, and from 0 to 26 CFUm−3 inthe case of coliform bacteria. The obtained results indi-cate that a periodic, strong air contamination occurs at theareas of wastewater treatment plants. In contrast, in thecase of control stations, the concentrations of all micro-bial groups were multiple times lower compared to theareas of WWTPs. By analyzing the variable abundancesof the studied microorganisms at specific seasons, it wasestablished that the highest median value for the majorityof microorganisms occurred in summer or autumn, whilethe lowest occurred in winter.
Based on the Kruskal-Wallis test (statistical signifi-cance at p < 0.05), the comparison of median abundancevalues for bacteria and microscopic fungi in an annualcycle revealed statistically significant differences be-tween them. The median abundance values for bacteriaand microscopic fungi were used to conduct a clusteranalysis and compared the studied WWTPs. The calcu-lations and the dendrogram indicate that at a bindingdistance level equal to 4, there were four WWTP clus-ters, whereas at the level of 2.5, there were six clusters.In both cases, two WWTPs were notably distinct fromother objects, both of which contained an additionalsludge composting site on their area.
The similarity of WWTPs was decided based on thedominance and abundance of microorganisms as well asadditional contamination sources, whereas no clear sim-ilarities in terms of capacity were noted. Based on thecalculation of Spearman’s range of correlation coeffi-cients, it was established that the most significant corre-lations between the microbial abundance and tempera-ture as well as humidity occurred in the case of micro-scopic fungi, whereas the correlations between bacteriaand microclimatic parameters were less abundant andless diverse.
The obtained results allow to conclude that the stud-ied wastewater treatment plants are a significant source
of emissions of bacterial and fungal aerosols despiteproper exploitation and correctly conducted treatmentprocesses.
Compliance with ethical standards
Conflict of interest The author declares that he has no conflictof interest.
Open Access This article is distributed under the terms of theCreative Commons Attribution 4.0 International License (http://creativecommons.org/licenses/by/4.0/), which permits unrestrict-ed use, distribution, and reproduction in any medium, providedyou give appropriate credit to the original author(s) and the source,provide a link to the Creative Commons license, and indicate ifchanges were made.
References
Adamus-Białek, W., Wawszczak, M., & Świercz, A. (2015).Impact of sewage treatment plant on local environment.Proceedings of ECOpole, 9(2), 397–404. https://doi.org/10.2429/proc.2015.9(2)047.
Ahmadzadeh, S., & Dolatabadi, M. (2018a). Removal of acet-aminophen from hospital wastewater using electro-Fentonprocess. Environmental Earth Sciences, 77, 53, 11 pages.https://doi.org/10.1007/s12665-017-7203-7.
Ahmadzadeh, S., & Dolatabadi, M. (2018b). In situ generationof hydroxyl radical for efficient degradation of 2,4-dichlo-rophenol from aqueous solutions. EnvironmentalMonitoring and Assessment, 190(6), 340, 11 pages.https://doi.org/10.1007/s10661-018-6697-0.
Ahmadzadeh, S., & Dolatabadi, M. (2018c). Modeling and kinet-ics study of electrochemical peroxidation process for miner-alization of bisphenol A; a new paradigm for groundwatertreatment. Journal of Molecular Liquids, 254, 76–82.https://doi.org/10.1016/j.molliq.2018.01.080.
Ahmadzadeh, S., Asadipour, A., Pournamdari, M., Behnam, B.,Rahimi, H. R., & Dolatabadi, M. (2017a). Removal of cip-rofloxacin from hospital wastewater using electrocoagulationtechnique by aluminum electrode: optimization and model-ling through response surface methodology. Process Safetyand Environmental Protection, 109, 538–547. https://doi.org/10.1016/j.psep.2017.04.026.
Ahmadzadeh, S., Asadipour, A., Yoosefian, M., & Dolatabadi, M.(2017b). Improved electrocoagulation process using chitosanfor efficient removal of cefazolin antibiotic from hospitalwastewater through sweep flocculation and adsorption: ki-netic and isotherm study. Desalination and Water Treatment,92, 160–171. https://doi.org/10.5004/dwt.2017.21492.
Bauer, H., Kasper-Giebl, A., Löflund, M., Giebl, H., Hitzenberger,R., Zibuschka, F., & Puxbaum, H. (2002). The contributionof bacteria and fungal spores to the organic carbon content ofcloud water, precipitation and aerosols. Atmospheric
640 Page 14 of 16 Environ Monit Assess (2018) 190: 640

Research, 64, 109–119. https://doi.org/10.1016/S0169-8095(02)00084-4.
Blanchard, D. C., & Syzdek, L. (1970). Mechanism for the water-to-air transfer and concentration of bacteria. Science, 170,626–628. https://doi.org/10.1126/science.170.3958.626.
Brągoszewska, E., & Pastuszka, J. S. (2018). Influence of meteo-rological factors on the level and characteristics of culturablebacteria in the air in Gliwice, Upper Silesia (Poland).Aerobiologia, 34, 1–15. https://doi.org/10.1007/s10453-018-9510-1.
Brągoszewska, E., Mainka, A., & Pastuszka, J. S. (2017).Concentration and size distribution of culturable bacteria inambient air during spring and winter in Gliwice: a typicalurban area. Atmosphere, 8, 239, 13 pages. https://doi.org/10.3390/atmos8120239.
Brągoszewska, E., Biedroń, I., Kozielska, B., & Pastuszka, J. S.(2018). Microbiological indoor air quality in an officebuilding in Gliwice, Poland: analysis of the case study.Air Quality, Atmosphere & Health, 11 , 729–740.https://doi.org/10.1007/s11869-018-0579-z.
Carducci, A., Tozzi, E., Rubulotta, E., Casini, B., Cantiani, L.,Rovini, E., Muscillo, M., & Pacini, R. (2000). Assessingairborne biological hazard from urban wastewater treat-ment. Water Research, 34(4), 1173–1178. https://doi.org/10.1016/S0043-1354(99)00264-X.
Dungan, R. S. (2012). Use of a culture-independent approach tocharacterize bacteria near an open-freestall dairy opera-tion. Environment International, 41, 8–14. https://doi.org/10.1016/j.envint.2011.12.004.
Fernando, N. L., & Fedorak, P. M. (2005). Changes at an activatedsludge sewage treatment plant alter the numbers of airborneaerobic microorganisms. Water Research, 39(19), 4597–4608. https://doi.org/10.1016/j.watres.2005.08.010.
Fouladgar, M., & Ahmadzadeh, S. (2016). Application of a nano-structured sensor based on NiO nanoparticles modified car-bon paste electrode for determination of methyldopa in thepresence of folic acid. Applied Surface Science, 379, 150–155. https://doi.org/10.1016/j.apsusc.2016.04.026.
Fuzzi, S., Andrea, M. O., Huebert, B. J., Kulmala, M., Bond, T. C.,Boy, M., Doherty, S. J., Guenther, A., Kanakidou, M.,Kawamura, K., Kerminen, V. M., Lohmann, U., Russell, L.M., & Pöschl, U. (2006). Critical assessment of the currentstate of scientific knowledge, terminology, and researchneeds concerning the role of organic aerosols in the atmo-sphere, climate, and global change. Atmospheric Chemistryand Physics, 6, 2017–2038. https://doi.org/10.5194/acp-6-2017-2006.
Górny, R. L., & Dutkiewicz, J. (2002). Bacterial and fungalaerosols in indoor environment in Central and EasternEuropean countries. Annales of Agricultural andEnvironmental Medicine, 9(1), 17–23 https://www.researchgate.net/publication/11287910_Bacterial_and_Fungal_Aerosols_in_Indoor_Environment_in_Central_and_Eastern_European_Countries.
Gregová, G., Venglovský, J., Vargová, M., Ondrašovičová, O.,Ondrašovič, M., Sasáková, N., Kudriková, D., & Laktičová,K. (2008). Bioaerosols produced by wastewater treatmentplant. Folia Veterinaria, 52(2), 59–61 http://www.uvlf.sk/document/folia-veterinaria-volume-52-issue-2.pdf.
Han, Y., Wang, Y., Li, L., Xu, G., Liu, J., & Yang, K. (2018).Bacterial population and chemicals in bioaerosols from
indoor environment: sludge dewatering houses in nine mu-nicipal wastewater treatment plants. Science of the TotalEnvironment, 618, 469–478. https://doi.org/10.1016/j.scitotenv.2017.11.071.
Kassim, A., Rezayi, M., Ahmadzadeh, S., Rounaghi, G.,Mohajeri, M., Yusof, N. A., Tee, T. W., Heng, L. Y., &Abdullah, A. H. (2011). A novel ion–selective polymericmembrane sensor for determining thallium (I) with highselectivity. IOP Conference Series: materials science andengineering, IOP Publishing, 17, 012010, 7 pages.https://doi.org/10.1088/1757-899X/17/1/012010.
Korzeniewska, E., Filipkowska, Z., Gotkowska-Płachta, A.,Janczukowicz, W., Dixon, B., & Czułowska, M. (2009).Determination of emitted airborne microorganisms from aBIO-PAK wastewater treatment plant. Water Research, 43(11),2841–2851. https://doi.org/10.1016/j.watres.2009.03.050.
Kristanto, G. A., Rosana, F. N. (2017). Analysis of microbial airquality in the surrounding hospital’s wastewater treatmentplants in Jakarta, Indonesia. MATEC web of conferences 138,08004, 1–8. https://doi.org/10.1051/matecconf/201713808004.
Li, Y., Qiu, X., Li, M., Ma, Z., Niu, T., & Feng, Y. (2012).Concentration and size distribution of airborne actinomycetesin a municipal wastewater treatment plant. Polish Journal ofEnvironmental Studies, 21(5), 1305–1311 http://www.pjoes.com/Issue-5-2012,3846.
Maki, T., Hara, K., Iwata, A., Lee, K. C., Kawai, K., Kai, K.,Kobayashi, F., Pointing, S. B., Archer, S., Hasegawa, H., &Iwasaka, Y. (2017). Variations in airborne bacterial commu-nities at high altitudes over the Noto Peninsula (Japan) inresponse to Asian dust events. Atmospheric Chemistry andPhysics, 17, 11877–11897. https://doi.org/10.5194/acp-17-11877-2017.
Mandal, J., & Brandl, H. (2011). Bioaerosols in indoor environ-ment – a review with special reference to residential andoccupational locations. The Open Environmental &Biological Monitoring Journal, 4, 83–96. https://doi.org/10.2174/1875040001104010083.
Mentese, S., & Tasdibi, D. (2016). Airborne bacteria levels inindoor urban environments: the influence of season andprevalence of sick building syndrome (SBS). Indoor andBuilt Environment, 25(3), 563–580. https://doi.org/10.1177/1420326X14562454.
Michałkiewicz, M., Pruss, A., Dymaczewski, Z., Jeż-Walkowiak,J., & Kwaśna, S. (2011). Microbiological air monitoringaround municipal wastewater treatment plants. PolishJournal of Environmental Studies, 20(5), 1243–1250http://www.pjoes.com/Issue-5-2011,3840.
Mouli, P. C., Mohan, S. V., & Reddy, S. J. (2005). Assessment ofmicrobial (Bacteria) concentrations of ambient air at semi-aridurban region: influence of meteorological factors. AppliedEcology and Environmental Research, 3(2), 139–149http://citeseerx.ist.psu.edu/viewdoc/download;jsessionid=085E D 7 A 6 B E 4 A C 6 6 8 D 5 8 6 B 9 A 7 8 F D D F E 5 5?doi=10.1.1.581.2650&rep=rep1&type=pdf.
Niazi, S., Hassanvand, M. S., Mahvi, A. H., Nabizadeh, R.,Alimohammadi, M., Nabavi, S., Faridi, S., Dehghani, A.,Hoseini, M., Moradi-Joo, M., Mokamel, A., Kashani, H.,Yarali, N., & Yunesian, M. (2015). Assessment of bioaerosolcontamination (bacteria and fungi) in the largest urban waste-water treatment plant in the Middle East. Environmental
Environ Monit Assess (2018) 190: 640 Page 15 of 16 640

Science and Pollution Research, 22, 16014–16021.https://doi.org/10.1007/s11356-015-4793-z.
O’Connor, D. J., Daly, S. M., & Sodeau, J. R. (2015). On-linemonitoring of airborne bioaerosols released from acomposting/green waste site. Waste Management, 42, 23–30. https://doi.org/10.1016/j.wasman.2015.04.015.
Pardakhty, A., Ahmadzadeh, S., Avazpour, S., & Gupta, V. K.(2016). Highly sensitive and efficient voltammetric determi-nation of ascorbic acid in food and pharmaceutical samplesfrom aqueous solutions based on nanostructure carbon pasteelectrode as a sensor. Journal of Molecular Liquids, 216,387–391. https://doi.org/10.1016/j.molliq.2016.01.010.
Pastuszka, J. S., Iwasiewicz, P., & Brągoszewska, E. (2013).Preliminary testing of a new bioaerosols sampler developedfor the measurements of low and medium concentrationlevels of airborne bacteria and fungi. EnvironmentalProtection Engineering, 39(1), 129–138. https://doi.org/10.5277/epe130110.
PN-89/Z-04111/02 (1989). Polish Standard. Air purity protection.Microbiological testings. Determination number of bacteriain the atmospheric air (imision) with sampling by aspirationand sedimentation method. (In Polish).
PN-89/Z-04111/03 (1989). Polish Standard. Air purity protection.Microbiological testings. Determination number of the fungiin the atmospheric air (imision) with sampling by aspirationand sedimentation method. (In Polish).
Pringle, A. (2013). Asthma and the diversity of fungal spores inair. PLoS Pathogens, 9(6), e1003371. https://doi.org/10.1371/journal.ppat.1003371.
Roodbari, A., Naddafi, K., & Javid, A. (2013). Measurements ofbioaerosols in the air around the facilities of waste collectionand disposal. Environmental Protection Engineering, 39(4),105–112. https://doi.org/10.5277/epe130409.
Sabariego, S., Díaz de la Guardia, C., &Alba, F. (2000). The effectof meteorological factors on the daily variation of airbornefungal spores in Granada (southern Spain). InternationalJournal of Biometeorology, 44(1), 1–5. https://doi.org/10.1007/s004840050131.
Sánchez-Monedero, M., Aguilar, M., Fenoll, R., & Roig, A.(2008). Effect of the aeration system on the levels of airbornemicroorganisms generated at wastewater treatment plants.Water Research, 42(14), 37393744–37393744. https://doi.org/10.1016/j.watres.2008.06.028.
Shravanthi, M. C., Kumar, N. R., & Reddy, T. B. (2016). A studyon isolation and identification of airborne bacteria at threedifferent sewage treatment plant locations in Visakhapatnam
City, A.p. International Journal of Science and Research,5 ( 4 ) , 75–77 h t t p s : / /www.wo r l dw ide j ou rna l s .com/international-journal-of-scientif ic-research-(IJSR)//articles.php?val=NzcyNg==&b1=157&k=40.
Soltani, H., Pardakhty, A., & Ahmadzadeh, S. (2016).Determination of hydroquinone in food and pharmaceuticalsamples using a voltammetric based sensor employing NiOnanoparticle and ionic liquids. Journal of Molecular Liquids,219, 63–67. https://doi.org/10.1016/j.molliq.2016.03.014.
Stobnicka, A., Górny, R., Gołofit-Szymczak, M., Cyprowski, M.,&Ławniczek-Wałczyk, A. (2016).Microbial agents on boardof light passenger aircrafts. Annual Set The EnvironmentProtection, 18, 492–505 (In Polish) http://ros.edu.pl/images/roczniki/2016/No2/37_ROS_N2_V18_R2016.pdf.
Świechowski, R., Balcerczak, E., Żebrowska, M., & Jeleń, A.(2015). Evaluation of ABCC1 gene expression, encodingMRP1, in patients with depression. Folia MedicaLodziensia, 42(2), 107–122 (In Polish) http://yadda.icm.edu.pl/yadda/element/bwmeta1.element.psjd-6306d68c-6859-4321-8f28-e64a6225a9e3.
Thorn, J., Beijer, L., Jonsson, T., & Rylander, R. (2002).Measurement strategies for the determination of airbornebacterial endotoxin in sewage treatment plants. The Annalsof Occupational Hygiene, 46(6), 549–554. https://doi.org/10.1093/annhyg/mef068.
Tomasi, C., & Lupi, A. (2017). Primary and secondary sources ofatmospheric aerosol. In C. Tomasi, S. Fuzzi, & A.Kokhanovsky (Eds.), Atmospheric aerosols: life cycles andeffects an air quality and climate (pp. 1–86). Weinheim:Wiley-VCH Verlag GmbH & Co. KGaA. https://doi.org/10.1002/9783527336449.ch1.
Uhrbrand, K., Schultz, A. C., & Madsen, A. M. (2011). Exposureto airborne noroviruses and other bioaerosol components at awastewater treatment plant in Denmark. Food andEnvironmental Virology, 3(3–4), 130–137. https://doi.org/10.1007/s12560-011-9068-3.
Wéry, N. (2014). Bioaerosols from composting facilities - a re-view. Frontiers in Cellular and Infection Microbiology,4(42), 1–9. https://doi.org/10.3389/fcimb.2014.00042.
Yoosefian, M., Ahmadzadeh, S., Aghasi, M., & Dolatabadi, M.(2017). Optimization of electrocoagulation process for effi-cient removal of ciprofloxacin antibiotic using iron electrode;kinetic and isotherm studies of adsorption. Journal ofMolecular Liquids, 225, 544–553. https://doi.org/10.1016/j.molliq.2016.11.093.
640 Page 16 of 16 Environ Monit Assess (2018) 190: 640