Embed Size (px)
Citation preview

BRIEF COMMUNICATION
Comparison of Whole-Genome DNA Methylation Patternsin Whole Blood, Saliva, and Lymphoblastoid Cell Lines
Tara M. Thompson • Duaa Sharfi • Maria Lee •
Carolyn M. Yrigollen • Oksana Yu Naumova •
Elena L. Grigorenko
Received: 10 November 2012 / Accepted: 13 December 2012 / Published online: 27 December 2012
� Springer Science+Business Media New York 2012
Abstract Epigenetic mechanisms, including DNA meth-
ylation, that underlie neuropsychiatric conditions have
become a promising area of research. Most commonly used
DNA sources in such studies are peripheral (whole) blood
(WB), saliva (SL), and lymphoblastoid cell lines (LCLs);
thus, the question of the consistency of DNA methylation
patterns in those cells is of particular interest. To investi-
gate this question we performed comparative analyses of
methylation patterns in WB, SL, and LCLs derived from
the same individuals, using Illumina HumanMethylation27
BeadChip arrays. Our results showed that DNA methyla-
tion patterns in SL are relatively consistent with those in
WB, whereas the patterns in LCLs are similarly distinct
from both WB and SL. The results indicated that due to
multiple random and directed changes in DNA methylation
throughout cell culturing, LCLs are not a reliable source of
DNA for epigenetic studies and should be used with
caution when investigating epigenetic mechanisms under-
lying biological processes.
Keywords Lymphoblastoid cell lines � Saliva � Whole
blood � DNA methylation � Methylation pattern
Introduction
DNA methylation is a well-known mechanism of genes
activity regulation that provides valuable information on
development, typical functioning and disorders (Laird
2003), including neuropsychiatric conditions (Abdo-
lmaleky et al. 2004, 2008; Feng and Fan 2009; Hsieh and
Elisch 2010; Mill et al. 2008; Nohesara et al. 2011).
Studies have provided evidence that individuals with neu-
ropsychiatric disorders can be distinguished by epigenetic
encoding disturbances found in both the brain and sec-
ondary tissues (Abdolmaleky et al. 2008; Feng and Fan
2009; Hsieh and Elisch 2010; Iwamoto et al. 2004; Mill
et al. 2008). Among those ‘‘secondary tissues,’’ peripheral
blood (whole blood, WB), saliva (SL), and lymphoblastoid
cell lines (LCLs) are most commonly used as sources of
Edited by John K. Hewitt.
Electronic supplementary material The online version of thisarticle (doi:10.1007/s10519-012-9579-1) contains supplementarymaterial, which is available to authorized users.
T. M. Thompson � D. Sharfi � M. Lee � C. M. Yrigollen �O. Y. Naumova � E. L. Grigorenko
Yale University, New Haven, CT, USA
D. Sharfi
University of Illinois, Chicago, IL, USA
C. M. Yrigollen
University of California, Davis, CA, USA
O. Y. Naumova
Vavilov Institute of General Genetics of the Russian Academy
of Sciences, Moscow, Russian Federation
E. L. Grigorenko
Moscow State University for Psychology and Education,
Moscow, Russian Federation
E. L. Grigorenko
Columbia University, New York, NY, USA
E. L. Grigorenko (&)
Child Study Center, Department of Psychology, Department
of Epidemiology and Public Health, Yale University, 230 South
Frontage Road, New Haven, CT 06519-1124, USA
e-mail: [email protected]
123
Behav Genet (2013) 43:168–176
DOI 10.1007/s10519-012-9579-1

genomic DNA in epigenetic research (Hu et al. 2006;
Kaminsky et al. 2009; Nguyen et al. 2010; Nohesara et al.
2011; Sapienza et al. 2011; Tierling et al. 2011). Conse-
quently, the question of the consistency of the methylation
profiles derived from these cells and tissues is of particular
interest. One study has reported that, at least in the context
of investigating genomic sex effects on DNA methylation,
SL DNA has shown a pattern of methylation consistent
with WB DNA (Liu et al. 2010). Yet, the degree of con-
vergence between patterns of methylation for LCLs and
WB or SL might be different as random DNA methylation
pattern changes may be observed in LCLs when compared
to the original B-lymphocytes from which they originated
(Brennan et al. 2009; Grafodatskaya et al. 2010).
Here, we present the results of a comparison between
whole genome methylation profiles of WB, LCLs, and SL
samples derived from the same individuals. The aims of this
study were twofold: (1) to establish the degree of differences/
similarities in the DNA methylation patterns in the tissues
most commonly used in epigenetic studies; and (2) to explore
the scope of epigenetic alterations occurring in LCLs.
Materials and methods
Sample collection and processing
WB and SL samples were derived from 14 healthy indi-
viduals (ten females and four males ranging in age from 7
to 61 years old) from an indigenous Slavic population of
Northern Russia. Informed consent was obtained from all
participants who donated biological samples. Two vials of
saliva were collected from each individual using BD vac-
utainers containing ACD (BD, Franklin Lakes, NJ) and
Oragene-DNA collection kits (DNAgenotek, Ontario,
Canada), respectively.
LCLs were established by transforming lymphocytes
with the Epstein-Barr Virus (EBV) according to standard
procedures (Neitzel 1986); these were cultured for
4 weeks, then cryopreserved prior to DNA extraction.
Genomic DNA was extracted from WB samples using the
FlexiGene DNA Kit, according to the manufacturer’s
protocol (Qiagen, Mississauga, ON); from LCLs using
phenol–chloroform and ethanol precipitation; and from SL
following the Oragene Laboratory protocol.
DNA methylation analysis
Analysis of DNA methylation profiles in the three sets of
tissues from the same individuals was performed using
Infinium HumanMethylation27 BeadChip assay (Illumina,
San Diego, CA), which contains 27,578 CpG targets cov-
ering 14,495 genes. Bisulfite treatment, whole genome
amplification, labeling, hybridization and scanning were
performed at the Yale Center for Genomic Analysis http://
medicine.yale.edu/keck/ycga/index.aspx).
The methylation data generated by the array were ana-
lyzed using the Illumina GenomeStudio software package.
The methylation status of each CpG site was measured as
the ratio of signal from methylated probe to the sum of both
methylated and unmethylated signals (b value, ranges from
0, unmethylated, to 1, fully methylated). All CpG sites with
a detection p value C0.001 were removed from later
analyses; the p values were obtained using a background
model in the Genome Studio. Three technical replicates
were run across different BeadChips; pairwise comparison
of these replicates showed consistent and highly repro-
ducible methylation level measurements (r2 varied between
0.98 and 0.99); on average 27,566 ± 12 probes showed no
significant (p B 0.01) differences in b values.
Differential methylation analysis
The Illumina methylation data were processed and ana-
lyzed using the Methylation Module v1.8 of the Illumina
GenomeStudio. For comparison of whole-genome meth-
ylation profiles across the samples, correlations and hier-
archical clustering were used; the results of the analysis are
provided in the form of a dendrogram. To prevent vari-
ability among samples within a tissue set related to gender,
CpG sites localized on sex chromosomes were excluded,
leaving 26,273 sites to be analyzed.
Differential methylation analysis between sets of sam-
ples representing three tissues was performed based on
differences in the mean beta value (Avgb) of each CpG
site, or Delta Avgb (Db). To account for multiple testing,
the Illumina Custom Error Model with the False Discovery
Rate (FDR) corrections was applied; we ran 1000 permu-
tations and included FDR up to 20 %. Targets showing
significant intergroup differences in methylation levels (the
methylation Difference Score, DiffScore [|30|, p \ 0.001)
more than 0.2 were considered to be differentially meth-
ylated (Grafodatskaya et al. 2010).
Functional annotation of differentially methylated
genes (DMEGs)
To identify common biological processes and pathways,
molecular functions, and cellular components for genes
that showed differential methylation in the tissues ana-
lyzed, we applied the Database for Annotation, Visualiza-
tion and Integrated Discovery (DAVID) bioinformatics
software (Dennis et al. 2003; Huang et al. 2008). For this
analysis the default (medium stringency) setting of the
DAVID analysis tool was used, which compares the
enrichment of gene ontology (GO) with the list of
Behav Genet (2013) 43:168–176 169
123
differentially methylated genes (DMEGs) using Fisher’s
exact test. Annotation clusters with enrichment scores[1.3
(p \ 0.05) were included in the analysis. GO terms with
FDRs \20 % were used to avoid reporting false positives
and to reduce the large number of associations identified by
DAVID in the functional annotation charts. The p values
and the Benjamini corrections of the scores from the tool
were used as inclusion criteria in the trimming of the
clusters to overrepresented term lists.
Results
We examined whole genome methylation patterns in three
types of biological samples—whole blood (WB), saliva (SL)
and lymphoblastoid cell lines (LCLs), which are widely used
as a source of genomic DNA in epigenetic studies, and per-
formed a comparative DNA methylation analysis across
these three tissues derived from the same 14 individuals.
Global methylation levels of DNA from three sets of samples
(SLs, LCLs and WBs) were carried out using the Illumina
Infinium HumanMethylation27 BeadChip.
The resulting methylation data were analyzed by means
of pairwise comparison of genome-wide DNA-methylation
profiles across WB, SL and LCLs samples, and differential
methylation analysis between groups of samples corre-
sponding to different tissues. The analysis was performed
based on 26,273 Illumina targets, which had passed
detection quality filtering for differential methylation
analysis and were localized on autosomes. To assess the
DNA methylation differences between different tissues in
GO terms we performed functional annotation of genes,
which showed differential methylation in pairwise com-
parisons across the three sets of samples, WB, SL and
LCLs.
Comparison of global DNA methylation profiles
To assess the main differences in the genome-wide DNA-
methylation of the three studied sets of samples, WB, SL
and LCLs, we performed Euclidean hierarchical clustering
analysis of the Illumina methylation data. The results of the
analysis are represented in a dendrogram (Fig. 1), which
leads to the following observations. First, the source of
Fig. 1 Euclidean hierarchical clustering of 14 individuals based on
the pair-wise comparison of the whole genome methylation profiles in
WB, SL and LCLs. The dendrogram shows a clear separation of the
samples from the different tissues into three distinct clusters, those
containing samples from SL, whole blood (WB), and LCLs, marked
as clusters I, II, and III, respectively
170 Behav Genet (2013) 43:168–176
123

DNA is the main factor in sample differentiation: the
dendrogram shows a clear separation of WB, LCLs, and SL
into three distinct clusters, marked in the figure by Roman
numerals. Second, according to the distances between
samples within a cluster, WB samples (Fig. 1; cluster II)
show minimal interindividual variability with the highest
correlations (r2 = 0.992 ± 0.002) between individual
methylation profiles compared to SL and LCLs. Whereas
SL and LCLs (Fig. 1; clusters I and III) are characterized
by average and distinctively high interindividual variability
of their methylation profiles; r2 = 0.980 ± 0.019 and
0.955 ± 0.018, respectively. Third, the methylation pro-
files of DNA from SL and WB show a greater similarity in
the comparison across all three groups, whereas LCLs
cluster maximally remotely from the two others. The last
observation on the distance of LCLs from SL and WB was
confirmed by correlation analysis between methylation
levels across these three tissues. The correlation coefficient
for SL compared to WB (r2 = 0.967) was much higher
than those for LCLs compared to WB, and LCLs compared
Fig. 2 The distributions of the
methylation levels (Avgb) of
26,273 CpG sites contained in
the Illumina Infinium27 array
that had passed detection quality
filtering and were localized on
autosomes, in three groups of
DNA samples derived from
blood (a), saliva (b) and
lymphoblastoid cell lines (c)
Behav Genet (2013) 43:168–176 171
123

to SL (r2 = 0.880 and 0.844, respectively). These corre-
lations across WB, SL, and LCLs as groups of samples are
consistent with the data on the correlations between the
cell/tissue types within individuals (Online Resource,
Table S1).
Comparison of the distributions of the methylation
levels across the three sets, SL, WB and LCLs, showed that
hypo and hypermethylation patterns are especially different
between these three cell types. Specifically, the methyla-
tion profiles of LCLs are characterized by a lower fre-
quency of CpG sites with high methylation levels, as well
as unmethylated CpG sites compared to WB and SL
(Fig. 2). This analysis shows that LCLs differ predomi-
nantly in areas of up and down regulated genes.
Differential methylation analyses and functional
annotation of DMEGs
Data was then analyzed to detect differential methylation
patterns of DNA obtained from three groups of samples
corresponding to the three cell types. CpG sites showing
significant (p \ 0.001) intergroup differences of at least
1.2-fold change in methylation levels were considered to be
differentially methylated. The results of the pair-wise
comparison between sets of samples are presented in sup-
plementary materials (Online Resource, Table S2–S4). The
distribution of DMEGs across pairwise comparisons is
shown in Fig. 3.
The minimal number of differentially methylated sites
was found in the comparison of DNA from WB and SL: of
the 27,578 CpG sites initially analyzed, 488 sites showed a
significant difference in methylation level measurements
(Online Resource, Table S2; Fig. 3). These 488 CpG sites
are located on 431 genes, which represents *3 % of the
total number of genes (14,495) contained in the Illumina’s
array (Online Resource, Table S5). The majority of sites
(n = 370; *76 %) are downregulated in SL compared to
WB. The remaining sites were characterized by upregula-
tion (n = 118; * 24 %) in SL. This corresponds to the
results in Fig. 2, where blood showed more occurrences of
hypermethylated sites compared to SL.
Whereas several thousand differentially methylated
CpG sites were found in the comparisons of these two cell
types with LCLs, differential methylation analysis between
WB and LCLs groups revealed that 2,661 sites exhibited a
methylation level difference at the same level of signifi-
cance (Online Resource, Table S3; Fig. 3). These 2,661
CpG sites are located on 2,156 genes, which represent
*15 % of the total number of genes analyzed (Online
Resource, Table S5). As in the WB and SL analysis, a great
majority of the methylated sites (n = 2,545; *96 %) were
downregulated in LCLs compared to WB. Also evident in
Fig. 2 is that LCLs exhibited lower levels of hyperme-
thylated and hypomethylated sites when compared to WB
and SL. The remaining sites were characterized by
upregulation in LCLs (n = 116; *4 %). Similar differ-
ences in methylation levels were found in the comparison
between DNA from SL and LCLs: 2,513 sites (localized on
2,081 different genes) were found to be differentially
Fig. 3 Venn diagram representing the results of differential methyl-
ation analysis across WB, SL and LCLs. The numbers in the circlesrepresent both the number of differentially methylated genes detected
in each pair-wise comparison and the number of overlapping genes
across different comparisons
Table 1 Gene Ontology (GO) terms overrepresented in the list of genes, which showed differential methylation between DNA samples from SL
and WB
GO term Genes, count Genes (%) p value Fold enrichment Benjamini FDR
GO: 0005887—integral to plasma membrane 61 16.05 5.53E-10 2.33 0.0000 0.0000
GO: 0031226—intrinsic to plasma membrane 62 16.32 4.84E-10 2.31 0.0000 0.0000
GO: 0044459—plasma membrane part 87 22.89 1.92E-08 1.79 0.0000 0.0000
GO: 0005886—plasma membrane 121 31.84 1.49E-06 1.45 0.0001 0.0020
GO: 0006955—immune response 35 9.21 1.40E-05 2.25 0.0060 0.0237
GO: 0009611—response to wounding 30 7.89 8.91E-06 2.51 0.0077 0.0151
GO: 0044421—extracellular region part 40 10.53 1.37E-04 1.89 0.0084 0.1832
GO: 0004867—serine-type endopeptidase inhibitor activity 11 2.89 3.79E-05 5.33 0.0203 0.0552
GO: 0050878—regulation of body fluid levels 13 3.42 8.02E-05 4.09 0.0273 0.1354
There were annotated 381 of 431 DMEGs. The GO terms, for which the Benjamini corrections \ 0.05 and FDR \ 0.20, are listed
172 Behav Genet (2013) 43:168–176
123
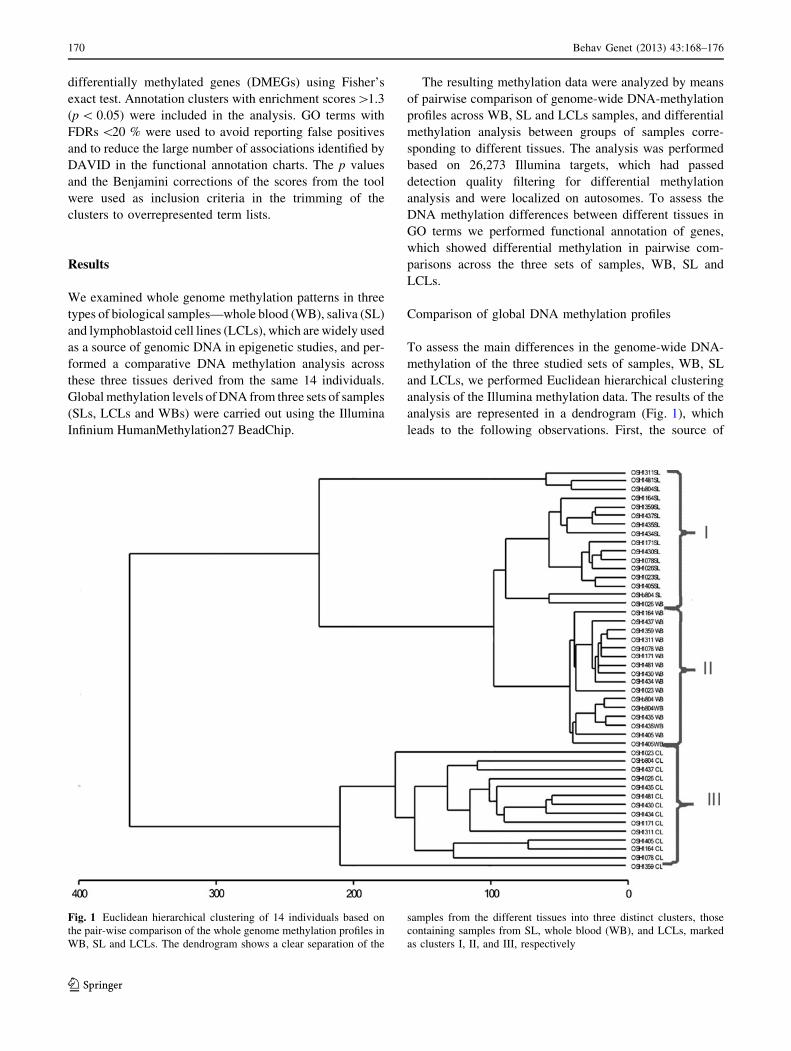
Table 2 Functional annotation and clusters of genes that showed significant differences of their methylation levels in lymphoblastoid cell lines
(LCLs) compared to WB and SL
Term LCLs versus WB LCLs versus SL
Cluster#
(EScore)
Fold
enrichment
Benjamini FDR Cluster#
(EScore)
Fold
enrichment
Benjamini FDR
Disulfide bond 1 (75.8) 2.11 9.96E-79 2.01E-78 1 (76.8) 2.14 1.26E-80 2.65E-80
Signal 2.02 3.54E-77 2.14E-76 2.05 3.08E-79 1.29E-78
Signal peptide 2.01 4.79E-75 2.14E-75 2.04 3.58E-77 1.66E-77
Glycoprotein 1.76 2.33E-64 1.89E-63 1.82 2.18E-71 1.38E-70
Glycosylation site: N-linked
(GlcNAc…)
– – – 1.80 6.99E-64 9.76E-64
Secreted 2 (59.0) 2.59 5.07E-79 2.05E-78 2 (53.4) 2.41 5.20E-62 4.37E-61
Signal 2.02 3.54E-77 2.14E-76 2.05 3.08E-79 1.29E-78
Signal peptide 2.01 4.79E-75 2.14E-75 2.04 3.58E-77 1.66E-77
GO: 0005576—extracellular region 1.97 8.99E-52 2.56E-51 1.89 1.13E-42 3.17E-42
GO: 0005615—extracellular space 2.46 1.05E-31 5.97E-31 2.32 1.12E-25 6.28E-25
GO: 0044421—extracellular region part 2.10 8.15E-28 6.96E-27 1.99 3.55E-22 4.99E-21
Glycoprotein 3 (48.8) 1.76 2.33E-64 1.89E-63 3 (27.9) 1.82 2.18E-71 1.38E-70
Glycosylation site: N-linked
(GlcNAc…)
1.73 3.44E-56 4.61E-56 1.80 6.99E-64 9.76E-64
Topological domain: cytoplasmic 1.49 1.30E-19 3.48E-19 1.78 1.14E-35 2.12E-35
GO: 0006952—defense response 4 (20.8) 2.64 3.05E-31 1.49E-31 5 (20.1) 2.64 1.88E-31 1.81E-31
GO: 0006954—inflammatory response 2.48 1.82E-12 2.66E-12 2.41 3.26E-11 4.71E-11
GO: 0009611—response to wounding 2.05 3.20E-11 6.25E-11 2.02 1.74E-10 5.02E-10
Cytokine 5 (15.8) 3.69 2.24E-18 3.17E-17 7 (9.9) 3.49 1.18E-15 2.73E-14
GO: 0005125—cytokine activity 3.36 1.72E-16 2.35E-16 3.07 1.50E-12 1.98E-12
hsa04060: cytokine–cytokine receptor
interaction
2.11 1.01E-07 1.38E-06 2.35 1.68E-10 1.17E-09
GO: 0031226—intrinsic to plasma
membrane
6 (15.1) 1.71 7.98E-16 9.09E-15 4 (22.6) 1.90 4.05E-24 3.42E-23
GO: 0005887—integral to plasma
membrane
1.71 6.87E-16 9.78E-15 1.89 4.04E-23 4.54E-22
GO: 0044459—plasma membrane part 1.46 4.69E-14 7.99E-13 1.57 7.11E-21 1.20E-19
GO: 0005886—plasma membrane 1.26 7.70E-10 1.53E-08 1.35 6.24E-17 1.23E-15
Topological domain: cytoplasmic 7 (12.2) 1.49 1.30E-19 3.48E-19 3 (27.9) 1.63 8.09E-31 1.88E-30
Membrane 1.25 1.13E-12 2.28E-11 1.30 6.76E-18 9.95E-17
GO: 0005886—plasma membrane 1.26 7.70E-10 1.53E-08 1.35 6.24E-17 1.23E-15
Transmembrane region 1.25 3.14E-08 9.85E-08 1.34 1.19E-15 3.87E-15
Transmembrane 1.25 2.49E-09 1.01E-07 1.34 5.12E-16 9.68E-15
Cell membrane 1.47 3.92E-11 1.11E-09 1.57 9.79E-16 2.06E-14
Topological domain: extracellular 1.65 3.06E-26 6.85E-26 – – –
GO: 0008544—epidermis development 8 (9.9) 2.85 3.04E-10 8.92E-10 9 (6.6) 2.41 4.80E-06 3.23E-05
GO: 0030216—keratinocyte
differentiation
4.40 3.32E-10 1.14E-09 3.58 5.81E-06 4.47E-05
GO: 0007398—ectoderm development 2.73 6.19E-10 2.42E-09 2.42 1.12E-06 6.49E-06
GO: 0009913—epidermal cell
differentiation
4.17 5.74E-10 2.81E-09 3.41 8.19E-06 6.70E-05
Keratinization 5.84 2.68E-10 8.67E-09 4.90 6.57E-07 3.73E-05
GO: 0030855—epithelial cell
differentiation
3.08 2.26E-09 1.33E-08 2.42 2.05E-04 2.75E-03
GO: 0031424—keratinization 4.80 6.87E-08 6.38E-07 3.96 1.08E-04 1.24E-03
IPR003267: small proline-rich 6.51 5.77E-07 1.57E-06 4.97 8.95E-04 1.38E-03
Behav Genet (2013) 43:168–176 173
123

methylated between these tissues, and most of them
(*79 %) were hypomethylated in DNA from LCLs
(Online Resource, Table S4, S5; Fig. 3).
Functional annotation of differentially methylated
genes
The functional annotation of genes showed significant
enrichment of the lists of DMEGs in some of the GO terms.
Most of the genes differentially methylated in WB and SL
are involved in the regulation of the immune response and
body fluid levels, as well as genes belonging to the plasma
membrane functional group (Table 1). There was a high
concordance in GO terms overrepresented in the lists of
DMEGs in LCLs compared to WB and SL. These genes are
involved predominantly in the immune response, and the
control of cellular activity and signaling systems, specifi-
cally genes coding glycoproteins, cytokines, and their
receptors (Table 2).
The differences in methylation levels observed may be a
result of tissue specific regulation. We performed a func-
tional annotation of DMEGs, using the DAVID tissue
expression annotation tools. For the WB versus SL com-
parison, this assumption was confirmed; namely, the list of
DMEGs was overrepresented by genes known to be
expressed in white blood cells and the salivary gland
(Table 3). In contrast, the spectrum of GO terms for genes
differentially methylated in WB versus LCLs was wider
and included a number of tissues—from the cerebellum to
the uterus, as well as cultivated cells—bone marrow
CD105? endothelial cells and Burkitt’s lymphoma cell
lines (Table 3).
Discussion
We compared DNA methylation profiles between WB, SL
and LCLs from the same individuals using cluster and
linear-regression analyses of the methylation profiles, and
analysis of DMEGs. The results showed that LCLs have
the most distinct methylation patterns compared to those in
WB and SL. These results are not surprising and are con-
sistent with published studies that warn researchers about
the methylation changes in LCLs due to cell culturing
(Brennan et al. 2009; Calıskan et al. 2011; Grafodatskaya
et al. 2010; Sun et al. 2010; Sugawara et al. 2011). In
contrast, WB and SL showed a relatively similar methyl-
ation pattern that is in line with a previous study (Liu et al.
2010). The DNA methylation differences found between
WB and SL might be explained in terms of tissue specific
methylation; thus most of the DMEGs are genes coding
membrane complexes and are involved in immune
Table 2 continued
Term LCLs versus WB LCLs versus SL
Cluster#
(EScore)
Fold
enrichment
Benjamini FDR Cluster#
(EScore)
Fold
enrichment
Benjamini FDR
GO: 0009617—response to bacterium 9 (8.9) 2.67 4.08E-09 2.59E-08 6 (10.2) 2.89 4.59E-11 1.11E--10
Antimicrobial 4.19 2.82E-09 1.20E-07 4.60 5.17E-11 1.52E-09
GO: 0042742—defense response to
bacterium
3.18 3.16E-08 2.48E-07 3.46 5.94E-10 2.00E-09
Antibiotic 4.21 4.99E-09 2.32E-07 4.32 3.15E-09 1.32E-07
GO: 0042330—taxis 10 (8.4) 3.05 1.62E-10 3.96E-10 7 (9.9) 3.13 3.54E-11 6.82E-11
GO: 0006935—chemotaxis 3.05 1.62E-10 3.96E-10 3.13 3.54E-11 6.82E-11
Chemotaxis 4.28 8.28E-10 2.85E-08 4.38 4.10E-10 1.55E-08
IPR000827: small chemokine, C–C
group, conserved site
6.91 1.16E-07 1.05E-07 7.04 4.35E-08 7.92E-08
IPR001811: small chemokine,
interleukin-8-like
5.21 2.12E-07 3.85E-07 5.56 3.17E-08 2.88E-08
SM00199: SCY 5.07 1.07E-07 4.59E-07 5.24 1.54E-08 6.44E-08
GO: 0008009—chemokine activity 4.68 1.48E-07 1.22E-06 4.90 5.57E-08 1.47E-07
GO: 0042379—chemokine receptor
binding
4.39 3.70E-07 5.06E-06 4.60 1.73E-07 6.86E-07
PIRSF001950: small inducible
chemokine, C/CC types
5.37 5.78E-06 1.17E-05 5.60 3.24E-06 6.44E-06
GO: 0007610—behavior 1.64 6.06E-04 1.29E-02 1.81 5.89E-06 4.25E-05
GO: 0007626—locomotory behavior 1.92 2.57E-04 4.65E-03 2.07 1.35E-05 1.24E-04
The top list of DAVID annotation clusters is presented
174 Behav Genet (2013) 43:168–176
123

response, as well as genes known to be expressed specifi-
cally in white blood cells and the salivary gland.
The distinctiveness of methylation patterns in LCLs
might be caused by a complex of factors, including the
mono-cellular nature of LCLs, which are composed only of
B-lymphocytes, and their modifications throughout the
culturing procedure. The compositional differences might
be a result in the differential regulation of genes involved
in the immune response, cellular activity and signaling
systems, as was found in LCLs. At the same time, the EBV
transformation of B-lymphocytes, preceding the cell cul-
turing, caused uncontrolled growth, proliferation and
abnormal cell signaling. DMEGs in LCLs were found to be
predominantly involved in the control of cellular activity
and signaling systems, specifically genes coding signal
peptides, such as cytokines and chemokines. This is con-
sistent with a study reporting that EBV-mediated trans-
formations rely extensively on interference with cytokine
signaling networks (Mosialos 2001). Additionally it was
found that the list of DMEGs in LCLs was enriched in
genes found to be expressed in other cultivated cells—bone
marrow CD105? endothelial cells and Burkitt’s lymphoma
Raji cell line; the latter, Burkitt’s lymphoma, is known to
be associated with EBV infection (Fujita et al. 2004; Ma-
eda et al. 2009). This finding provides further evidence that
cell culturing procedures are responsible for the specificity
of the methylation pattern in LCLs and its distance from
those in WB and SL cells.
Taken together, the results of the study suggest that due
to multiple random and directed changes of methylation
patterns, LCLs are not a reliable source of DNA for epi-
genetic studies, as opposed to peripheral blood and saliva.
As a result, LCLs should be used with particular caution to
identify the epigenetic mechanisms underlying biological
processes and their violations, due to disorders associated
with DNA methylation variants.
Acknowledgments This work was supported by Awards DC007665
as administered by the National Institute of Deafness and Commu-
nication Disorders, P50 HD052120 as administered by the Eunice
Kennedy Shriver National Institute of Child Health and Human
Development, and Grant R25HL088730 (BioSTEP) from NIH-
National Heart, Lung, and Blood Institute. Grantees undertaking such
projects are encouraged to freely express their professional judgment.
Therefore, this article does not necessarily reflect the position or
policies of the National Institutes of Health, and no official
endorsement should be inferred. The authors alone are responsible for
the content and writing of the article.
References
Abdolmaleky HM, Smith CL, Faraone SV, Shafa R, Stone W, Glatt
SJ, Tsuang MT (2004) Methylomics in psychiatry: modulation
of gene–environment interactions may be through DNA meth-
ylation. Am J Med Genet 127B:51–59
Abdolmaleky HM, Zhou JR, Thiagalingam S, Smith CL (2008)
Epigenetic and pharmacoepigenomic studies of major psychoses
and potentials for therapeutics. Pharmacogenomics 9:1809–1823
Brennan EP, Ehrich M, Brazil DP, Crean JK, Murphy M, Sadlier DM
et al (2009) Comparative analysis of DNA methylation profiles
in peripheral blood leukocytes versus lymphoblastoid cell lines.
Epigenetics 4:159–164
Calıskan M, Cusanovich DA, Ober C, Gilad Y (2011) The effects of
EBV transformation on gene expression levels and methylation
profiles. Hum Mol Genet 20:1643–1652
Dennis GJ, Sherman BT, Hosack DA, Yang J, Gao W, Lane HC,
Lempicki RA (2003) DAVID: database for annotation, visual-
ization, and integrated discovery. Genome Biol 4:P3
Feng J, Fan G (2009) The role of DNA methylation in the central
nervous system and neuropsychiatric disorders. Int Rev Neuro-
biol 89:67–84
Table 3 The annotation of genes that have shown differential methylation in whole blood compared to saliva (WB vs. SL) and lymphoblastoid
cell lines (WB vs. LCLs), in terms of their expression in different tissues
Term Gene count Gene (%) p value Fold enrichment Benjamini
WB versus SL
WBCs, plaque macrophage 38 10.00 1.47E-04 1.93 1.68E-02
WBCs, monocyte-depleted mononuclear cells 39 10.26 1.32E-03 1.70 3.21E-02
WBCs, monocyte 48 12.63 2.28E-03 1.55 4.83E-02
Salivary gland 247 65.00 1.85E-02 1.07 8.20E-02
WB versus LCLs
Cerebellum 1110 60.72 5.88E-23 1.15 4.58E-21
Salivary gland 1140 62.36 4.45E-22 1.14 1.74E-20
Burkitt lymphoma (Raji) 1018 55.69 3.21E-09 1.10 3.13E-08
Tonsil 939 51.37 7.55E-05 1.07 3.68E-04
Tongue 386 21.12 5.35E-05 1.18 2.98E-04
Whole blood 479 26.20 5.37E-05 1.15 2.79E-04
BM-CD105? endothelial cells 427 23.36 4.08E-04 1.14 1.77E-03
Uterus 293 16.03 1.74E-03 1.17 6.17E-03
Behav Genet (2013) 43:168–176 175
123

Fujita S, Buziba N, Kumatori A, Senba M, Yamaguchi A, Toriyama
K (2004) Early stage of Epstein-Barr virus lytic infection leading
to the ‘‘starry sky’’ pattern formation in endemic Burkitt
lymphoma. Arch Pathol Lab Med 128:549–552
Grafodatskaya D, Choufani S, Ferreira JC, Butcher DT, Lou Y, Zhao
C et al (2010) EBV transformation and cell culturing destabilizes
DNA methylation in human lymphoblastoid cell lines. Genomics
95:73–83
Hsieh J, Elisch AJ (2010) Epigenetics, hippocampal neurogenesis,
and neuropsychiatric disorders: unraveling the genome to
understand the mind. Neurobiol Dis 39:73–84
Hu VW, Frank BC, Heine S, Lee NH, Quakenbush J (2006) Gene
expression profiling of lymphoblastoid cell lines from monozy-
gotic twins discordant in severity of autism reveals differential
regulation of neurologically relevant genes. BMC Genomics 7:118
Huang DW, Sherman BT, Lempicki RA (2008) Systematic and
integrative analysis of large gene lists using DAVID bioinfor-
matics resources. Nat Protoc 4:44–57
Iwamoto K, Kakiuchi C, Bundo M, Ikeda K, Kato T (2004) Molecular
characterization of bipolar disorder by comparing gene expres-
sion profiles of postmortem brains of major mental disorders.
Mol Psychiatry 9:406–416
Kaminsky ZA, Tang T, Wang SC, Ptak C, Oh GH, Wong AH et al
(2009) DNA methylation profiles in monozygotic and dizygotic
twins. Nat Genet 41:240–245
Laird PW (2003) The power and promise of DNA methylation
markers. Nat Rev Cancer 3:253–266
Liu J, Morgan M, Hutchison K, Calhoun VD (2010) A study of the
influence of sex on genome wide methylation. PLoS ONE
5(4):e10028
Maeda E, Akahane M, Kiryu S (2009) Spectrum of Epstein-Barr
virus-related diseases: a pictorial review. Jpn J Radiol 27:4–19
Mill J, Tang T, Kaminsky Z, Khare T, Yazdanpanah S, Bouchard L
et al (2008) Epigenomic profiling reveals DNA-methylation
changes associated with major psychosis. Am J Hum Genet
82:696–711
Mosialos G (2001) Cytokine signaling and EBV cell transformation.
Cytokine Growth Factor Rev 12:259–270
Neitzel H (1986) A routine method for the establishment of
permanent growing lymphoblastoid cell lines. Hum Genet
73:320–326
Nguyen A, Rauch TA, Pfeifer GP, Hu VW (2010) Global methylation
profiling of lymphoblastoid cell lines reveals epigenetic contri-
butions to autism spectrum disorders and a novel autism
candidate gene, RORA, whose protein product is reduced in
autistic brain. FASEB J 24:3036–3051
Nohesara S, Ghadirivasfi M, Mostafavi S, Eskandari M-R,
Ahmadkhaniha H, Thiagalingam S, Abdolmaleky HM (2011)
DNA hypomethylation of MB-COMT promoter in the DNA
derived from saliva in schizophrenia and bipolar disorder.
J Psychiatr Res 45:1432–1438
Sapienza C, Lee J, Powell J, Erinle O, Yafai F, Reichert J et al (2011)
DNA methylation profiling identifies epigenetic differences
between diabetes patients with ESRD and diabetes patients
without nephropathy. Epigenetics 6:20–28
Sugawara H, Iwamoto K, Bundo M, Ueda J, Ishigooka J, Kato T
(2011) Comprehensive DNA methylation analysis of human
peripheral blood leukocytes and lymphoblastoid cell lines.
Epigenetics 6:508–515
Sun YV, Turner ST, Smith JA, Hammond PI, Lazarus A, Van De
Rostyne JL et al (2010) Comparison of the DNA methylation
profiles of human peripheral blood cells and transformed
B-lymphocytes. Hum Genet 127:651–658
Tierling S, Souren NY, Reither S, Zang KD, Meng-Hentschel J,
Leitner D et al (2011) DNA methylation studies on imprinted
loci in a male monozygotic twin pair discordant for Beckwith-
Wiedemann syndrome. Clin Genet 79:546–553
176 Behav Genet (2013) 43:168–176
123