Embed Size (px)
Citation preview
COMPARISON OF X-RAY COMPUTED TOMOGRAPHY AND OPTICAL COHERENCE TOMOGRAPHY FOR CHARACTERISATION OF GLASS-FIBRE POLYMER MATRIX COMPOSITES J. Kastner1, E. Schlotthauer1, P. Burgholzer2, and D. Stifter2 1University of Applied Sciences Upper Austria, Wels, Austria, 2Upper Austrian Research GmbH, Linz, Austria Abstract: Glass-fibre reinforced polymer matrix composites exhibit superior properties to traditional materials. Thus, they have found a broad variety of applications in modern industry. For process development and quality control of polymer matrix composites sophisticated methods for non-destructive characterisation are needed. Especially for the inspection of complex geometries or critical features located inside the materials, non-destructive testing imaging technologies are of big advantage and often necessary. Optical coherence tomography (OCT) is a novel non-invasive technique, which permits high-resolution cross-sectional imaging. OCT has been originally developed for medical diagnostics, especially for the detection of eye diseases. Just recently the potential of OCT has been discovered also for non-destructive analysis of materials. In this paper we compare OCT with the more traditional method of X-ray micro-3D computed tomography (µ-CT). We outline the advantages and disadvantages of both methods for characterisation of glass fibre epoxy compound material and related composites. OCT does an excellent job of clearly imaging fibre-reinforced composites including detection of voids and heterogeneities (for instance “dry spots”) and fibre structure on micrometer scale. µ-CT is capable of delivering high-resolution 3D images of the reinforcement microstructure of the entire sample and is not limited in depth like OCT. OCT does not work for strongly absorbing materials, whereas CT works for any material. The measurement costs of OCT are much lower than the costs of µ-CT. OCT can be also used for in-line inspection, which is a big advantage for industrial quality control.
Introduction: Polymer fibre composites have an increased stiffness and increased strength to weight ratio compared to metallic and other “traditional” materials. Therefore the applications of these materials become more and more important in modern industry [1,2]. Non-destructive and contact-free techniques (NDT) for the characterisation of fibre composites face an increasing demand in process development and production, especially for the inspection of complex geometries and critical features located inside the materials [2-7]. Optical coherence tomography (OCT) permits in a rather simple and fast way high-resolution cross-sectional imaging of turbid and transparent media on micrometer scale. OCT has been originally developed for medical diagnostics. Just recently the potential of OCT has been discovered also for non-destructive analysis of materials, in particular for the characterisation of fibre composites and polymer laminate structures [3,5]. Computed tomography (CT) is a radiographic NDT-method to locate and size volumetric details in three dimensions. A CT-scanner generates a series of X-ray attenuation measurements, which are used to produce computed reconstructed images of an object. In the last years µ-CT systems with a matrix detector and a micro-focus tube become more and more popular. The main advantages of these systems are the reasonable high scanning speed and the high resolution. There are several reports in literature about the application of CT for the characterisation of fibre composites [2,5-9]. Especially in automotive and aerospace industry µ-CT is widely used for non-destructive testing of fibre composites [2,5]. In this paper we outline the advantages and disadvantages of optical coherence tomography and µ-computed tomography for characterisation of glass fibre compound materials and related composites. Experimental: The materials investigated are a liquid moulded glass fibre reinforced epoxy composite (GF-Epoxy) with a fibre diameter of 25-30 µm, a glass fibre epoxy tissue (GF-Tissue) with a fibre diameter of 9-12 µm, and a carbon fibre reinforced polyetheretherketone (CF-PEEK) with a fibre diameter of 5-6 µm. The main data of these materials are summarized in the following table.
Material Matrix Matrix-density (g/cm3)
Fibre Fibre-diameter (µm)
Fibre-density (g/cm3)
GF-Epoxy epoxy 1.25 glass 25-30 ~2.6
GF-Tissue epoxy 1.25 glass 9-12 ~2.6
CF-PEEK polyetheretherketone 1.31 carbon 5-6 ~1.8 Table 1: Overview of the materials investigated.
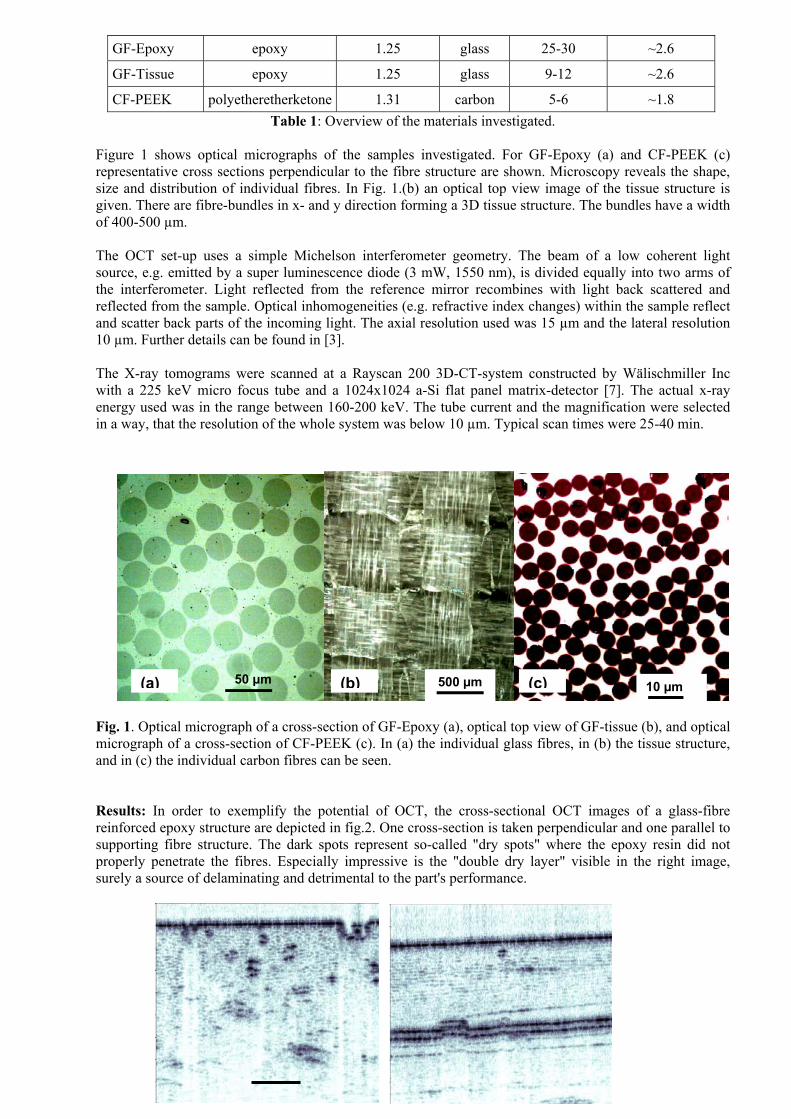
Figure 1 shows optical micrographs of the samples investigated. For GF-Epoxy (a) and CF-PEEK (c) representative cross sections perpendicular to the fibre structure are shown. Microscopy reveals the shape, size and distribution of individual fibres. In Fig. 1.(b) an optical top view image of the tissue structure is given. There are fibre-bundles in x- and y direction forming a 3D tissue structure. The bundles have a width of 400-500 µm. The OCT set-up uses a simple Michelson interferometer geometry. The beam of a low coherent light source, e.g. emitted by a super luminescence diode (3 mW, 1550 nm), is divided equally into two arms of the interferometer. Light reflected from the reference mirror recombines with light back scattered and reflected from the sample. Optical inhomogeneities (e.g. refractive index changes) within the sample reflect and scatter back parts of the incoming light. The axial resolution used was 15 µm and the lateral resolution 10 µm. Further details can be found in [3]. The X-ray tomograms were scanned at a Rayscan 200 3D-CT-system constructed by Wälischmiller Inc with a 225 keV micro focus tube and a 1024x1024 a-Si flat panel matrix-detector [7]. The actual x-ray energy used was in the range between 160-200 keV. The tube current and the magnification were selected in a way, that the resolution of the whole system was below 10 µm. Typical scan times were 25-40 min.
50 µm 500 µm 10 µm (a) (b) (c)
Fig. 1. Optical micrograph of a cross-section of GF-Epoxy (a), optical top view of GF-tissue (b), and optical micrograph of a cross-section of CF-PEEK (c). In (a) the individual glass fibres, in (b) the tissue structure, and in (c) the individual carbon fibres can be seen. Results: In order to exemplify the potential of OCT, the cross-sectional OCT images of a glass-fibre reinforced epoxy structure are depicted in fig.2. One cross-section is taken perpendicular and one parallel to supporting fibre structure. The dark spots represent so-called "dry spots" where the epoxy resin did not properly penetrate the fibres. Especially impressive is the "double dry layer" visible in the right image, surely a source of delaminating and detrimental to the part's performance.
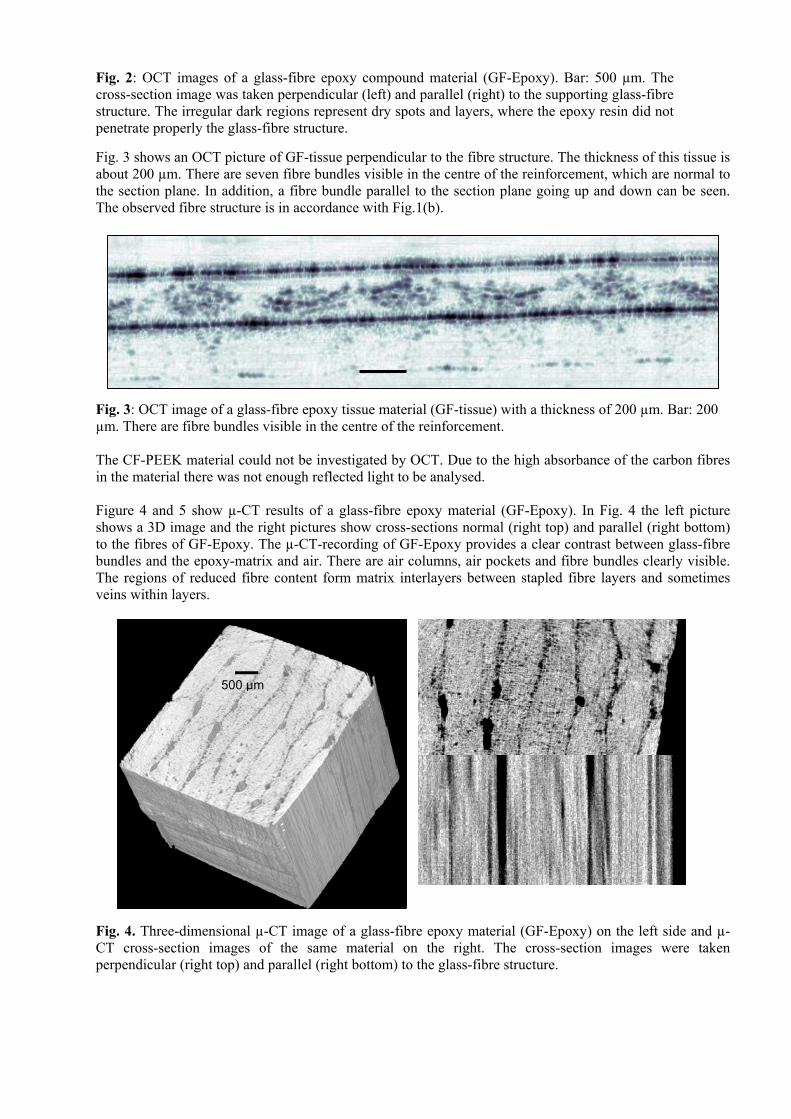
Fig. 2: OCT images of a glass-fibre epoxy compound material (GF-Epoxy). Bar: 500 µm. The cross-section image was taken perpendicular (left) and parallel (right) to the supporting glass-fibre structure. The irregular dark regions represent dry spots and layers, where the epoxy resin did not penetrate properly the glass-fibre structure. Fig. 3 shows an OCT picture of GF-tissue perpendicular to the fibre structure. The thickness of this tissue is about 200 µm. There are seven fibre bundles visible in the centre of the reinforcement, which are normal to the section plane. In addition, a fibre bundle parallel to the section plane going up and down can be seen. The observed fibre structure is in accordance with Fig.1(b).
Fig. 3: OCT image of a glass-fibre epoxy tissue material (GF-tissue) with a thickness of 200 µm. Bar: 200 µm. There are fibre bundles visible in the centre of the reinforcement. The CF-PEEK material could not be investigated by OCT. Due to the high absorbance of the carbon fibres in the material there was not enough reflected light to be analysed. Figure 4 and 5 show µ-CT results of a glass-fibre epoxy material (GF-Epoxy). In Fig. 4 the left picture shows a 3D image and the right pictures show cross-sections normal (right top) and parallel (right bottom) to the fibres of GF-Epoxy. The µ-CT-recording of GF-Epoxy provides a clear contrast between glass-fibre bundles and the epoxy-matrix and air. There are air columns, air pockets and fibre bundles clearly visible. The regions of reduced fibre content form matrix interlayers between stapled fibre layers and sometimes veins within layers.
500 µm
Fig. 4. Three-dimensional µ-CT image of a glass-fibre epoxy material (GF-Epoxy) on the left side and µ-CT cross-section images of the same material on the right. The cross-section images were taken perpendicular (right top) and parallel (right bottom) to the glass-fibre structure.
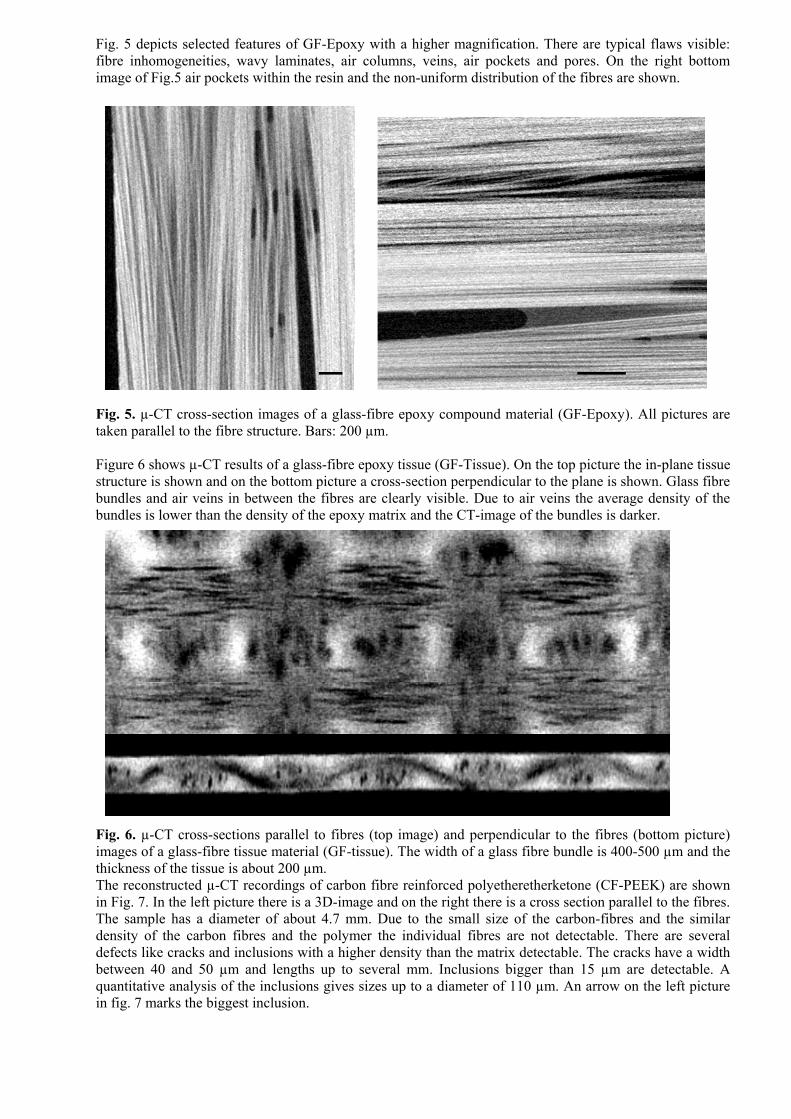
Fig. 5 depicts selected features of GF-Epoxy with a higher magnification. There are typical flaws visible: fibre inhomogeneities, wavy laminates, air columns, veins, air pockets and pores. On the right bottom image of Fig.5 air pockets within the resin and the non-uniform distribution of the fibres are shown. Fig. 5. µ-CT cross-section images of a glass-fibre epoxy compound material (GF-Epoxy). All pictures are taken parallel to the fibre structure. Bars: 200 µm. Figure 6 shows µ-CT results of a glass-fibre epoxy tissue (GF-Tissue). On the top picture the in-plane tissue structure is shown and on the bottom picture a cross-section perpendicular to the plane is shown. Glass fibre bundles and air veins in between the fibres are clearly visible. Due to air veins the average density of the bundles is lower than the density of the epoxy matrix and the CT-image of the bundles is darker. Fig. 6. µ-CT cross-sections parallel to fibres (top image) and perpendicular to the fibres (bottom picture) images of a glass-fibre tissue material (GF-tissue). The width of a glass fibre bundle is 400-500 µm and the thickness of the tissue is about 200 µm.
The reconstructed µ-CT recordings of carbon fibre reinforced polyetheretherketone (CF-PEEK) are shown in Fig. 7. In the left picture there is a 3D-image and on the right there is a cross section parallel to the fibres. The sample has a diameter of about 4.7 mm. Due to the small size of the carbon-fibres and the similar density of the carbon fibres and the polymer the individual fibres are not detectable. There are several defects like cracks and inclusions with a higher density than the matrix detectable. The cracks have a width between 40 and 50 µm and lengths up to several mm. Inclusions bigger than 15 µm are detectable. A quantitative analysis of the inclusions gives sizes up to a diameter of 110 µm. An arrow on the left picture in fig. 7 marks the biggest inclusion.
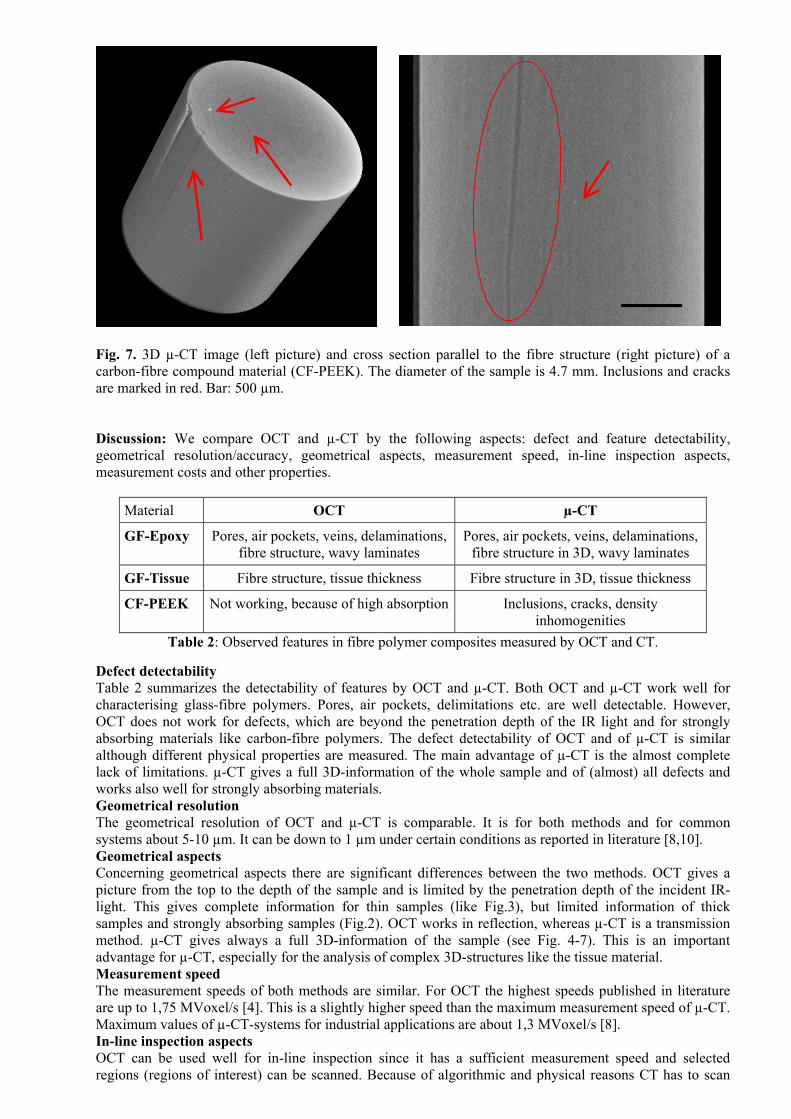
Fig. 7. 3D µ-CT image (left picture) and cross section parallel to the fibre structure (right picture) of a carbon-fibre compound material (CF-PEEK). The diameter of the sample is 4.7 mm. Inclusions and cracks are marked in red. Bar: 500 µm. Discussion: We compare OCT and µ-CT by the following aspects: defect and feature detectability, geometrical resolution/accuracy, geometrical aspects, measurement speed, in-line inspection aspects, measurement costs and other properties.
Material OCT µ-CT
GF-Epoxy Pores, air pockets, veins, delaminations, fibre structure, wavy laminates
Pores, air pockets, veins, delaminations, fibre structure in 3D, wavy laminates
GF-Tissue Fibre structure, tissue thickness Fibre structure in 3D, tissue thickness
CF-PEEK Not working, because of high absorption Inclusions, cracks, density inhomogenities
Table 2: Observed features in fibre polymer composites measured by OCT and CT. Defect detectability Table 2 summarizes the detectability of features by OCT and µ-CT. Both OCT and µ-CT work well for characterising glass-fibre polymers. Pores, air pockets, delimitations etc. are well detectable. However, OCT does not work for defects, which are beyond the penetration depth of the IR light and for strongly absorbing materials like carbon-fibre polymers. The defect detectability of OCT and of µ-CT is similar although different physical properties are measured. The main advantage of µ-CT is the almost complete lack of limitations. µ-CT gives a full 3D-information of the whole sample and of (almost) all defects and works also well for strongly absorbing materials. Geometrical resolution The geometrical resolution of OCT and µ-CT is comparable. It is for both methods and for common systems about 5-10 µm. It can be down to 1 µm under certain conditions as reported in literature [8,10]. Geometrical aspects Concerning geometrical aspects there are significant differences between the two methods. OCT gives a picture from the top to the depth of the sample and is limited by the penetration depth of the incident IR-light. This gives complete information for thin samples (like Fig.3), but limited information of thick samples and strongly absorbing samples (Fig.2). OCT works in reflection, whereas µ-CT is a transmission method. µ-CT gives always a full 3D-information of the sample (see Fig. 4-7). This is an important advantage for µ-CT, especially for the analysis of complex 3D-structures like the tissue material. Measurement speed The measurement speeds of both methods are similar. For OCT the highest speeds published in literature are up to 1,75 MVoxel/s [4]. This is a slightly higher speed than the maximum measurement speed of µ-CT. Maximum values of µ-CT-systems for industrial applications are about 1,3 MVoxel/s [8]. In-line inspection aspects OCT can be used well for in-line inspection since it has a sufficient measurement speed and selected regions (regions of interest) can be scanned. Because of algorithmic and physical reasons CT has to scan
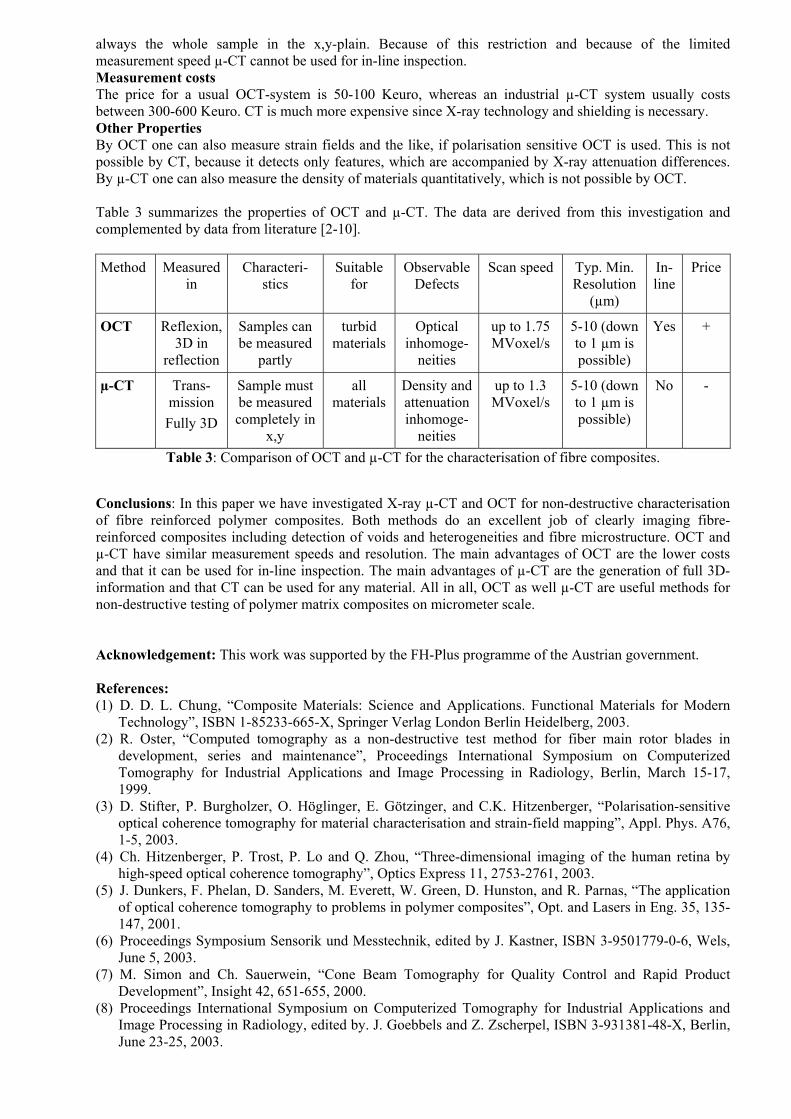
always the whole sample in the x,y-plain. Because of this restriction and because of the limited measurement speed µ-CT cannot be used for in-line inspection. Measurement costs The price for a usual OCT-system is 50-100 Keuro, whereas an industrial µ-CT system usually costs between 300-600 Keuro. CT is much more expensive since X-ray technology and shielding is necessary. Other Properties By OCT one can also measure strain fields and the like, if polarisation sensitive OCT is used. This is not possible by CT, because it detects only features, which are accompanied by X-ray attenuation differences. By µ-CT one can also measure the density of materials quantitatively, which is not possible by OCT. Table 3 summarizes the properties of OCT and µ-CT. The data are derived from this investigation and complemented by data from literature [2-10]. Method Measured
in Characteri-
stics Suitable
for Observable
Defects Scan speed Typ. Min.
Resolution (µm)
In-line
Price
OCT Reflexion, 3D in
reflection
Samples can be measured
partly
turbid materials
Optical inhomoge-
neities
up to 1.75 MVoxel/s
5-10 (down to 1 µm is possible)
Yes +
µ-CT Trans-mission Fully 3D
Sample must be measured completely in
x,y
all materials
Density and attenuation inhomoge-
neities
up to 1.3 MVoxel/s
5-10 (down to 1 µm is possible)
No -
Table 3: Comparison of OCT and µ-CT for the characterisation of fibre composites.
Conclusions: In this paper we have investigated X-ray µ-CT and OCT for non-destructive characterisation of fibre reinforced polymer composites. Both methods do an excellent job of clearly imaging fibre-reinforced composites including detection of voids and heterogeneities and fibre microstructure. OCT and µ-CT have similar measurement speeds and resolution. The main advantages of OCT are the lower costs and that it can be used for in-line inspection. The main advantages of µ-CT are the generation of full 3D-information and that CT can be used for any material. All in all, OCT as well µ-CT are useful methods for non-destructive testing of polymer matrix composites on micrometer scale. Acknowledgement: This work was supported by the FH-Plus programme of the Austrian government. References: (1) D. D. L. Chung, “Composite Materials: Science and Applications. Functional Materials for Modern
Technology”, ISBN 1-85233-665-X, Springer Verlag London Berlin Heidelberg, 2003. (2) R. Oster, “Computed tomography as a non-destructive test method for fiber main rotor blades in
development, series and maintenance”, Proceedings International Symposium on Computerized Tomography for Industrial Applications and Image Processing in Radiology, Berlin, March 15-17, 1999.
(3) D. Stifter, P. Burgholzer, O. Höglinger, E. Götzinger, and C.K. Hitzenberger, “Polarisation-sensitive optical coherence tomography for material characterisation and strain-field mapping”, Appl. Phys. A76, 1-5, 2003.
(4) Ch. Hitzenberger, P. Trost, P. Lo and Q. Zhou, “Three-dimensional imaging of the human retina by high-speed optical coherence tomography”, Optics Express 11, 2753-2761, 2003.
(5) J. Dunkers, F. Phelan, D. Sanders, M. Everett, W. Green, D. Hunston, and R. Parnas, “The application of optical coherence tomography to problems in polymer composites”, Opt. and Lasers in Eng. 35, 135-147, 2001.
(6) Proceedings Symposium Sensorik und Messtechnik, edited by J. Kastner, ISBN 3-9501779-0-6, Wels, June 5, 2003.
(7) M. Simon and Ch. Sauerwein, “Cone Beam Tomography for Quality Control and Rapid Product Development”, Insight 42, 651-655, 2000.
(8) Proceedings International Symposium on Computerized Tomography for Industrial Applications and Image Processing in Radiology, edited by. J. Goebbels and Z. Zscherpel, ISBN 3-931381-48-X, Berlin, June 23-25, 2003.
(9) W. Green, N. Rupert, and C. Pergantis, “Comparing Thermography and X-ray Computed Tomography analysis of composite helmets”, Proc. 11th International Symposium non-destructive characterisation of materials, Berlin, June 24-28, 591-599, 2002.
(10) W. Drexler, U. Morgner, F.X. Kärtner, C. Pitris, S. Boppart, X. D. Li, E. P. Ippen, and J. G. Fujimoto, „In vivo ultrahigh resolution optical coherence tomography”, Opt. Lett. 24, 1221-1223, 1999.