Embed Size (px)
Citation preview
Compatible Measuring Systems for Data Acquisition of Vehicle Dynamics
Dr. Bertold Huber, GeneSys Elektronik GmbH, Offenburg Dr. Reinhard Drews, Steinbeis-Transfer-Zentrum Schwarzwald, Schallstadt
Abstract
To evaluate the handling properties of motor vehicles - in addition to subjective evaluation by experienced development engineers - objective test methods are increasingly being used. This enables even smaller development progress steps to be demonstrated as the level of complexity of modern technologies continues to increase. In 2007, Corrsys-Datron, Dewetron, GeneSys, Kistler and TÜV SÜD Automotive joined forces in the Driveability Testing Alliance (DTA), which defines itself as an interest group without any firm organizational ties between the partners. The DTA initiated a joint project of preparing a vehicle with all the sensor technology from the product range of the partner firms in order to generate a data pool of time and frequency behaviors relevant to the evaluation of vehicle dynamics characteristics. The primary aim of this project was to assist customers in the future definition of vehicle dynamics measurement tasks and to facilitate the selection of the measurands that are characteristic for this purpose. This report presents the current state of the art with respect to the various sensors or sensor systems developed and operated by the DTA partners. Another focal area is the current state which has been achieved with regard to absolutely synchronous data filing of the measured signals (analog, digital, CAN, GPS, video) and with regard to a standardized analysis of the objective measurements recorded. Standardized tests are described by means of three select examples. Following the description of the tests performed, the required measuring equipment and the measurands derived thereof are defined. The time-related functional curves are presented in measurement diagrams, and the results interpreted in terms of vehicle dynamics properties. 1 Objective, Metrological Handling Evaluation of Motor Vehicles Even today, it is still common practice to rely on the subjective evaluation by experienced test engineers when it comes to assessing the handling properties of motor vehicles. However, it is notable that over the past 20 years objective investigation methods using measurable characteristics have been gaining consistently increasing importance. This can be attributed to the fact that objective assessments are better able to demonstrate even small steps in development progress than any subjective evaluation could. Examples of this include proof of the effectiveness of tire modifications or the modification of kinematics/elastokinematics of wheel location systems. Therefore, the development engineer today needs highly conclusive and repeatable evaluation criteria.

Compatible Measuring Systems for Data Acquisition of Vehicle Dynamic
With regard to the interaction between the operator, the vehicle and the environment, the objective to be pursued is a design of the vehicle that provides optimum support for the driver’s skills. The driver’s key evaluation criteria are the perception of safety and the meeting of expectations such as low yaw rate development and high steering precision. To achieve this, it is necessary to actually make handling properties describable and to support these descriptions with measurements. The objective vehicle tests, which are exactly described in ISO and DIN standards, are performed in closed or open loops. Open-loop tests are preferred because they are not affected by the driver’s influence. The driver’s activity is reduced to the scope of keeping operating elements like the steering wheel or brake pedal as consistent as possible. To determine transversal dynamics properties, different steering angle inputs are made (e.g. step steering input, single sine, sustained sine or lane change maneuvers). The influence of accelerations or decelerations as well as the effect of external environmental influences such as cross-winds are typically investigated only in straight-line (steering angle equals zero) or steady-state circular tests (constant steering angle, not equaling zero). To evaluate handling properties in open-loop tests, the physically relevant parameters are analyzed as functions over time. The variable parameters such as steering angle, accelerator or brake pedal travel are allocated to the motion parameters of the vehicle. Either the time functions directly obtained or the characteristic values or characteristic functions derived thereof using firmly agreed algorithms [1] provide the basis for the evaluation.
Figure 1: characteristic motion parameters to evaluate handling [1]
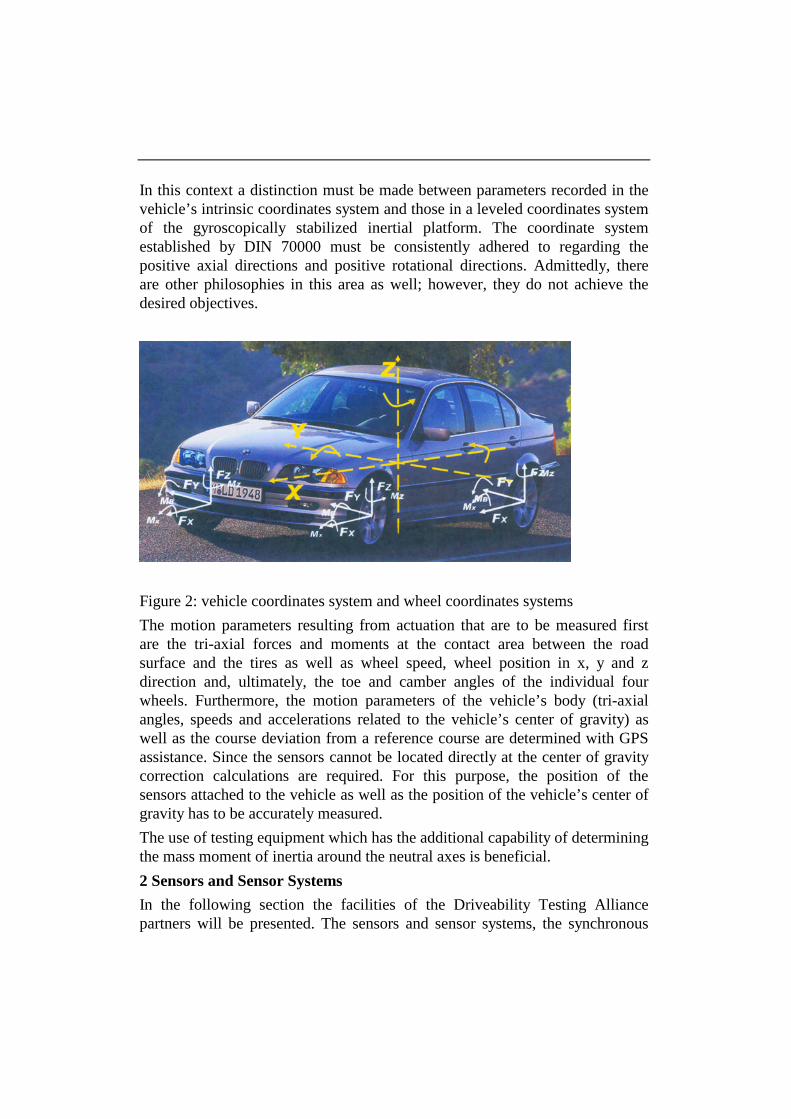
In this context a distinction must be made between parameters recorded in the vehicle’s intrinsic coordinates system and those in a leveled coordinates system of the gyroscopically stabilized inertial platform. The coordinate system established by DIN 70000 must be consistently adhered to regarding the positive axial directions and positive rotational directions. Admittedly, there are other philosophies in this area as well; however, they do not achieve the desired objectives.
Figure 2: vehicle coordinates system and wheel coordinates systems The motion parameters resulting from actuation that are to be measured first are the tri-axial forces and moments at the contact area between the road surface and the tires as well as wheel speed, wheel position in x, y and z direction and, ultimately, the toe and camber angles of the individual four wheels. Furthermore, the motion parameters of the vehicle’s body (tri-axial angles, speeds and accelerations related to the vehicle’s center of gravity) as well as the course deviation from a reference course are determined with GPS assistance. Since the sensors cannot be located directly at the center of gravity correction calculations are required. For this purpose, the position of the sensors attached to the vehicle as well as the position of the vehicle’s center of gravity has to be accurately measured. The use of testing equipment which has the additional capability of determining the mass moment of inertia around the neutral axes is beneficial. 2 Sensors and Sensor Systems In the following section the facilities of the Driveability Testing Alliance partners will be presented. The sensors and sensor systems, the synchronous
Compatible Measuring Systems for Data Acquisition of Vehicle Dynamic
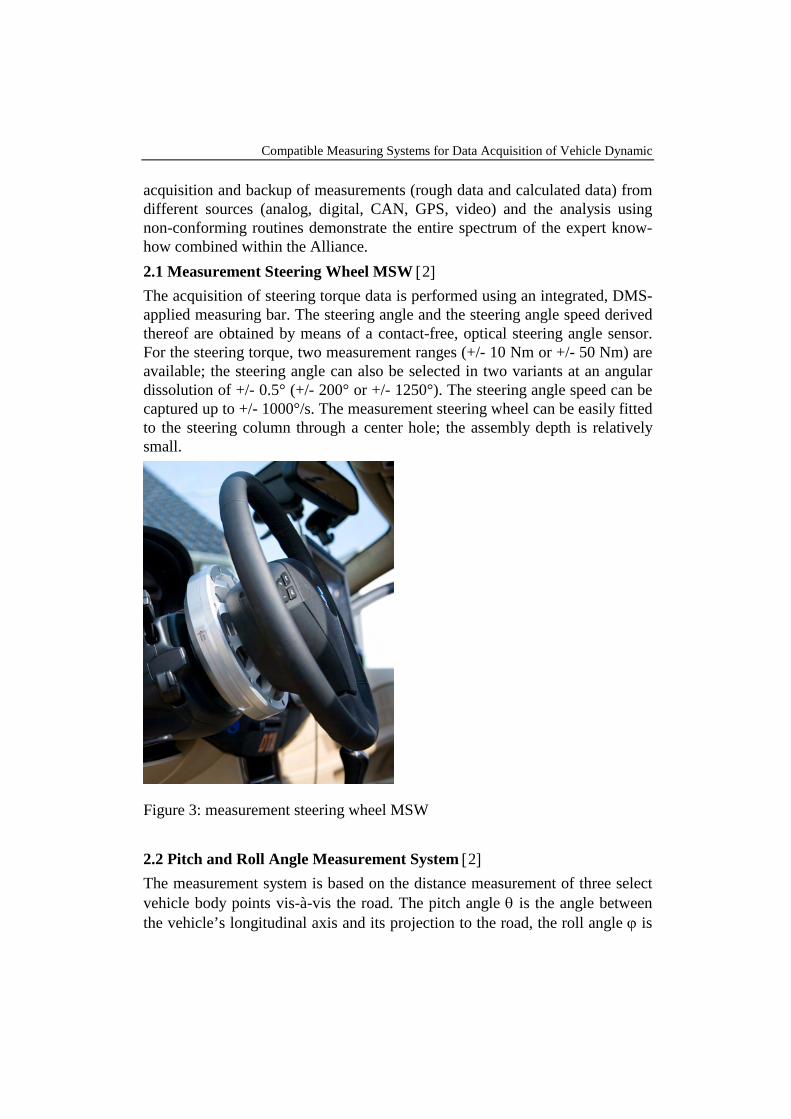
acquisition and backup of measurements (rough data and calculated data) from different sources (analog, digital, CAN, GPS, video) and the analysis using non-conforming routines demonstrate the entire spectrum of the expert know-how combined within the Alliance. 2.1 Measurement Steering Wheel MSW [2] The acquisition of steering torque data is performed using an integrated, DMS-applied measuring bar. The steering angle and the steering angle speed derived thereof are obtained by means of a contact-free, optical steering angle sensor. For the steering torque, two measurement ranges (+/- 10 Nm or +/- 50 Nm) are available; the steering angle can also be selected in two variants at an angular dissolution of +/- 0.5° (+/- 200° or +/- 1250°). The steering angle speed can be captured up to +/- 1000°/s. The measurement steering wheel can be easily fitted to the steering column through a center hole; the assembly depth is relatively small.
Figure 3: measurement steering wheel MSW 2.2 Pitch and Roll Angle Measurement System [2] The measurement system is based on the distance measurement of three select vehicle body points vis-à-vis the road. The pitch angle θ is the angle between the vehicle’s longitudinal axis and its projection to the road, the roll angle ϕ is
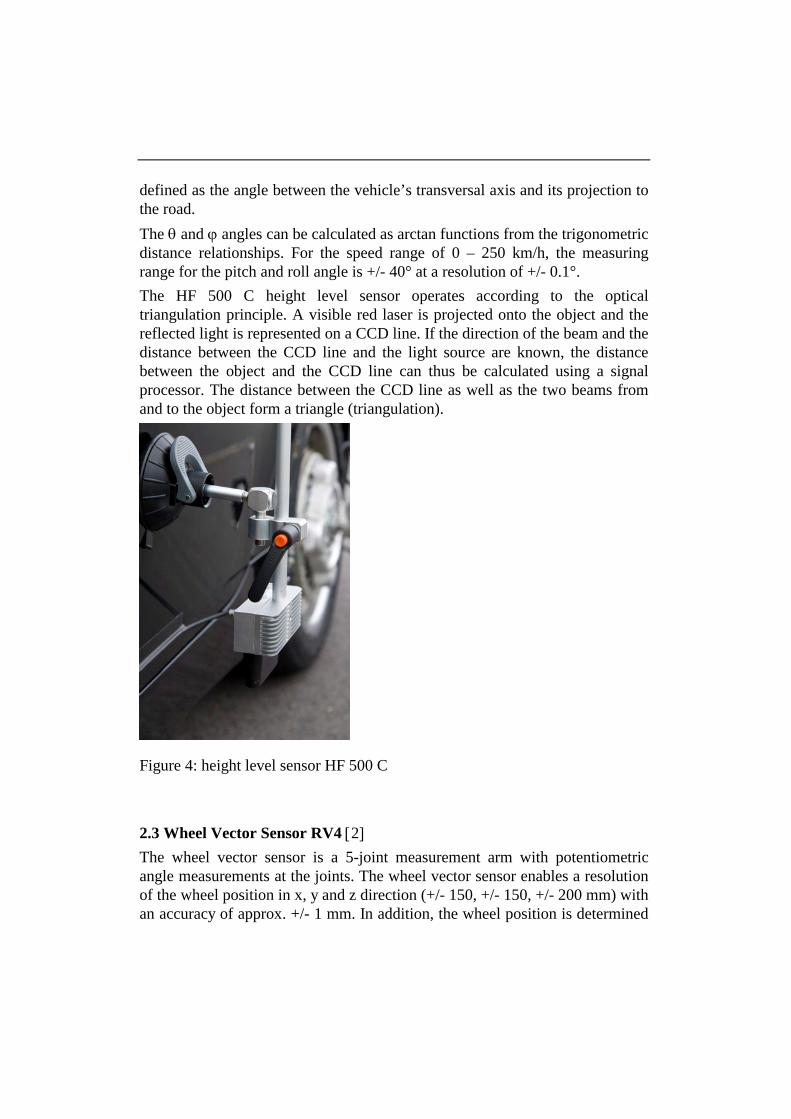
defined as the angle between the vehicle’s transversal axis and its projection to the road. The θ and ϕ angles can be calculated as arctan functions from the trigonometric distance relationships. For the speed range of 0 – 250 km/h, the measuring range for the pitch and roll angle is +/- 40° at a resolution of +/- 0.1°. The HF 500 C height level sensor operates according to the optical triangulation principle. A visible red laser is projected onto the object and the reflected light is represented on a CCD line. If the direction of the beam and the distance between the CCD line and the light source are known, the distance between the object and the CCD line can thus be calculated using a signal processor. The distance between the CCD line as well as the two beams from and to the object form a triangle (triangulation).
Figure 4: height level sensor HF 500 C
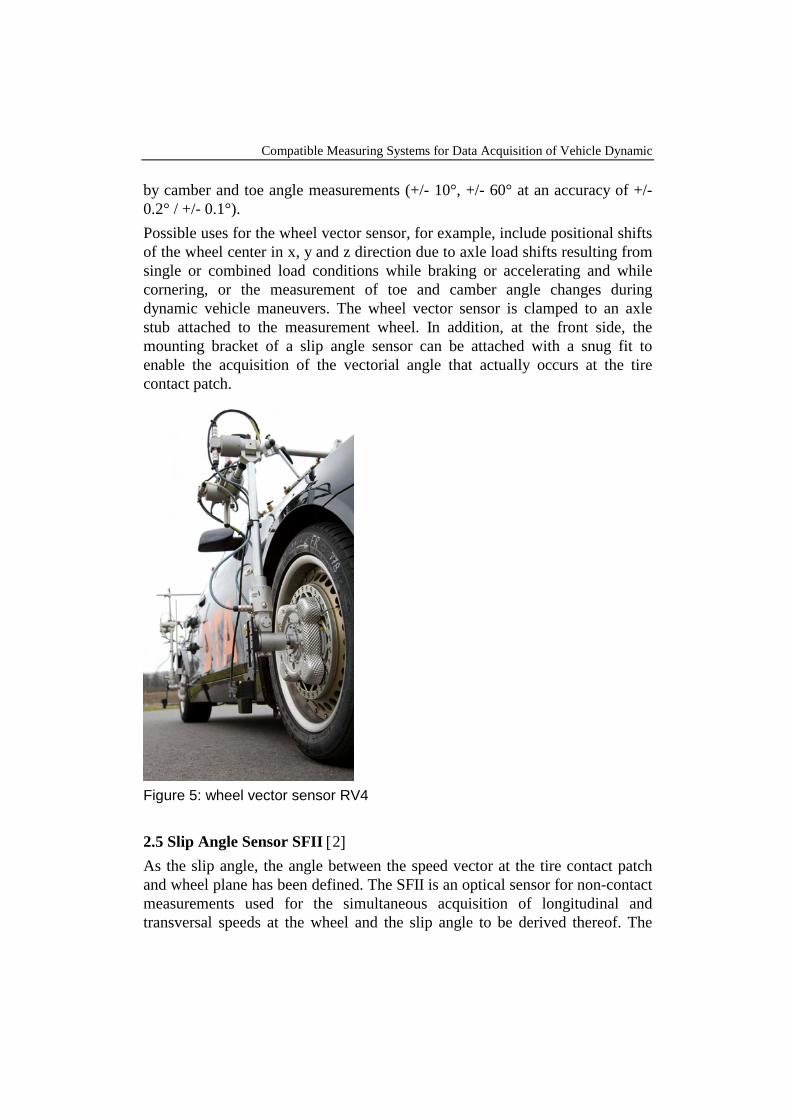
2.3 Wheel Vector Sensor RV4 [2] The wheel vector sensor is a 5-joint measurement arm with potentiometric angle measurements at the joints. The wheel vector sensor enables a resolution of the wheel position in x, y and z direction (+/- 150, +/- 150, +/- 200 mm) with an accuracy of approx. +/- 1 mm. In addition, the wheel position is determined
Compatible Measuring Systems for Data Acquisition of Vehicle Dynamic
by camber and toe angle measurements (+/- 10°, +/- 60° at an accuracy of +/- 0.2° / +/- 0.1°). Possible uses for the wheel vector sensor, for example, include positional shifts of the wheel center in x, y and z direction due to axle load shifts resulting from single or combined load conditions while braking or accelerating and while cornering, or the measurement of toe and camber angle changes during dynamic vehicle maneuvers. The wheel vector sensor is clamped to an axle stub attached to the measurement wheel. In addition, at the front side, the mounting bracket of a slip angle sensor can be attached with a snug fit to enable the acquisition of the vectorial angle that actually occurs at the tire contact patch.
Figure 5: wheel vector sensor RV4 2.5 Slip Angle Sensor SFII [2] As the slip angle, the angle between the speed vector at the tire contact patch and wheel plane has been defined. The SFII is an optical sensor for non-contact measurements used for the simultaneous acquisition of longitudinal and transversal speeds at the wheel and the slip angle to be derived thereof. The
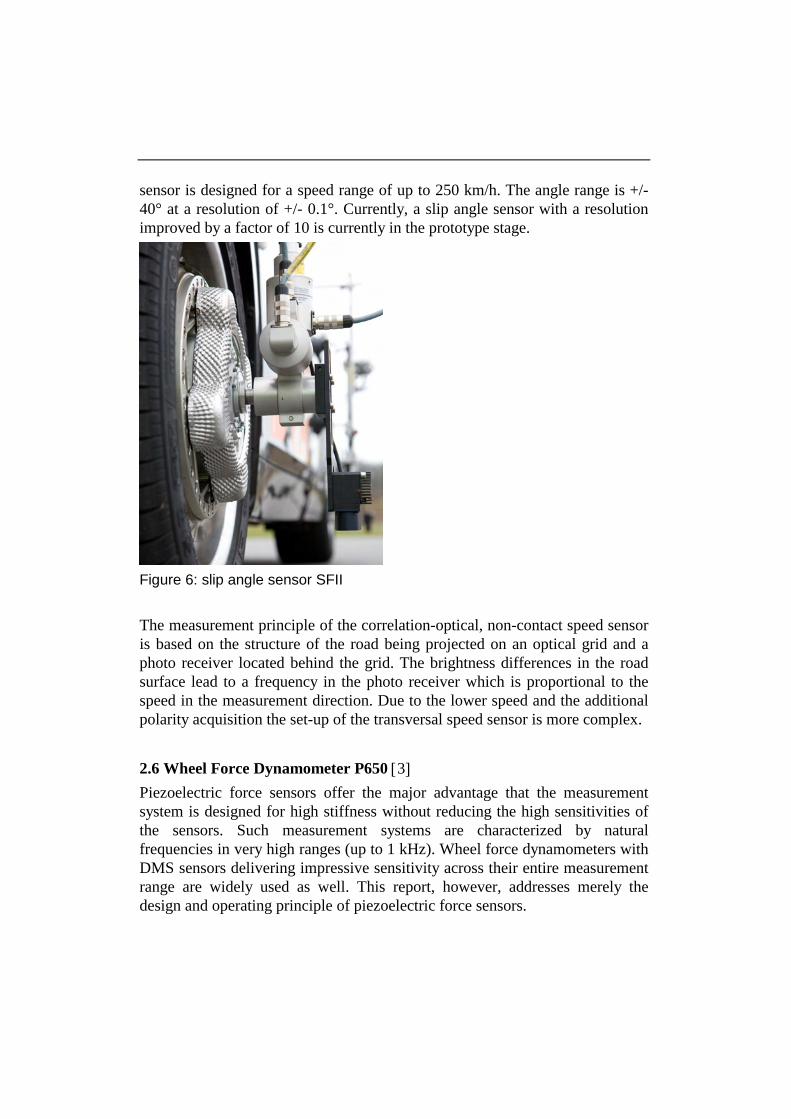
sensor is designed for a speed range of up to 250 km/h. The angle range is +/- 40° at a resolution of +/- 0.1°. Currently, a slip angle sensor with a resolution improved by a factor of 10 is currently in the prototype stage.
Figure 6: slip angle sensor SFII The measurement principle of the correlation-optical, non-contact speed sensor is based on the structure of the road being projected on an optical grid and a photo receiver located behind the grid. The brightness differences in the road surface lead to a frequency in the photo receiver which is proportional to the speed in the measurement direction. Due to the lower speed and the additional polarity acquisition the set-up of the transversal speed sensor is more complex. 2.6 Wheel Force Dynamometer P650 [3] Piezoelectric force sensors offer the major advantage that the measurement system is designed for high stiffness without reducing the high sensitivities of the sensors. Such measurement systems are characterized by natural frequencies in very high ranges (up to 1 kHz). Wheel force dynamometers with DMS sensors delivering impressive sensitivity across their entire measurement range are widely used as well. This report, however, addresses merely the design and operating principle of piezoelectric force sensors.
Compatible Measuring Systems for Data Acquisition of Vehicle Dynamic
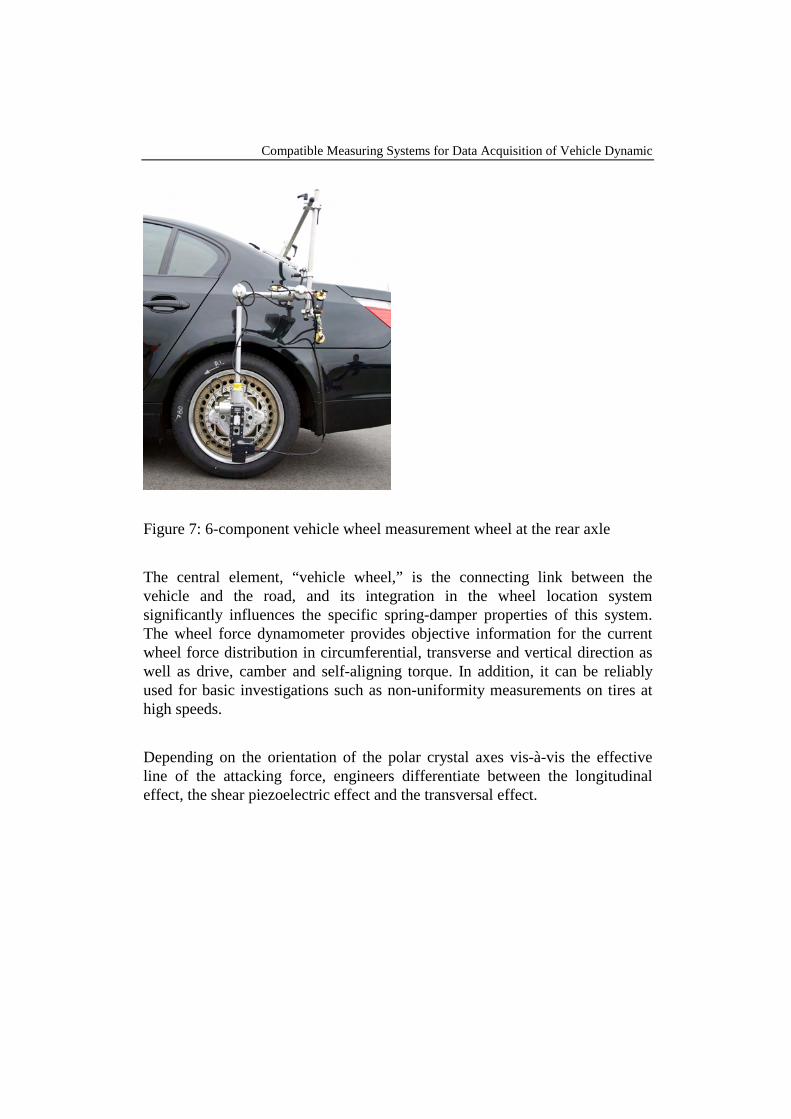
Figure 7: 6-component vehicle wheel measurement wheel at the rear axle The central element, “vehicle wheel,” is the connecting link between the vehicle and the road, and its integration in the wheel location system significantly influences the specific spring-damper properties of this system. The wheel force dynamometer provides objective information for the current wheel force distribution in circumferential, transverse and vertical direction as well as drive, camber and self-aligning torque. In addition, it can be reliably used for basic investigations such as non-uniformity measurements on tires at high speeds. Depending on the orientation of the polar crystal axes vis-à-vis the effective line of the attacking force, engineers differentiate between the longitudinal effect, the shear piezoelectric effect and the transversal effect.
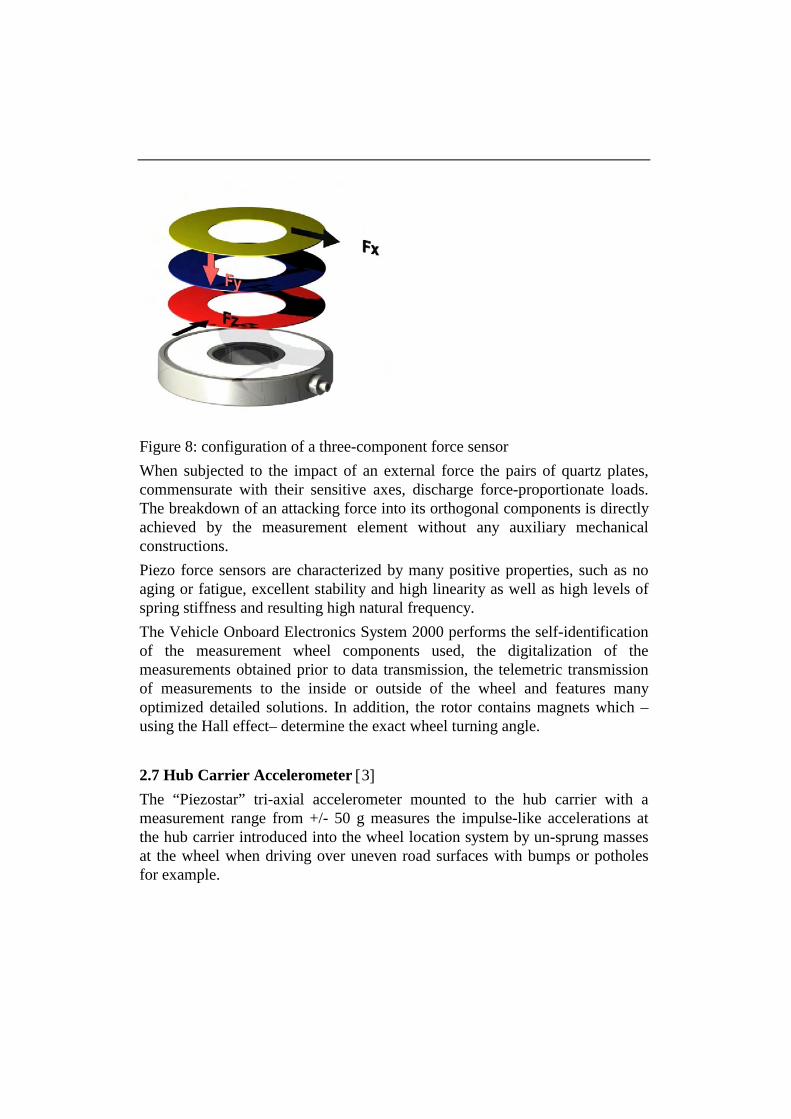
Figure 8: configuration of a three-component force sensor When subjected to the impact of an external force the pairs of quartz plates, commensurate with their sensitive axes, discharge force-proportionate loads. The breakdown of an attacking force into its orthogonal components is directly achieved by the measurement element without any auxiliary mechanical constructions. Piezo force sensors are characterized by many positive properties, such as no aging or fatigue, excellent stability and high linearity as well as high levels of spring stiffness and resulting high natural frequency. The Vehicle Onboard Electronics System 2000 performs the self-identification of the measurement wheel components used, the digitalization of the measurements obtained prior to data transmission, the telemetric transmission of measurements to the inside or outside of the wheel and features many optimized detailed solutions. In addition, the rotor contains magnets which – using the Hall effect– determine the exact wheel turning angle. 2.7 Hub Carrier Accelerometer [3] The “Piezostar” tri-axial accelerometer mounted to the hub carrier with a measurement range from +/- 50 g measures the impulse-like accelerations at the hub carrier introduced into the wheel location system by un-sprung masses at the wheel when driving over uneven road surfaces with bumps or potholes for example.
Compatible Measuring Systems for Data Acquisition of Vehicle Dynamic
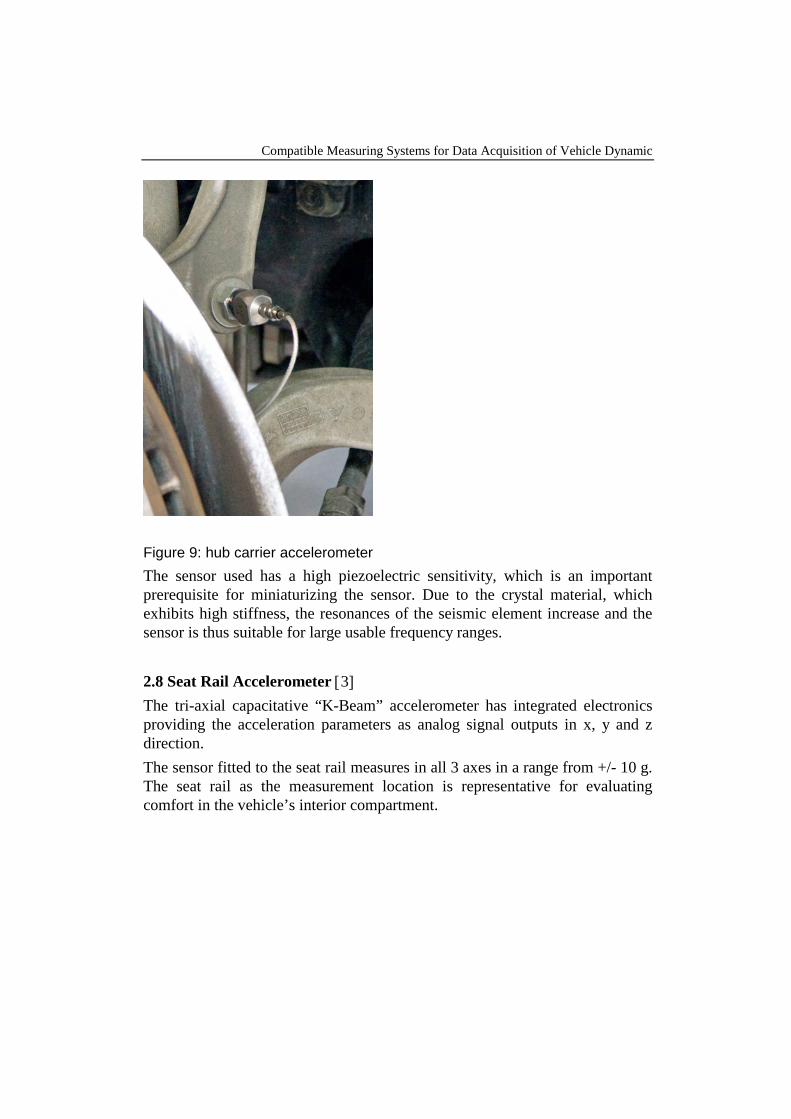
Figure 9: hub carrier accelerometer The sensor used has a high piezoelectric sensitivity, which is an important prerequisite for miniaturizing the sensor. Due to the crystal material, which exhibits high stiffness, the resonances of the seismic element increase and the sensor is thus suitable for large usable frequency ranges. 2.8 Seat Rail Accelerometer [3] The tri-axial capacitative “K-Beam” accelerometer has integrated electronics providing the acceleration parameters as analog signal outputs in x, y and z direction. The sensor fitted to the seat rail measures in all 3 axes in a range from +/- 10 g. The seat rail as the measurement location is representative for evaluating comfort in the vehicle’s interior compartment.
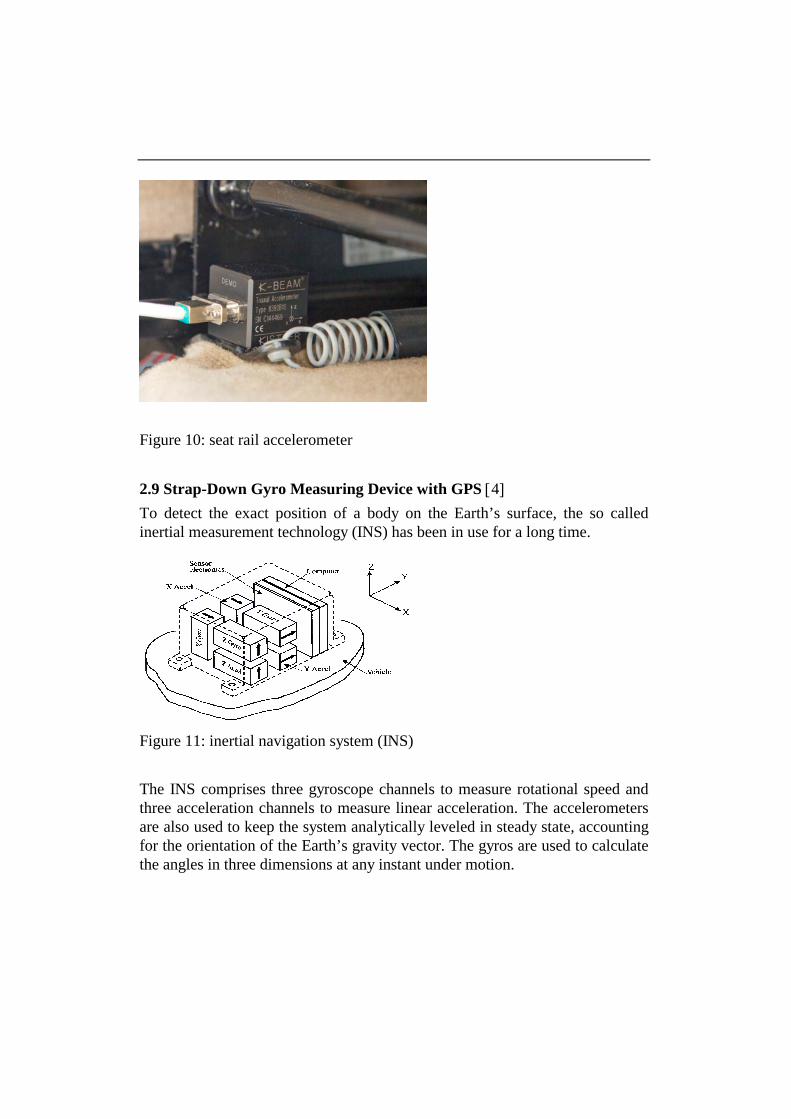
Figure 10: seat rail accelerometer 2.9 Strap-Down Gyro Measuring Device with GPS [4] To detect the exact position of a body on the Earth’s surface, the so called inertial measurement technology (INS) has been in use for a long time.
Figure 11: inertial navigation system (INS) The INS comprises three gyroscope channels to measure rotational speed and three acceleration channels to measure linear acceleration. The accelerometers are also used to keep the system analytically leveled in steady state, accounting for the orientation of the Earth’s gravity vector. The gyros are used to calculate the angles in three dimensions at any instant under motion.
Compatible Measuring Systems for Data Acquisition of Vehicle Dynamic
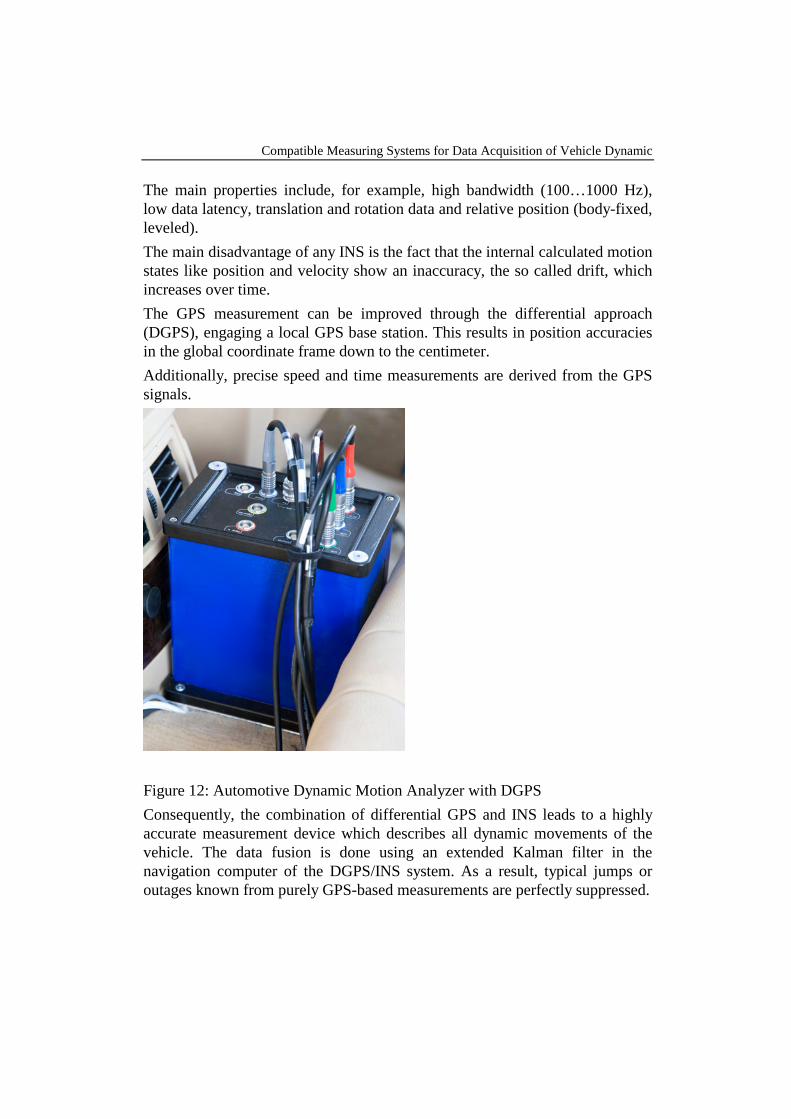
The main properties include, for example, high bandwidth (100…1000 Hz), low data latency, translation and rotation data and relative position (body-fixed, leveled). The main disadvantage of any INS is the fact that the internal calculated motion states like position and velocity show an inaccuracy, the so called drift, which increases over time. The GPS measurement can be improved through the differential approach (DGPS), engaging a local GPS base station. This results in position accuracies in the global coordinate frame down to the centimeter. Additionally, precise speed and time measurements are derived from the GPS signals.
Figure 12: Automotive Dynamic Motion Analyzer with DGPS Consequently, the combination of differential GPS and INS leads to a highly accurate measurement device which describes all dynamic movements of the vehicle. The data fusion is done using an extended Kalman filter in the navigation computer of the DGPS/INS system. As a result, typical jumps or outages known from purely GPS-based measurements are perfectly suppressed.
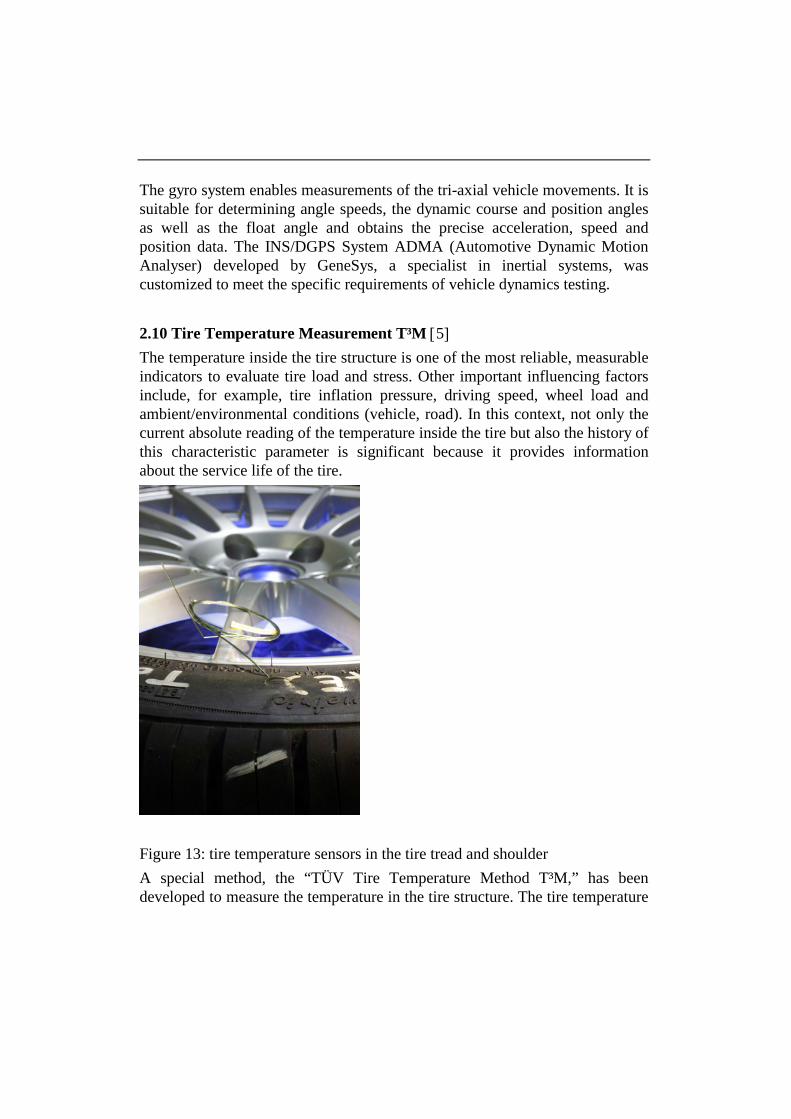
The gyro system enables measurements of the tri-axial vehicle movements. It is suitable for determining angle speeds, the dynamic course and position angles as well as the float angle and obtains the precise acceleration, speed and position data. The INS/DGPS System ADMA (Automotive Dynamic Motion Analyser) developed by GeneSys, a specialist in inertial systems, was customized to meet the specific requirements of vehicle dynamics testing. 2.10 Tire Temperature Measurement T³M [5] The temperature inside the tire structure is one of the most reliable, measurable indicators to evaluate tire load and stress. Other important influencing factors include, for example, tire inflation pressure, driving speed, wheel load and ambient/environmental conditions (vehicle, road). In this context, not only the current absolute reading of the temperature inside the tire but also the history of this characteristic parameter is significant because it provides information about the service life of the tire.
Figure 13: tire temperature sensors in the tire tread and shoulder A special method, the “TÜV Tire Temperature Method T³M,” has been developed to measure the temperature in the tire structure. The tire temperature
Compatible Measuring Systems for Data Acquisition of Vehicle Dynamic
is measured in the tread and/or the tire shoulder using Pt-100 resistance sensors. Specific objectives of this method are: Optimization of the tire in operation Thermal analysis and tuning of tire and thus vehicle performance
As a DTA solution, the thermoelectric voltages for the range from -130°C…+179°C are amplified in the measurement wheel, digitalized and telemetrically transmitted to the stator and passed on to data acquisition as a LAN protocol. 2.11 Synchronous Data Acquisition [6]
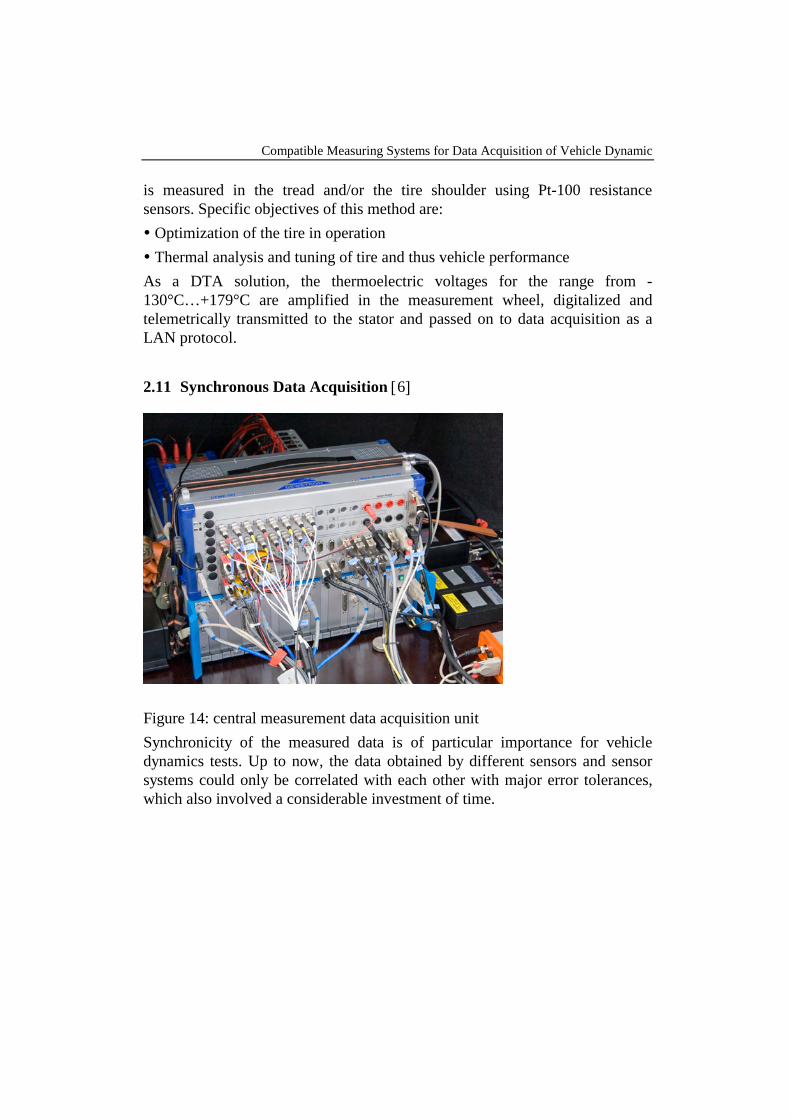
Figure 14: central measurement data acquisition unit Synchronicity of the measured data is of particular importance for vehicle dynamics tests. Up to now, the data obtained by different sensors and sensor systems could only be correlated with each other with major error tolerances, which also involved a considerable investment of time.
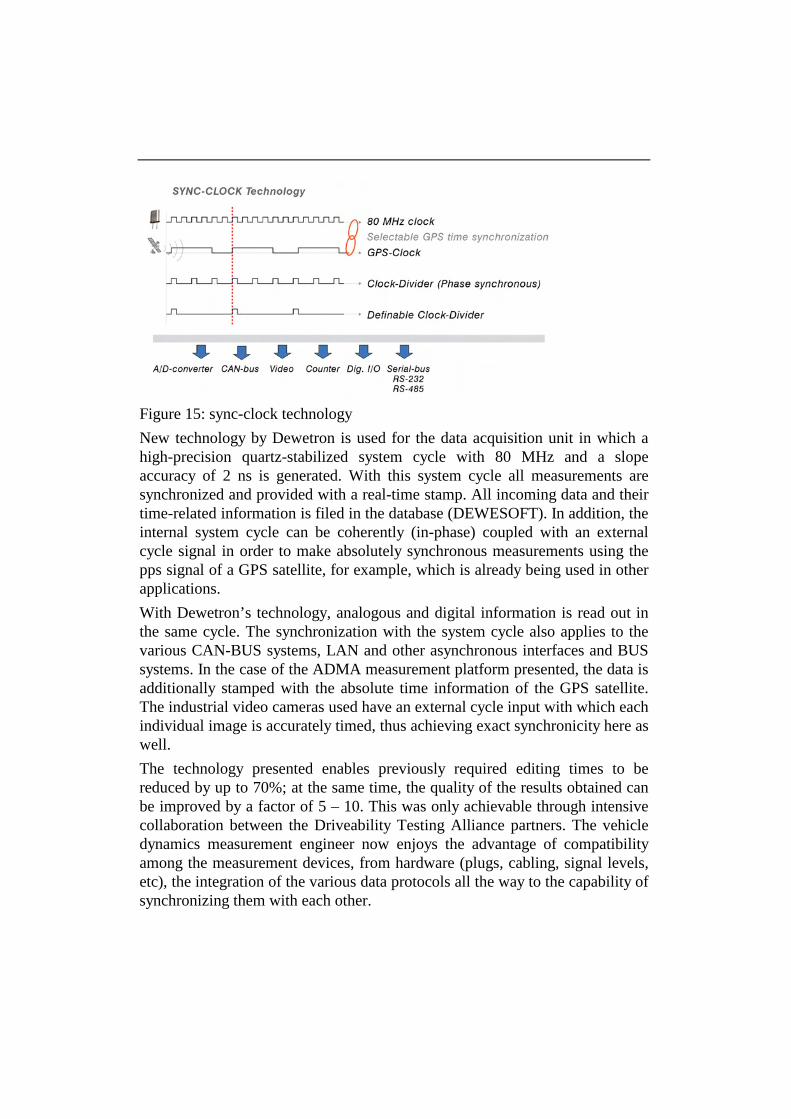
Figure 15: sync-clock technology New technology by Dewetron is used for the data acquisition unit in which a high-precision quartz-stabilized system cycle with 80 MHz and a slope accuracy of 2 ns is generated. With this system cycle all measurements are synchronized and provided with a real-time stamp. All incoming data and their time-related information is filed in the database (DEWESOFT). In addition, the internal system cycle can be coherently (in-phase) coupled with an external cycle signal in order to make absolutely synchronous measurements using the pps signal of a GPS satellite, for example, which is already being used in other applications. With Dewetron’s technology, analogous and digital information is read out in the same cycle. The synchronization with the system cycle also applies to the various CAN-BUS systems, LAN and other asynchronous interfaces and BUS systems. In the case of the ADMA measurement platform presented, the data is additionally stamped with the absolute time information of the GPS satellite. The industrial video cameras used have an external cycle input with which each individual image is accurately timed, thus achieving exact synchronicity here as well. The technology presented enables previously required editing times to be reduced by up to 70%; at the same time, the quality of the results obtained can be improved by a factor of 5 – 10. This was only achievable through intensive collaboration between the Driveability Testing Alliance partners. The vehicle dynamics measurement engineer now enjoys the advantage of compatibility among the measurement devices, from hardware (plugs, cabling, signal levels, etc), the integration of the various data protocols all the way to the capability of synchronizing them with each other.
Compatible Measuring Systems for Data Acquisition of Vehicle Dynamic
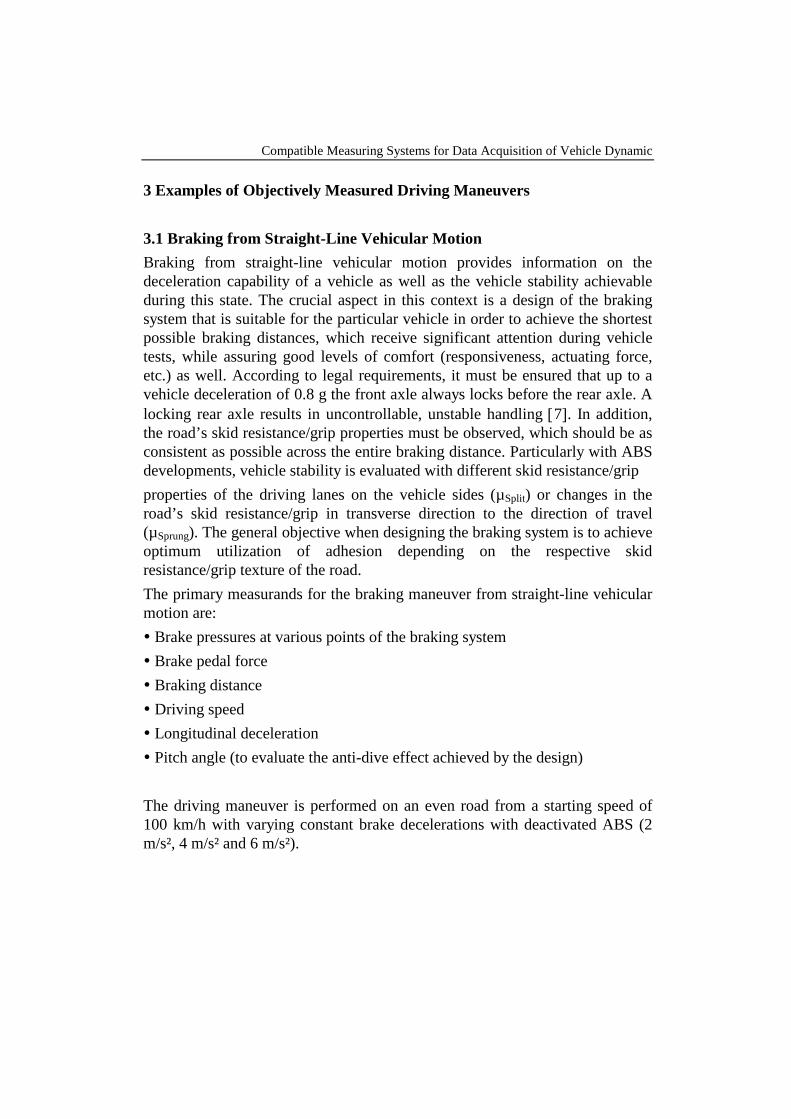
3 Examples of Objectively Measured Driving Maneuvers 3.1 Braking from Straight-Line Vehicular Motion Braking from straight-line vehicular motion provides information on the deceleration capability of a vehicle as well as the vehicle stability achievable during this state. The crucial aspect in this context is a design of the braking system that is suitable for the particular vehicle in order to achieve the shortest possible braking distances, which receive significant attention during vehicle tests, while assuring good levels of comfort (responsiveness, actuating force, etc.) as well. According to legal requirements, it must be ensured that up to a vehicle deceleration of 0.8 g the front axle always locks before the rear axle. A locking rear axle results in uncontrollable, unstable handling [7]. In addition, the road’s skid resistance/grip properties must be observed, which should be as consistent as possible across the entire braking distance. Particularly with ABS developments, vehicle stability is evaluated with different skid resistance/grip properties of the driving lanes on the vehicle sides (µSplit) or changes in the road’s skid resistance/grip in transverse direction to the direction of travel (µSprung). The general objective when designing the braking system is to achieve optimum utilization of adhesion depending on the respective skid resistance/grip texture of the road. The primary measurands for the braking maneuver from straight-line vehicular motion are: Brake pressures at various points of the braking system Brake pedal force Braking distance Driving speed Longitudinal deceleration Pitch angle (to evaluate the anti-dive effect achieved by the design)
The driving maneuver is performed on an even road from a starting speed of 100 km/h with varying constant brake decelerations with deactivated ABS (2 m/s², 4 m/s² and 6 m/s²).
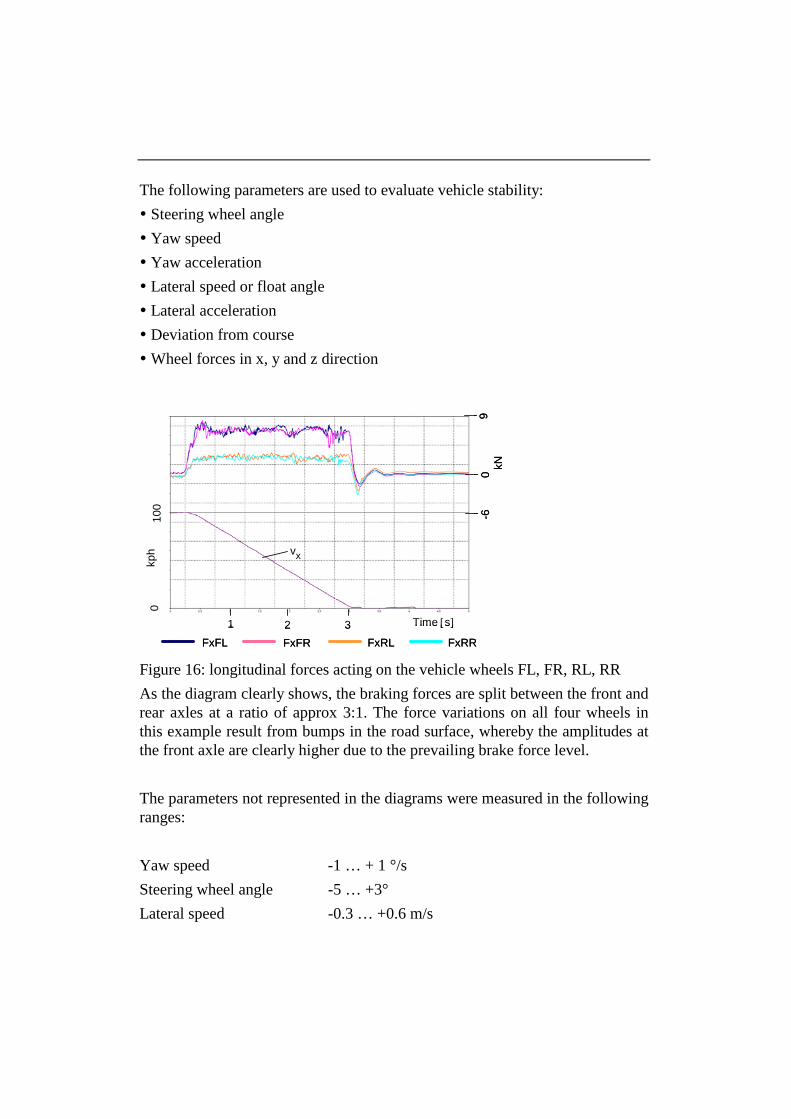
The following parameters are used to evaluate vehicle stability: Steering wheel angle Yaw speed Yaw acceleration Lateral speed or float angle Lateral acceleration Deviation from course Wheel forces in x, y and z direction
FxFL FxFR FxRL FxRR
vx
Time [s]1 2 3
09
kN
100
0kp
h
-6
FxFL FxFR FxRL FxRR
vx
Time [s]1 2 3
09
kN
100
0kp
h
-6
Figure 16: longitudinal forces acting on the vehicle wheels FL, FR, RL, RR As the diagram clearly shows, the braking forces are split between the front and rear axles at a ratio of approx 3:1. The force variations on all four wheels in this example result from bumps in the road surface, whereby the amplitudes at the front axle are clearly higher due to the prevailing brake force level. The parameters not represented in the diagrams were measured in the following ranges: Yaw speed -1 … + 1 °/s Steering wheel angle -5 … +3° Lateral speed -0.3 … +0.6 m/s
Compatible Measuring Systems for Data Acquisition of Vehicle Dynamic
Float angle approx. 0° Longitudinal deceleration approx. 10 m/s² These values show that even in case of high longitudinal deceleration the vehicle stays its course at a high level of stability. 3.2 Lane Change Test The lane change test is a closed-loop test in which the vehicle operator has to drive through a standardized cone-lined lane in as short a time as possible without hitting the individual cones. The tests are conducted with and without ESP (electronic stability program). The primary parameters for the lane change test are: Driving speed, vehicle longitudinal and lateral speed Steering wheel turning angle and steering wheel torque Wheel forces Fx, Fy, Fz and wheel moments Mx, My, Mz and wheel speed
FL, FR, FR, RR Toe and camber angle, wheel motion in x, y and z direction Vehicle float angle (leveled and related to road surface) Slip angle on vehicle wheel FL, RL, FR and RR Pitch, roll and yaw angle (leveled and vehicle-related) Longitudinal, lateral and yaw acceleration (leveled and vehicle-related)
Fi UwanstinIt hediflstInin 3.Adestof
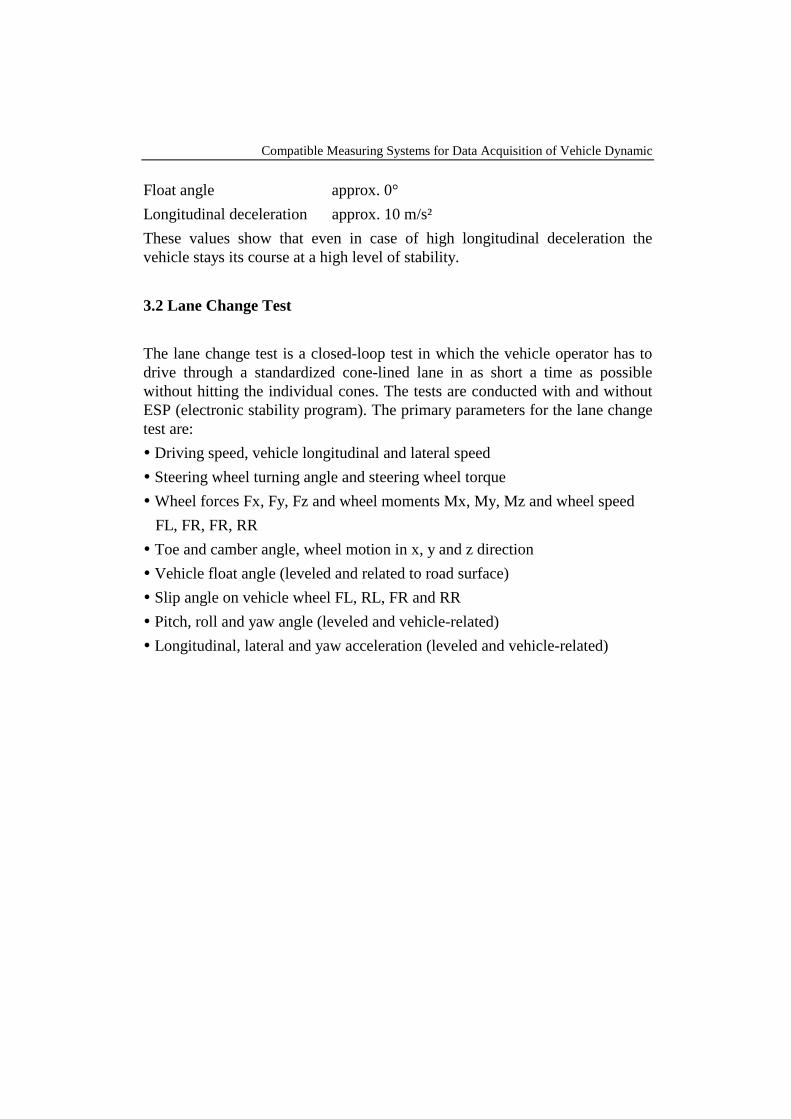
gure 17: double lane change test according to ISO 3888-2
pon leaving the entry lane the steering wheel angle is in phase with the lateral heel forces at the front axle, with the lateral acceleration and the vehicle float gle. When entering the lane-change track the float angle responds early with
eering turn-in while the other parameters respond with a time delay due to the ertial masses of the vehicle system. is notable that the front outside cornering wheel, which is thus subjected to a avier load, subsequently – due to the higher force level - responds later to the rectional change than the relieved wheel. The lateral acceleration and the oat angle with regard to amount and direction respond pretty accurately to the eering angle changes. total, it can be said that the yaw speed and lateral acceleration curves provide formation on the transversal dynamics properties of the vehicle.
3 Braking from steady-state circular motion ccording to ISO 7975 the primary objective of this open-loop test is to termine the effect of braking on the directional behavior of a vehicle whose
eady-state circular motion is only interfered with by the braking response as the time t0. In the example shown, the vehicle is driven counter-clockwise on
Compatible Measuring Systems for Data Acquisition of Vehicle Dynamic
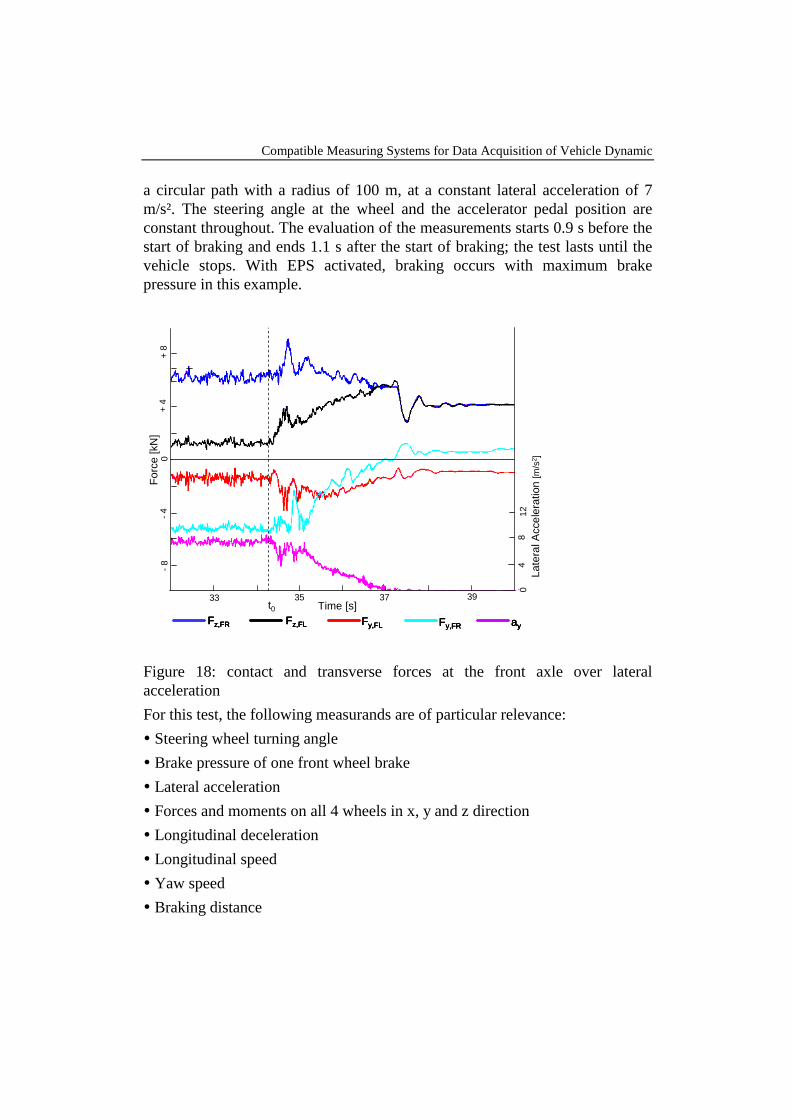
a circular path with a radius of 100 m, at a constant lateral acceleration of 7 m/s². The steering angle at the wheel and the accelerator pedal position are constant throughout. The evaluation of the measurements starts 0.9 s before the start of braking and ends 1.1 s after the start of braking; the test lasts until the vehicle stops. With EPS activated, braking occurs with maximum brake pressure in this example.
33 35 37 39Time [s]
0-4
-8+
4+
8Fo
rce
[kN
]
Late
ral A
ccel
erat
ion
[m/s
2 ]0
48
12
Fz,FR Fz,FL Fy,FL Fy,FR ay
t033 35 37 39
Time [s]
0-4
-8+
4+
8Fo
rce
[kN
]
Late
ral A
ccel
erat
ion
[m/s
2 ]0
48
12
Fz,FR Fz,FL Fy,FL Fy,FR ay
33 35 37 39Time [s]
0-4
-8+
4+
8Fo
rce
[kN
]
Late
ral A
ccel
erat
ion
[m/s
2 ]0
48
12
Fz,FR Fz,FL Fy,FL Fy,FR ayFz,FR Fz,FL Fy,FL Fy,FR ay
t0
Figure 18: contact and transverse forces at the front axle over lateral acceleration For this test, the following measurands are of particular relevance: Steering wheel turning angle Brake pressure of one front wheel brake Lateral acceleration Forces and moments on all 4 wheels in x, y and z direction Longitudinal deceleration Longitudinal speed Yaw speed Braking distance
Roll angle Floating angle Lateral speed Lateral deviation of the center of gravity from reference path
Figure 18 clearly shows the different wheel loads of the outside and inside cornering wheels in the vertical and lateral direction. Due to the high brake pressure a controlled intervention of the wheel brakes occurs shortly after braking has been initiated, whereby the resulting wheel load changes in both load directions are more pronounced with the outside cornering wheel. Due to the lower slip angle the wheel subjected to the lower load responds earlier in vertical direction than the outside cornering wheel. Whereas the wheel contact forces decrease to a weight load of approx. 400 kg / wheel after the wheels have stopped, the lateral forces remain at levels of + 1kN or – 1kN due to the strains. They would only drop back to zero again after the wheels start rolling again. 000
FTs
33 35 37 39Time [s] -2
0011
0024
0037
0050
0
-3-1
,5-0
,50
0,5
Brak
ing
torq
ue [k
Nm
]
Whe
el s
peed
[°/s
]]
My,FR My,FL ωFL ωFR
t033 35 37 39
Time [s] -200
1100
2400
3700
500
-3-1
,5-0
,50
0,5
Brak
ing
torq
ue [k
Nm
]
Whe
el s
peed
[°/s
]]
My,FR My,FL ωFL ωFR
33 35 37 39Time [s] -2
0011
0024
0037
0050
0
-3-1
,5-0
,50
0,5
Brak
ing
torq
ue [k
Nm
]
Whe
el s
peed
[°/s
]]
My,FR My,FL ωFL ωFR
t0
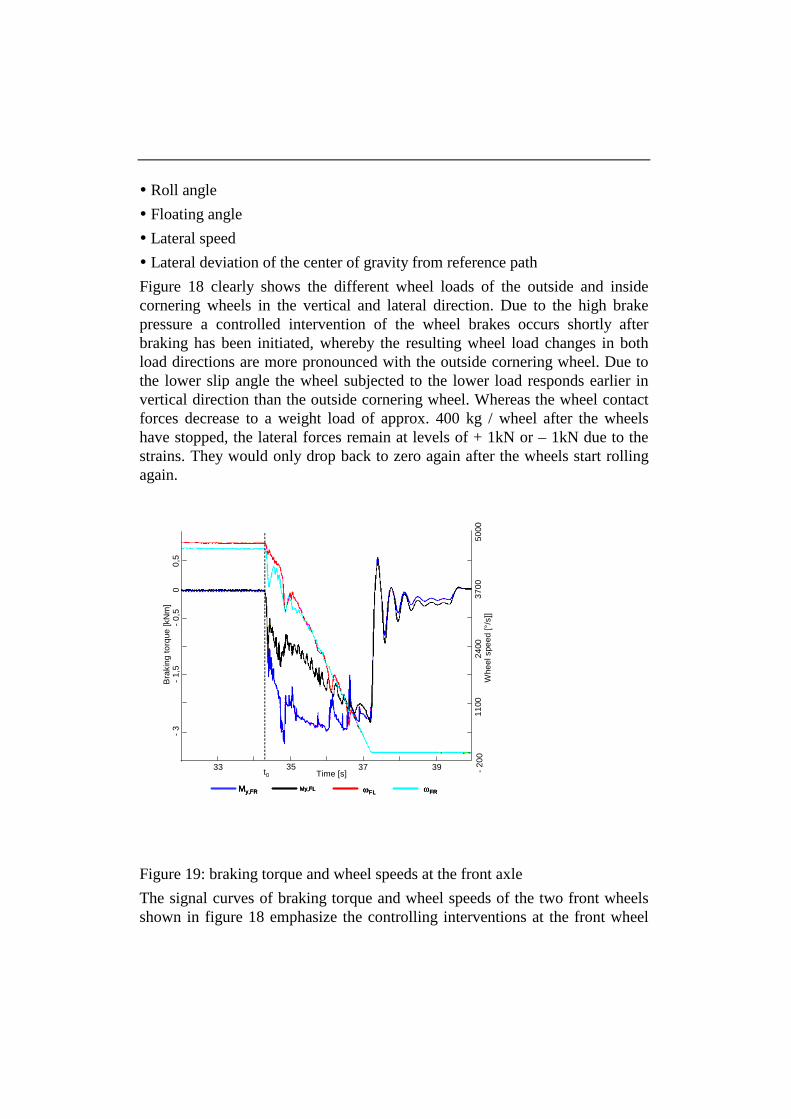
igure 19: braking torque and wheel speeds at the front axle he signal curves of braking torque and wheel speeds of the two front wheels hown in figure 18 emphasize the controlling interventions at the front wheel
Compatible Measuring Systems for Data Acquisition of Vehicle Dynamic
brakes previously addressed in figure 16. At the outside front left cornering wheel the brake torque amplitudes are much more pronounced and confirmed by the wheel speeds. Shortly after initiating the braking action and upon reaching the locking limit the brake releases, torque is reduced and the wheel again runs up to a higher speed. When both ABS and EPS systems are installed, both systems assist each other in the effort of achieving the maximum of the vehicle’s attainable stability. After the vehicle has stopped, braking torques at the front axle harmoniously decay and return to their original value of zero. According to [8], when braking, a maximum yaw moment occurs with the wheel load changes resulting from the changes to the longitudinal forces in the tire contact patch. Due to the increased wheel loads the slip angle at the front axle decreases and increases at the rear axle due to the reduced wheel loads. The instantaneous center of rotation shifts forward and closer to the vehicle, resulting in a smaller cornering radius compared to the original state. 4 Summary The Driveability Testing Alliance incepted in 2007 has since managed to ensure a high degree of compatibility between all DTA products at the hard- and software level. From simple to complex system measurements, the entire sensor – signal processing – signal analysis process chain and methodology development can be delivered. For the first time, a complete vehicle dynamics measurement and evaluation system has thus successfully been made available. At the same time care was taken to ensure that the DTA’s hard- and software components are self-explanatory and easy to operate 5 References [1] Rompe/Heißing: Objektive Testverfahren für die Fahreigenschaften von Kraftfahrzeugen, Verlag TÜV Rheinland, 1984 [2] CORRSYS-DATRON GmbH, Charlotte-Bamberg-Str. 12, D-35578 Wetz-lar, www.corrsys-datron.de[3] Kistler Instrumente AG, Eulachstr. 22, CH-8408 Winterthur, www.kistler.com[4] GeneSys Elektronik GmbH, In der Spöck 10, D-77656 Offenburg www.genesys-offenburg.de
[5] Dewetron Ges.m.b.H., Parkring 4, A-8074 Graz-Grambach, www.dewetron.com[6] TÜV-SÜD Automotive GmbH, Daimlerstr. 11, D-85748 Garching www.tuev-sued.de/fahrwerkT[7] Braess/Seiffert (Hrsg.): Vieweg Handbuch Kraftfahrzeugtechnik, Friedr. Vieweg & Sohn Verlag / GWV Fachverlage GmbH, Wiesbaden, 2007 [8] Heißing/Ersoy (Hrsg.): Fahrwerkhandbuch, Friedr. Vieweg & Sohn Verlag / GWV Fachverlage GmbH, Wiesbaden, 2007