Embed Size (px)
Citation preview
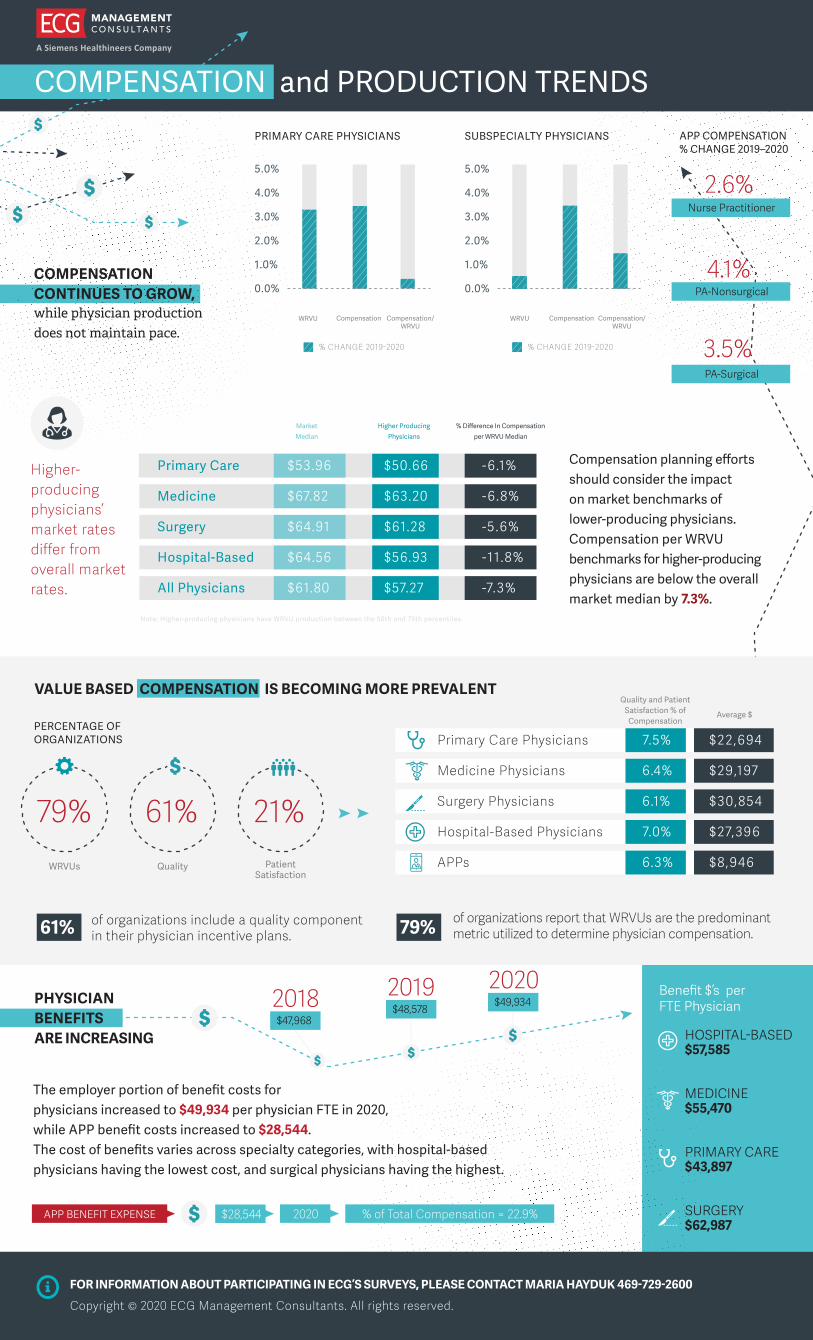
COMPENSATION CONTINUES TO GROW, while physician production does not maintain pace.
Compensation planning efforts should consider the impact on market benchmarks of lower-producing physicians. Compensation per WRVU benchmarks for higher-producing physicians are below the overall market median by 7.3%.
VALUE BASED COMPENSATION IS BECOMING MORE PREVALENT
of organizations include a quality component in their physician incentive plans.
The employer portion of benefit costs for physicians increased to $49,934 per physician FTE in 2020, while APP benefit costs increased to $28,544. The cost of benefits varies across specialty categories, with hospital-based physicians having the lowest cost, and surgical physicians having the highest.
79% 61% 21%
5.0%
4.0%
3.0%
2.0%
1.0%
0.0%
PRIMARY CARE PHYSICIANS
% CHANGE 2019-2020
WRVU Compensation Compensation/WRVU
5.0%
4.0%
3.0%
2.0%
1.0%
0.0%
SUBSPECIALTY PHYSICIANS
WRVU Compensation Compensation/WRVU
% CHANGE 2019-2020
WRVUs Quality Patient Satisfaction
PERCENTAGE OF ORGANIZATIONS Primary Care Physicians
Medicine Physicians
Surgery Physicians
Hospital-Based Physicians
APPs
7.5%
6.4%
6.1%
7.0%
6.3%
$22,694
$29,197
$30,854
$27,396
$8,946
FOR INFORMATION ABOUT PARTICIPATING IN ECG’S SURVEYS, PLEASE CONTACT MARIA HAYDUK 469-729-2600
Copyright © 2020 ECG Management Consultants. All rights reserved.
HOSPITAL-BASED $57,585 MEDICINE $55,470
PRIMARY CARE $43,897
SURGERY $62,987
61% of organizations report that WRVUs are the predominant metric utilized to determine physician compensation. 79%
APP BENEFIT EXPENSE
2019$48,578
2020$49,934
APP COMPENSATION % CHANGE 2019–2020
2.6%Nurse Practitioner
4.1%PA-Nonsurgical
3.5%PA-Surgical
PHYSICIANBENEFITS ARE INCREASING
Higher- producing physicians’ market rates differ from overall market rates.
Benefit $’s per FTE Physician
Quality and Patient Satisfaction % of
CompensationAverage $
Primary Care
Medicine
Surgery
Hospital-Based
All Physicians
$53.96
$67.82
$64.91
$64.56
$61.80
-6.1%
-6.8%
-5.6%
-11.8%
-7.3%
$50.66
$63.20
$61.28
$56.93
$57.27
MarketMedian
Higher Producing Physicians
% Difference In Compensation per WRVU Median
Note: Higher-producing physicians have WRVU production between the 50th and 75th percentiles.
$28,544 2020 % of Total Compensation = 22.9%
COMPENSATION and PRODUCTION TRENDS
2018$47,968