Embed Size (px)
Citation preview

COMPENSATION STRATEGIES FOR NONPROFITS
October 30, 2008
Bay Area Nonprofit HR Network
San Francisco, CA

2
Today’s Discussion
Introductions
Total Rewards Model
Compensation Challenges and Solutions
Wrap-Up and Questions
3
Total Rewards Model

4
Elements of Total Rewards
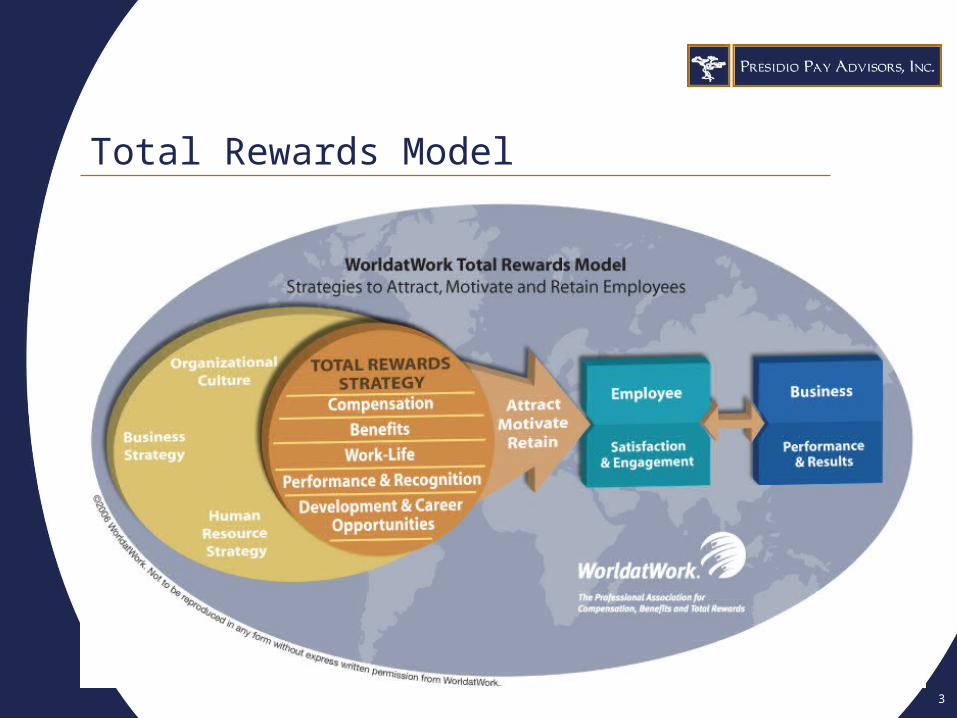
WorldatWork’s model includes five elements:
1) Compensation
2) Benefits
3) Work-Life
4) Performance and Recognition
5) Development and Career Opportunities

5
What is your Compensation Philosophy?
How do you look/act different from competitors?
How does compensation fit with other Total Rewards?
How does pay link to “business” strategy?
How much you value individual performance and differentiate pay as a result?

6
Compensation Challenge #1
Competing for Talent
in the
For-Profit World
Managing a tightsalary budget
Competing withequity grants
Driving performancewithout a bonus plan

7
Possible Solutions
Managing a tight salary budget
Manage pay with a market-based salary structure
Differentiate salary increases based on a merit matrix
Take a Total Rewards approach to marketing
2
3
1

8
Solution #1: Market-Based Salary Structure
What is a salary structure?
Defines the base pay opportunities for jobs in an organization or company
Made up of grades and corresponding salary ranges developed from data about pay patterns in the market
Used to establish and maintain the internal and market value of the positions in an organization
9
Solution #1: Market-Based Salary Structure
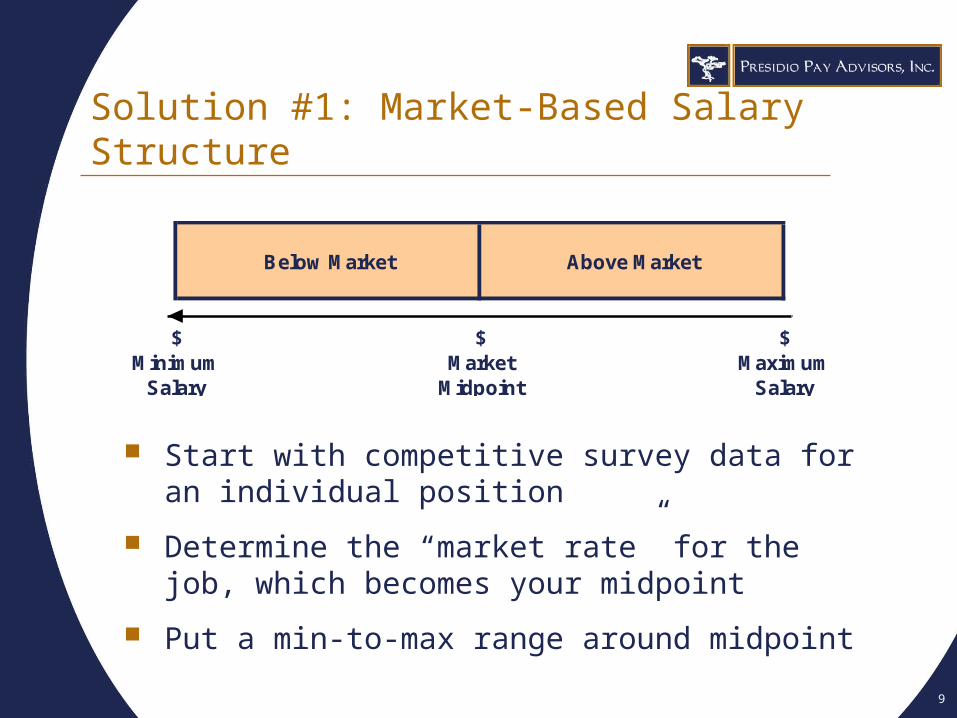
$ $Minimum Market Maximum
Salary Midpoint Salary
Below Market Above Market
$
Start with competitive survey data for an individual position
Determine the “market rate” for the job, which becomes your midpoint
Put a min-to-max range around midpoint

10
Solution #1: Market-Based Salary Structure
Nonprofit Compensation Surveys
PRM Consulting
GuideStar
Council on Foundations
Watson Wyatt Data Services
Abbot, Langer Salary Surveys
ERI Nonprofit Comparables Assessor
CompAnalysis

11
Solution #1: Market-Based Salary Structure
Grade 7min max
Grade 6min max
Grade 5min max
Grade 4min max
Grade 3min max
Grade 2min max
Grade 1min max

12
Solution #1: Market-Based Salary Structure
Salary Midpoint Range Width Base Salary Range Number ofGrade Progression Low High Minimum Midpoint Maximum Positions
10 25% 20.0% 20.0% $134.3 $179.1 $223.9 19 25% 20.0% 20.0% $107.4 $143.2 $179.0 68 20% 20.0% 20.0% $91.6 $114.5 $137.5 47 20% 20.0% 20.0% $76.4 $95.5 $114.5 106 20% 15.0% 15.0% $67.6 $79.5 $91.5 95 19% 15.0% 15.0% $56.3 $66.3 $76.2 54 17% 15.0% 15.0% $47.3 $55.7 $64.1 43 15% 10.0% 10.0% $40.5 $47.6 $54.8 82 15% 10.0% 10.0% $35.2 $41.4 $47.6 51 - 10.0% 10.0% $30.6 $36.0 $41.4 2
Total 54

13
Solution #2: Merit Increase Matrix
Performance RatingPosition Does Not Meets Some, Meets Meets All, Exceptional
In Meet Not All Requirements Exceeds Some PerformanceSalary Range % Increase % Increase % Increase % Increase % Increase
Bottom Third
Middle Third 1.5%
Upper Third 0.5%
0.0% 3.0% 10.0%5.0% 7.5%
0.0%
0.0% 5.0%
3.5%
2.5% 3.5%
5.0% 7.0%

14
Solution #3: Total Rewards Approach
Total Rewards Statements show employees what the organization spends on them each year
Using a software program, statement itemizes:
– Compensation
– Benefits costs paid by organization
– Retirement contributions
– Value of other perks
Often-missed “marketing” opportunity for HR

15
Possible Solutions
Competing with equity grants
Beef up retirement plan offerings
Offer (real) work/life balance
Emphasize generous benefits
1
2
3

16
Possible Solutions
Driving performance without a bonus plan
Formalize performance assessment and goal-setting process
Differentiate salary increases based on individual performance
Develop career paths
1
2
3

17
Compensation Challenge #2
Recruitment and
Retention of
Top-Tier Executive
Talent
Offering competitive pay package
Not attracting unwanted scrutiny
Linking pay and performance

18
Possible Solutions
Offering competitive pay package
Research competitive pay
Think about retirement (because executives are)
Be creative with “soft stuff”
1
2
3

19
Solution #1: Research Competitive Pay
Understand the Executive Position
Position descriptions: Make sure the executive has recently reviewed their own job description
Executive interviews: Meet with incumbent to understand scope of the job and market match
Look for market match: Very few executive positions have no competitive comparable

20
Solution #1: Research Competitive Pay
Determine the Competitive Marketplace
What is the broad “industry”?
– Ex: Healthcare, social services, environment
Then narrow it down within the industry
– Hospital or outpatient clinics
– Job training for low-income population
– Animal welfare and protection

21
Solution #1: Research Competitive Pay
Determine the Competitive Marketplace
Executive pay is closely correlated with company or organization size
– Most common measurement is annual revenue
– Additional measures include
• Budget
• # of employees

22
Solution #1: Research Competitive Pay
Determine the Competitive Marketplace
With whom do you compete for talent?
– Is there an organization that recruits the same people you do?
– Anyone that consistently steals employees from you?
– Use the “next best offer” method

23
Solution #1: Research Competitive Pay
Establish a Peer Group
Using the narrowed down “peer group” characteristics, look to the competitive marketplace for relevant information.
Competitive market defined through two data sources:
1. Published compensation surveys
2. Publicly available IRS form 900 disclosures from a targeted comparator group

24
Solution #1: Research Competitive Pay
Establish a Peer Group
Casting a wide net helps eventually create a solid group (may start with hundreds)
Then follow these steps to arrive at peer group:
What types of organizations are
“like enterprises” or offer “like
services”?
Arrive at a Comparator Group
of 15 to 25 organizations
How many organizations have similar operating
budgets?
Of the remaining organizations, how
many have a comparable headcount?
Types of Organizations
Filter #1: Operating Budget
Filter #2: Employees
Comparator Group

25
Solution #1: Research Competitive Pay
Analyze Competitive Total Cash
Published surveys report actual and target total cash amounts
– We analyze base salaries and annual bonuses separately
– Then look at actual cash compensation paid in last fiscal year, updated to the current date
– Don’t use target total cash, because target bonuses can be misleading if actual bonus paid varies significantly from the target

26
Solution #1: Research Competitive Pay
Analyze Competitive Total Cash
IRS 990 Disclosures aggregate base salary and bonuses into a Total Compensation column
– Can make it difficult to determine what was base salary and what was bonus
Once we settle on the market rate for a job, we put a range around that number
– Typically +/– 20% for executives
– May be a smaller range for nonprofits

27
Solution #2: Think About Retirement
Model the impact of your current retirement programs on key executives and employees under a variety of assumptions
It may be less expensive to make your retirement plans more generous than to increase compensation levels

28
Possible Solutions
Not attracting unwanted scrutiny
Make sure you offer “reasonable compensation”
Use independent 3rd party to conduct pay analysis
Follow good compensation governance guidelines
1
2
3
29
Solution #1: Reasonable Compensation
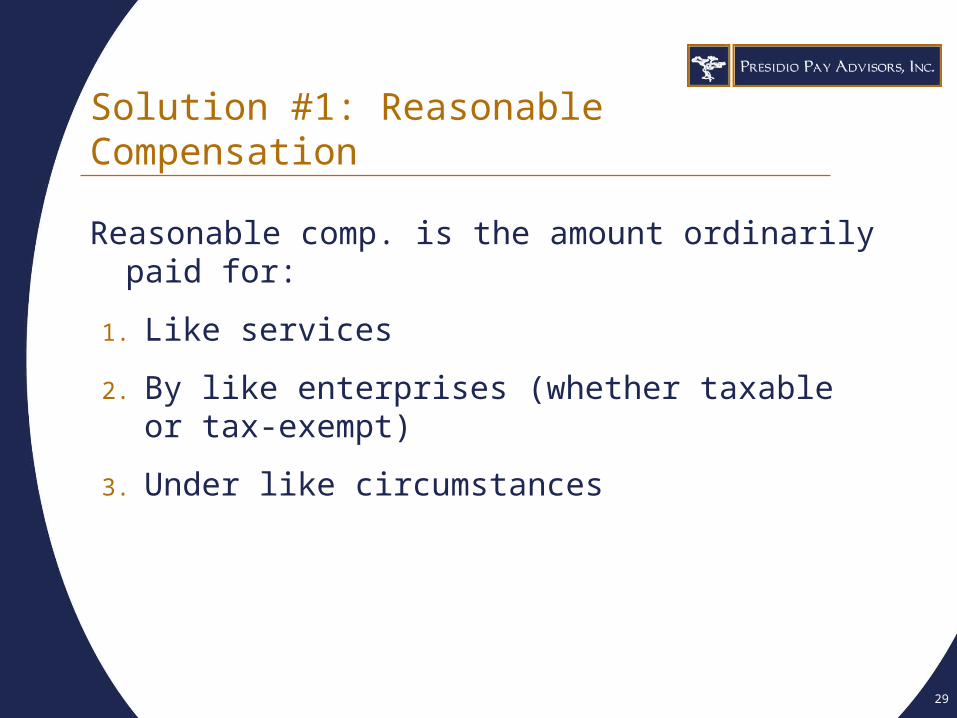
Reasonable comp. is the amount ordinarily paid for:
1. Like services
2. By like enterprises (whether taxable or tax-exempt)
3. Under like circumstances

30
Solution #1: Reasonable Compensation
1. Like Services
Type of work
National position or local in scope
Number of employees managed
Budget or assets managed
Multiple functions, departments or locations managed
Full-time or part-time

31
Solution #1: Reasonable Compensation
2. Like Enterprises
Size – budget, revenues, # employees
Same “business” type
Could be a mix of nonprofit and for-profit as long as scoped appropriately
Entities that compete for same pool of talent

32
Solution #1: Reasonable Compensation
3. Like Circumstances
Comparators must consist of similar mix of compensation elements
Include all compensation, whether taxable or not
Similar geography (cost-of-living)

33
Solution #1: Reasonable Compensation
“Good Compensation Governance”
Systematic procedures set and followed
Responsible effort to determine reasonable levels
All taxable items reported accurately
Board of Directors maintain appropriate oversight
Executive does not make decisions related to his/her own pay

34
Possible Solutions
Linking pay and performance
Formal executive performance assessment and development
Goals and progress-to-goals linked to salary increases
Annual incentives paid based on achievement of stretch goals
1
2
3

35
Other Points of Discussion
Geographic pay differentials
Employee communications
Market movement for certain “hot” job families

36
Questions
If you have any questions about this presentation or other compensation issues, please feel free to contact me:
Brooke Green
Principal
Presidio Pay Advisors, Inc.
850 Montgomery Street, Suite 150
San Francisco, CA 94133
(415) 438-3403