Embed Size (px)
Citation preview

A Non - P r o f i t Re s e a r c h and Ana l y s i s Co r po r a t i o n
4825 Mark Cente r Dr i ve • A lexandr ia , V i r g in ia 22311-1850 • (703) 824-2000 • (703) 824-2942 FAX
(IPR) 11647 / December 2005Revised Version
Competition in Corrections: Comparing Public and Private Sector Operations
Julianne Nelson

This document was supported by Contract Number GS-23F-8096H by the Federal Bureau of Prisons. This document rep-resents the best opinion of The CNA Corporation at the time of issue. It does not necessarily represent the opinion of the Federal Bureau of Prisons.
Copyright 2005 The CNA Corporation

i
Contents
Executive summary .....................................................................................1
Chapter 1 BACKGROUND: The federal government reinvented................5
The Congressional mandate................................................................. 5
Evaluating costs at TCI.......................................................................... 6
An overview of our approach................................................................ 7
Chapter 2 LOOKING FORWARD: Predicted differences in the cost of public and private correctional services ....................................................9
The context for cost comparisons........................................................ 9
The mechanics of cost predictions..................................................... 10
Private facility predictions................................................................... 12
Public facility predictions ................................................................... 14
Expected operating costs compared .................................................. 22
Support costs, avoidable and otherwise ............................................. 23
Public and private predictions once again ........................................ 25
Chapter 3 ON-GOING ACTIVITY: Competing public and private facilities in operation ................................................................................27
Inmate populations served ................................................................. 29
Predicted and observed contract costs in the private facility ............. 33
Predicted in-house costs: the in-house model revisited ...................... 35
Observed costs at comparison BOP institutions................................ 38
Evaluating the results thus far ............................................................ 43

ii
Updating the in-house model ............................................................ 48
Chapter 4 BOP operations in a broader context....................................53
Inmates at other low-security institutions .......................................... 53
Expenditures at other low security facilities ...................................... 56
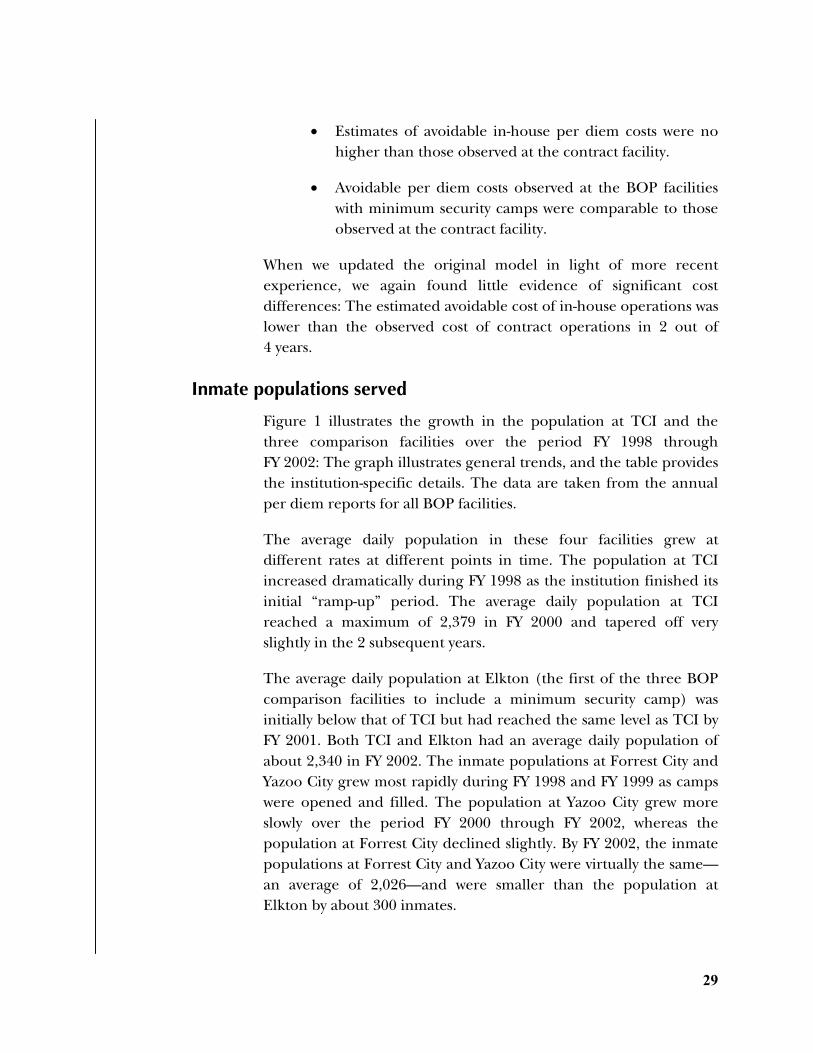
Staffing levels and compensation....................................................... 63
Chapter 5 LOOKING BACK: Total expenditures over the first five years of the Taft contract ...................................................................................75
Activation expenditures compared .................................................... 75
Net impact of outsourcing: a present value approach ...................... 79
Appendix A: BOP support costs, FY 1998................................................83
Assigning unavoidable costs................................................................ 83
Consistency with activity-based cost accounting ................................ 83
Avoidable costs at the BOP................................................................. 86
Policy statements ................................................................................. 89
Appendix B: Inmate population data ......................................................93
Appendix C: Expenditures at BOP facilities, FY 1999–2002...................97
Appendix D: BOP Support costs, FY 1999–2002 ...................................113
Appendix E: Facility Staffing Patterns, FY 1999 through 2002.............127
References ...............................................................................................133
List of figures...........................................................................................137
List of tables.............................................................................................139

1
Executive summary
On July 21, 1997, the Federal Bureau of Prisons (BOP) announced that Wackenhut Corrections Corporation (now The GEO Group) had won the competition for a 10-year contract to manage a new federal correctional facility. Located in Taft, California, the new facility—known as Taft Correctional Institution (TCI)—had been designed and built by the federal government to house low-and minimum-security inmates.
In 2005, the CNA Corporation (CNAC) was asked to participate in the task of evaluating the first five years of this contract. The following report compares the cost of the TCI contract with the cost of operating the facility “in-house” during this period. A separate report prepared by the BOP analyzes the quality of contractor performance at Taft. A report prepared by Abt Associates reviews both the cost and quality of the contract services at this institution.
CNAC analysis indicates that the observed cost of the TCI contract was virtually identical to the estimated cost of in-house operation by government employees—based on practices observed at similar BOP facilities.
Using a cost model based on Circular A-76 guidelines and information available at the beginning of the TCI contract, we found that our initial estimate of the expected in-house cost of operating the facility was lower than the expected cost of the management contract. Using this model with actual (rather than expected) wage rates, inflation rates, and inmate population levels, we found that:
• Observed contract costs were generally higher than our initial estimates of what the BOP would have spent to operate TCI itself (i.e., the costs avoided through private sector management of the facility).
• Observed contract per diem costs exceeded expected contract costs, largely due to award fee payments and reimbursements for wage increases mandated by Service Contract Act revisions.
2
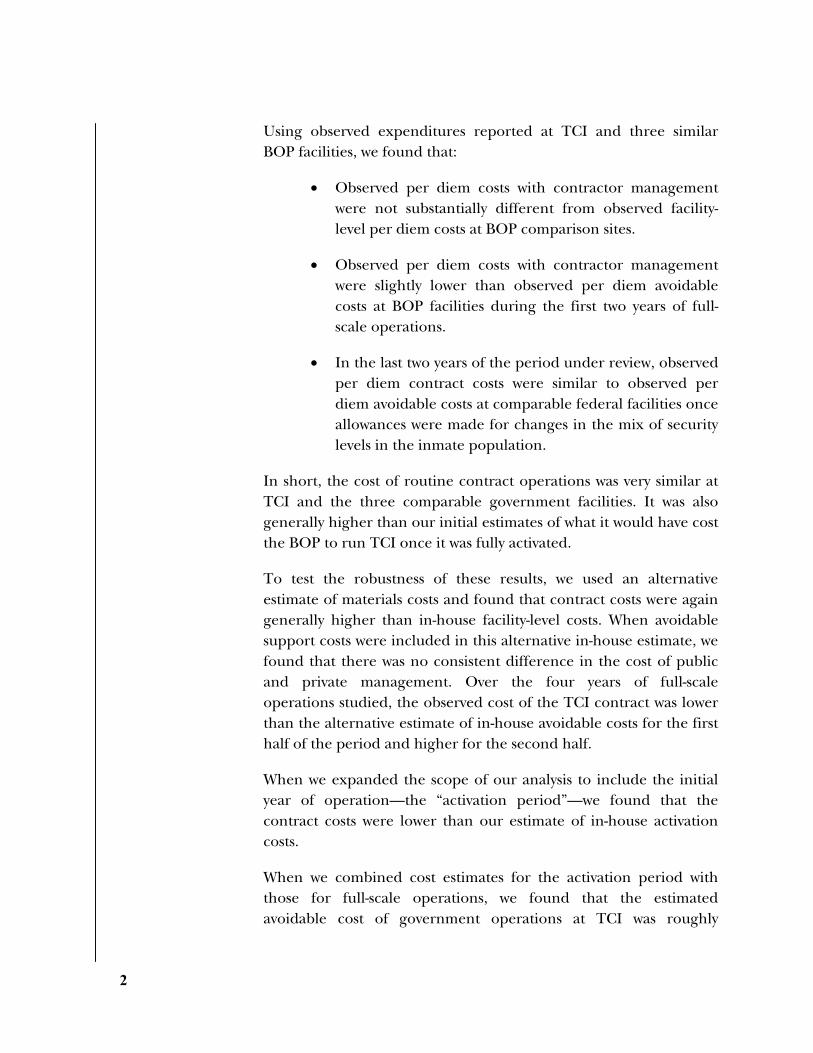
Using observed expenditures reported at TCI and three similar BOP facilities, we found that:
• Observed per diem costs with contractor management were not substantially different from observed facility-level per diem costs at BOP comparison sites.
• Observed per diem costs with contractor management were slightly lower than observed per diem avoidable costs at BOP facilities during the first two years of full-scale operations.
• In the last two years of the period under review, observed per diem contract costs were similar to observed per diem avoidable costs at comparable federal facilities once allowances were made for changes in the mix of security levels in the inmate population.
In short, the cost of routine contract operations was very similar at TCI and the three comparable government facilities. It was also generally higher than our initial estimates of what it would have cost the BOP to run TCI once it was fully activated.
To test the robustness of these results, we used an alternative estimate of materials costs and found that contract costs were again generally higher than in-house facility-level costs. When avoidable support costs were included in this alternative in-house estimate, we found that there was no consistent difference in the cost of public and private management. Over the four years of full-scale operations studied, the observed cost of the TCI contract was lower than the alternative estimate of in-house avoidable costs for the first half of the period and higher for the second half.
When we expanded the scope of our analysis to include the initial year of operation—the “activation period”—we found that the contract costs were lower than our estimate of in-house activation costs.
When we combined cost estimates for the activation period with those for full-scale operations, we found that the estimated avoidable cost of government operations at TCI was roughly

3
$4 million or 2.6 percent higher—on a present value basis—than the actual cost of contract operations at the facility.
We also identified three sources of potential savings:
• Reductions in centralized support costs
• Reductions in the cost of facility activation
• The general discipline—for both private and public sector managers—attributable to the on-going competition among service-providers.
The BOP’s experience with TCI and the three comparable public facilities provides an opportunity to examine the cost of private and public sector service-providers over a span of years. On-going comparisons of this nature have the potential to encourage fiscal responsibility – the effective and efficient use of available resources. The task ahead will be to continue the process that has been started.

4
This page left intentionally blank.

5
Chapter 1 BACKGROUND: The federal government reinvented
On July 21, 1997, the Federal Bureau of Prisons (BOP) announced that Wackenhut Corrections Corporation (now the GEO Group) had won the competition for a 10-year contract to manage a new federal correctional facility. Located in Taft, California, the new facility had been designed and built by the federal government to house low- and minimum-security inmates. Although the BOP had previously contracted with private-sector prison management companies for specific services, Taft Correctional Institution (TCI) was to become the first government-owned and contractor-operated federal prison.
The Congressional mandate
The decision to outsource the management of TCI was made by Congress. The FY 1997 appropriations act for the Department of Justice directed the Bureau of Prisons to “undertake a 5-year prison demonstration project involving the two Taft facilities ... to give the administration and Congress an opportunity to monitor safety and operational concerns” previously identified by the Department of Justice.1 In response, the BOP issued a request for proposals (RFP) “to provide for the comprehensive management and operation of a Government-owned/contractor-operated correctional facility.”2
The RFP required bidders to submit a “tiered” rate schedule: a firm-fixed price for housing up to 1,946 low and minimum security inmates each month and an incremental per diem rate which would apply whenever the inmate population fell between 1,946 and approximately 2,355 individuals. The successful bidder would receive a service contract with an award fee option to be granted at
1 Conference Report to Accompany H.R. 3610, Making Omnibus Consolidated Appropriations for Fiscal Year 1997, P.L. 104-208, September 23, 1996. Note: Only the first 5 years of the 10-year TCI contract were to be treated as part of the demonstration project. 2 Cover letter for RFP PCC-0001, dated November 27, 1996.

6
the discretion of the Government in recognition of exceptional performance. In exchange, the winning contractor would be required to provide “all necessary personnel, equipment, materials, supplies, and services” needed to operate the facility with a population of up to approximately 2,355 inmates.3 The final contractor selection was to be based on best-value. After the BOP reviewed the bids submitted by private corrections companies, it awarded a 3-year contract with 7 option years to Wackenhut Corrections Corporation (now the GEO Group).
Evaluating costs at TCI
The first 5 years of the GEO contract were treated as a “demonstration project.” The task of evaluating the outcome of this project was undertaken in stages. In September 1999, the National Institute of Justice (NIJ) announced that Abt Associates of Cambridge, Massachusetts had won the competition for a contract to analyze the cost and quality of the services provided by GEO during the first five years of the contract.
The BOP itself commissioned a series of shorter, more focused reports comparing both the cost and quality of publicly and privately managed federal prisons.4 In August 2005, the BOP contracted with the CNA Corporation to provide a synthesis of the cost analyses found in these earlier studies. The BOP also produced a report evaluating GEO’s performance.5
This report compares both the expected and the actual cost of using private management at TCI with estimates of what the government would have spent to operate the facility itself. These “in-house” cost estimates were based on staffing practices in use at comparable BOP facilities during the first year of the TCI contract.
3 RFP PCC-0001, dated November 27, 1996. 4 USDOJ/BOP/ORE (2004), Nelson (1999) and Nelson (2005). 5 USDOJ/BOP/ORE (2005).

7
An overview of our approach
Our evaluation of TCI proceeds as follows. In Chapter 2, we use the bid submitted by GEO to define the expected cost of contract operations. To estimate the amount that the BOP would have spent to operate TCI itself, we use a modified version of the methodology outlined in Circular A-76 along with BOP staffing information from FY 1998—i.e., the information available at the beginning of the contract.
To define the scope of costs in each estimate, we consider the impact of each option on the overall federal budget. We treat as relevant only those expenditures which were expected to change as a result of the contract. Specifically, we compare the costs which the BOP expected to incur under contractor management (i.e., monitoring costs and contract payments) with an estimate of the cost which the BOP avoided by using private sector management (i.e., the cost the BOP would have incurred if it had managed TCI itself).
In Chapter 3, we use this model with actual (rather than expected) wage rates, inflation rates, and inmate population levels. In Chapter 4, we examine operations at TCI and three comparison facilities in light of staffing and cost reports at older and smaller low-security BOP institutions. We find that costs are higher at the other institutions.
In the final chapter of this report, we expand our analysis to include activation expenses for TCI. When we compare expenditures over the full 5 years of the TCI demonstration project on a present value basis, we find no significant difference in the cost of public and private sector operations at the facilities reviewed: The present value of our estimate for costs avoided by using private sector management was 2.6 percent higher than the present value of the costs attributable to the TCI contract.
We were also able to identify several sources of the cost difference. We find that the cost of routine operation was remarkably similar at government and contract prison facilities. There were, however, three other sources of potential savings:

8
• Reductions in centralized support costs
• Reductions in the cost of facility activation
• The general discipline—for both private and public sector managers—attributable to the on-going competition among service-providers.
The BOP’s experience with TCI and the three comparable public facilities provides an opportunity to examine the cost of private and public sector service-providers over a span of years. On-going comparisons of this nature have the potential to encourage fiscal responsibility – the effective and efficient use of available resources. The task ahead will be to continue the process that has been started.
9
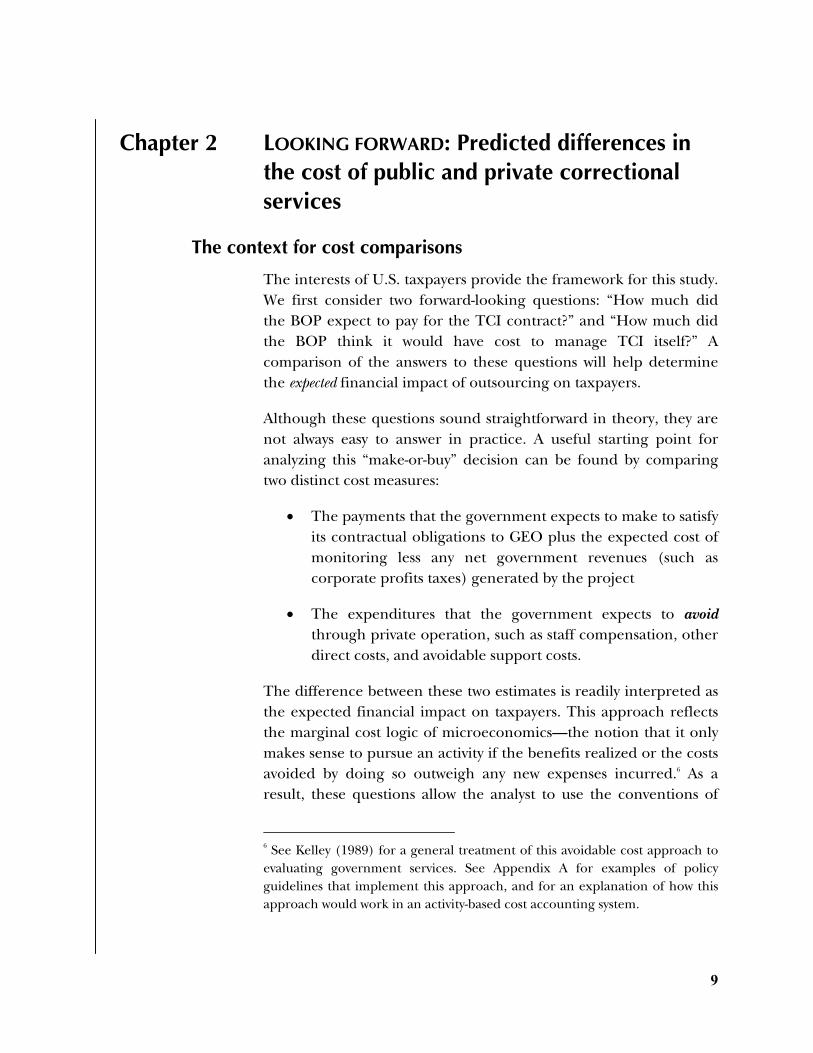
Chapter 2 LOOKING FORWARD: Predicted differences in the cost of public and private correctional services
The context for cost comparisons
The interests of U.S. taxpayers provide the framework for this study. We first consider two forward-looking questions: “How much did the BOP expect to pay for the TCI contract?” and “How much did the BOP think it would have cost to manage TCI itself?” A comparison of the answers to these questions will help determine the expected financial impact of outsourcing on taxpayers.
Although these questions sound straightforward in theory, they are not always easy to answer in practice. A useful starting point for analyzing this “make-or-buy” decision can be found by comparing two distinct cost measures:
• The payments that the government expects to make to satisfy its contractual obligations to GEO plus the expected cost of monitoring less any net government revenues (such as corporate profits taxes) generated by the project
• The expenditures that the government expects to avoid through private operation, such as staff compensation, other direct costs, and avoidable support costs.
The difference between these two estimates is readily interpreted as the expected financial impact on taxpayers. This approach reflects the marginal cost logic of microeconomics—the notion that it only makes sense to pursue an activity if the benefits realized or the costs avoided by doing so outweigh any new expenses incurred.6 As a result, these questions allow the analyst to use the conventions of
6 See Kelley (1989) for a general treatment of this avoidable cost approach to evaluating government services. See Appendix A for examples of policy guidelines that implement this approach, and for an explanation of how this approach would work in an activity-based cost accounting system.

10
economic theory to evaluate the financial impact of the TCI demonstration project.
The first of these cost measures illustrates one of the benefits of this approach to “make-or-buy” decisions: It requires relatively little information about the contractor’s internal costs and profit rates. In other words, the size of GEO’s profit (or loss) has no relevance to the evaluation of its performance as the TCI contractor as long as the company provides the services promised in the contract. Such information has no bearing on the government’s anticipated expenditures on either contract fees or monitoring. And because government expenditures alone determine the bill ultimately paid by taxpayers, the analyst can ignore the details of the contractor’s internal operations—to the extent that they are not directly linked to the quality of the service provided.
The second of these cost measures highlights an important issue to be resolved when using such an approach to evaluate TCI: The in-house cost measure requires the analyst to construct a detailed alternative scenario, one in which the government “makes” the service in-house. To estimate these hypothetical costs, the analyst must choose both the appropriate set of costs to measure and the best available method of putting this decision into practice. In the case of TCI, this task was easier than it might have been since the BOP operated three federal facilities that were virtually identical to TCI. Nevertheless, a number of adjustments were needed before any conclusions could be drawn from public-private comparisons.
The mechanics of cost predictions
Unadjusted raw data rarely support direct comparisons of facility operating costs—even when similar public and private facilities are in operation at the same time. Table 1 lists the raw data available from four similar prisons at the end of FY 1998. At that time, TCI was “ramping up” to full-scale operations. The other three facilities were owned and operated by the BOP: Forrest City, Arkansas; Yazoo City, Mississippi; and Elkton, Ohio. The three BOP prisons had essentially the same physical lay-out as Taft, but they had been open a few months longer and were therefore operating closer to capacity.

11
Table 1. FY 1998 obligations
Taft
(GEO mgmt.)Forrest City
(BOP mgmt.)Yazoo City
(BOP mgmt.) Elkton
(BOP mgmt.) Contract fees
$28,574,643
Monitoring
$618,691
BOP operating costs
$21,177,267
$20,576,692
$23,989,298
Annual support
$3,457,161
$2,507,883
$2,436,761
$2,840,893
Total reported cost
$32,650,495
$23,685,150
$23,013,453
$26,830,191
Average daily population, 1998
1,092
1,566
1,538
1,697
The data in Table 1 help identify the adjustments needed before consistent comparisons can be made. These include:
• Allowances for differences in inmate population
• Adjustments to ensure that all direct costs are captured in both scenarios
• Adjustments to ensure that support cost estimates reflect an avoidable cost approach to project evaluation
• Adjustments for “deobligated” funds and contract modifications.7
OMB Circular A-76 provides a detailed set of costing instructions that are aimed at ensuring that the total or “full” cost to the government of both the in-house and contract provision of services is estimated appropriately. We use a modified version of this approach in order to capture the net taxpayer impact of using private management at TCI. We start by computing the constant-
7 Federal budgeting practices require agencies to “obligate” more money than is likely to be expended on this type of contract. As a result, funds will be “deobligated” if the contractor is awarded less than the maximum possible award fee bonus or if contractor profits from inmate phone calls are deducted from monthly payments. The contract value may also be increased through a formal modification to allow for unforeseen expenses such as inmate burial costs or wage increases mandated by the Service Contract Act (41 USC 351).

12
dollar long-run cost per inmate-day for both scenarios at the facility level. (We defer our discussion of inflation adjustments and activation costs to later chapters.)
In the remainder of this chapter, we describe the expected cost of contract operations at TCI once the facility has been fully activated. We then review the components of the estimated cost for in-house operations given the same inmate population. In each scenario, there are two sets of cost estimates to identify: the direct cost of operations and the indirect cost of supporting the activity. We use the cost parameters specified in Circular A-76 as the starting point for our analysis and discuss the extent to which these guidelines are consistent with an avoidable cost methodology.
Private facility predictions
To begin, we compute the constant dollar cost of contract operations using information available at the end of FY 1998. The fixed price structure of the contract between GEO and the Bureau of Prisons indicates the nature of the assumptions and adjustments required. The contract provided for:
• A fixed monthly fee of $2,303,499.72 as long as the average daily inmate population remained at or below 1,946 inmates
• An additional fee of $5.58 per inmate per day when the average daily population exceeded 1,946.8
For consistency, the cost of contract and in-house operations should be computed using the same number of inmates. Given the structure of the contract, it makes sense to assume an average daily population (ADP) of at least 1,946 inmates—to do otherwise would
8 An inflation adjustment was scheduled for the option years of the contract: Both the fixed monthly fee and the added fee per inmate-day were expected to increase in the fourth year of the contract. Because this initial public-private comparison uses 1998 prices (i.e., eliminates expected inflation), we can ignore these future price increases at this stage. They will be revisited in a later chapter.

13
overstate the cost of the GEO contract. Because population levels observed in 1998 fall short of 1,946 at all four facilities, it makes sense to stay relatively close to this minimum ADP to avoid extrapolation errors. For the purposes of this analysis, we compute contract and monitoring expenditures at TCI assuming an average daily population of 1,946 inmates. As a result, we expect gross payments to be $2,303,499.72 per month or $27,641,997 annually.
Several other assumptions are needed to complete this estimate. To avoid any appearance of favoritism, we assume that GEO received neither award fee bonuses nor performance penalties. This approach is consistent with adequate fulfillment of the terms of the contract.
Circular A-76 authorizes contract monitoring costs equal to ten government positions for a contract of this size. Because observed monitoring costs at TCI were lower than this amount, we use $618,691, the monitoring expenditure reported for 1998.
Circular A-76 stipulates that revenues generated from corporate profits taxes and/or the sale of government assets are to be credited against the cost of contractor payments. To compute the credit for tax revenues, we use the OMB rate to compute the income tax credit for a “miscellaneous services” company and reduce by 0.5 percent the expected net cost to the government of contractor fees.
Although the TCI contract did not involve a sale or transfer of assets, routine operations did generate revenues in the form of profits from inmate phone calls and commissary purchases. Since these revenues were retained by GEO, the BOP deducted an off-setting amount from its monthly payments to the contractor. Because the BOP does not report these revenues at the facility level for its own institutions, we compute the expected credit from the experience of TCI during early years of the contract. Phone fee rebates averaged $50,000 per month during the first 2 years of the project. We therefore reduce expected annual contract expenses (i.e., the net amount paid to GEO by the federal government) by $600,000.
Table 2 combines these estimates and presents the expected direct contract cost in FY 1998 prices. The per diem cost of $38.75

14
represents the expected direct cost per inmate-day once the facility was fully activated. We defer our discussion of support costs and activation expenditures to a later section.
Table 2. Expected direct contract cost, FY 1998 prices Expected contract fees $27,641,997Monitoring costs $618,691Phone fees -$600,000Corporate profits taxes -$138,210
$27,522,478Per diem, ADP = 1,946 $38.75
Public facility predictions
We now estimate the cost of running a comparable BOP facility. This cost would include annual operating costs for 1,946 inmates, as well as the avoidable portion of annual BOP support costs.9 The major components of operating cost are staff compensation and direct costs such as equipment, supplies, and services.
Expected staffing costs
To develop our in-house estimate, we start with the cost of government employees. Circular A-76 requires the government to create a staffing plan to serve as the basis for an in-house cost bid. Because the TCI contract was awarded through a “private-private” competition (with no public sector bid), the actual staffing plans at comparable BOP facilities were used to develop a hypothetical in-house bid.
Staffing patterns: Table 3 presents the staffing patterns used at the three comparison facilities in March 1999. The number of full-time employees are reported by grade for each facility.
9 The unavoidable portion of BOP support cost is by definition a government expense no matter who manages the Taft facility. Because choice of facility management has no impact on the unavoidable cost of the system as a whole, these costs should be excluded from any attempt to calculate the potential cost savings from outsourcing.

15
Table 3. BOP staffing patterns, March 1999 Grade Grade Grade Grade Grade Grade Grade Grade Grade Grade Grade Grade Grade Grade 2 3 4 5 6 7 8 9 10 11 12 13 14 15 Total
Elkton GS 0 0 0 4 44 64 41 46 2 49 24 4 2 3 283WS 0 0 6 4 1 1 21 4 0 0 0 0 2 0 39
Total FTEs 322Forrest City GS 0 0 0 11 46 50 41 37 5 39 20 4 2 2 257WS 0 7 0 3 1 2 29 4 1 0 0 0 1 0 48
Total FTEs 305Yazoo City GS 1 0 0 16 36 46 44 30 1 45 19 3 2 2 245WS 0 0 9 1 1 5 17 4 0 0 0 0 1 0 38
Total FTEs 283
The staffing plan proposed by GEO in its original bid to manage TCI provides another reference point. Table 4 indicates the number of full-time equivalent (FTE) employees specified, with GEO job titles converted into GS and WS grades using typical grades for the BOP staff who hold the corresponding positions at BOP facilities.
Table 4. GEO staffing pattern (specified in original bid)
Grade
Grade
Grade
Grade
Grade
Grade
Grade
Grade
Grade
Grade
Grade
Grade
Grade
Grade
2 3 4 5 6 7 8 9 10 11 12 13 14 15 Total GS
0
0
0
0
13.2
165.25
10.8
64.6
11.2
57.4
21.5
3
2
3
351.95
WS
0
0
4
1
2
2 16.6
1
1
1
0
0
1
0
29.6
TOTAL FTES 381.55
An initial comparison of Table 3 and Table 4 reveals a significant difference in the two staffing models: There are 60 more staff members at the GEO facility than at any of the three comparison sites. The difference in these two models persists even when staffing patterns are adjusted for minor variations in the way staff assigned to the facility are counted. (See Table 7 below.) In general, there are more staff members at the lowest grades in the GEO model. However, some of these discrepancies shrink when allowances are

16
made for the authorized vacancy rate at Taft: The contract stipulated that GEO could remain in compliance as long as its vacancy rate was at or below 10 percent. (We will return to these staffing pattern differences in a later section.)
Staff salaries and benefits: Defining appropriate staff compensation rates is the next step in estimating the cost of BOP prison operations. Tables 5 and 6 provide the annual rates computed by the method spelled out in OMB Circular A-76. The relevant salary schedules are those published for 1997 and 1998 for federal law enforcement officers in “the rest of the U.S.” (the Taft facility is not located within the bounds of an area having a separate “locality rate” or cost-of-living adjustment). Because the GEO contract ran from August of one year to July of the next year, the labor rates for a given contract year would necessarily be a weighted average of the annual schedules for the years in question.
Following the A-76 guidelines for GS employees, we took the base salary for “step 5” in each of the 2 years as a starting point. The base salary rate reported below assumes that the staff was paid at the 1997 rate for 4 months and the 1998 rate for the remaining 8 months. We then computed benefits using the percentage add-ons specified in Circular A-76 for federal law enforcement personnel.

17
Table 5. Blended GS locality rates—law enforcement staff in the “rest of the U.S.,” 1997 and 1998
Blended
Retirement
Insurance
Medicare
Misc.
Annual
Grade &step base rate 37.70% 5.60% 1.45% 1.70% total GS-1, Step 5 15,336 5,782 859 222 261 $22,459 GS-2, Step 5 16,694 6,294 935 242 284 $24,448 GS-3, Step 5 22,138 8,346 1,240 321 376 $32,422 GS-4, Step 5 24,854 9,370 1,392 360 423 $36,399 GS-5, Step 5 28,504 10,746 1,596 413 485 $41,744 GS-6, Step 5 30,217 11,392 1,692 438 514 $44,253 GS-7, Step 5 32,716 12,334 1,832 474 556 $47,912 GS-8, Step 5 34,329 12,942 1,922 498 584 $50,275 GS-9, Step 5 36,866 13,898 2,064 535 627 $53,990 GS-10, Step 5 40,598 15,305 2,273 589 690 $59,455 GS-11, Step 5 43,328 16,335 2,426 628 737 $63,454 GS-12, Step 5 51,931 19,578 2,908 753 883 $76,053 GS-13, Step 5 61,752 23,281 3,458 895 1,050 $90,436 GS-14, Step 5 72,973 27,511 4,086 1,058 1,241 $106,868 GS-15, Step 5 85,838 32,361 4,807 1,245 1,459 $125,710
For WS personnel, we used the 1997–1998 WS hourly rate for Fresno, California, as a starting point. (This is the locality pay schedule that would have been used to determine the pay of WS staff at TCI.) Because the WS schedules run from the end of April to the end March in the following year, the relevant base pay rate is again a weighted average. We computed the annual WS “base pay” rate by assuming that WS staff members are paid for 2,087 hours per year and that they worked 8 months at 1997 rates and 4 months at 1998 rates. Again, we computed total annual compensation by using the percentage add-ons specified in Circular A-76 for law enforcement personnel.

18
Table 6. Blended WS locality rates—“rest of the U.S.”, 1997–1998
Blended
Retirement
Insurance
Medicare
Misc.
Annual
Grade & step base rate 37.70% 5.60% 1.45% 1.70% total WS-1, Step 4 28,919 10,902 1,619 419 492 $42,352 WS-2, Step 4 30,839 11,626 1,727 447 524 $45,164 WS-3, Step 4 32,766 12,353 1,835 475 557 $47,986 WS-4, Step 4 34,672 13,071 1,942 503 589 $50,777 WS-5, Step 4 36,599 13,798 2,050 531 622 $53,599 WS-6, Step 4 38,449 14,495 2,153 558 654 $56,309 WS-7, Step 4 40,265 15,180 2,255 584 685 $58,968 WS-8, Step 4 42,025 15,844 2,353 609 714 $61,546 WS-9, Step 4 43,757 16,497 2,450 634 744 $64,083
WS-10, Step 4 45,511 17,157 2,549 660 774 $66,650 WS-11, Step 4 46,860 17,666 2,624 679 797 $68,627 WS-12, Step 4 48,523 18,293 2,717 704 825 $71,062 WS-13, Step 4 50,617 19,082 2,835 734 860 $74,128 WS-14, Step 4 53,058 20,003 2,971 769 902 $77,704 WS-15, Step 4 55,779 21,029 3,124 809 948 $81,688
Final computation of in-house staffing costs requires (1) that a choice be made among the BOP staffing models listed in Table 3 and Table 4, and (2) that adjustments be made for differences in the types of staff who count as assigned to the facility. In an effort not to underestimate the number of staff members that the BOP would have assigned to Taft, we chose the Elkton staffing pattern as a starting point—among the three BOP facilities studied, Elkton had the largest staff. We then made the following adjustments to the Elkton staffing pattern:
• We deleted the 15 staff positions assigned to UNICOR operations at Elkton because the GEO staffing plan does not include the comparable positions at Taft.10
10 There was a UNICOR factory at Taft during part of the demonstration project, but it was staffed by BOP employees. Because these federal employees would be at Taft no matter who managed the prison facility, these positions do not represent a cost that the BOP can avoid through privatization. Because we are trying to identify avoidable Taft costs by looking at comparable BOP institutions, it is appropriate to exclude the UNICOR positions at Elkton from the analysis performed in this study.

19
• We added the appropriate set of Public Health Service (PHS) positions to the Elkton staffing pattern because these individuals were not counted in the original BOP count.
• We added six positions to the Elkton pattern to reflect the change in current staffing that would be necessary if the Elkton camp housed the same number of inmates as the comparable facility at Taft.11
Table 7. Expected cost of government salaries and benefits Positions Compensation
Reported BOP staffing 322 $18,069,881 Less UNICOR positions (15) ($861,459)Plus PHS 5 $334,349 Plus full camp 6 $309,092
Total, BOP staffing model 318 $17,851,863
Geo staffing model 381.55 $21,123,811
Other staff costs: Circular A-76 also requires the analyst to estimate the cost of employee overtime and personnel liability insurance. We use average overtime expenses at BOP low security facilities to estimate the former cost.12 To estimate the expected cost of self-insuring against personnel liabilities, we use the OMB cost factor of 0.7 percent of staff compensation costs. Table 8 lists the combined results of these adjustments for the two distinct staffing plans identified in Table 7.
11 This adjustment for expanded camp staffing reflects the comments of John LaManna, warden of FCI Elkton. 12 In FY 1998, overtime averaged 8 percent of base pay at 14 minimum security BOP facilities. To compute the expected overtime (or “premium pay”) expenses, we apply this rate to the cost of base salaries, wages, and social security benefits.

20
Table 8. Expected labor cost of government employees, FY 1997–1998 blended salaries BOP model GEO model Staff compensation $17,851,863 $21,123,811 Overtime $1,045,496 $1,237,118 Personnel liability $124,963 $147,867 $19,022,323 $22,508,796
Expected cost of inmate services
The cost of inmate services is another major component of prison operating costs. Table 9 reports this information for the relevant cost centers at each of the comparison facilities. In each case, FY 1998 expenditures per inmate per day on supplies and “other services” formed the basis of these calculations.13
Table 9. Cost of inmate services by facility Amount spent per inmate day on supplies & other services (FY 1998)
Elkton ($)
Forrest City ($)
Yazoo City ($)
Food & farm 2.63 2.65 2.14 Medical & PHS 2.36 1.78 1.87 Other services 0.49 0.52 0.49 Unit management 0.12 0.06 0.08 Gen. & occupational ed. 0.21 0.28 0.33 Leisure programs 0.12 0.11 0.10 Religious programs 0.06 0.04 0.03 Psychology programs 0.01 0.01 0.01 Total 6.00 5.46 5.05 Estimate used: 5.50
We used the average of these three per diem rates (i.e., $5.50) to compute the institution-level cost calculations for in-house operations. We assumed the average inmate population to be 1,946.
Note that the $5.50 estimate of BOP cost per day for inmate service costs corresponds closely to the adjustment factor of $5.58 built into
13 We used reported FY 1998 average daily inmate populations to compute the relevant number of inmate days.

21
the GEO contract for inmate population levels in excess of 1,946. This similarity indicates that the expected additional or “incremental” cost to the BOP of expanding Taft operations to 2,000 or even 2,100 inmates would be roughly the same under the GEO contract as at a hypothetical Taft facility operated by BOP employees. It follows that results comparing public and private management costs computed for inmate populations of 1,946 should be relatively “robust”—i.e., not sensitive to moderate changes in the scale of prisons operations. (We review the accuracy of these predictions in a later chapter.)
Other expected operating costs
A number of miscellaneous costs—such as travel, utilities, and equipment—constitute the final component of BOP prison operating costs. Table 10 lists the expenditures reported by the three comparison facilities for these items in FY 1998.
Table 10. Other direct costs, FY 1998 Amount spent per year on
Elkton ($)
Forrest City ($)
Yazoo City
($) Travel
246,861
233,329
259,756
Transportation
84,312
56,700
27,817 Utilities
1,459,808
942,611
984,655
Other admin services
253,863
211,135
186,631 Admin supplies
435,593
464,243
468,509
Equipment
81,501
16,581
8,023 Grants
2,905
11,218
13,690
Insurance claims
2,341
274
4,723 Interest
1,306
1,649
2,560
Total 2,568,490
1,937,740 1,956,365
Estimate used (average of Forrest City and Yazoo City):
1,947,052
It is immediately apparent that the other direct costs reported by Elkton exceed those reported by the other two facilities. A line-by-line comparison of the three reports reveals that expenditures on

22
utilities account for virtually all of this roughly $500,000 discrepancy—a cost difference attributable to the climate differences among the facilities.14 Because the Taft facility is located in southern California, it appeared likely in 1999 that utility costs at Taft would be closer to those of Forrest City and Yazoo City than to those of Elkton. (The accuracy of this prediction is discussed in a later section of this report.)
To calculate the appropriate level of miscellaneous expenditures for the hypothetical BOP operation of Taft, we assumed these “other direct costs” to be fixed or independent of small variations in inmate populations. We computed the “other operating costs” estimate reported below as the average of miscellaneous costs reported by Forrest City and Yazoo City.
Circular A-76 also provides a cost factor for expected casualty insurance expenses. The OMB guidelines specify an amount equal to 0.5 percent of the value of government-furnished property. However, this rate exceeds the amount generally charged to private corrections companies. Because these commercial insurance rates average between 0.1 and 0.3 percent, we split the difference and used a rate of 0.2 percent to estimate in-house self-insurance costs.15 The TCI contract required GEO to maintain insurance to cover at least $75 million in property damages. It follows that the expected casualty insurance expense would be $150,000 per year.
Expected operating costs compared
At this point, we can compare the expected facility-level cost of private operations with the expected facility-level cost of in-house operations. Table 11 summarizes our calculations thus far. When we look at facility operating costs alone, we do not predict that private management will save money in the long run. The expected facility-level cost per inmate-day is higher with contractor management than with
14 This assumption is based on conversations with Warden LaManna at the Elkton facility. 15 See the discussion of the insurance cost of in-house operations in Abt (2005).

23
in-house management given an inmate population of 1,946 and given the BOP’s proposed staffing plan.
Table 11. Operating cost comparison, FY 1998 prices
Contract
expenses ($)
In-house expenses,
BOP model ($) Expected contract fees 27,641,997 Monitoring costs 618,691 Phone fees -600,000 Corporate profits taxes -138,210 Staff compensation 17,851,863 Overtime 1,045,496 Personnel liability 124,963 Inmate services 3,906,595 Other reported direct costs 1,947,052 Casualty insurance 150,000
Total: 27,522,478 25,025,970 Per diem, ADP=1,046 38.75 35.23
There are obvious qualifications to this result:
• These estimates of in-house expenses do not include “support” or “overhead” costs.
• These estimates do not include activation expenses.
• These estimates may not be consistent with future observations.
In the next section, we address the issue of support costs and defer the remaining questions for later chapters.
Support costs, avoidable and otherwise
Within the BOP cost accounting system, the term “support costs” refers to a set of common or joint expenditures that are budgeted and tracked centrally. Many of these support expenditures—such as central office costs—benefit all BOP facilities, both publicly- and privately-managed. As a result, these costs are essentially independent of outsourcing—they are the same whether GEO runs

24
Taft as a BOP contractor or the BOP runs Taft directly on its own behalf.
On the other hand, some support costs are genuinely avoidable through private management. For example, staff training is primarily the responsibility of whoever operates the Taft facility. If Taft is run by GEO, then the BOP can avoid a significant portion of the training cost that it would incur if it operated Taft directly.
Economic analysis tells us that only the avoidable portion of support costs is relevant to outsourcing decisions. Support costs that remain unchanged whether a service is outsourced or not are irrelevant to the analysis at hand and can be safely ignored.16 In the analysis that follows, we work to identify the avoidable component of BOP support costs.
Evaluating BOP support expenditures
The four major categories of BOP support costs are training, regional office costs, national programs, and central office costs. To calculate the relevant support costs for a hypothetical BOP facility, we must first determine which of these categories represent genuinely avoidable expenditures. By eliminating those that are independent of the decision to use private management, one is left with support costs that can reasonably be treated as avoidable.
For the purposes of this study, it is reasonable to assume that all regional and central office expenditures are unavoidable and can thus be ignored when evaluating the merits of outsourcing. Because training is primarily the responsibility of Taft management, all training expenditures have been classified as avoidable.17 Finally,
16 The process defined in OMB Circular A-76 is somewhat different: In public-private competitions conducted under these guidelines, a standard cost factor equal to 12 percent of direct labor costs is used as a proxy for general and administrative public sector costs. See Atkin et al. (2005) for a review of the debate over the treatment of overhead or support expenses in the A-76 guidelines. 17 This assumption favors the private management option because it probably overstates the true extent to which training costs can be avoided.

25
roughly half of national program expenditures have been classified as avoidable. Table 12 summarizes this breakdown. Appendix A contains a more detailed discussion of these distinctions.
Table 12. BOP support cost breakdown, FY 1998
Total support costs, FY 98
Avoidable support costs
Unavoidable support costs
Regional $51,358,354 $51,358,354Training $15,334,688 $15,334,688 Central office $81,736,375 $81,736,375National programs $115,312,279 $65,895,852 $49,416,427Total $263,741,695 $81,230,540 $182,511,156
Mark-up needed to allocate support cost: 11.84% 3.65% 8.19%
Public and private predictions once again
Preliminary results
We now combine the elements of our model for in-house operations18 and present our total cost estimates for in-house and contract operations. Table 13 summarizes our results based on information available in 1999. When compared on an avoidable cost basis, in-house operations are predicted to be cheaper than contract operations once the facilities are fully activated. The same result is obtained when the estimates for public and private operations are compared on a total cost basis.19
18 As mentioned above, we use observed staffing at Elkton to define the staffing plan for Taft, i.e., the staffing level that would have been adopted if Taft had been managed by the BOP. 19 As mentioned above, we follow accounting conventions at the BOP, and assign support costs (both avoidable and otherwise) to individual facilities in proportion to reported operating (or direct) cost. As a result, facilities with higher operating costs also have higher support costs. Since predicted operating costs are higher with contract management at TCI, the unavoidable support costs assigned to this option are also higher. Assigning the same
(continued from previous page)

26
Table 13. Total cost estimates for in-house and contract operations (FY 1998 prices)
Contract In-house expenses, expenses ($) BOP model ($)
Expected contract fees 27,641,997 Monitoring costs 618,691 Phone fees (600,000) Corporate profits taxes (138,210) Staff compensation 17,851,863
Overtime 1,045,496
Personnel liability 124,963
Inmate services 3,906,595
Other reported direct costs 1,947,052 Casualty insurance 150,000
Total facility-level costs: 27,522,478 25,025,970 Per diem, ADP = 1,946 38.75 35.23
Avoidable support cost 913,448
Total avoidable cost 27,522,478 5,939,418 Per diem, ADP = 1,946 38.75 36.52
Unavoidable support cost 2,254,091 2,049,627
Total cost 29,776,569 27,989,045 Per diem, ADP = 1,946 41.92 39.41
Remaining questions
Examining this result in greater detail allows us to identify relevant cost drivers for both public and private sector operations. In the next chapter, we test the predictions of this ex ante in-house model against the results reported by a variety of low security institutions during the first five years of the TCI contract.
absolute amount of unavoidable cost to both estimates would not change the result.

27
Chapter 3 ON-GOING ACTIVITY: Competing public and private facilities in operation
By 1999, TCI and the three BOP comparison facilities were fully activated. During the next 4 years, these facilities evolved and expanded. In this chapter, we compare our initial predictions with actual expenditures reported by these facilities for this time period. These comparisons will illustrate the sensitivity of results to assumptions made about the number and type of inmates housed and the extent of adjustments for inflation.
We first review the scale of operations at each of the four facilities—as measured by their respective average daily populations. We then present the following cost estimates:
• Expected expenditures at TCI using observed TCI population data and the original terms of the contract
• Observed expenditures at TCI
• Expected in-house expenditures using our observed ex ante in-house model (with observed TCI population data, observed government wage data and observed inflation rates)
• Observed expenditures at BOP comparison sites
• Expected in-house expenditures using populations observed at BOP comparison sites and our ex ante in-house model
• Expected in-house expenditures using TCI population data and an in-house model updated to reflect experience at other BOP institutions during first five years of the project.
After analyzing estimates based on our initial in-house model, we find that:

28
• Observed contract per diem costs exceeded estimates of in-house per diem costs based on observed wages and inflation rates.
• Observed contract per diem costs exceeded expected contract costs, largely due to award fee bonus payments and reimbursements for wage increases mandated by Service Contract Act revisions.
• In-house cost estimates based on observed wages and inflation rates exceeded expected contract costs, largely due to the more frequent cost-of-living and inflation adjustments built into the in-house cost model.
• Observed per diem costs with contractor management were not significantly different from observed facility-level per diem costs at BOP comparison sites, thus supporting the finding in the previous chapter that outsourcing did not result in lower per diem direct costs at TCI.
• Observed per diem costs with contractor management were slightly lower than observed per diem avoidable costs at BOP facilities during the first 2 years of full-scale operations.
• In later years, observed per diem contract costs were comparable to observed per diem avoidable in-house costs once allowances were made for changes in the mix of security levels in the inmate population.
• The in-house model developed in the previous chapter over-estimated per diem costs for the two BOP institutions that maintained minimum security camps; the model under-estimated costs for the BOP institution that had its camp up-graded from minimum to low security.
In general, on the basis of our FY 1998 model we found little evidence that per diem costs at contract facilities were significantly different from avoidable costs at similar in-house facilities:
29
• Estimates of avoidable in-house per diem costs were no higher than those observed at the contract facility.
• Avoidable per diem costs observed at the BOP facilities with minimum security camps were comparable to those observed at the contract facility.
When we updated the original model in light of more recent experience, we again found little evidence of significant cost differences: The estimated avoidable cost of in-house operations was lower than the observed cost of contract operations in 2 out of 4 years.
Inmate populations served
Figure 1 illustrates the growth in the population at TCI and the three comparison facilities over the period FY 1998 through FY 2002: The graph illustrates general trends, and the table provides the institution-specific details. The data are taken from the annual per diem reports for all BOP facilities.
The average daily population in these four facilities grew at different rates at different points in time. The population at TCI increased dramatically during FY 1998 as the institution finished its initial “ramp-up” period. The average daily population at TCI reached a maximum of 2,379 in FY 2000 and tapered off very slightly in the 2 subsequent years.
The average daily population at Elkton (the first of the three BOP comparison facilities to include a minimum security camp) was initially below that of TCI but had reached the same level as TCI by FY 2001. Both TCI and Elkton had an average daily population of about 2,340 in FY 2002. The inmate populations at Forrest City and Yazoo City grew most rapidly during FY 1998 and FY 1999 as camps were opened and filled. The population at Yazoo City grew more slowly over the period FY 2000 through FY 2002, whereas the population at Forrest City declined slightly. By FY 2002, the inmate populations at Forrest City and Yazoo City were virtually the same—an average of 2,026—and were smaller than the population at Elkton by about 300 inmates.

30
Figure 1. Average daily inmate population
Elkton
Forrest City
Yazoo City
Taft
1,000
1,500
2,000
2,500
Elkton 1,697 2,013 2,238 2,395 2,335
Forrest City 1,566 1,780 2,085 2,044 2,018
Yazoo City 1,538 1,649 1,880 1,922 2,034
Taft 1,091 2,230 2,379 2,374 2,343
1998 1999 2000 2001 2002

31
Figure 2 provides a more detailed comparison of the sources of inmate population growth at the three BOP comparison institutions. Starting in FY 2000, much of the increase in the size of the inmate population at Forrest City and Yazoo City was due to the addition of minimum security camp facilities. This means that although these two facilities will eventually gain the cost advantages of a larger scale of operations, they must (in the short run) bear the cost of hiring new staff in advance of having new facilities filled to capacity.
During this period, there were changes in both the number and types of inmates housed at Elkton. The camp at Elkton was used more intensively: After it was upgraded to a satellite low (SATLOW) security facility, the original minimum security inmates were replaced by a larger number of higher risk individuals. This change will ultimately have two offsetting effects on per diem costs: Although Elkton gained scale economies attributable to an expanded scale of operation, it also had to absorb the higher cost of increased security at its satellite facility.

32
Figure 2. Security levels at comparison sites, FY 1999–2002
130
53
221
226
218
65
503
381
264
386
0 500 1000 1500 2000 2500
FY02
FY01
FY00
FY99
FY02
FY01
FY00
FY99
FY02
FY01
FY00
FY99
Yaz
oo C
ityFo
rres
t City
Elk
ton
Average Daily Populationcamp satlow low

33
Predicted and observed contract costs in the private facility
In this section, we compare the contract costs predicted by the model developed in the previous chapter with the contract expenditures observed during the first five years of the TCI contract.
Predicted expenditures at TCI
To compute the anticipated total annual contract expenditures, we use the payment schedule specified in the original TCI contract and make allowances for differences in inmate population. To estimate phone fee profits and corporate profits tax credits, we use the conventions discussed in the previous chapter (see the discussion of Table 2 above). To compute per diem costs, we use observed TCI population levels for each of the years FY 1999 through FY 2002. Finally, we assume that there were no avoidable BOP support or overhead costs for this contracting scenario. The results of this analysis are presented in the top half of Table 14.
Observed expenditures at TCI
To allow for differences in accounting conventions between GEO and the BOP, we use net payment data prepared by GEO to compute observed costs. (These payments include the net value of contract modifications for award fee bonuses and penalties, Service Contract Act wage changes, and phone profit deductions.)
To compute government monitoring expenditures in this scenario, we rely on the government’s financial management system. We again use the approach described in the last chapter to estimate corporate profits tax credits and assume that there are no avoidable costs in this scenario. The results of these computations are presented in the lower half of Table 14.

34
Table 14. Predicted and observed contract costs (current dollars) Predicted cost of contract operations, current year prices Base contract 1999 2000 2001 2002 Population at TCI 1,946 2,230 2,379 2,374 2,343 Gross payments to contractor $27,641,997 $27,643,582 $27,644,413 $29,473,826 $29,915,753Monitoring costs $618,691 $618,691 $618,691 $618,691 $618,691Phone profit adjustment -$600,000 -$600,000 -$600,000 -$600,000 -$600,000Corp. profit tax credit -$138,210 -$138,218 -$138,222 -$147,369 -$149,579Total predicted avoidable cost $27,522,478 $27,524,055 $27,524,882 $29,345,148 $29,784,866Per diem $38.75 $33.82 $31.61 $33.87 $34.83
Unavoidable overhead $2,254,091 $1,889,332 $2,214,347 $2,286,610 $2,244,777Total contract cost $29,776,569 $29,413,387 $29,739,229 $31,631,758 $32,029,643Per diem $41.92 $36.14 $34.25 $36.50 $37.45
Observed cost of contract operations, current year prices Base contract 1999 2000 2001 2002 Population at TCI 1,946 2,230 2,379 2,374 2,343 Net payments to contractor $27,041,997 $27,576,105 $28,618,490 $31,685,186 $32,770,472Monitoring costs $618,691 $580,857 $441,183 $566,014 $418,596Fed. tax credit -$138,210 -$137,881 -$143,092 -$158,426 -$163,852Total avoidable contract cost $27,522,478 $28,019,081 $28,916,581 $32,092,774 $33,025,216Per diem $38.75 $34.42 $33.21 $37.04 $38.62
Unavoidable overhead $2,254,091 $1,889,332 $2,214,347 $2,286,610 $2,244,777Total contract cost $29,776,569 $29,908,413 $31,130,928 $34,379,384 $35,269,993Per diem $41.92 $36.74 $35.85 $39.68 $41.24
Combining these estimates reveals an important result:
• The per diem cost observed during the first five years consistently exceeds the contract rate predicted by the model developed in the previous chapter.
This difference is particularly dramatic in the later years of the project. For example, the model predicts a contract cost of $34.83 per inmate-day given the average daily population observed in FY 2002. However, the average expenditure per inmate-day amounted to $38.62.
There are a number of explanations for this difference. For example, the initial model did not include allowances for award fee

35
bonus payments or fee increases to offset changes in the Service Contract Act wage rates. The initial fee structure was also developed for a somewhat smaller inmate population. In the next section, we will compare these two estimates with the predicted cost of in-house management at TCI.
Predicted in-house costs: the in-house model revisited
To estimate the predicted cost of in-house operations over the first five years of the project, we used the in-house model developed in the previous chapter. We started with the Elkton staffing plan described above. Because both GS and WS pay schedules change annually in the middle of the contract year, we again used the “blended” wage and salary rates described in the previous chapter. In other words, the wage rates used in any given year represent an average of the two schedules in force during that year.
To estimate the predicted cost of inmate services and other direct costs, we used the costs presented in Table 13. To allow for annual price increases in the cost of these goods and services, we used the observed change in the consumer price index reported for urban wage earners.
The sum of these personnel, materials, and insurance costs provided our estimate of the total predicted cost of operations at the facility level. We computed per diem facility-level costs using the inmate population levels actually observed at TCI.
To compute the predicted level of avoidable costs, we needed to allow for the impact of private management on BOP support costs. To do so, we first identified the share of BOP support costs that would probably be avoided by outsourcing. We then used this share to “pro-rate” the general support cost multiplier used each year to define the total cost of operations at each BOP facility. 20
Table 15 summarizes the results of these calculations. As with contract cost estimates, we see that the predicted per diem cost of in-house operations fell as the population grew. 20 These calculations are discussed in detail in appendix D.

36
Table 15. Predicted expenditures for in-house operations 1998 model 1999 2000 2001 2002 Population (based on TCI ADP) 1,946 2,230 2,379 2,374 2,343 Staff salary & benefits $17,851,863 $18,559,546 $19,429,989 $20,123,640 $21,033,228Premium compensation $1,045,496 $1,086,942 $1,137,919 $1,178,543 $1,231,813Personnel liability $124,963 $129,917 $136,010 $140,865 $147,233Total personnel cost $19,022,322 $19,776,405 $20,703,918 $21,443,048 $22,412,274Annual wage adjustment 3.54% 4.69% 3.57% 4.52% Inmate services $3,906,595 $4,574,765 $5,050,761 $5,177,237 $5,180,145Annual Inflation adjustment 2.19% 3.49% 2.72% 1.38% Other direct costs $1,947,052 $1,989,692 $2,059,133 $2,115,141 $2,144,330Casualty insurance $150,000 $153,285 $158,635 $162,950 $165,198Annual Inflation adjustment 2.19% 3.49% 2.72% 1.38% Total facility-level cost $25,025,969 $26,494,147 $27,972,446 $28,898,376 $29,901,947Per diem $35.23 $32.55 $32.13 $33.35 $34.97 Avoidable overhead $913,448 $1,382,994 $1,090,925 $1,046,121 $1,040,588Total avoidable in-house cost $25,939,417 $27,877,142 $29,063,371 $29,944,497 $30,942,535Per diem $36.52 $34.25 $33.38 $34.56 $36.18
Unavoidable overhead $2,049,627 $1,777,757 $2,131,500 $2,048,895 $2,048,283Total cost $27,989,044 $29,654,899 $31,194,872 $31,993,392 $32,990,818Per diem $39.41 $36.43 $35.83 $36.92 $38.58
Figure 3 combines the cost predictions reported above for contract and in-house operations. (To highlight the differences among the estimates, the cost axis is truncated at $30.)

37
Figure 3. Predicted contract and avoidable in-house costs compared with observed contract costs
Predicted in-housecost
Predicted ContractCost
Observed contract cost
$30.00
$31.00
$32.00
$33.00
$34.00
$35.00
$36.00
$37.00
$38.00
$39.00
$40.00
predicted in-house $34.25 $33.38 $34.56 $36.18
predicted contract $33.82 $31.61 $33.87 $34.83
observed contract $34.42 $33.21 $37.04 $38.62
1999 2000 2001 2002

38
We first note that the predicted per diem cost of contract operations is below that computed for in-house operations. This would appear to contradict our results in the previous chapter. However, closer examination reveals that observed contracting costs equal or exceed the per diem costs predicted for in-house operations. In other words, when we compare observed contracting costs with predictions from the in-house cost model, we do not find evidence of cost savings for fully activated facilities.
Nevertheless, an important question remains: “Would the BOP in fact have been able to achieve the in-house per diem cost levels predicted by our model?” To tackle this question, we turn to observed cost reports from comparison sites.
Observed costs at comparison BOP institutions
In this section, we discuss the facility-level and avoidable costs observed at the comparison facilities: Elkton, Forrest City, and Yazoo City. Specifically, we use expenditures reported by the BOP financial management system for each of the institutions in question and add in the avoidable portion of BOP support costs. To obtain the avoidable cost per inmate day, these cost estimates are divided by the number of inmate-days reported for each facility.
Facility-level costs observed at comparison sites
Facility-level costs at the BOP facilities include all expenditures from appropriated funds tracked at the facility level.21 (Facility-level cost reports do not include allowances for avoidable support expenditures; these will be discussed in the following section.)
21 Because Public Health Service staff working for the BOP are paid out of the BOP appropriation, these costs are included. In contrast, the cost of UNICOR staff and supplies are not included because they are paid out of the program’s sales revenue.

39
Figure 4. Reported facility-level per diem costs (excluding avoidable support costs)
Taft
$30.00
$31.00
$32.00
$33.00
$34.00
$35.00
$36.00
$37.00
$38.00
$39.00
$40.00
$41.00
Elkton $33.48 $33.52 $35.47 $39.30
Forrest City $33.54 $33.94 $36.02 $37.53
Yazoo City $35.01 $33.59 $35.95 $36.02
Taft $34.42 $33.21 $37.04 $38.62
1999 2000 2001 2002

40
As Figure 4 shows, the observed cost per inmate-day at TCI has been virtually identical to the average per diem cost observed at the three comparison facilities when facility-level costs alone are considered. In other words, this demonstration project did not result in substantially lower facility-level per diem costs at TCI than at comparable, fully-activated institutions.
Avoidable costs observed at comparison sites
Expanding our analysis to allow for the impact of private management on support costs tells a slightly different story. Figure 5 presents a comparison of avoidable costs at all four institutions.
We see that observed per diem costs at TCI were initially lower than the avoidable per diem costs reported by the three comparison facilities. However, later years suggest more comparable per diem costs. In FY 2001, all four facilities reported virtually identical per diem avoidable costs. The data for FY 2002 suggest a different ranking among the four institutions:
• Avoidable per diem costs at Elkton in FY 2002 exceeded those reported by TCI by slightly more than $2.
• Avoidable per diem costs reported by Forrest City at this time were virtually identical to those reported by TCI.
• Avoidable per diem costs reported by Yazoo City at this time were $1.40 lower than those reported by TCI.
A combination of scale economies and security reclassifications generally explains this divergence in the later half of the evaluation period.
• The increase in per diem costs at Elkton was largely due to the change in the security classification of the “camp” at the facility. (As mentioned earlier, this satellite institution was upgraded from a minimum security camp to a satellite low security institution, with the result that 34 additional corrections officers were hired.)

41
• The increase in per diem costs at Forrest City can be attributed to a slight decline in the institution’s average daily population.
• The relative stability of per diem costs at Yazoo City can be attributed to the slow but steady growth of its inmate population.

42
Figure 5. Reported avoidable per diem cost (including avoidable support costs)
Taft
$30.00
$31.00
$32.00
$33.00
$34.00
$35.00
$36.00
$37.00
$38.00
$39.00
$40.00
$41.00
Elkton $35.24 $34.84 $36.79 $40.71
Forrest City $35.29 $35.28 $37.36 $38.87
Yazoo City $36.84 $34.92 $37.29 $37.30
Taft $34.42 $33.21 $37.04 $38.62
1999 2000 2001 2002

43
Evaluating the results thus far
Did public and private management differ in their cost to taxpayers? The answer to this question requires us to work out what the BOP would have spent to run Taft itself. And this can only be done by resorting to hypothetical scenarios—with the inevitable risk of endless debate.
We noted earlier that observed contracting costs were higher than the per diem costs predicted by our in-house model. However, it remains to be seen whether or not the BOP would in fact have been able to achieve the cost levels predicted by this model. Figure 6 and Figure 7 illustrate the problem. We see in Figure 6 that facility-level in-house costs predicted by the in-house model are below observed facility-level costs at all four institutions. In Figure 7, we see that the avoidable in-house per diem costs predicted by the in-house model are consistently below observed per diem costs at BOP facilities.

44
Figure 6. Observed and predicted facility-level per diem costs
Taft
$30.00
$31.00
$32.00
$33.00
$34.00
$35.00
$36.00
$37.00
$38.00
$39.00
$40.00
$41.00
Elkton $33.48 $33.52 $35.47 $39.30
Forrest City $33.54 $33.94 $36.02 $37.53
Yazoo City $35.01 $33.59 $35.95 $36.02
Taft $34.42 $33.21 $37.04 $38.62
Predict. in-house $32.55 $32.13 $33.35 $34.97
1999 2000 2001 2002

45
Figure 7. Observed and predicted avoidable per diem costs (including avoidable support costs)
$30.00
$31.00
$32.00
$33.00
$34.00
$35.00
$36.00
$37.00
$38.00
$39.00
$40.00
$41.00
Elkton $35.24 $34.84 $36.79 $40.71
Forrest City $35.29 $35.28 $37.36 $38.87
Yazoo City $36.84 $34.92 $37.29 $37.30
Taft $34.42 $33.21 $37.04 $38.62
Predicted $34.25 $33.38 $34.56 $36.18
1999 2000 2001 2002
Predicted in-house cost of TCI population

46
Predicting in-house costs at comparison sites
Does our in-house model provide a reliable estimate of what the BOP would have spent to operate Taft itself? One test of the model is to see how well it predicted observed costs at BOP facilities. Table 16 provides a head-to-head comparison of cost predictions and observations at the three comparison sites. We see that:
• The in-house model over-estimated the cost of housing inmates at Forrest City and Yazoo City.
• The in-house model over-estimated the cost of housing inmates at Elkton during the first two years of this period and under-estimated the cost for the last two years.
A look at individual cost categories allows us to explain many of these differences:
• The in-house model over-predicted staffing costs at Forrest City and Yazoo City but accurately predicted staffing costs at Elkton prior to the change in the security level of the camp at this facility. This result is not surprising because the 1998 Elkton staffing plan was used as the basis for the in-house model. Forrest City and Yazoo City have consistently housed fewer inmates than Elkton. Thus, it is reasonable to assume that they would adopt different staffing patterns than Elkton.
• The in-house model under-predicted staffing costs at Elkton after the camp was upgraded from a minimum to a low security institution. This is also not surprising because the change in security level led to an increase in the number of corrections officers at the facility.
• The accuracy of in-house predictions for the cost of goods and services declined somewhat over time. In general, the in-house model under-predicted the cost of goods and services at Elkton and Forrest City, but it was neither consistently too high nor too low in its predictions for Yazoo City. This result can be attributed to the difficulty of extrapolating 1998 data over multiple years.

47
Table 16. Predicted and observed cost at BOP comparison facilities (current dollars) Elkton 1999 2000 2001 2002 Predicted Observed Predicted Observed Predicted Observed Predicted Observed Salary and benefits ($) 18,559,546 17,623,873 19,429,989 18,889,936 20,123,640 20,696,323 21,033,228 22,024,577Premium compensation ($) 1,086,942 968,765 1,137,919 1,166,206 1,178,543 1,964,451 1,231,813 2,251,666Services ($) 6,402,492 6,015,495 7,105,186 7,323,521 7,641,990 8,347,407 7,619,219 9,219,867Total 26,048,980 24,608,134 27,673,095 27,379,663 28,944,173 31,008,181 29,884,260 33,496,111
Elkton population 2,013 2,238 2,395 2,335 Per diem facility cost ($) 35.45 33.49 33.88 33.52 33.11 35.47 35.06 39.30
Per diem avoidable cost ($) 37.31 35.25 35.22 34.84 34.34 36.79 36.32 40.71 Forrest City 1999 2000 2001 2002 Predicted Observed Predicted Observed Predicted Observed Predicted Observed Salary and benefits ($) 18,559,546 15,201,194 19,429,989 17,242,022 20,123,640 18,108,198 21,033,228 19,351,538Premium compensation ($) 1,086,942 809,173 1,137,919 895,926 1,178,543 899,843 1,231,813 934,500Services ($) 5,924,501 5,783,010 6,780,358 7,689,738 6,876,527 7,863,481 6,918,363 7,360,708Total 25,570,989 21,793,376 27,348,266 25,827,686 28,178,709 26,871,523 29,183,404 27,646,745
Forrest City population 1,780 2,085 2,044 2,018 Per diem facility cost ($) 39.36 33.54 35.84 33.85 37.77 36.02 39.62 37.53
Per diem avoidable cost ($) 41.42 35.30 37.25 35.18 39.17 37.35 41.04 38.87 Yazoo City 1999 2000 2001 2002 Predicted Observed Predicted Observed Predicted Observed Predicted Observed Salary and benefits ($) 18,559,546 15,201,194 19,429,989 15,956,986 20,123,640 16,940,960 21,033,228 18,151,421Premium compensation ($) 1,086,942 809,173 1,137,919 1,391,774 1,178,543 1,131,466 1,231,813 1,597,283Services ($) 5,655,759 5,783,010 6,345,131 5,701,078 6,610,468 7,148,585 6,953,737 6,991,224Total ($) 25,302,247 21,793,376 26,913,039 23,049,838 $7,912,651 25,221,012 29,218,778 26,739,929 Yazoo City population 1,649 1,880 1,922 2,034 Per diem facility cost ($) 42.04 36.21 39.11 33.50 39.79 35.95 39.36 36.02 Per diem avoidable cost ($) 44.24 38.11 40.66 34.82 41.26 37.29 40.76 37.30

48
Updating the in-house model
Additional information allows us to update our original cost coefficients. Because the camp at TCI remained a minimum security institution, a reasonable option is to retain the original staffing plan for Elkton and adjust, as necessary, our estimates for overtime and the cost of goods and services to reflect experience.
From Table 16, we see that our original model “under-predicted” overtime and services expenses in later years.
To update our estimate of overtime expenses, we use the reported average ratio of premium pay to permanent wages and salaries at 14 low security institutions operated by the BOP.
Analysis performed by Abt Associates provides an alternative method of predicting the cost of goods and services used in low security institutions. Table 17 uses the regression equation specified by Abt to estimate this “other direct cost.”
We see that even with increases in our materials cost estimates,
• The predicted facility-level cost of in-house operations is below the observed cost of contract operations in 3 out of 4 years and
• The predicted avoidable cost of in-house operations is lower than the observed cost of contract operations in 2 out of 4 years.
In other words, we do not find evidence that the private management of TCI led to significantly lower facility-level costs after the institution was fully activated. The cost savings to be realized must therefore come from elsewhere.

49
Table 17. Updated in-house cost estimates 1999 2000 2001 2002 Population (based on TCIADP) 2,230 2,379 2,374 2,343 Staff salary & benefits ($) 18,559,546 19,429,989 20,123,640 21,033,228 Premium compensation ($) 1,206,506 1,348,435 1,380,369 1,599,818 Personnel liability ($) 129,917 136,010 140,865 147,233 Total personnel cost ($) 19,895,969 20,914,434 21,644,874 22,780,279 Annual wage adjustment 3.54% 4.69% 3.57% 4.52% Goods and services ($) 7,687,801 8,289,783 8,470,439 8,543,992 Casualty insurance ($) 153,285 158,635 162,950 165,198 Annual inflation adjustment 2.19% 3.49% 2.72% 1.38% Total facility-level cost ($) 27,737,055 29,362,851 30,278,263 31,489,469 Per diem ($) 34.08 33.72 34.94 36.82 Avoidable overhead ($) 1,447,874 1,145,151 1,096,073 1,095,834 Total avoidable in-house cost ($) 29,184,929 30,508,003 31,374,336 32,585,302 In-house per diem ($) 35.86 35.04 36.21 38.10
Unavoidable overhead ($) 1,861,156 2,237,449 2,146,729 2,157,029 Total cost ($) 31,046,085 32,745,452 33,521,064 34,742,331 Per diem ($) 38.14 37.61 38.69 40.63
Observed cost of contract operations, current year prices 1999 2000 2001 2002 Population at TCI 2,230 2,379 2,374 2,343 Net payments to contractor ($) 27,576,105 28,618,490 31,685,186 32,770,472 Monitoring costs ($) 580,857 441,183 566,014 418,596 Fed. tax credit ($) -137,881 -143,092 -158,426 -163,852 Total avoidable contract cost ($) 28,019,081 28,916,581 32,092,774 33,025,216 Contract per diem ($) 34.42 33.21 37.04 38.62
Unavoidable overhead ($) 1,889,332 2,214,347 2,286,610 2,244,777 Total contract cost ($) 29,908,413 31,130,928 34,379,384 35,269,993 Per diem ($) 36.74 35.75 39.68 41.24
Figure 8 illustrates the differences in the two sets of these per diem cost estimates. (To show the size of the difference relative to the overall level of per diem costs, the scale of the cost axis is not truncated at $30.)

50
Figure 8. Observed contract costs and updated avoidable in-house costs
Predicted in-house cost
Observed contract cost
$0.00
$5.00
$10.00
$15.00
$20.00
$25.00
$30.00
$35.00
$40.00
In-house per diem $35.60 $34.69 $35.86 $37.55
Contract per diem $34.42 $33.21 $37.04 $38.62
1999 2000 2001 2002

51
There are two ways in which we can broaden the scope of our analysis:
• Consider TCI and the three comparison institutions in the context of other BOP facilities
• Include the activation period for TCI and the three comparison institutions in our evaluation of the Taft contract.
The next chapter provides details of operations at a number of older and smaller BOP facilities. The final chapter of this report presents an analysis of all 5 years of the Taft demonstration project—including the start-up year.

52
This page left intentionally blank.

53
Chapter 4 BOP operations in a broader context
In this chapter, we examine the costs and staffing patterns reported by the three BOP comparison sites in light of operations at other low security BOP institutions.
Inmates at other low-security institutions
Table 18 lists population data for the three comparison institutions in the context of other low security facilities. Specifically, it documents the differences in the scale of operations at TCI and 14 BOP institutions over the period FY 1999 through FY 2002.22
It is clear that TCI and the three comparison institutions were larger and grew faster than the other low security institutions. In FY 1999, the average population at the three BOP comparison sites exceeded the average population at 11 other BOP low-security institutions by almost 600 inmates; the population at TCI exceeded that of the other low-security facilities by more than 1,000 inmates.
Over the period FY 1999 through FY 2002, the average population at the three comparison sites also grew faster: Their average annual growth was 5.5 percent whereas the average rate at the non-comparison sites was only 2.7 percent. As the facility-level data in Table 18 show, the population at three non-comparison facilities (Big Spring, Seagoville, and Texarkana) actually declined.
By FY 2002, the average population at the three comparison sites exceeded that at other BOP minimum security facilities by just over 800 inmates. At TCI, this difference had grown to almost 1,025 inmates.
22 The growth rates reported in the table are computed as annual compound rates. More formally, the rate of change in the average daily inmate population over the 4-year period is implicitly defined as ADP2002 = ADP1999(1 + r)3, where r is the average annual growth rate.

54
Table 18. Average daily population at BOP low-security facilities Institution 1999 2000 2001 2002
Ashland 1,309 1,353 1,341 1,394Bastrop 1,244 1,320 1,418 1,445
Big Spring 1,119 1,259 984 927Butner 1,241 1,330 1,256 1,259Elkton 2,013 2,238 2,395 2,335
Forrest City 1,780 2,085 2,044 2,018La Tuna 1,322 1,346 1,396 1,728Loretto 837 875 1,172 1,214Milan 1,369 1,474 1,569 1,594
Petersburg 1,389 1,504 1,547 1,447Safford 777 802 806 810
Seagoville 1,196 1,274 1,125 1,189Texarkana 1,655 1,674 1,714 1,571
Yazoo City 1,649 1,880 1,922 2,034
Average, non-comparison sites 1,223 1,292 1,303 1,325Average growth rate 1999–2002 2.7%
Average, comparison sites 1,814 2,068 2,120 2,129Average growth rate 1999–2002 5.5%
Taft 2,230 2,379 2,374 2,343
Figure 9 illustrates other differences among other BOP institutions designated as “low security.” The data used to create this figure, along with data for previous years, are reported in appendix C.
In FY 2002, 3 of the 14 facilities (Butner, Milan, and Safford) had no minimum security (camp) inmates. La Tuna operated both a minimum security camp and a satellite low security facility with the added costs that come from having two remote facilities. In contrast, all three of the comparison institutions operated a single camp. Elkton operated the largest one, a satellite low security facility that had been converted from a minimum security camp. Forrest City and Yazoo City both continued to operate minimum security camps.

55
Figure 9. Inmate population by security level, FY 2002
130
268
72
299
113
135
221
0
128
156
284
1,904
1,303
1,117
810
1,148
1,594
1,102
1,184
1,797
1,833
1,259
799
1,290
1,110
503
409
0 500 1000 1500 2000 2500
Yazoo City
Texarkana
Seagoville
Safford
Petersburg
Milan
Loretto
La Tuna
Forrest City
Elkton
Butner
Big Spring
Bastrop
Ashland
camp low satlow

56
Expenditures at other low security facilities
Table 19 places expenditures at the comparison facilities in the context of other low security facilities. The cost per inmate day at the three BOP comparison sites has remained below that of other low security facilities: The difference in the averages of the two groups has ranged between $14 and $15 per day over the period of this study.
Table 19. Facility-level costs per inmate-day at BOP institutions
Institution 1999 ($)
2000 ($)
2001 ($)
2002 ($)
Average annual growth
Ashland 52.61 53.71 53.99 54.521.20%
Bastrop 45.45 44.45 44.93 45.47 0.01% Big Spring 46.74 43.82 58.75 61.36 9.50%
Butner 38.87 40.03 43.18 46.98 6.52% Elkton 33.48 33.52 35.47 39.30 5.49%
Forrest City 33.54 33.94 36.02 37.53 3.82% La Tuna 47.21 48.38 56.33 51.76 3.11% Loretto 51.62 53.27 41.73 41.91 -6.71% Milan 56.45 53.15 53.31 54.10 -1.40%
Petersburg 51.49 51.92 48.01 51.08 -0.27% Safford 48.30 50.07 50.39 51.21 1.98%
Seagoville 49.68 51.31 65.15 64.38 9.02% Texarkana 39.38 41.83 42.83 47.06 6.12% Yazoo City 35.01 33.59 35.95 36.02 0.95%
Average, non-comparison sites 47.98 48.36 50.78 51.80 2.59%
Average, comparison sites 34.01 33.68 35.82 37.62 3.42% Difference in averages 13.97 14.68 14.96 14.18
Taft 34.42 33.21 37.04 38.62 3.91%
Costs per inmate day grew somewhat faster at the comparison facilities than at other BOP low security institutions: For the period FY 1999 through FY 2002, the average annual growth rate in per diem costs was 3.42 percent at the three comparison sites, an average of 2.59 percent at the 11 other low security institutions, and

57
3.91 percent at TCI.23 This result is best understood in the context of annual changes in public sector labor costs for this period.
Table 20 presents the annual percentage cost of living increase in the Federal GS pay schedule, as well as the corresponding rates of change in the consumer price index (i.e., the annual rate of inflation).24 A comparison of Table 19 and Table 20 shows that the growth rate in per diem costs observed at all of the minimum security institutions was less than the average annual increase in the Civil Service pay rates. Because salaries and benefits are the largest component of facility-level costs, the relatively low rates of growth in per diem costs could indicate an increasing effort to hold down expenditures.
Table 20: Annual rates of inflation and GS cost of living increases
FY 98–09 FY 99–00 FY 00–01 FY 01–02 Annual avg.
Change in GS pay scale: 3.54% 4.69% 3.57% 4.52% 4.09% Change in the CPI: 2.19% 3.49% 2.72% 1.38% 2.40%
Figure 10, Table 21, and Table 22 help identify the areas in which the greatest cost savings were realized at the three comparison facilities. Figure 10 displays the different components of per diem costs at all fourteen BOP facilities in FY 2002, whereas Table 21 provides the maximum and minimum levels observed for each cost component. Table 22 indicates the differences between the averages
23As before, the growth rates reported in the table are computed as annual compound rates. More formally, the rate of change in the cost per inmate-day over the 4-year period is implicitly defined as Cost2002 = Cost1999(1 + r)3, where r is the average annual compound growth rate. 24 The annual changes in the CPI are taken from the Bureau of Labor Statistics web site. The annual changes in federal GS pay scales are taken from footnotes to the OPM pay tables issued each year. The average annual growth rate is computed as the average compound rate for the annual rates listed.

58
for each cost component computed separately for the 3 comparison facilities and the other 11 low security institutions.
Table 22, along with Figure 10, allows for cost component comparisons on an institution-by-institution basis. In particular, we see that in FY 2002:
• No low security institution had lower per diem security costs than the three comparison facilities.
• No low security facility had lower per diem unit management costs, although Loretto and Petersburg reported similar results.
• No low security facility had significantly lower per diem administration costs, although again Loretto and Petersburg reported similar results.
• Only Butner reported lower per diem maintenance expenditures.
• Loretto did report lower per diem medical costs than did the three comparison institutions, whereas Milan and Safford reported similar per diem costs.

59
Figure 10. Facility expenditures per inmate-day, FY 2002
From Table 21, we see that for low security institutions as a whole, the largest variation in per diem costs occurred in Security, followed by Maintenance and Medical, then by Unit Management and Administration. This result is not surprising given the diversity of size, design, and age of the institutions in question.
$4.4
$5.6
$6.9
$3.8
$4.6
$3.8
$4.7
$6.8
$6.5
$4.2
$4.3
$3.4
$4.0
$3.3
$6.6
$9.6
$7.3
$6.1
$9.6
$6.6
$6.1
$2.8
$8.0
$6.0
$9.0
$4.4
$4.7
$5.3
$7.3
$9.9
$5.9
$10.6
$5.4
$4.2
$7.5
$8.4
$7.7
$8.1
$6.9
$5.4
$5.8
$6.2
$13.4
$18.1
$13.1
$15.9
$17.0
$13.6
$16.3
$13.1
$18.9
$11.8
$16.2
$10.6
$10.5
$11.0
$6.4
$9.4
$6.8
$5.4
$7.7
$5.1
$7.0
$5.9
$7.4
$6.0
$7.1
$5.1
$5.1
$5.1
$0 $10 $20 $30 $40 $50 $60 $70
TEXARKANA
SEAGOVILLE
SAFFORD
PETERSBURG
MILAN
LORETTO
LA TUNA
BUTNER
BIG SPRING
BASTROP
ASHLAND
YAZOO CITY
FORREST CITY
ELKTON
Admin. Educat Food Leisure Maint. Medical Oth Serv Psych Religious Security Training Unit Mgmt

60
Table 21. Contributions to per diem costs, FY 2002 Cost center Maximum
($) Minimum ($) Difference ($)
Admin. 6.87 3.28 3.59 Education 2.38 1.00 1.38 Food 6.11 3.55 2.55 Leisure 1.44 0.57 0.87 Maintenance 9.58 2.84 6.74 Medical 10.60 4.20 6.40 Other serve 1.63 0.66 0.97 Psych 0.83 0.16 0.68 Religious 0.69 0.30 0.39 Security 18.88 10.47 8.42 Training 0.73 0.34 0.39 Unit mgmt 9.37 5.06 4.31
Table 22 helps identify the magnitude of cost efficiencies at the comparison institutions. On average, the comparison facilities had lower expenditures per inmate-day in every cost center when compared with other low security institutions. For example, the average expenditure per inmate-day on Administrative Services was $1.50 lower in the three comparison facilities than in the remaining 11 low security institutions.
Table 22. Per diem cost components, averages for FY 2002
Institution Average
comparison sites ($)
Average, non-comparison
sites ($)
Comparison. less non-comparison
sites ($) Admin. 3.55 5.05 -1.50
Education 1.13 1.77 -0.63 Food 3.84 4.83 -1.00
Leisure 0.65 0.96 -0.31 Maintenance 4.82 7.07 -2.25
Medical 5.81 7.45 -1.65 Other services 0.89 1.06 -0.17
Psych 0.29 0.63 -0.34 Religious 0.34 0.51 -0.16 Security 10.70 15.21 -4.51 Training 0.52 0.54 -0.02
Unit mgmt 5.08 6.73 -1.65

61
Figure 11. Facility budget shares, FY 2002
28.48%
28.13%
25.55%
31.11%
31.43%
32.34%
31.48%
27.79%
30.77%
25.95%
29.77%
29.46%
27.88%
28.07%
0.00% 10.00% 20.00% 30.00% 40.00% 50.00% 60.00% 70.00% 80.00% 90.00% 100.00%
TEXARKANA
SEAGOVILLE
SAFFORD
PETERSBURG
MILAN
LORETTO
LA TUNA
BUTNER
BIG SPRING
BASTROP
ASHLAND
YAZOO CITY
FORREST CITY
ELKTON
Admin. Educat Food Leisure Maint. Medical Oth Serv Psych Religious Security Training Unit Mgmt

62
Table 23 reports the averages of expenditure shares computed separately for the 3 comparison facilities and the 11 non-comparison institutions. The table also reports the differences in expenditure shares by cost center. Remember that expenditure shares do not indicate the absolute size of the budgets in question. For example, even though the share of administration in total spending is lower on average at the comparison sites, the actual amount spent on administration may well be higher than at a representative non-comparison site.
The fourth column of Table 23 provides a measure of the efficiency gains by cost center for the comparison facilities. A negative number in this column indicates that the particular cost center represents a smaller fraction of total spending in the comparison facilities than in the remaining 11 low security institutions. Such efficiencies can be attributed to a variety of sources—including the advantage of larger-scale operations in a newly-built modern facility.
Table 23. Cost shares, averages for FY 2002
Institution Average
comparison sites (%)
Avg., non-comparison
sites (%)
Comparison. less non-comparison
sites (%) Administration 9.44 9.79 -0.34 Education 3.01 3.43 -0.43 Food 10.19 9.37 0.83 Leisure 1.72 1.85 -0.13 Maintenance 12.79 13.57 -0.78 Medical 15.42 14.43 1.00 Other services 2.36 2.03 0.34 Psych 0.77 1.22 -0.45 Religious 0.92 0.97 -0.05 Security 28.47 29.34 -0.87 Training 1.38 1.04 0.33 Unit management 13.52 12.96 0.56
For example, administrative expenses represent an average of 9.44 percent of total spending at the comparison institutions and 9.79 percent at the other low security facilities. The difference is -0.34 percent: In other words, Administration as a fraction of total expenditures is smaller at the comparison institutions.

63
Table 23 also helps identify changes in the factors that determine per diem costs at the larger comparison institutions. For any given cost center, if its share in total spending is smaller at comparison facilities, then its share in spending per inmate-day (i.e., in per diem cost) is also smaller. Remembering that per diem cost is generally smaller at the comparison facilities, we see that any cost center with a negative entry in Table 23 essentially gets a smaller piece of a smaller “pie:” It represents a smaller proportion of a lower per diem cost. In other words, these cost centers represent the most important sources of cost savings at the larger scale institutions.
Staffing levels and compensation
A look at staffing patterns over time makes it possible to understand how some of these cost savings were realized. Figure 12 presents a summary of the staffing policies found at TCI and the three comparison institutions over the period FY 1999 through FY 2003. At the publicly-managed facilities, the FTEs reported for each facility include the actual number of full-time BOP staff on board (and not assigned to UNICOR) in August of the year in question. For FY 2002, the actual number of PHS staff on board was added to the BOP complement; the authorized number of PHS staff was used for earlier years due to data availability. Staffing patterns listed for TCI represent the active (not authorized) number of FTEs reported by GEO.
From Figure 12 we see that over the period in question, the three BOP comparison facilities employed fewer FTEs per inmate than GEO used at TCI.25 Because labor costs are higher at the federal facilities, this leaner staffing policy is a necessary component of any effort to compete with private sector providers of corrections services.
25 Similar staffing trends can also be found at many of the smaller low security facilities. See appendix E for details.
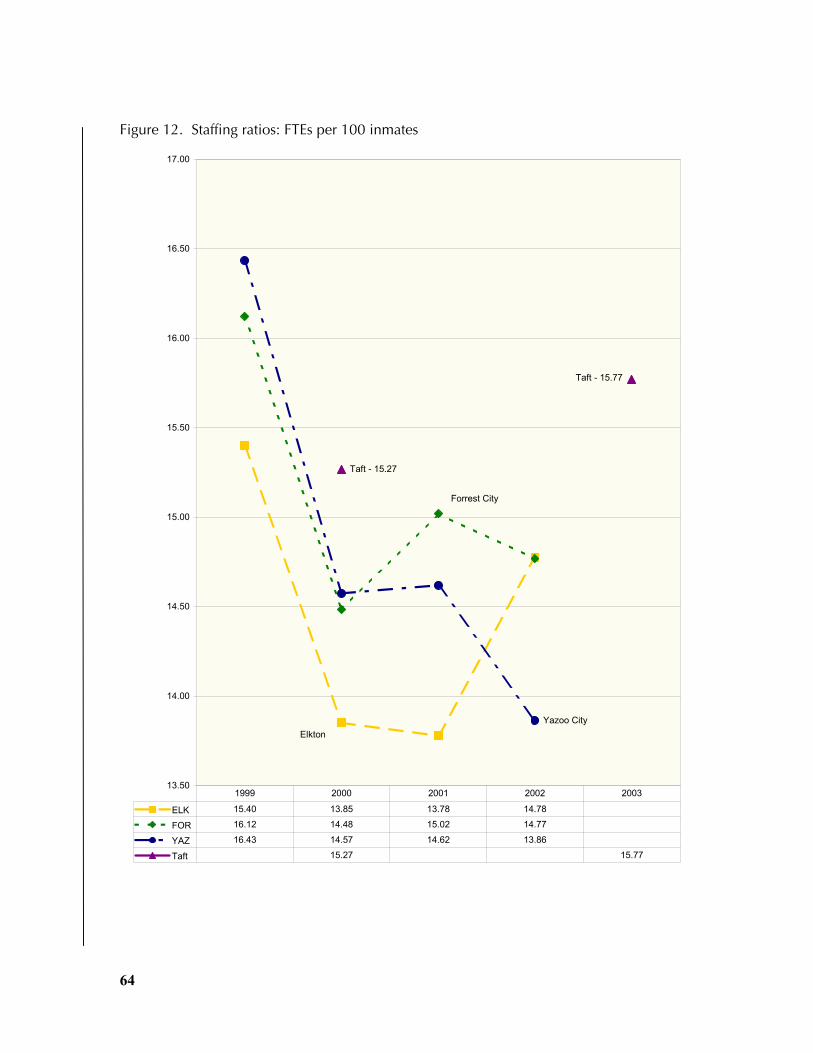
64
Figure 12. Staffing ratios: FTEs per 100 inmates
Elkton
Forrest City
Yazoo City
Taft - 15.27
Taft - 15.77
13.50
14.00
14.50
15.00
15.50
16.00
16.50
17.00
ELK 15.40 13.85 13.78 14.78
FOR 16.12 14.48 15.02 14.77
YAZ 16.43 14.57 14.62 13.86
Taft 15.27 15.77
1999 2000 2001 2002 2003

65
Table 24 and Table 25 detail this difference in labor cost and illustrate the extent to which the gap is attributable to differences in non-wage benefits.26 The Service Contract Act (SCA) is used to define the representative private sector labor cost, whereas Civil Service Law Enforcement pay schedules are used to define the analogous public sector cost.27
We need several calculations to convert the SCA hourly rates to a cost per hour worked. Table 24 provides these calculations for a generic corrections officer. The work year specified in the SCA is 2,080 hours, with employees to receive at least 10 paid holidays and 10 days of paid vacation leave. Along with an hourly wage, the SCA specifies a benefit of $2.56 to be applied to hours worked only. This benefit is designed to cover the cost of personal leave and other health and welfare benefits. The employer’s share of Social Security and Medicare costs (7.65 percent of wages) represents the remainder of the benefits paid to SCA workers.
Using these details about employee benefits and the hourly wage specified in the SCA for Kern County, California, it is possible to compute the total annual cost of hiring a generic corrections officer. The cost per hour worked is computed as the ratio of the total annual cost for the employee to the number of hours actually spent on the job. To do this, we assumed that SCA employees were allowed as many personal leave days as Civil Service workers, and were given the minimum number of days for paid vacations and
26 The labor costs calculated here are intended for the purposes of illustration, rather than to indicate the actual cost of a particular employee. They are based on publicly-available information about wage and benefit rates as well as the methods by which final compensation is calculated. 27 Many (but not all) of the positions at TCI are covered by the Service Contract Act, legislation that specifies minimum hourly wage and benefit levels for specific groups of employees working under federal contract. There is evidence that SCA wages and benefits are above those that GEO would otherwise offer. GEO originally contested the Department of Labor finding that certain TCI positions were covered by the SCA. After the Department of Labor rejected GEO’s protest, the fee specified in the original contract with the BOP was amended to reflect higher than anticipated labor costs.

66
holidays. We also assumed that all available leave days are used in the year in which they are accrued.
We can perform a similar calculation for a public sector corrections officer. The Civil Service wage rates appropriate for TCI are found in the “rest-of-the-U.S.” locality pay table for law enforcement employees. The calculations were done for a GS-7, step 5 (a grade appropriate for a junior corrections officer who has passed his or her probationary period). The work year for Civil Service employees is 2,087 hours. Employees with less than 3 years of service accrue 4 hours of personal leave and 4 hours of annual leave per bi-weekly pay period. All employees receive 10 paid holidays per year.
The benefit rate used to compute the total cost of a public sector employee was taken from the OMB Circular A-76 and was applied to annual base pay (including vacation and leave days). The benefit rate specified for law enforcement employees was 47.05 percent, consisting of retirement benefits (38.2 percent), insurance and health benefit (5.7 percent), Medicare (1.45 percent), and miscellaneous fringe benefits (1.7 percent). This information about public sector labor compensation provided the basis for the annual cost calculations listed in Table 7 for a generic Civil Service corrections officer.
We computed the cost per hour actually worked by the Civil Service Corrections Officer as before: the ratio of annual compensation to the number of hours on the job. To do this calculation, we assumed that all leave days were used in the year accrued.
These calculations give rise to several observations. For the years covered by this study:
• The minimum hourly wage rate specified in the SCA for a Kern County Corrections Officer exceeds that specified for a junior Civil Service Law Enforcement employee.
• The cost per hour worked for a generic corrections officer has been consistently lower for the SCA employee than for the Civil Service employee.

67
• Civil Service employees receive more costly benefits than the minimum specified in the SCA. These benefits include days of vacation and personal leave paid at their regular hourly rates – rather than the reduced rates implied by the terms of the SCA.
Table 24. Cost per hour worked for SCA corrections officers
Corrections officer—Service Contract Act, Bakersfield, CA, October 1998 Hourly rates Cost
Base ($) Benefits ($) Total ($) Hours
Per year ($) Per hr worked ($)
Work hrs 17.30 2.56 19.86 1,816 36,066 Personal leave 104 Vacation 17.30 1.32 18.62 80 1,490 Holidays 17.30 1.32 18.62 80 1,490
2,080 39,046 21.50
Corrections officer—Service Contract Act, Bakersfield, CA, September 1999 Hourly rates Cost Base ($) Benefits
($) Total ($) Hours Per year
($) Per hr worked ($)
Work hrs 18.81 2.56 21.37 1,816 38,808 Personal leave 104 Vacation 18.81 1.44 20.25 80 1,620 Holidays 18.81 1.44 20.25 80 1,620
2,080 42,048 23.15
Corrections officer—Service Contract Act, Bakersfield, CA, February 2001 Hourly rates Cost Base ($) Benefits
($) Total ($) Hours Per yea
($)r Per hr worked ($)
Work hrs 19.47 4.05 23.52 1,816 42,711 Personal leave 104 Vacation 19.47 1.49 20.96 80 1,677 Holidays 19.47 1.49 20.96 80 1,677
2,080 46,065 25.37
Corrections officer—Service Contract Act, Bakersfield, CA, March 2002 Hourly rates Cost Base ($) Benefits
($) Total ($) Hours Per year
($) Per hr worked ($)
Work hrs 22.51 4.28 26.79 1,816 48,654 Personal leave 104 Vacation 22.51 1.72 24.23 80 1,939 Holidays 22.51 1.72 24.23 80 1,939
2,080 52,531 28.93

68
Table 25. Cost per hour worked, GS-7 law enforcement
Law enforcement, GS-7 Step 5, RUS January 1999 Hourly rates Cost Base ($) Benefits
($) Total ($) Hours Per year Per hr worked ($)
Work hrs 16.39 7.71 24.10 1,799 43,359Personal leave 16.39 7.71 24.10 104 2,507Vacation 16.39 7.71 24.10 104 2,507Holidays 16.39 7.71 24.10 80 1,928
2,087 50,300 27.96
Law Enforcement, GS-7 Step 5, RUS January 2000 Hourly rates Cost Base ($) Benefits
($) Total ($) Hours per year
($) Per hr worked ($)
Work hrs 17.15 8.07 25.22 1,799 45,369Personal leave 17.15 8.07 25.22 104 2,623Vacation 17.15 8.07 25.22 104 2,623Holidays 17.15 8.07 25.22 80 2,018
2,087 52,632 29.26
Law Enforcement, GS-7 Step 5, RUS January 2001 Hourly rates Cost Base ($) Benefits
($) Total ($)
Hours Per year ($)Per hr worked ($)
Work hrs 17.77 8.36 26.13 1,799 47,009Personal leave 17.77 8.36 26.13 104 2,718Vacation 17.77 8.36 26.13 104 2,718Holidays 17.77 8.36 26.13 80 2,090
2,087 54,535 30.31
Law Enforcement, GS-7 Step 5, RUS January 2002 Hourly rates Cost Base ($) Benefits
($) Total ($)
Hours Per year Per hr worked ($)
Work hrs 18.57 8.74 27.31 1,799 49,126Personal leave 18.57 8.74 27.31 104 2,840Vacation 18.57 8.74 27.31 104 2,840Holidays 18.57 8.74 27.31 80 2,185
2,087 56,990 31.68

69
Table 25. Cost per hour worked, GS-7 law enforcement (continued) Law Enforcement, GS-7 Step 5, RUS January 2003
Hourly rates Cost Base ($) Benefits
($) Total ($) Hours Per year Per hr worked ($)
Work hrs 19.32 9.09 28.41 1,799 51,110Personal leave 19.32 9.09 28.41 104 2,955Vacation 19.32 9.09 28.41 104 2,955Holidays 19.32 9.09 28.41 80 2,273
2,087 59,292 32.96
Law Enforcement, GS-7 Step 5, RUS January 2004 Hourly rates Cost Base ($) Benefits
($) Total ($) Hours per year
($) Per hr worked ($)
Work hrs 19.69 9.26 28.95 1,799 52,089Personal leave 19.69 9.26 28.95 104 3,011Vacation 19.69 9.26 28.95 104 3,011Holidays 19.69 9.26 28.95 80 2,316
2,087 60,427 33.59
Figure 13 shows how this cost difference has evolved over time: The gap between the Civil Services and Service Contract Act labor costs closed significantly in early 2002. Recently, however, it has begun to expand again as Civil Service workers receive annual cost of living increases while the SCA wage for corrections officers remains unchanged.

70 Distribution limited to the sponsor
Figure 13. Compensation per hour worked in Kern County, CA: Service Contract Act corrections officer and GS-6, step 5 law enforcement officer
$28.93
$25.37
$23.15$21.50
$33.59$32.96$31.68
$29.26$27.96
$30.31
$0.00
$5.00
$10.00
$15.00
$20.00
$25.00
$30.00
$35.00
$40.00
Jan-9
9
Jan-0
0
Jan-0
1
Jan-0
2
Jan-0
3
Jan-0
4
Service Contract Act GS-LEO

71
Table 26 and Table 27 provide a more detailed version of how staffing patterns have been adapted to allow for these differences in labor costs. Table 27 presents a breakdown of the data reported in Figure 12. We see that the greatest difference in staffing patterns occurs in Correctional Services, with Taft employing significantly more staff both in absolute numbers and on a per inmate basis. To some extent, this difference is offset by the fact that all employees in BOP facilities are qualified corrections officers.
Table 26. Staffing patterns at comparison facilities
Elkton Forrest City Yazoo City Taft
2002 2001 2000 1999 2002 2001 2000 1999 2002 2001 2000 1999 2003 2000Business 18 18 18 23 20 22 21 21 18 18 18 18 11 11.2Computer services 2 2 2 2 2 2 2 2 2 2 1 1 3 2Correctional services
143 132 124 118 122 131 129 118 121 119 123 118 184.4 177
Education/vocational training
13 12 12 13 8 8 9 8 10 9 8 8 18 14
Food services 18 16 15 16 13 15 16 14 11 13 10 11 14.2 13.6Hospital 26 25 23 25 27 28 26 24 21 22 20 21 31.4 36.5Inmate services 4 4 4 2 2 2 3 2 2Mechanic 25 25 21 22 21 20 18 22 21 21 19 19 16 14Other, no UNICOR 15 10 12 10 13 9 10 10 12 6 7 6 5 5Personnel 9 9 8 9 8 7 7 8 7 8 9 9 6 6Psychiatry 5 3 5 5 3 4 5 5 2 4 4 5 2.5 3.5Recreation 9 10 9 9 8 8 8 8 6 6 6 5 5 3Religion 2 3 3 3 3 3 3 3 3 4 2 3 2 2UNTCS management
46 50 44 44 42 42 42 37 41 40 36 35 59 61
Warden’s office 10 11 10 11 8 8 6 7 5 7 9 9 10 12
Grand total 345 330 310 310 298 307 302 287 282 281 274 271 369.5 363
ADP 2,335 2,395 2,238 2,013 2,018 2,044 2,085 1,780 2,034 1,922 1,880 1,649 2,343 2,379

72
Table 27. Staff per 100 inmates at comparison facilities
Elkton Forrest City Yazoo City Taft
2002 2001 2000 1999 2002 2001 2000 1999 2002 2001 2000 1999 2003 2000Business 0.77 0.75 0.80 1.14 0.99 1.08 1.01 1.18 0.88 0.94 0.96 1.09 0.47 0.47
Computer services 0.09 0.08 0.09 0.10 0.10 0.10 0.10 0.11 0.10 0.10 0.05 0.06 0.13 0.08Correctional services 6.12 5.51 5.54 5.86 6.05 6.41 6.19 6.63 5.95 6.19 6.54 7.16 7.87 7.46
Education & vocational training 0.56 0.50 0.54 0.65 0.40 0.39 0.43 0.45 0.49 0.47 0.43 0.49 0.77 0.59
Food services 0.77 0.67 0.67 0.79 0.64 0.73 0.77 0.79 0.54 0.68 0.53 0.67 0.61 0.57Hospital 1.11 1.04 1.03 1.24 1.34 1.37 1.25 1.35 1.03 1.14 1.06 1.27 1.34 1.53
Inmate services 0.17 0.17 0.18 0.00 0.00 0.00 0.00 0.00 0.10 0.10 0.11 0.18 0.09 0.08Mechanics 1.07 1.04 0.94 1.09 1.04 0.98 0.86 1.24 1.03 1.09 1.01 1.15 0.68 0.59
Other less UNICOR 0.64 0.42 0.54 0.50 0.64 0.44 0.48 0.56 0.59 0.31 0.37 0.36 0.21 0.21Personnel 0.39 0.38 0.36 0.45 0.40 0.34 0.34 0.45 0.34 0.42 0.48 0.55 0.26 0.25Psychiatry 0.21 0.13 0.22 0.25 0.15 0.20 0.24 0.28 0.10 0.21 0.21 0.30 0.11 0.15Recreation 0.39 0.42 0.40 0.45 0.40 0.39 0.38 0.45 0.29 0.31 0.32 0.30 0.21 0.13Religion 0.09 0.13 0.13 0.15 0.15 0.15 0.14 0.17 0.15 0.21 0.11 0.18 0.09 0.08UNTCS
management 1.97 2.09 1.97 2.19 2.08 2.05 2.01 2.08 2.02 2.08 1.91 2.12 2.52 2.56
Warden’s office 0.43 0.46 0.45 0.55 0.40 0.39 0.29 0.39 0.25 0.36 0.48 0.55 0.43 0.50
Grand total 14.78 13.78 13.85 15.40 14.77 15.02 14.48 16.12 13.86 14.62 14.57 16.43 15.77 15.27
Staffing Patterns at Other Low Security Institutions
Table 28 provides a comparison between the staffing patterns at the three comparison sites and other low security institutions. Again, the experience is different at these two groups of institutions. We see that, on average, the 11 other low security facilities employ more staff per inmate than either TCI or the 3 comparison sites. Specifically, the average staffing ratio at the “non-comparison” sites is higher in every category, with the largest absolute difference occurring in Correctional Services.
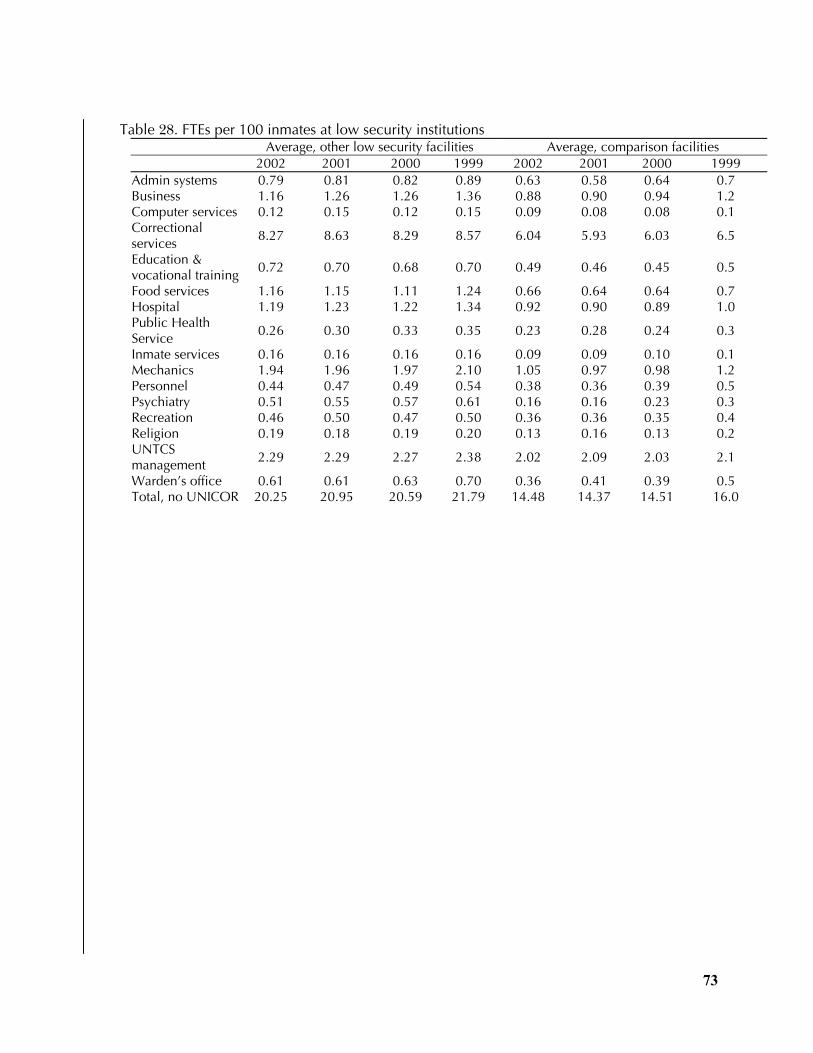
73
Table 28. FTEs per 100 inmates at low security institutions Average, other low security facilities Average, comparison facilities
2002 2001 2000 1999 2002 2001 2000 1999 Admin systems 0.79 0.81 0.82 0.89 0.63 0.58 0.64 0.7 Business 1.16 1.26 1.26 1.36 0.88 0.90 0.94 1.2 Computer services 0.12 0.15 0.12 0.15 0.09 0.08 0.08 0.1 Correctional services 8.27 8.63 8.29 8.57 6.04 5.93 6.03 6.5
Education & vocational training 0.72 0.70 0.68 0.70 0.49 0.46 0.45 0.5
Food services 1.16 1.15 1.11 1.24 0.66 0.64 0.64 0.7 Hospital 1.19 1.23 1.22 1.34 0.92 0.90 0.89 1.0 Public Health Service 0.26 0.30 0.33 0.35 0.23 0.28 0.24 0.3
Inmate services 0.16 0.16 0.16 0.16 0.09 0.09 0.10 0.1 Mechanics 1.94 1.96 1.97 2.10 1.05 0.97 0.98 1.2 Personnel 0.44 0.47 0.49 0.54 0.38 0.36 0.39 0.5 Psychiatry 0.51 0.55 0.57 0.61 0.16 0.16 0.23 0.3 Recreation 0.46 0.50 0.47 0.50 0.36 0.36 0.35 0.4 Religion 0.19 0.18 0.19 0.20 0.13 0.16 0.13 0.2 UNTCS management 2.29 2.29 2.27 2.38 2.02 2.09 2.03 2.1
Warden’s office 0.61 0.61 0.63 0.70 0.36 0.41 0.39 0.5 Total, no UNICOR 20.25 20.95 20.59 21.79 14.48 14.37 14.51 16.0

74
This page left intentionally blank.

75
Chapter 5 LOOKING BACK: Total expenditures over the first five years of the Taft contract
In this chapter, we expand our analysis to include the activation period at TCI. Because inmate populations are normally quite low when institutions first open their doors, the basic form of the TCI contract forces us to shift the basis of comparison for the facility’s activation period. As mentioned in Chapter 2, GEO received a fixed monthly payment as long as the facility population was at or below 1,946 inmates.28 This “tiered” price structure renders per diem cost measures meaningless before inmates arrive and during the first few months of operations. We therefore need to compare activation expenditures at TCI and BOP facilities for each institution as a whole—rather than on a cost per inmate-day basis. This approach will also make it possible to compute the taxpayer impact of the first five years of the TCI contract.
Activation expenditures compared
The activation period in a BOP facility can last as long as 2 years. It is defined as the period that starts when staff first arrive and ends when the facility reports an average daily inmate population (ADP) equal to 95 percent of capacity. For Taft, this meant achieving an ADP of 1,946 inmates. TCI reached this level at the end of FY 1998, 13 months after the contract began. Elkton initially had a lower planned capacity: Only half of the 512 beds in its minimum security camp were activated at first. Elkton reached 100 percent of this lower capacity utilization—an ADP of 1,792 inmates—after 18 months of operation.
It is plausible to assume that the BOP could have activated TCI at the same rate as Elkton if it had been authorized to operate the facility. Thus, the observed cost of the first 18 months of operation
28 These payments began several months before the first inmates arrived, thus allowing GEO to hire staff and prepare the institution for regular operation.
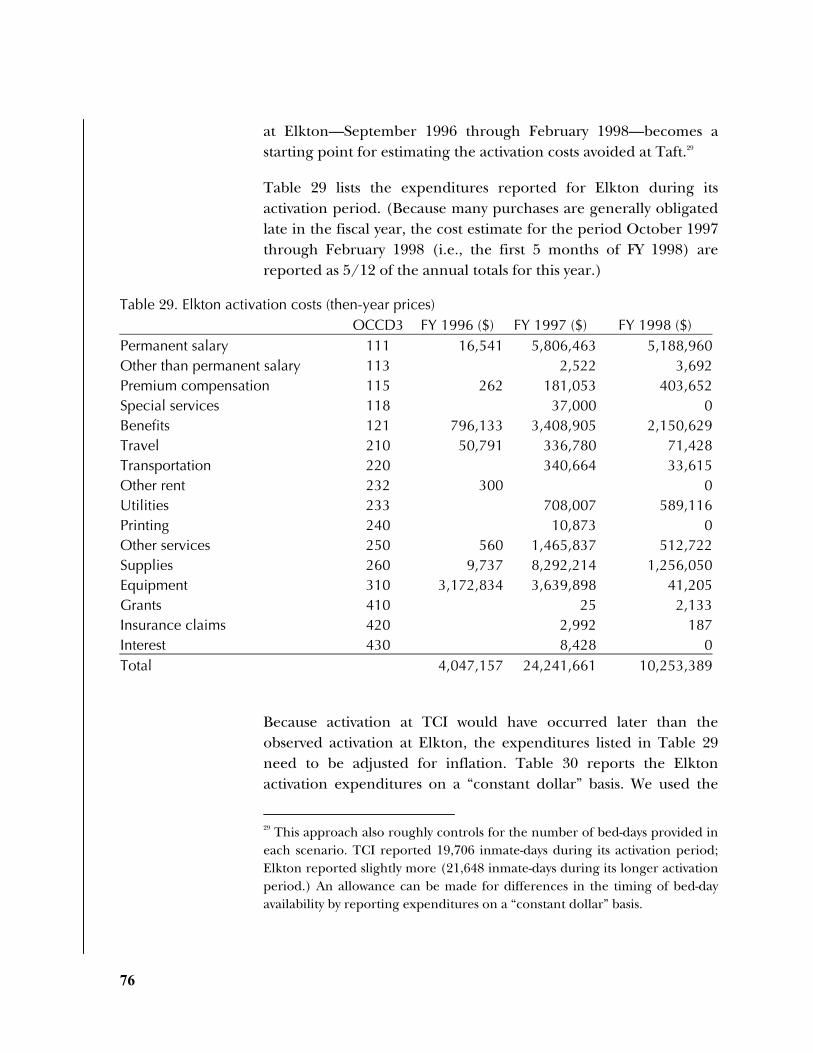
76
at Elkton—September 1996 through February 1998—becomes a starting point for estimating the activation costs avoided at Taft.29
Table 29 lists the expenditures reported for Elkton during its activation period. (Because many purchases are generally obligated late in the fiscal year, the cost estimate for the period October 1997 through February 1998 (i.e., the first 5 months of FY 1998) are reported as 5/12 of the annual totals for this year.)
Table 29. Elkton activation costs (then-year prices) OCCD3 FY 1996 ($) FY 1997 ($) FY 1998 ($)
Permanent salary 111 16,541 5,806,463 5,188,960Other than permanent salary 113 2,522 3,692Premium compensation 115 262 181,053 403,652Special services 118 37,000 0Benefits 121 796,133 3,408,905 2,150,629Travel 210 50,791 336,780 71,428Transportation 220 340,664 33,615Other rent 232 300 0Utilities 233 708,007 589,116Printing 240 10,873 0Other services 250 560 1,465,837 512,722Supplies 260 9,737 8,292,214 1,256,050Equipment 310 3,172,834 3,639,898 41,205Grants 410 25 2,133Insurance claims 420 2,992 187Interest 430 8,428 0Total 4,047,157 24,241,661 10,253,389
Because activation at TCI would have occurred later than the observed activation at Elkton, the expenditures listed in Table 29 need to be adjusted for inflation. Table 30 reports the Elkton activation expenditures on a “constant dollar” basis. We used the
29 This approach also roughly controls for the number of bed-days provided in each scenario. TCI reported 19,706 inmate-days during its activation period; Elkton reported slightly more (21,648 inmate-days during its longer activation period.) An allowance can be made for differences in the timing of bed-day availability by reporting expenditures on a “constant dollar” basis.

77
annual GDP deflators for federal government consumption expenditures to express these values in FY 1998 prices.30
Table 30. Inflation-adjusted activation costs (Elkton, FY 1998 prices) OCCD FY 1996 ($) FY 1997 ($) FY 1998 ($) Total ($) Inflation adjustment: 103.7% 101.4% 100.0% Permanent salaries 111 17,148 5,886,666 5,188,960 11,092,774Other than permanent salaries 113 2,557 3,692 6,248Premium compensation 115 271 183,554 403,652 587,478Special services 118 37,511 0 37,511Benefits 121 825,372 3,455,991 2,150,629 6,431,992Travel 210 52,656 341,432 71,428 465,516Transportation 220 345,370 33,615 378,985Other rent 232 311 0 311Utilities 233 717,786 589,116 1,306,903Printing 240 11,023 0 11,023Other services 250 581 1,486,084 512,722 1,999,387Supplies 260 10,095 8,406,751 1,256,050 9,672,896Equipment 310 3,289,362 3,690,174 41,205 7,020,741Grants 410 25 2,133 2,159Insurance claims 420 3,033 187 3,220Interest 430 8,545 0 8,545Total 4,195,796 24,576,503 10,253,389 39,025,688
The expenditures listed in Table 30 provide a basis for comparing a hypothetical in-house activation budget with observed contract fees at Taft. Table 31 combines this information with the obligations and monitoring costs reported for contract operations at TCI during the first 13 months of its operations (i.e., the period before it was classified as “fully activated”). As before, the avoidable cost of contract operations is assumed to be the sum of net payments made to contractors and other contract-related costs such as on-site government monitors and supplies provided by the BOP. The avoidable cost of BOP activation is estimated as the sum of facility- 30 We used GDP deflators instead of OMB recommended factors to estimate the impact of inflation because the latter were not posted for this period on the current OMB website.

78
level activation expenditures and avoidable overhead expenses (estimated at the rate observed in FY 1998).
Table 31. Activation expenses compared BOP contract obligations, FY 1998 prices ($)
Net contract payments, 8/97–12/19/97 9,272,256 Net contract payments, 12/20/97–9/98 21,071,759 Monitoring expenses 623,460 Remaining inventory 7,000,000 Total direct cost 37,967,475 Tax credit, 8/97–12/19/97 -46,361 Tax credit, 12/20/97–9/98 -105,359 Avoidable contracting cost 37,815,755
Unavoidable overhead (8.19% of avoidable contract cost) 3,097,110 Total contracting cost 40,912,865
Elkton estimate: first 18 months, FY 1998 prices ($)
Staff salaries and benefits 18,034,041
Premium compensation 587,478 Total personnel costs 18,621,518 Materials & supplies 20,400,949 Personnel liability 3,220 Current operating cost 39,025,688 Avoidable overhead (3.65%) 1,424,437 Total avoidable in-house cost 40,450,125 Unavoidable overhead (8.19 %) 3,196,204 Total in-house cost 43,646,329

79
Net impact of outsourcing: a present value approach
We now have almost all the information needed to compute the net impact of outsourcing for the first five years of the TCI contract. The remaining task is to make allowances for inflation and the opportunity cost of money.
A dollar spent in FY 2002 does not have the same value to taxpayers living in FY 1998 as a dollar spent in FY 1999. One method of adjusting for these factors is to consider the terms on which the federal government could borrow by selling Treasury securities. Nominal interest rates from sales of these securities provide a measure of the opportunity cost of funds for government agencies.
This is the logic that underlies OMB circular A-94 (a policy guide that instructs government analysts to use nominal interest rates on Treasury securities to evaluate nominal cash flows in cost-effectiveness analysis). In 1998, the nominal interest rate for 5-year Treasury securities was 5.7 percent. In Table 32 and Table 33, we use this factor to compute beginning period (FY 1998) and ending period (FY 2002) values for the avoidable and total costs incurred during the first five years of the TCI contract.

80
Table 32. Aggregate financial impact of the Taft contract—current, beginning, and ending values of avoidable costs 1998 1999 2000 2001 2002 "Then-year" prices:
Avoidable contract cost ($) 37,815,755 29,908,413 31,130,928 34,379,384 35,269,993 Avoidable in-house cost ($) 40,450,125 31,046,085 32,745,452 33,521,064 34,742,331 Difference ($) (2,634,370) (1,137,672) (1,614,524) 858,320 527,662
FY 1998 prices: 1998 1999 2000 2001 2002 Value in FY 98 $
Discount factors 100.00% 94.61% 89.51% 84.68% 80.11% Avoidable contract cost ($) 37,815,755 28,295,566 27,863,912 29,112,073 28,255,658 151,342,964 Avoidable in-house cost ($) 40,450,125 29,371,888 29,309,001 28,385,258 27,832,935 155,349,206 Difference ($) (2,634,370) (1,076,322) (1,445,089) 726,815 422,723 (4,006,242) (2.58%)
FY 2002 prices 1998 1999 2000 2001 2002 Value in FY 02 $
Future value factors 124.82% 118.09% 111.72% 105.70% 100.00% Avoidable contract cost ($) 47,203,340 35,319,808 34,780,998 36,339,009 35,269,993 188,913,147 Avoidable in-house cost ($) 50,491,680 36,663,322 36,584,823 35,431,765 34,742,331 193,913,921 Difference ($) (3,288,340) (1,343,514) (1,803,825) 907,244 527,662 (5,000,773)
(2.58%)

81
Table 33. Aggregate financial impact of the Taft contract—current, beginning, and ending values for total expenditures
1998 1999 2000 2001 2002 "Then-year" prices:
Total contracting cost ($) 40,351,991 29,908,413 31,130,928 34,379,384 35,269,993 Total in-house cost ($) 43,646,329 31,046,085 32,745,452 33,521,064 34,742,331 Difference (3,294,338) (1,137,672) (1,614,524) 858,320 527,662
FY 1998 prices: 1998 1999 2000 2001 2002 Value in FY 98 $
Discount factors 100.00% 94.61% 89.51% 84.68% 80.11% Total contracting cost ($) 40,351,991 28,295,566 27,863,912 29,112,073 28,255,658 153,879,199 Total in-house cost ($) 43,646,329 29,371,888 29,309,001 28,385,258 27,832,935 158,545,410 Difference ($) (3,294,338) (1,076,322) (1,445,089) 726,815 422,723 (4,666,211) (2.94%)
FY 2002 prices 1998 1999 2000 2001 2002 Value in FY 02 $
Future value factors 124.82% 118.09% 111.72% 105.70% 100.00% Total contracting cost ($) 50,369,184 35,319,808 34,780,998 36,339,009 35,269,993 192,078,992 Total in-house cost ($) 54,481,326 36,663,322 36,584,823 35,431,765 34,742,331 197,903,567 Difference ($) (4,112,142) (1,343,514) (1,803,825) 907,244 527,662 (5,824,576)
(2.94%)
When this nominal interest rate is used to adjust for the inter-temporal opportunity costs of financial resources, we see that there is less than a 3 percent difference between the present value of the cost of in-house operations and the corresponding cost of contract operations at TCI.
This result holds whether total costs or avoidable costs—as defined in this report—are used.31 In other words, the impact on taxpayers—as measured by observed performance—is quite small.
31 The difference in total costs is slightly larger – in both absolute and percentage terms – than the difference in avoidable costs. This is an artifact of the way in which total costs are calculated. Following BOP accounting conventions, shared or joint support costs are assigned on a percentage basis.
(continued from previous page)

82
However, although the cost estimates for contract and in-house operations were remarkably similar, we should consider one other factor when evaluating the TCI contract. It is the impact of the threat of outsourcing on the set of incentives facing both public and private sector providers of correctional services.
In this example, staff members at the three BOP facilities were well aware of the fact that the cost and quality of their operations were being compared to those observed at TCI. This perception of competition forced all of the facility managers to monitor their usual methods of “doing business.”
Similarly, private sector managers were interested in expanding their respective market shares. Economic principles suggest that the private corrections companies bid aggressively in order to win the first institution-level management contract awarded by the BOP. Such on-going comparisons have the potential to encourage all prison operators – public or private -- to provide quality services at the lowest possible prices.
Thus, facilities with smaller operating costs are assigned smaller amounts of support costs. Since the facility-level contract cost estimate is smaller than the avoidable cost of in-house operations, the former is assigned a smaller amount of unavoidable support cost. This leads to an increase in the difference between the estimates for the two scenarios.

83
Appendix A: BOP support costs, FY 1998
Assigning unavoidable costs
It is clear that some support expenditures, such as staff training, are directly affected by outsourcing—they become the responsibility of the contractor and are thus “avoided” by the Bureau.32 Such avoidable support costs are appropriately assigned to in-house operations only.
However, other support expenditures are necessarily incurred whether TCI operations are outsourced or not. These “unavoidable” expenditures serve to maintain a system that supports all facilities—be they public or private—that house federal inmates. It follows that the cost of these common resources should be allocated to all facilities on a consistent basis. The analyst must first distinguish between avoidable and unavoidable support costs and then choose a method of assigning the unavoidable portion consistently.33
Consistency with activity-based cost accounting
Some have tried to reject this type of avoidable cost analysis by invoking the logic of activity-based cost (ABC) accounting. In particular, some have argued that an ABC approach to project evaluation requires the analyst to assign little or no government overhead to contract operations and a full 12 percent share (of 32 The BOP does not actually escape ultimate responsibility for these costs: Because GEO knew it would have to pay for staff training, it would have included an allowance for these costs in the bid it submitted to the BOP when competing for the contract. 33 The “incrementalist” or “marginalist” logic of this argument is grounded in conventional economic analysis and can be found in a number of guidebooks on public sector project evaluation. Kelley (1989) provides a textbook-like treatment of the subject. A number of government costing guides make this point; several are quoted at the end of this appendix.

84
labor costs) to in-house facilities. However, a more careful review of ABC methods in practice shows that activity-based costing actually requires an avoidable cost approach to assigning common costs.
ABC accounting methods represent a recent attempt to solve a long-standing accounting conundrum: that of properly allocating the cost of services shared by two or more divisions within an organization. An ABC accounting approach consists of four basic steps:34
1. Assign and analyze activities.
2. Gather cost data and trace costs to activities.
3. Establish outputs.
4. Identify activity drivers and analyze costs.
For the analysis of TCI, we must identify two basic groups of activities:
• Those activities associated with hiring federal law enforcement personnel to staff and run BOP facilities
• Those activities associated with awarding contracts to private companies to manage BOP facilities.
(Given this definition of activities, the BOP’s measure of output would naturally become inmate bed-days in public and/or private prison facilities.)
There are then three basic types of costs to be traced to these two sets of activities—and ultimately assigned to outputs: direct costs, indirect costs, and general and administrative (G&A) costs. The last of these three categories (G&A costs) is defined as “costs that
34 This breakdown can be found in hundreds of references. This particular version is adapted from OSD Comptroller iCenter (2002) and DoD (1995). The former is available on line at http://www.dod.mil/comptroller/icenter/learn/abconcept.htm, and the latter at http://www.dod.mil/nii/bpr/bprcd/0201i.htm .

85
cannot be reasonably associated with any particular product or service produced—overhead—and would remain the same no matter what output the activity produced.” (OSD Comptroller, 2002, p. 6). In other words, G&A costs are unavoidable by definition.35
It is commonly observed that the allocation of such G&A costs is inherently arbitrary and potentially misleading.36 Some authorities recommend omitting consideration of such unavoidable costs.37 This approach limits the risk of unduly inflating the cost of an activity by assigning it a disproportionate share of unavoidable expenditures.
An alternative approach—one that would have the same effect as omitting G&A costs in the case of TCI—is to allocate unavoidable costs to both sets of activities on the same basis. This approach is used to define the “total cost” measures presented in this report. This technique provides a measure of the full cost operations but will not distort the relative ranking of the available options.
To implement this version of ABC accounting, we must first choose a measure common to both sets of activities. The one we propose here is among the simplest: the direct cost of each set of activities. Once adopted, this measure becomes the basis upon which G&A costs are allocated to both in-house and outsourced prison operations. We can assign unavoidable overhead costs to each set of
35 We note in passing that there is some ambiguity in the definitions used in the public sector for indirect and overhead costs. Some authorities divide total cost into direct and indirect components and further divide indirect cost into overhead and G&A expenditures. Others divide total cost into direct and overhead expenditures. These analysts then divide their notion of overhead into indirect and G&A expenses. These approaches differ only in word choice; they are mathematically identical. (See Atkins (2005, p. 5) for a discussion of this issue in the context of Circular A-76.) All groups agree that G&A expenditures are unavoidable. We adopt the second usage for the purposes of this report. 36 A detailed discussion of this point can be found in Kelley (1989, 2002) and in Martin (1993). 37 See, for example, DoD (1995). The relevant section of this guidebook is reproduced in the appendix of this report.

86
activities at a rate that is proportional to their predicted direct costs. We see, as a result, that it is fully consistent with ABC accounting principles to use an avoidable cost approach to allocating overhead.
Avoidable costs at the BOP
Still to be determined is the extent to which BOP support costs are in fact unavoidable. Nelson (1999) examines the elements of these support costs for FY 1998 and derives percentage cost factors appropriate to an A-76 style analysis for that year. That analysis is presented in this section.
As mentioned in the report, the four major categories of BOP support costs are training, regional office costs, national programs, and central office costs. For the purposes of this study, we assume that all regional and central office expenditures are unavoidable. Because training is primarily the responsibility of Taft management, all training expenditures have been classified as avoidable. Finally, roughly half of national program expenditures have been classified as unavoidable, because a variety of these expenses are incurred whether TCI is privately-managed or not.
Appendix Table 1. BOP avoidable national program costs, FY 1998
Total
Avoidable Unavoidable
Inmate care & programs
$1,302,958
$1,302,958
$0 Institution security
$7,279,840
$7,279,840
$0
Institution administration
$54,756,609 $32,928,275
$21,828,334
Note: Adjustments to institution administration include the following costs: Printing & reproduction (BOP provides Taft forms)
$2,095,648
Workman's compensation (included elsewhere)
$18,632,686
Unemployment (included elsewhere)
$1,100,000
Total: $21,828,334
Staff training
$23,520
$23,520
$0
Institution maintenance
$883,431
$883,431
$0 Administration
$27,237,472
$0
$27,237,472
Note: Administration adjustments include the following costs: Central office building Security-Guard Service
$1,019,823
Central office/regional office
$9,180,532

87
Total
Avoidable
Unavoidable
building lease Justice Data Center Services
$15,700,000
FMIS Migration
$500,000
National Incentive Awards
$47,391
Communication-Utilities Misc.
$151,667
Supplies
$181,978
Services (Miscellaneous)
$346,036
Personnel costs (buyout & other)
$110,044
Total: $27,237,472
Other national programs support costs: 75% of data processing
$5,731,757
$5,731,757
$0
Background Investigation-Central Office
$300,949
$0
$300,949 CC 856 (FMIS migration equipment) OCCD 310
$103,967
$103,967
$0
Background investigations—field
$12,347,281
$12,347,281
$0
Terre Haute bus operations—field
$1,097,139
$1,097,139
$0 Vehicle purchases
$4,197,684
$4,197,684
$0
Relocation—central office
$30,419
$0
$30,419 National awards
$19,253
$0
$19,253
Total - national programs
$115,312,279
$65,895,852
$49,416,427
The “unavoidable” column indicates which of the reported support costs were deducted from reported totals. These deletions can be explained as follows:
• Printing costs were deleted from “Institution Administration” because the BOP provides forms to Taft (just as it would if Taft were publicly managed).
• Workers’ compensation and unemployment expenses were deleted from “Institution Administration” because they were already accounted for in the method used to calculate staff compensation costs.
• Apart from the costs listed above, all other Institution Administration costs were classified as avoidable.
• All “Administration” expenditures were assumed to be independent of outsourcing and were deleted.

88
• Central office relocation and background investigation costs were assumed to be independent of outsourcing and were deleted.
• The cost of national awards was assumed to be independent of outsourcing and was deleted.
All other expenditures on national programs were treated as avoidable. This approach tends to overestimate BOP avoidable costs, thereby strengthening the case for outsourcing. (The higher are BOP costs of “in-house” operations, the more likely it is that privatized operations will save money.) This approach was taken to avoid the appearance of favoritism.
The next step is to determine how much of these avoidable costs should be assigned to the BOP operation of Taft. Under current BOP cost accounting practice, support costs are allocated to individual secure institutions in proportion to each institution’s reported operating expenditures. This approach is consistent with methods commonly used to allocate overhead expenditures to operating divisions in private companies.
Appendix Table 2. BOP operations and total support costs, FY 1998
Operations ($)
Support ($)
Support (%)
Total expenditure ($)
Secure BOP facilities
1,963,547,736
232,529,919
11.84%
2,196,077,655
Off-line BOP facilities
218,595,167
25,886,774
11.84%
244,481,941 Taft
29,193,235
3,457,161
11.84%
32,650,396
NIC
15,660,867
1,867,841
11.93%
17,528,707 Contract state & local
99,714,279
99,714,279
Contract comm. corr.
104,010,122
104,010,122
Legal settlement
75,015,590
75,015,590
Total BOP expenditures
2,505,736,995
263,741,695
2,769,478,690
Appendix Table 2 indicates total BOP operating and support expenditures reported for FY 1998, along with the implied “overhead rates” for these expenditures. The portion of support costs officially allocated to BOP contracts with state and local governments and community corrections facilities is included with
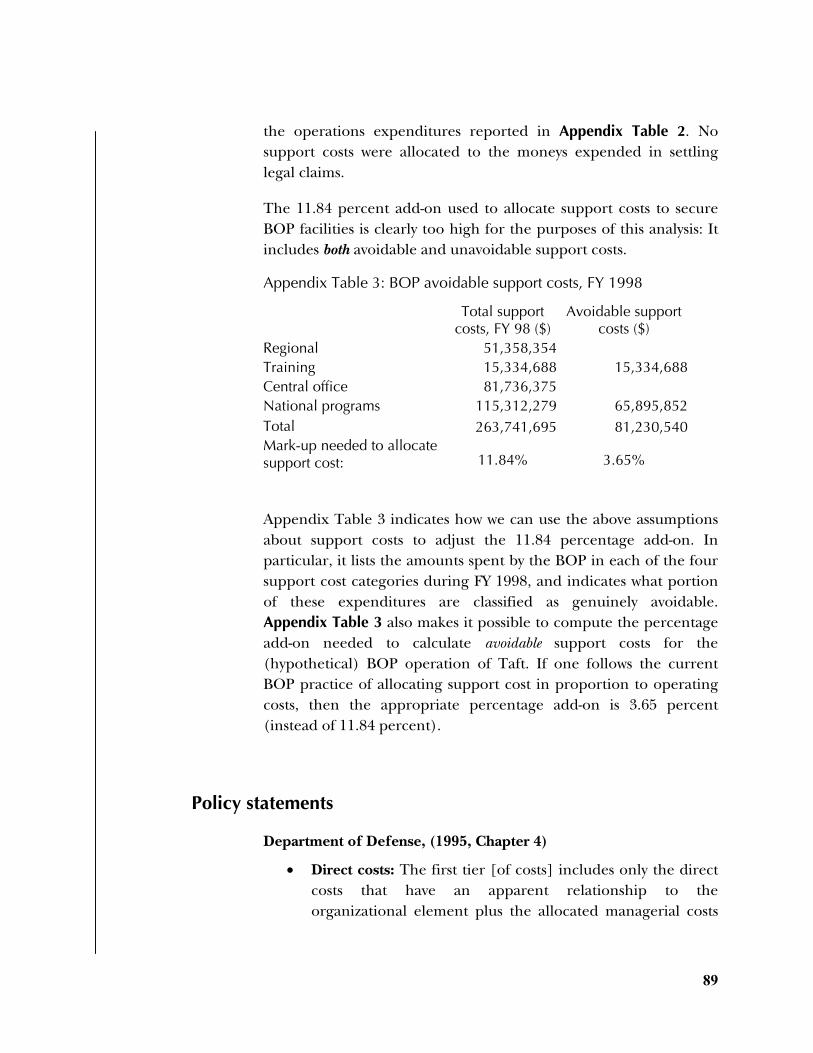
89
the operations expenditures reported in Appendix Table 2. No support costs were allocated to the moneys expended in settling legal claims.
The 11.84 percent add-on used to allocate support costs to secure BOP facilities is clearly too high for the purposes of this analysis: It includes both avoidable and unavoidable support costs.
Appendix Table 3: BOP avoidable support costs, FY 1998
Total support costs, FY 98 ($)
Avoidable support
costs ($) Regional
51,358,354
Training
15,334,688
15,334,688
Central office
81,736,375
National programs
115,312,279
65,895,852
Total
263,741,695
81,230,540 Mark-up needed to allocate support cost:
11.84%
3.65%
Appendix Table 3 indicates how we can use the above assumptions about support costs to adjust the 11.84 percentage add-on. In particular, it lists the amounts spent by the BOP in each of the four support cost categories during FY 1998, and indicates what portion of these expenditures are classified as genuinely avoidable. Appendix Table 3 also makes it possible to compute the percentage add-on needed to calculate avoidable support costs for the (hypothetical) BOP operation of Taft. If one follows the current BOP practice of allocating support cost in proportion to operating costs, then the appropriate percentage add-on is 3.65 percent (instead of 11.84 percent).
Policy statements
Department of Defense, (1995, Chapter 4)
• Direct costs: The first tier [of costs] includes only the direct costs that have an apparent relationship to the organizational element plus the allocated managerial costs

90
from the managerial elements. These direct costs normally include only the personnel payroll, supplies, and individual rental equipment that would vary with the size and mission of the element. Other variable costs may be included if the accounting system is sufficiently sophisticated...…
• Incremental costs: The second tier includes all of the costs of the first tier plus the support costs of the organization. This represents a larger portion of the total cost and a truer representation of the actual costs. The only question is the reliability of the additional costs. Because these costs are not directly related to operations, they must be distributed twice, once to the operational elements and again to the activity model. There is also the added complication of inter-support activity costs. Depending on which is allocated first, dollars may be distributed differently. Even with a strong rationale, this increases of the subjectivity of the comparative cost figures that result…
• Full costs: [This tier] includes all of the organization’s costs, including direct, managerial, support, and general overhead. This tier has the capability of producing the approximate full cost of the output and all of the activities. It is also misleading that this can be easily accomplished and still be a representative cost. Because so many decision rules and procedures have to be determined at each distribution and allocation, the final relationships are merely a function of the assumptions made. Because of its complexity and theoretical unreliability, this method is rarely used and is not recommended for function process reengineering projects. This is the concept that would be employed to establish and maintain a fully functional activity-based accounting system rather than to capture costs for a project.
Martin (1993, pp. 10-11)
Cited in costing guidance prepared by the state governments of Colorado and Montana, the government of Alberta, Canada,
91
A. When to Use Fully Allocated Costs
...Cost comparisons using fully allocated costs are useful in determining if the in-house cost of providing a target service is comparable with private-sector market prices. The state of Texas, for example, routinely compares the fully allocated cost of in-house service delivery with private sector market prices. If the fully-allocated cost of in-house delivery is greater than 110 percent of the prevailing private-sector market price, the state agency must reduce its costs within a specified period of time or the service may be targeted for contracting out. In addition, it may be appropriate to consider fully allocated costs when comparing the operating efficiency of service delivery before and after privatization. For example, if prior to privatization the per-household fully-allocated unit cost of garbage collection was $9, compared to total private-contracting costs of $6, these figures may be used to reflect the relative operating efficiency of public and private service provision. These figures do not, however, necessarily reflect the cost savings that will be realized through privatization...
B. When Not to Use Fully Allocated Costs
The use of fully allocated costs is generally inappropriate in estimating the savings to be realized by contracting out a target service that is currently conducted in-house. In other words, the amount of money that is likely to be saved is not simply the difference between fully allocated in-house cost and the total contracting cost. This is because contracting out does not generally result in a dollar-for-dollar reduction in government overhead costs. For example, the contracting out of a target service, or a portion thereof, may result in decreasing the workload of service departments like personnel, finance, and facilities management, but the workload reductions may be insufficient to have any significant effect on the costs of maintaining these departments. When attempting to determine the potential cost savings associated with the contracting out of a target

92
service, the appropriate in-house costs to use are the “avoidable costs”.
C. Avoidable Costs
Avoidable costs are those in-house costs that will not be incurred if a target service, or portion thereof, is contracted out.
Massachusetts Department of Revenue (2005, p. 3)
Appendix Table 4: Types of cost analyses, uses and examples
Questions to be answered: Example
Full costs What is the cost of all resources used to provide the service?
Landfill—the cost of all resources, from all departments, needed to provide landfill service
Average unit costs
What cost should be the basis for setting fees?
Town clerk—the cost of processing one marriage license
Job costs What is the cost of performing one job?
Vehicle repair—the cost of repairing a vehicle
Incremental costs
What would it cost to expand the service?
Libraries—the additional costs of opening a branch library two evenings per week?
Avoidable costs What costs would be avoided if some or all of the service were dropped, or if a different service delivery method (e.g., contracting) were used?
Fire—costs that would be saved if an existing fire station were closed. Ambulance—costs that would be saved by contracting for the service

93
Appendix B: Inmate population data
In this section we list our inmate population data by facility and security level.

94
Appendix Table 5. Man-days and ADP by facility
Total man-days ADP Percentage distribution 2002 2001 2000 1999 2002 2001 2000 1999 2002 2001 2000 1999
Ashland Total 508,866 489,478 495,100 477,636 1,394 1,341 1,353 1,309 100.0% 100.0% 100.0% 100.0%Ashland Low 405,060 394,863 394,487 378,212 1,110 1,082 1,078 1,036 79.6% 80.7% 79.7% 79.2%Ashland Camp 103,806 94,615 100,613 99,424 284 259 275 272 20.4% 19.3% 20.3% 20.8%Bastrop Total 527,514 517,458 483,077 454,034 1,445 1,418 1,320 1,244 100.0% 100.0% 100.0% 100.0%Bastrop Low 470,700 454,655 423,851 400,490 1,290 1,246 1,158 1,097 89.2% 87.9% 87.7% 88.2%Bastrop Camp 56,814 62,803 59,226 53,544 156 172 162 147 10.8% 12.1% 12.3% 11.8%Big Spring Total 338,417 359,284 460,725 408,585 927 984 1,259 1,119 100.0% 100.0% 100.0% 100.0%Big Spring Low 291,796 309,822 399,441 347,410 799 849 1,091 952 86.2% 86.2% 86.7% 85.0%Big Spring Camp 46,621 49,462 61,284 61,175 128 136 167 168 13.8% 13.8% 13.3% 15.0%Butner Total 459,537 458,294 486,709 452,911 1,259 1,256 1,330 1,241 100.0% 100.0% 100.0% 100.0%Elkton Total 852,407 874,252 819,186 734,926 2,335 2,395 2,238 2,013 100.0% 100.0% 100.0% 100.0%Elkton Low 668,951 735,333 678,179 638,426 1,833 2,015 1,853 1,749 78.5% 84.1% 82.8% 86.9%Elkton Camp 141,007 96,500 385 264 21.5% 15.9% 17.2% 13.1%Elkton FSL 183,456 138,919 503 381 Forrest City Total 736,562 746,176 763,139 649,876 2,018 2,044 2,085 1,780 100.0% 100.0% 100.0% 100.0%Forrest City Low 655,890 663,592 683,508 626,125 1,797 1,818 1,868 1,715 89.0% 88.9% 89.6% 96.3%Forrest City Camp 80,672 82,584 79,631 23,751 221 226 218 65 11.0% 11.1% 10.4% 3.7%La Tuna Total 630,622 473,126 492,784 482,640 1,728 1,296 1,346 1,322 100.0% 100.0% 100.0% 100.0%La Tuna Low 432,254 376,896 416,083 410,623 1,184 1,033 1,137 1,125 68.5% 79.7% 84.4% 85.1%La Tuna Camp 49,247 58,978 76,701 72,017 135 162 210 197 7.8% 12.5% 15.6% 14.9%La Tuna FSL 149,121 37,252 409 102 0 0 23.6% 7.9% 0.0% 0.0%Loretto Total 443,262 427,941 320,376 305,659 1,214 1,172 875 837 100.0% 100.0% 100.0% 100.0%Loretto Low 402,152 386,294 281,312 271,666 1,102 1,058 769 744 90.7% 90.3% 87.8% 88.9%Loretto Camp 41,110 41,647 39,064 33,993 113 114 107 93 9.3% 9.7% 12.2% 11.1%Milan Total 581,748 572,688 539,328 499,535 1,594 1,569 1,474 1,369 100.0% 100.0% 100.0% 100.0%Petersburg Total 528,099 564,629 550,358 507,047 1,447 1,547 1,504 1,389 100.0% 100.0% 100.0% 100.0%Petersburg Low 418,984 451,782 437,678 403,375 1,148 1,238 1,196 1,105 79.3% 80.0% 79.5% 79.6%Petersburg Camp 109,115 112,847 112,680 103,672 299 309 308 284 20.7% 20.0% 20.5% 20.4%Safford Total 295,730 294,361 293,468 283,761 810 806 802 777 100.0% 100.0% 100.0% 100.0%Seagoville Total 433,921 410,777 466,265 436,459 1,189 1,125 1,274 1,196 100.0% 100.0% 100.0% 100.0%
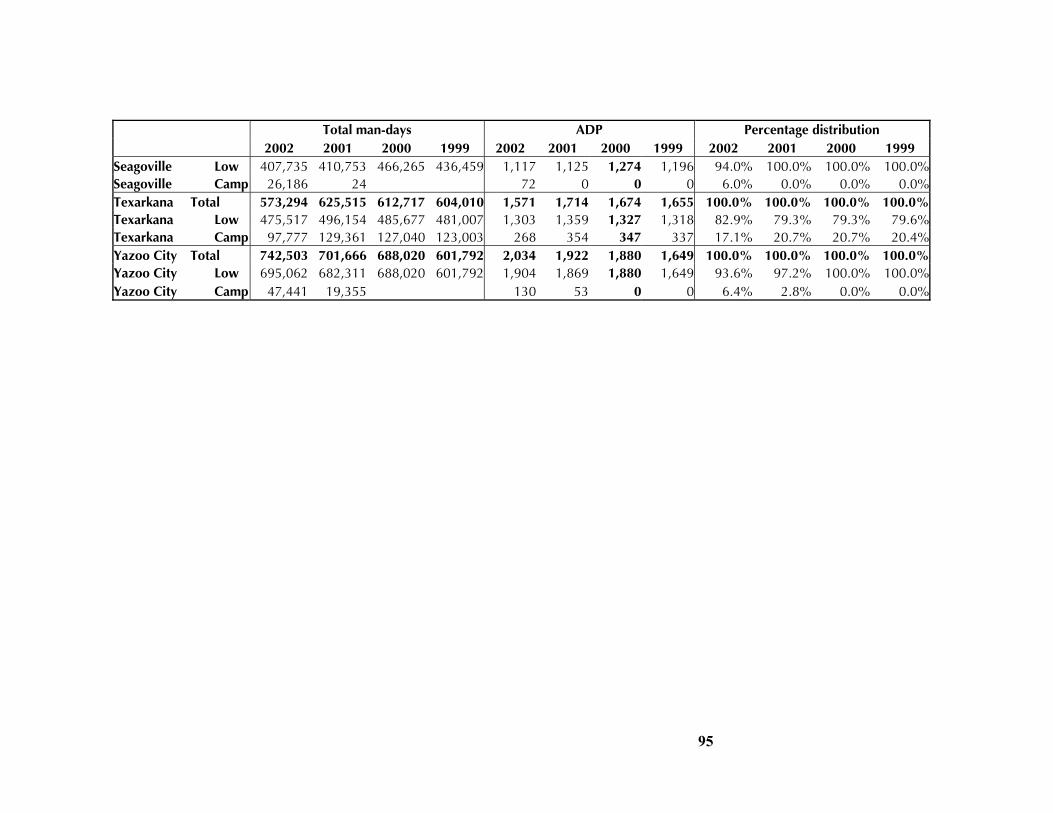
95
Total man-days ADP Percentage distribution 2002 2001 2000 1999 2002 2001 2000 1999 2002 2001 2000 1999
Seagoville Low 407,735 410,753 466,265 436,459 1,117 1,125 1,274 1,196 94.0% 100.0% 100.0% 100.0%Seagoville Camp 26,186 24 72 0 0 0 6.0% 0.0% 0.0% 0.0%Texarkana Total 573,294 625,515 612,717 604,010 1,571 1,714 1,674 1,655 100.0% 100.0% 100.0% 100.0%Texarkana Low 475,517 496,154 485,677 481,007 1,303 1,359 1,327 1,318 82.9% 79.3% 79.3% 79.6%Texarkana Camp 97,777 129,361 127,040 123,003 268 354 347 337 17.1% 20.7% 20.7% 20.4%Yazoo City Total 742,503 701,666 688,020 601,792 2,034 1,922 1,880 1,649 100.0% 100.0% 100.0% 100.0%Yazoo City Low 695,062 682,311 688,020 601,792 1,904 1,869 1,880 1,649 93.6% 97.2% 100.0% 100.0%Yazoo City Camp 47,441 19,355 130 53 0 0 6.4% 2.8% 0.0% 0.0%

96
This page left intentionally blank.
97
Appendix C: Expenditures at BOP facilities, FY 1999–2002
In this section, we list facility-level expenditures reported by the BOP financial management system.

98
Appendix Table 6.1. Ashland expenditures OCCD3 Data 1999 2000 2001 2002 00-99 01-00 02-01
Food Total DU A $2,293,315 $2,567,967 $2,439,430 $2,501,657 $274,652 19.7% -$128,537 129.9% $62,228 4.7%Medical Total DU B $3,722,861 $3,518,845 $3,206,577 $3,515,885 -$204,017 -14.7% -$312,268 315.7% $309,308 23.6%
Other services Total DU C $529,190 $564,951 $517,982 $520,341 $35,761 2.6% -$46,970 47.5% $2,359 0.2%Security Total DU E $7,157,847 $7,593,160 $7,639,131 $8,257,502 $435,313 31.3% $45,971 -46.5% $618,371 47.1%
Unit Mgmt Total DU F $3,217,144 $3,480,449 $3,518,722 $3,602,256 $263,305 18.9% $38,272 -38.7% $83,534 6.4%Education Total DU G $971,053 $1,060,997 $1,043,034 $1,125,903 $89,944 6.5% -$17,963 18.2% $82,870 6.3%
Leisure Total DU H $383,530 $389,256 $410,752 $448,107 $5,726 0.4% $21,496 -21.7% $37,355 2.8%Religious Total DU J $292,826 $306,387 $311,135 $325,483 $13,561 1.0% $4,748 -4.8% $14,348 1.1%
Psych Total DU K $339,313 $366,103 $316,509 $367,908 $26,790 1.9% -$49,594 50.1% $51,399 3.9%Admin. Total DU M $2,285,221 $2,379,866 $2,327,088 $2,202,927 $94,644 6.8% -$52,778 53.4% -$124,161 -9.5%Training Total DU N $342,907 $285,517 $327,548 $303,630 -$57,390 -4.1% $42,031 -42.5% -$23,918 -1.8%Maint. Total DU P $3,599,323 $4,012,112 $4,368,776 $4,567,024 $412,789 29.7% $356,664 -360.5% $198,248 15.1%
111 PERMANENT SAL $12,699,897 $13,236,991 $13,401,049 $14,079,307 $537,094 38.6% $164,057 -165.8% $678,258 51.7%
113 Other THAN PERM SAL $13,796 $19,623 $22,185 $10,843 $5,827 0.4% $2,562 -2.6% -$11,342 -0.9%
115 PREMIUM COMP. $1,159,621 $1,062,429 $971,033 $1,064,682 -$97,192 -7.0% -$91,396 92.4% $93,649 7.1%118 SPECIAL SERVICES $0 $0 $0 $0 $0 0.0% $0 0.0% $0 0.0%121 BENEFITS $4,940,966 $5,327,162 $5,602,259 $6,131,329 $386,196 27.8% $275,097 -278.1% $529,070 40.3%210 TRAVEL $152,158 $173,701 $192,442 $170,891 $21,543 1.5% $18,741 -18.9% -$21,551 -1.6%220 TRANSPORTATION $42,842 $33,503 $34,409 $10,821 -$9,339 -0.7% $906 -0.9% -$23,588 -1.8%233 UTILITIES $1,146,572 $1,303,150 $1,626,676 $1,912,443 $156,578 11.3% $323,526 -327.0% $285,767 21.8%240 PRINTING $0 $0 $0 $0 $0 0.0% $0 0.0% $0 0.0%250 OTHER SERVICES $1,850,510 $1,829,749 $1,595,928 $1,526,299 -$20,762 -1.5% -$233,821 236.4% -$69,629 -5.3%260 SUPPLIES $2,982,984 $3,287,458 $2,972,906 $2,811,891 $304,474 21.9% -$314,552 318.0% -$161,015 -12.3%310 EQUIPMENT $131,846 $241,549 $0 $13,599 $109,703 7.9% -$241,549 244.2% $13,599 1.0%410 GRANTS $13,312 $10,295 $7,707 $6,441 -$3,017 -0.2% -$2,588 2.6% -$1,266 -0.1%420 INSURANCE CLAIMS $27 $0 $90 $78 -$27 0.0% $90 -0.1% -$12 0.0%
430 INTEREST $0 $0 $0 $0 $0 0.0% $0 0.0% $0 0.0%
INST TOTAL $25,134,531 $26,525,609 $26,426,683 $27,738,623 $1,391,079 100.0% -$98,927 100.0% $1,311,940 100.0%
AVG POP 1,309 1,353 1,341 1,394 44 -12 53
PER DIEM COST $52.61 $53.71 $53.99 $54.52 $1.11 $0.28 $0.52
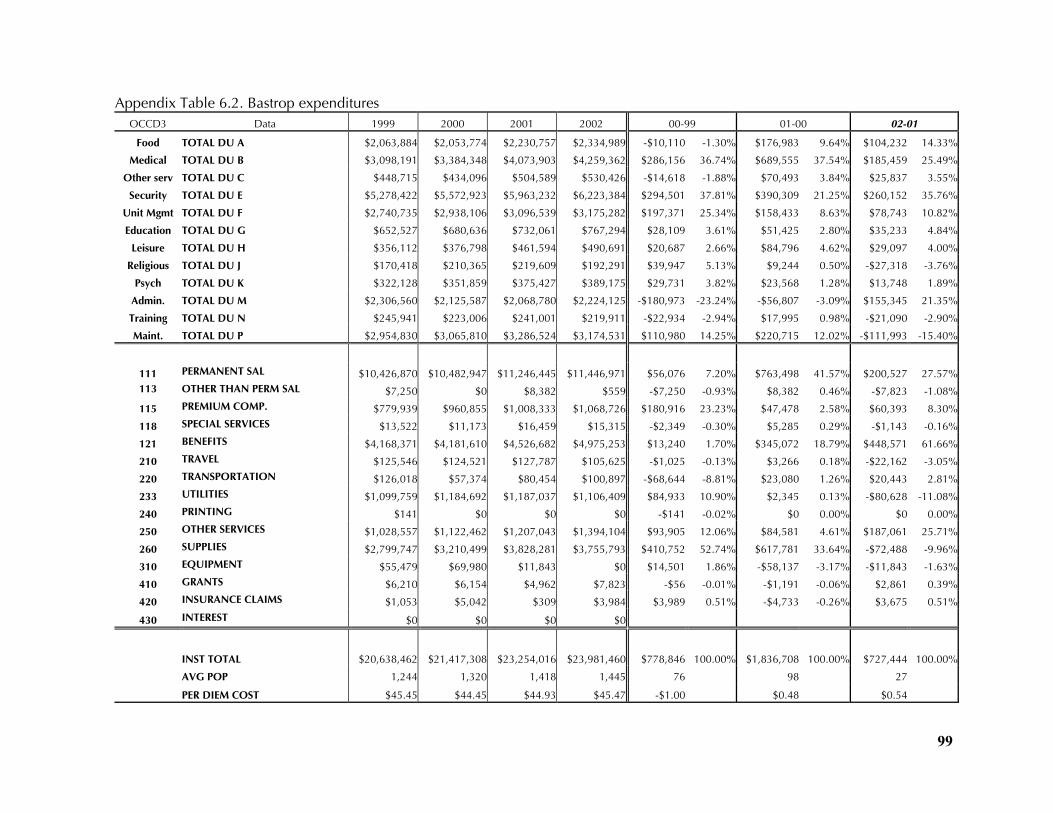
99
Appendix Table 6.2. Bastrop expenditures OCCD3 Data 1999 2000 2001 2002 00-99 01-00 02-01
Food TOTAL DU A $2,063,884 $2,053,774 $2,230,757 $2,334,989 -$10,110 -1.30% $176,983 9.64% $104,232 14.33%
Medical TOTAL DU B $3,098,191 $3,384,348 $4,073,903 $4,259,362 $286,156 36.74% $689,555 37.54% $185,459 25.49%
Other serv TOTAL DU C $448,715 $434,096 $504,589 $530,426 -$14,618 -1.88% $70,493 3.84% $25,837 3.55%
Security TOTAL DU E $5,278,422 $5,572,923 $5,963,232 $6,223,384 $294,501 37.81% $390,309 21.25% $260,152 35.76%
Unit Mgmt TOTAL DU F $2,740,735 $2,938,106 $3,096,539 $3,175,282 $197,371 25.34% $158,433 8.63% $78,743 10.82%
Education TOTAL DU G $652,527 $680,636 $732,061 $767,294 $28,109 3.61% $51,425 2.80% $35,233 4.84%
Leisure TOTAL DU H $356,112 $376,798 $461,594 $490,691 $20,687 2.66% $84,796 4.62% $29,097 4.00%
Religious TOTAL DU J $170,418 $210,365 $219,609 $192,291 $39,947 5.13% $9,244 0.50% -$27,318 -3.76%
Psych TOTAL DU K $322,128 $351,859 $375,427 $389,175 $29,731 3.82% $23,568 1.28% $13,748 1.89%
Admin. TOTAL DU M $2,306,560 $2,125,587 $2,068,780 $2,224,125 -$180,973 -23.24% -$56,807 -3.09% $155,345 21.35%
Training TOTAL DU N $245,941 $223,006 $241,001 $219,911 -$22,934 -2.94% $17,995 0.98% -$21,090 -2.90%
Maint. TOTAL DU P $2,954,830 $3,065,810 $3,286,524 $3,174,531 $110,980 14.25% $220,715 12.02% -$111,993 -15.40%
111 PERMANENT SAL $10,426,870 $10,482,947 $11,246,445 $11,446,971 $56,076 7.20% $763,498 41.57% $200,527 27.57%113 OTHER THAN PERM SAL $7,250 $0 $8,382 $559 -$7,250 -0.93% $8,382 0.46% -$7,823 -1.08%
115 PREMIUM COMP. $779,939 $960,855 $1,008,333 $1,068,726 $180,916 23.23% $47,478 2.58% $60,393 8.30%
118 SPECIAL SERVICES $13,522 $11,173 $16,459 $15,315 -$2,349 -0.30% $5,285 0.29% -$1,143 -0.16%
121 BENEFITS $4,168,371 $4,181,610 $4,526,682 $4,975,253 $13,240 1.70% $345,072 18.79% $448,571 61.66%
210 TRAVEL $125,546 $124,521 $127,787 $105,625 -$1,025 -0.13% $3,266 0.18% -$22,162 -3.05%
220 TRANSPORTATION $126,018 $57,374 $80,454 $100,897 -$68,644 -8.81% $23,080 1.26% $20,443 2.81%
233 UTILITIES $1,099,759 $1,184,692 $1,187,037 $1,106,409 $84,933 10.90% $2,345 0.13% -$80,628 -11.08%
240 PRINTING $141 $0 $0 $0 -$141 -0.02% $0 0.00% $0 0.00%
250 OTHER SERVICES $1,028,557 $1,122,462 $1,207,043 $1,394,104 $93,905 12.06% $84,581 4.61% $187,061 25.71%
260 SUPPLIES $2,799,747 $3,210,499 $3,828,281 $3,755,793 $410,752 52.74% $617,781 33.64% -$72,488 -9.96%
310 EQUIPMENT $55,479 $69,980 $11,843 $0 $14,501 1.86% -$58,137 -3.17% -$11,843 -1.63%
410 GRANTS $6,210 $6,154 $4,962 $7,823 -$56 -0.01% -$1,191 -0.06% $2,861 0.39%
420 INSURANCE CLAIMS $1,053 $5,042 $309 $3,984 $3,989 0.51% -$4,733 -0.26% $3,675 0.51%
430 INTEREST $0 $0 $0 $0
INST TOTAL $20,638,462 $21,417,308 $23,254,016 $23,981,460 $778,846 100.00% $1,836,708 100.00% $727,444 100.00%
AVG POP 1,244 1,320 1,418 1,445 76 98 27
PER DIEM COST $45.45 $44.45 $44.93 $45.47 -$1.00 $0.48 $0.54

100
Appendix Table 6.3: Big Spring expenditures OCCD3 Data 1999 2000 2001 2002 00-99 01-00 02-01
Food TOTAL DU A $2,107,443 $2,193,963 $1,877,144 $1,807,320 $86,520 8.26% -$316,819 -32.90% -$69,825 20.57%
Medical TOTAL DU B $2,449,393 $2,666,997 $2,569,325 $2,592,725 $217,604 20.76% -$97,672 -10.14% $23,400 -6.89%
Oth Serv TOTAL DU C $529,800 $512,359 $529,806 $550,434 -$17,441 -1.66% $17,448 1.81% $20,628 -6.08%
Security TOTAL DU E $5,448,539 $5,795,680 $6,043,470 $6,388,903 $347,140 33.12% $247,790 25.73% $345,433 -101.74%
Unit Mgmt TOTAL DU F $2,241,172 $2,439,505 $2,715,851 $2,495,561 $198,333 18.92% $276,346 28.70% -$220,290 64.88%
Educat TOTAL DU G $516,700 $606,037 $728,052 $805,656 $89,337 8.52% $122,014 12.67% $77,604 -22.86%
Leisure TOTAL DU H $363,260 $388,082 $448,243 $488,613 $24,822 2.37% $60,161 6.25% $40,371 -11.89%
Religious TOTAL DU J $177,236 $263,756 $279,791 $225,889 $86,520 8.26% $16,035 1.67% -$53,902 15.88%
Psych TOTAL DU K $229,522 $224,133 $251,524 $281,597 -$5,390 -0.51% $27,391 2.84% $30,074 -8.86%
Admin. TOTAL DU M $2,313,941 $2,204,501 $2,327,327 $2,192,555 -$109,440 -10.44% $122,826 12.75% -$134,772 39.70%
Training TOTAL DU N $222,203 $216,200 $216,481 $220,415 -$6,002 -0.57% $280 0.03% $3,934 -1.16%
Maint. TOTAL DU P $2,491,050 $2,627,127 $3,114,374 $2,712,201 $136,077 12.98% $487,247 50.59% -$402,173 118.45%
111 PERMANENT SAL $9,527,438 $9,943,424 $10,301,989 $10,811,632 $415,986 39.69% $358,565 37.23% $509,643 -150.11%113 OTHER THAN PERM SAL $14,867 $18,883 $8,190 $17,551 $4,016 0.38% -$10,693 -1.11% $9,361 -2.76%
115 PREMIUM COMP. $860,960 $873,008 $826,161 $971,439 $12,048 1.15% -$46,846 -4.86% $145,277 -42.79%
118 SPECIAL SERVICES $0 $0 $0 $0 $0 0.00% $0 0.00% $0 0.00%
121 BENEFITS $4,070,064 $4,326,002 $4,555,664 $4,936,055 $255,937 24.42% $229,662 23.85% $380,391 -112.04%
210 TRAVEL $118,092 $151,876 $143,479 $119,502 $33,784 3.22% -$8,398 -0.87% -$23,977 7.06%
220 TRANSPORTATION $126,225 $92,732 $59,600 $40,601 -$33,492 -3.20% -$33,133 -3.44% -$18,999 5.60%
232 OTHER RENT $0 $0 $0 $9,900 $0 0.00% $0 0.00% $9,900 -2.92%
233 UTILITIES $753,553 $787,804 $887,086 $735,215 $34,251 3.27% $99,282 10.31% -$151,870 44.73%
240 PRINTING $0 $0 $0 $0 $0 0.00% $0 0.00% $0 0.00%
250 OTHER SERVICES $837,450 $867,865 $974,888 $892,356 $30,415 2.90% $107,023 11.11% -$82,532 24.31%
260 SUPPLIES $2,678,876 $2,893,649 $3,340,532 $2,216,581 $214,773 20.49% $446,883 46.40% -$1,123,952 331.04%
310 EQUIPMENT $96,072 $165,519 $0 $0 $69,446 6.63% -$165,519 -17.19% $0 0.00%
410 GRANTS $6,600 $5,580 $3,671 $4,038 -$1,021 -0.10% -$1,908 -0.20% $366 -0.11%
420 INSURANCE CLAIMS $62 $12,000 $128 $7,000 $11,938 1.14% -$11,872 -1.23% $6,872 -2.02%
430 INTEREST $0 $0 $0 $0 $0 0.00% $0 0.00% $0 0.00%
INST TOTAL $19,090,259 $20,138,341 $21,101,388 $20,761,869 $1,048,082 100.00% $963,047 100.00% -$339,519 100.00%
AVG POP 1,119 1,259 984 927 140 -275 -57
PER DIEM COST $46.74 $43.82 $58.75 $61.36 -$2.92 $14.93 $2.61
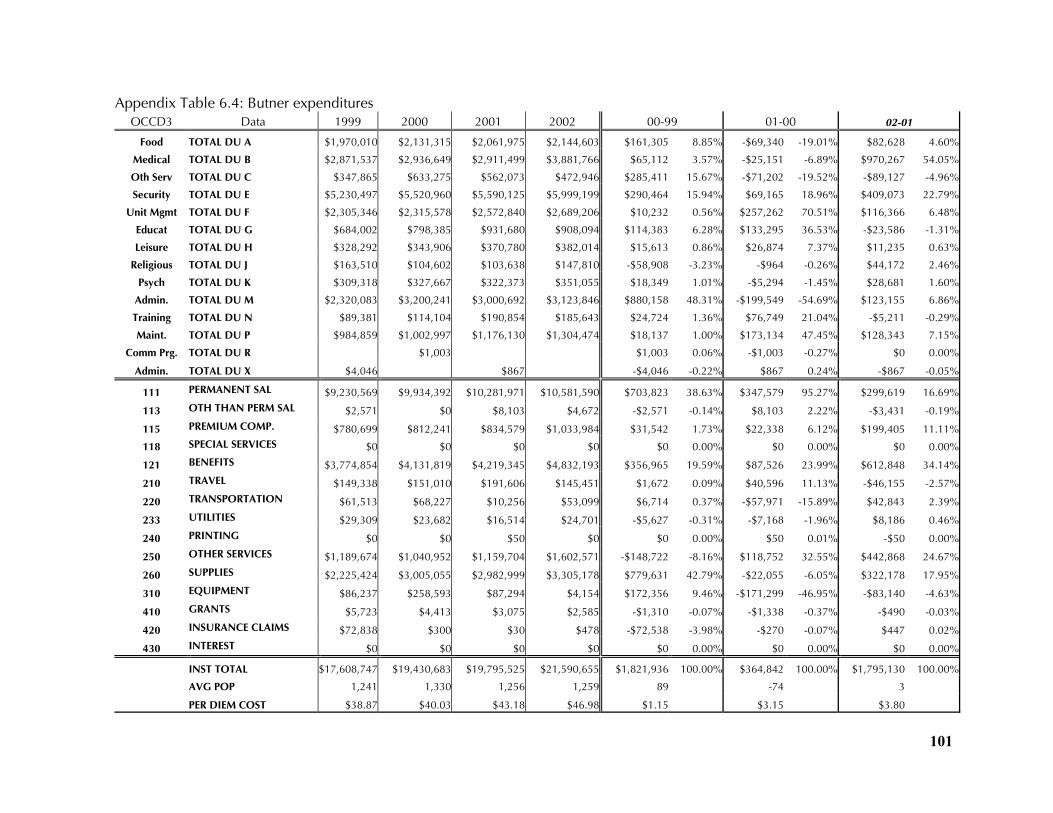
101
Appendix Table 6.4: Butner expenditures OCCD3 Data 1999 2000 2001 2002 00-99 01-00 02-01
Food TOTAL DU A $1,970,010 $2,131,315 $2,061,975 $2,144,603 $161,305 8.85% -$69,340 -19.01% $82,628 4.60%
Medical TOTAL DU B $2,871,537 $2,936,649 $2,911,499 $3,881,766 $65,112 3.57% -$25,151 -6.89% $970,267 54.05%
Oth Serv TOTAL DU C $347,865 $633,275 $562,073 $472,946 $285,411 15.67% -$71,202 -19.52% -$89,127 -4.96%
Security TOTAL DU E $5,230,497 $5,520,960 $5,590,125 $5,999,199 $290,464 15.94% $69,165 18.96% $409,073 22.79%
Unit Mgmt TOTAL DU F $2,305,346 $2,315,578 $2,572,840 $2,689,206 $10,232 0.56% $257,262 70.51% $116,366 6.48%
Educat TOTAL DU G $684,002 $798,385 $931,680 $908,094 $114,383 6.28% $133,295 36.53% -$23,586 -1.31%
Leisure TOTAL DU H $328,292 $343,906 $370,780 $382,014 $15,613 0.86% $26,874 7.37% $11,235 0.63%
Religious TOTAL DU J $163,510 $104,602 $103,638 $147,810 -$58,908 -3.23% -$964 -0.26% $44,172 2.46%
Psych TOTAL DU K $309,318 $327,667 $322,373 $351,055 $18,349 1.01% -$5,294 -1.45% $28,681 1.60%
Admin. TOTAL DU M $2,320,083 $3,200,241 $3,000,692 $3,123,846 $880,158 48.31% -$199,549 -54.69% $123,155 6.86%
Training TOTAL DU N $89,381 $114,104 $190,854 $185,643 $24,724 1.36% $76,749 21.04% -$5,211 -0.29%
Maint. TOTAL DU P $984,859 $1,002,997 $1,176,130 $1,304,474 $18,137 1.00% $173,134 47.45% $128,343 7.15%
Comm Prg. TOTAL DU R $1,003 $1,003 0.06% -$1,003 -0.27% $0 0.00%
Admin. TOTAL DU X $4,046 $867 -$4,046 -0.22% $867 0.24% -$867 -0.05%
111 PERMANENT SAL $9,230,569 $9,934,392 $10,281,971 $10,581,590 $703,823 38.63% $347,579 95.27% $299,619 16.69%
113 OTH THAN PERM SAL $2,571 $0 $8,103 $4,672 -$2,571 -0.14% $8,103 2.22% -$3,431 -0.19%
115 PREMIUM COMP. $780,699 $812,241 $834,579 $1,033,984 $31,542 1.73% $22,338 6.12% $199,405 11.11%
118 SPECIAL SERVICES $0 $0 $0 $0 $0 0.00% $0 0.00% $0 0.00%
121 BENEFITS $3,774,854 $4,131,819 $4,219,345 $4,832,193 $356,965 19.59% $87,526 23.99% $612,848 34.14%
210 TRAVEL $149,338 $151,010 $191,606 $145,451 $1,672 0.09% $40,596 11.13% -$46,155 -2.57%
220 TRANSPORTATION $61,513 $68,227 $10,256 $53,099 $6,714 0.37% -$57,971 -15.89% $42,843 2.39%
233 UTILITIES $29,309 $23,682 $16,514 $24,701 -$5,627 -0.31% -$7,168 -1.96% $8,186 0.46%
240 PRINTING $0 $0 $50 $0 $0 0.00% $50 0.01% -$50 0.00%
250 OTHER SERVICES $1,189,674 $1,040,952 $1,159,704 $1,602,571 -$148,722 -8.16% $118,752 32.55% $442,868 24.67%
260 SUPPLIES $2,225,424 $3,005,055 $2,982,999 $3,305,178 $779,631 42.79% -$22,055 -6.05% $322,178 17.95%
310 EQUIPMENT $86,237 $258,593 $87,294 $4,154 $172,356 9.46% -$171,299 -46.95% -$83,140 -4.63%
410 GRANTS $5,723 $4,413 $3,075 $2,585 -$1,310 -0.07% -$1,338 -0.37% -$490 -0.03%
420 INSURANCE CLAIMS $72,838 $300 $30 $478 -$72,538 -3.98% -$270 -0.07% $447 0.02%
430 INTEREST $0 $0 $0 $0 $0 0.00% $0 0.00% $0 0.00%
INST TOTAL $17,608,747 $19,430,683 $19,795,525 $21,590,655 $1,821,936 100.00% $364,842 100.00% $1,795,130 100.00%
AVG POP 1,241 1,330 1,256 1,259 89 -74 3
PER DIEM COST $38.87 $40.03 $43.18 $46.98 $1.15 $3.15 $3.80
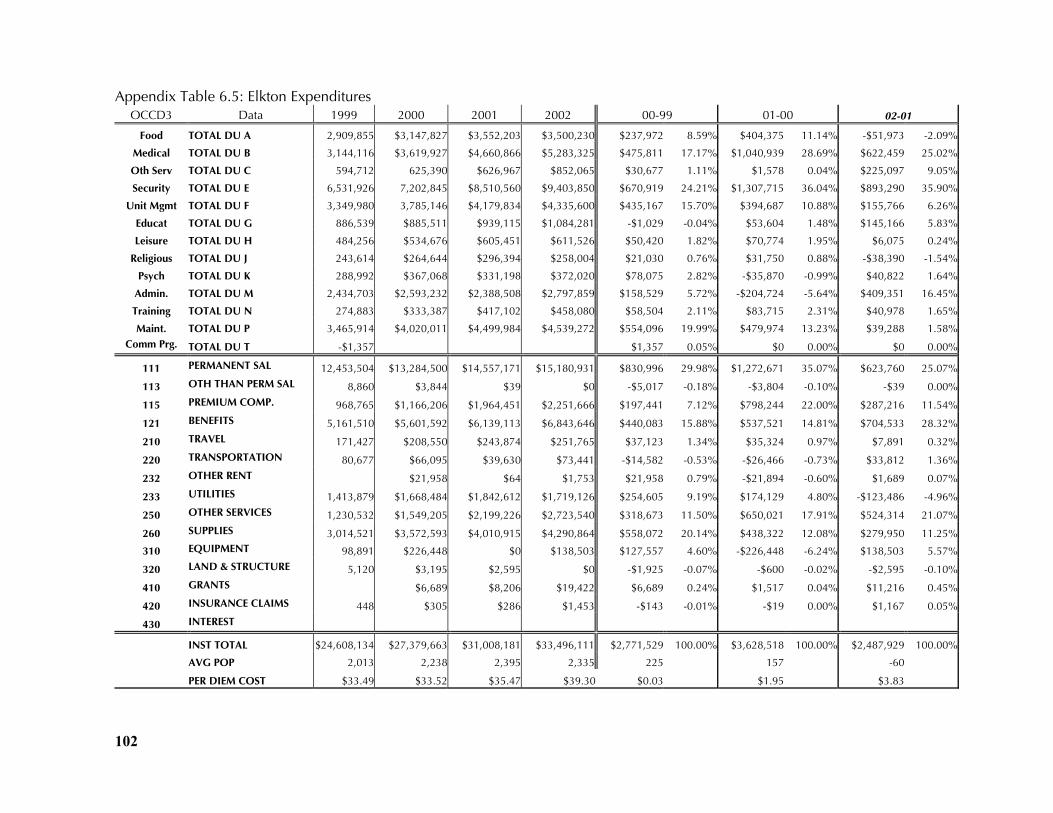
102
Appendix Table 6.5: Elkton Expenditures OCCD3 Data 1999 2000 2001 2002 00-99 01-00 02-01
Food TOTAL DU A 2,909,855 $3,147,827 $3,552,203 $3,500,230 $237,972 8.59% $404,375 11.14% -$51,973 -2.09%
Medical TOTAL DU B 3,144,116 $3,619,927 $4,660,866 $5,283,325 $475,811 17.17% $1,040,939 28.69% $622,459 25.02%
Oth Serv TOTAL DU C 594,712 625,390 $626,967 $852,065 $30,677 1.11% $1,578 0.04% $225,097 9.05%
Security TOTAL DU E 6,531,926 7,202,845 $8,510,560 $9,403,850 $670,919 24.21% $1,307,715 36.04% $893,290 35.90%
Unit Mgmt TOTAL DU F 3,349,980 3,785,146 $4,179,834 $4,335,600 $435,167 15.70% $394,687 10.88% $155,766 6.26%
Educat TOTAL DU G 886,539 $885,511 $939,115 $1,084,281 -$1,029 -0.04% $53,604 1.48% $145,166 5.83%
Leisure TOTAL DU H 484,256 $534,676 $605,451 $611,526 $50,420 1.82% $70,774 1.95% $6,075 0.24%
Religious TOTAL DU J 243,614 $264,644 $296,394 $258,004 $21,030 0.76% $31,750 0.88% -$38,390 -1.54%
Psych TOTAL DU K 288,992 $367,068 $331,198 $372,020 $78,075 2.82% -$35,870 -0.99% $40,822 1.64%
Admin. TOTAL DU M 2,434,703 $2,593,232 $2,388,508 $2,797,859 $158,529 5.72% -$204,724 -5.64% $409,351 16.45%
Training TOTAL DU N 274,883 $333,387 $417,102 $458,080 $58,504 2.11% $83,715 2.31% $40,978 1.65%
Maint. TOTAL DU P 3,465,914 $4,020,011 $4,499,984 $4,539,272 $554,096 19.99% $479,974 13.23% $39,288 1.58%Comm Prg. TOTAL DU T -$1,357 $1,357 0.05% $0 0.00% $0 0.00%
111 PERMANENT SAL 12,453,504 $13,284,500 $14,557,171 $15,180,931 $830,996 29.98% $1,272,671 35.07% $623,760 25.07%
113 OTH THAN PERM SAL 8,860 $3,844 $39 $0 -$5,017 -0.18% -$3,804 -0.10% -$39 0.00%
115 PREMIUM COMP. 968,765 $1,166,206 $1,964,451 $2,251,666 $197,441 7.12% $798,244 22.00% $287,216 11.54%
121 BENEFITS 5,161,510 $5,601,592 $6,139,113 $6,843,646 $440,083 15.88% $537,521 14.81% $704,533 28.32%
210 TRAVEL 171,427 $208,550 $243,874 $251,765 $37,123 1.34% $35,324 0.97% $7,891 0.32%
220 TRANSPORTATION 80,677 $66,095 $39,630 $73,441 -$14,582 -0.53% -$26,466 -0.73% $33,812 1.36%
232 OTHER RENT $21,958 $64 $1,753 $21,958 0.79% -$21,894 -0.60% $1,689 0.07%
233 UTILITIES 1,413,879 $1,668,484 $1,842,612 $1,719,126 $254,605 9.19% $174,129 4.80% -$123,486 -4.96%
250 OTHER SERVICES 1,230,532 $1,549,205 $2,199,226 $2,723,540 $318,673 11.50% $650,021 17.91% $524,314 21.07%
260 SUPPLIES 3,014,521 $3,572,593 $4,010,915 $4,290,864 $558,072 20.14% $438,322 12.08% $279,950 11.25%
310 EQUIPMENT 98,891 $226,448 $0 $138,503 $127,557 4.60% -$226,448 -6.24% $138,503 5.57%
320 LAND & STRUCTURE 5,120 $3,195 $2,595 $0 -$1,925 -0.07% -$600 -0.02% -$2,595 -0.10%
410 GRANTS $6,689 $8,206 $19,422 $6,689 0.24% $1,517 0.04% $11,216 0.45%
420 INSURANCE CLAIMS 448 $305 $286 $1,453 -$143 -0.01% -$19 0.00% $1,167 0.05%
430 INTEREST
INST TOTAL $24,608,134 $27,379,663 $31,008,181 $33,496,111 $2,771,529 100.00% $3,628,518 100.00% $2,487,929 100.00%
AVG POP 2,013 2,238 2,395 2,335 225 157 -60
PER DIEM COST $33.49 $33.52 $35.47 $39.30 $0.03 $1.95 $3.83

103
Appendix Table 6.6: Forrest City expenditures OCCD3 Data 1999 2000 2001 2002 00-99 01-00 02-01
Food TOTAL DU A 2,387,863 $2,869,490 $3,066,549 $2,836,779 $481,627 11.94% $197,059 18.88% -$229,771 -29.64%
Medical TOTAL DU B 2,926,141 $4,038,853 $3,946,716 $4,276,456 $1,112,712 27.58% -$92,138 -8.83% $329,740 42.53%
Oth Serv TOTAL DU C 564,376 $676,007 $700,363 $621,307 $111,630 2.77% $24,356 2.33% -$79,056 -10.20%
Security TOTAL DU E 6,132,431 $7,010,340 $7,467,545 $7,708,725 $877,909 21.76% $457,205 43.80% $241,179 31.11%
Unit Mgmt TOTAL DU F 2,759,320 $3,374,981 $3,460,474 $3,748,369 $615,661 15.26% $85,493 8.19% $287,895 37.14%
Educat TOTAL DU G 600,414 $737,704 $723,191 $737,677 $137,290 3.40% -$14,513 -1.39% $14,486 1.87%
Leisure TOTAL DU H 408,230 $468,452 $428,207 $488,591 $60,221 1.49% -$40,244 -3.86% $60,384 7.79%
Religious TOTAL DU J 193,693 $214,939 $287,618 $285,281 $21,247 0.53% $72,679 6.96% -$2,337 -0.30%
Psych TOTAL DU K 316,099 $337,220 $248,508 $208,951 $21,121 0.52% -$88,712 -8.50% -$39,557 -5.10%
Admin. TOTAL DU M 2,357,709 $2,614,092 $2,700,323 $2,926,768 $256,383 6.36% $86,231 8.26% $226,445 29.21%
Training TOTAL DU N 320,984 $328,918 $285,749 $324,307 $7,934 0.20% -$43,169 -4.14% $38,559 4.97%
Maint. TOTAL DU P 2,826,116 $3,156,690 $3,556,279 $3,483,536 $330,574 8.19% $399,589 38.28% -$72,743 -9.38%
111 PERMANENT SAL 10,607,630 $11,969,842 $12,550,600 $13,220,647 $1,362,212 33.77% $580,758 55.64% $670,047 86.43%
113 OTH THAN PERM SAL 8,013 $25,919 $44,910 $33,562 $17,906 0.44% $18,991 1.82% -$11,347 -1.46%
115 PREMIUM COMP. 809,173 $895,926 $899,843 $934,500 $86,753 2.15% $3,917 0.38% $34,657 4.47%
121 BENEFITS 4,585,551 $5,246,262 $5,512,688 $6,097,328 $660,710 16.38% $266,427 25.52% $584,640 75.42%
210 TRAVEL 226,150 $259,807 $192,703 $202,535 $33,656 0.83% -$67,104 -6.43% $9,832 1.27%
220 TRANSPORTATION 82,894 $68,760 $15,723 $81,896 -$14,134 -0.35% -$53,037 -5.08% $66,173 8.54%
233 UTILITIES 962,740 $1,268,040 $1,484,226 $1,360,823 $305,299 7.57% $216,186 20.71% -$123,403 -15.92%
240 PRINTING 0 $0 $0 $0 $0 0.00% $0 0.00% $0 0.00%
250 OTHER SERVICES 1,297,105 $2,286,864 $1,845,688 $2,057,542 $989,759 24.53% -$441,176 -42.26% $211,854 27.33%
260 SUPPLIES 3,057,077 $3,648,901 $4,158,339 $3,647,996 $591,824 14.67% $509,439 48.80% -$510,343 -65.83%
310 EQUIPMENT 148,606 $143,681 $158,745 $0 -$4,925 -0.12% $15,063 1.44% -$158,745 -20.48%
410 GRANTS 8,140 $13,685 $7,361 $9,916 $5,545 0.14% -$6,324 -0.61% $2,555 0.33%
420 INSURANCE CLAIMS 289 $0 $697 $0 -$289 -0.01% $697 0.07% -$697 -0.09%
430 INTEREST 7 $0 $0 $0 -$7 0.00% $0 0.00% $0 0.00%
INST TOTAL $21,793,376 $25,827,686 $26,871,523 $27,646,745 $4,034,310 100.00% $1,043,837 100.00% $775,223 100.00%
AVG POP 1,780 2,085 2,044 2,018 305 -41 -26
PER DIEM COST $33.54 $33.94 $36.02 $37.53 $0.39 $2.08 $1.52

104
Appendix Table 6.7: La Tuna expenditures OCCD3 Data 1999 2000 2001 2002 00-99 01-00 02-01
Food TOTAL DU A $2,381,208 $2,448,938 $2,970,909 $3,281,898 $67,730 6.85% $521,971 10.58% $310,989 7.89%
Medical TOTAL DU B $3,012,948 $2,717,872 $3,480,274 $4,755,830 -$295,077 -29.84% $762,402 15.45% $1,275,556 32.35%
Oth Serv TOTAL DU C $584,495 $526,526 $637,453 $609,793 -$57,969 -5.86% $110,927 2.25% -$27,661 -0.70%
Security TOTAL DU E $6,576,518 $7,558,986 $9,095,052 $10,275,762 $982,468 99.37% $1,536,066 31.14% $1,180,710 29.94%
Unit Mgmt TOTAL DU F $3,251,014 $3,312,383 $3,843,472 $4,428,103 $61,369 6.21% $531,090 10.77% $584,631 14.83%
Educat TOTAL DU G $564,357 $595,789 $831,569 $981,442 $31,431 3.18% $235,780 4.78% $149,873 3.80%
Leisure TOTAL DU H $428,729 $453,485 $637,167 $565,057 $24,756 2.50% $183,682 3.72% -$72,109 -1.83%
Religious TOTAL DU J $255,881 $253,677 $323,657 $291,418 -$2,203 -0.22% $69,980 1.42% -$32,240 -0.82%
Psych TOTAL DU K $272,244 $285,313 $304,704 $328,738 $13,069 1.32% $19,392 0.39% $24,034 0.61%
Admin. TOTAL DU M $2,086,212 $2,288,997 $2,552,336 $2,945,978 $202,785 20.51% $263,338 5.34% $393,642 9.98%
Training TOTAL DU N $283,550 $258,454 $376,254 $365,542 -$25,096 -2.54% $117,800 2.39% -$10,712 -0.27%
Maint. TOTAL DU P $3,083,974 $3,069,419 $3,650,164 $3,816,928 -$14,554 -1.47% $580,744 11.77% $166,764 4.23%
111 PERMANENT SAL $11,436,693 $11,686,479 $14,432,151 $15,808,996 $249,786 25.26% $2,745,672 55.66% $1,376,845 34.91%
113 OTH THAN PERM SAL $79,765 $90,988 $38,680 $44,198 $11,223 1.14% -$52,308 -1.06% $5,518 0.14%
115 PREMIUM COMP. $1,321,419 $1,610,367 $1,335,787 $1,605,270 $288,948 29.22% -$274,580 -5.57% $269,484 6.83%
118 SPECIAL SERVICES $15,365 $12,465 $18,065 $13,540 -$2,900 -0.29% $5,600 0.11% -$4,525 -0.11%
121 BENEFITS $4,538,972 $4,916,747 $6,031,315 $7,130,817 $377,775 38.21% $1,114,568 22.59% $1,099,501 27.88%
210 TRAVEL $197,075 $214,600 $296,808 $330,797 $17,525 1.77% $82,208 1.67% $33,990 0.86%
220 TRANSPORTATION $36,825 $78,966 $62,120 $103,485 $42,141 4.26% -$16,845 -0.34% $41,365 1.05%
231 ERROR $0 -$38 $0 $0 -$38 0.00% $38 0.00% $0 0.00%
233 UTILITIES $666,715 $658,180 $1,056,918 $902,357 -$8,535 -0.86% $398,738 8.08% -$154,560 -3.92%
250 OTHER SERVICES $1,474,263 $1,343,778 $1,840,499 $3,093,359 -$130,485 -13.20% $496,721 10.07% $1,252,860 31.77%
260 SUPPLIES $2,875,188 $3,036,169 $3,500,108 $3,583,629 $160,981 16.28% $463,940 9.40% $83,521 2.12%
310 EQUIPMENT $118,254 $54,554 $64,676 $0 -$63,699 -6.44% $10,122 0.21% -$64,676 -1.64%
410 GRANTS $19,222 $23,979 $25,424 $28,011 $4,758 0.48% $1,445 0.03% $2,586 0.07%
420 INSURANCE CLAIMS $1,376 $42,605 $459 $2,029 $41,229 4.17% -$42,146 -0.85% $1,570 0.04%
430 INTEREST $0 $0 $0 $0 $0 0.00% $0 0.00% $0 0.00%
INST TOTAL $22,781,131 $23,769,838 $28,703,011 $32,646,488 $988,707 100.00% $4,933,172 100.00% $3,943,478 100.00%
AVG POP 1,322 1,346 1,396 1,728 24 50 332
PER DIEM COST $47.21 $48.38 $56.33 $51.76 $1.17 $7.95 -$4.57

105
Appendix Table 6.8: Loretto expenditures OCCD3 Data 1999 2000 2001 2002 00-99 01-00 02-01
Food TOTAL DU A $1,604,527 $1,778,463 $1,863,414 $1,944,922 $173,936 13.97% $84,951 10.13% $81,508 11.37%
Medical TOTAL DU B $1,920,199 $1,850,733 $1,804,640 $1,860,952 -$69,466 -5.58% -$46,093 -5.50% $56,313 7.86%
Oth Serv TOTAL DU C $322,455 $286,572 $242,747 $292,818 -$35,884 -2.88% -$43,824 -5.23% $50,071 6.99%
Security TOTAL DU E $4,504,876 $4,909,429 $5,582,110 $6,004,797 $404,553 32.50% $672,680 80.22% $422,687 58.99%
Unit Mgmt TOTAL DU F $1,546,554 $1,743,739 $1,956,016 $2,241,850 $197,185 15.84% $212,277 25.31% $285,835 39.89%
Educat TOTAL DU G $506,662 $519,851 $578,839 $691,685 $13,189 1.06% $58,988 7.03% $112,846 15.75%
Leisure TOTAL DU H $318,891 $341,998 $355,540 $363,954 $23,107 1.86% $13,542 1.61% $8,415 1.17%
Religious TOTAL DU J $184,927 $191,355 $187,816 $166,846 $6,429 0.52% -$3,539 -0.42% -$20,970 -2.93%
Psych TOTAL DU K $167,967 $167,607 $219,457 $199,849 -$360 -0.03% $51,850 6.18% -$19,608 -2.74%
Admin. TOTAL DU M $1,931,115 $1,956,461 $2,048,496 $1,662,828 $25,346 2.04% $92,035 10.98% -$385,667 -53.82%
Training TOTAL DU N $235,102 $217,387 $198,525 $201,337 -$17,715 -1.42% -$18,862 -2.25% $2,813 0.39%
Maint. TOTAL DU P $2,525,834 $3,047,840 $2,814,834 $2,937,160 $522,006 41.94% -$233,007 -27.79% $122,326 17.07%
Comm Prg. TOTAL DU R $2,430 $2,430 0.20% -$2,430 -0.29% $0 0.00%
111 PERMANENT SAL $8,694,708 $9,192,297 $9,956,162 $10,405,926 $497,589 39.97% $763,865 91.09% $449,764 62.77%
113 OTH THAN PERM SAL $6,195 $0 $7,691 $0 -$6,195 -0.50% $7,691 0.92% -$7,691 -1.07%
115 PREMIUM COMP. $631,101 $687,014 $728,819 $710,329 $55,914 4.49% $41,805 4.99% -$18,490 -2.58%
118 SPECIAL SERVICES $0 $0 $0 $0 $0 0.00% $0 0.00% $0 0.00%
121 BENEFITS $3,435,752 $3,663,779 $4,043,077 $4,347,272 $228,027 18.32% $379,298 45.23% $304,195 42.45%
210 TRAVEL $114,790 $137,335 $162,214 $95,640 $22,545 1.81% $24,879 2.97% -$66,574 -9.29%
220 TRANSPORTATION $42,575 $14,922 $42,081 $35,924 -$27,653 -2.22% $27,159 3.24% -$6,157 -0.86%
232 OTHER RENT $0 $1,089 $1,350 $2,950 $1,089 0.09% $261 0.03% $1,600 0.22%
233 UTILITIES $473,507 $486,973 $523,455 $487,334 $13,466 1.08% $36,481 4.35% -$36,121 -5.04%
250 OTHER SERVICES $764,551 $619,116 $589,063 $531,240 -$145,435 -11.68% -$30,053 -3.58% -$57,823 -8.07%
260 SUPPLIES $1,524,327 $1,898,349 $1,744,766 $1,886,990 $374,022 30.05% -$153,583 -18.31% $142,224 19.85%
310 EQUIPMENT $72,465 $275,337 $26,886 $63,080 $202,873 16.30% -$248,451 -29.63% $36,194 5.05%
320 LAND & STRUCTURE $0 $28,874 $0 $0 $28,874 2.32% -$28,874 -3.44% $0 0.00%
410 GRANTS $8,170 $5,612 $4,743 $2,316 -$2,558 -0.21% -$869 -0.10% -$2,428 -0.34%
420 INSURANCE CLAIMS $968 $3,181 $22,125 $0 $2,213 0.18% $18,944 2.26% -$22,125 -3.09%
440 ERROR $0 -$14 $0 $0 -$14 0.00% $14 0.00% $0 0.00%
INST TOTAL $15,769,108 $17,013,865 $17,852,432 $18,569,000 $1,244,757 100.00% $838,567 100.00% $716,568 100.00%
AVG POP 837 875 1,172 1,214 38 297 42
PER DIEM COST $51.62 $53.27 $41.73 $41.91 $1.66 -$11.54 $0.17

106
Appendix Table 6.9: Milan expenditures OCCD3 Data 1999 2000 2001 2002 00-99 01-00 02-01
Food TOTAL DU A $2,783,204 $2,790,844 $2,884,596 $2,896,437 $7,639 1.96% $93,752 4.85% $11,841 1.25%
Medical TOTAL DU B $3,031,139 $3,051,547 $2,821,678 $3,145,186 $20,408 5.24% -$229,869 -11.90% $323,508 34.04%
Oth Serv TOTAL DU C $530,236 $436,317 $550,169 $498,908 -$93,919 -24.11% $113,852 5.89% -$51,262 -5.39%
Security TOTAL DU E $8,473,134 $9,005,770 $9,670,201 $9,894,665 $532,636 136.71% $664,431 34.39% $224,465 23.62%
Unit Mgmt TOTAL DU F $3,858,482 $3,810,107 $4,211,784 $4,500,450 -$48,375 -12.42% $401,677 20.79% $288,666 30.38%
Educat TOTAL DU G $750,662 $771,580 $748,699 $692,990 $20,919 5.37% -$22,881 -1.18% -$55,709 -5.86%
Leisure TOTAL DU H $445,094 $461,280 $456,304 $518,553 $16,186 4.15% -$4,976 -0.26% $62,249 6.55%
Religious TOTAL DU J $279,309 $289,783 $283,982 $371,195 $10,475 2.69% -$5,801 -0.30% $87,213 9.18%
Psych TOTAL DU K $424,058 $419,686 $384,617 $315,931 -$4,372 -1.12% -$35,069 -1.82% -$68,686 -7.23%
Admin. TOTAL DU M $2,535,837 $2,576,853 $3,119,706 $2,683,729 $41,016 10.53% $542,853 28.10% -$435,976 -45.88%
Training TOTAL DU N $336,512 $370,259 $384,765 $388,132 $33,747 8.66% $14,506 0.75% $3,367 0.35%
Maint. TOTAL DU P $4,757,960 $4,611,203 $5,010,545 $5,571,136 -$146,756 -37.67% $399,341 20.67% $560,591 58.99%
111 PERMANENT SAL $14,852,757 $15,385,705 $16,052,327 $16,234,304 $532,949 136.79% $666,622 34.51% $181,976 19.15%
113 OTH THAN PERM SAL $48,511 $56,219 $58,608 $70,588 $7,708 1.98% $2,389 0.12% $11,980 1.26%
115 PREMIUM COMP. $1,195,905 $1,238,858 $1,302,407 $1,586,055 $42,953 11.02% $63,548 3.29% $283,648 29.85%
118 SPECIAL SERVICES $7,595 $13,930 $13,440 $11,870 $6,335 1.63% -$490 -0.03% -$1,570 -0.17%
121 BENEFITS $6,048,342 $6,259,568 $6,779,052 $7,116,912 $211,226 54.22% $519,484 26.89% $337,860 35.55%
210 TRAVEL $135,560 $182,672 $154,570 $130,290 $47,113 12.09% -$28,103 -1.45% -$24,280 -2.56%
220 TRANSPORTATION $61,422 $47,415 $106,006 $81,969 -$14,007 -3.60% $58,591 3.03% -$24,037 -2.53%
232 OTHER RENT $0 $125 $25 $0 $125 0.03% -$100 -0.01% -$25 0.00%
233 UTILITIES $1,612,528 $1,496,738 $1,528,455 $1,661,747 -$115,790 -29.72% $31,716 1.64% $133,292 14.03%
250 OTHER SERVICES $1,233,515 $1,160,617 $1,255,857 $1,217,773 -$72,898 -18.71% $95,241 4.93% -$38,084 -4.01%
260 SUPPLIES $2,887,417 $2,709,625 $3,135,751 $3,027,785 -$177,792 -45.63% $426,126 22.06% -$107,966 -11.36%
310 EQUIPMENT $105,396 $30,291 $134,885 $329,137 -$75,105 -19.28% $104,594 5.41% $194,252 20.44%
410 GRANTS $15,000 $11,951 $3,686 $8,007 -$3,049 -0.78% -$8,265 -0.43% $4,321 0.45%
420 INSURANCE CLAIMS $1,679 $1,515 $1,976 $874 -$164 -0.04% $462 0.02% -$1,102 -0.12%
430 INTEREST $0 $0 $0 $0 $0 0.00% $0 0.00% $0 0.00%
INST TOTAL $28,205,627 $28,595,230 $30,527,045 $31,477,311 $389,603 100.00% $1,931,815 100.00% $950,266 100.00%
AVG POP 1,369 1,474 1,569 1,594 105 95 25
PER DIEM COST $56.45 $53.15 $53.31 $54.10 -$3.30 $0.16 $0.80

107
Appendix Table 6.10: Petersburg Expenditures OCCD3 Data 1999 2000 2001 2002 00-99 01-00 02-01
Food TOTAL DU A $2,236,848 $2,519,134 $2,335,403 $1,884,791 $282,286 11.78% -$183,731 13.21% -$450,612 340.30%
Medical TOTAL DU B $3,821,340 $4,668,427 $4,271,609 $5,599,377 $847,087 35.34% -$396,818 28.52% $1,327,768 -1002.72%
Oth Serv TOTAL DU C $587,271 $649,327 $547,443 $493,144 $62,056 2.59% -$101,884 7.32% -$54,299 41.01%
Security TOTAL DU E $8,129,509 $8,552,127 $9,184,314 $8,392,068 $422,619 17.63% $632,186 -45.44% -$792,245 598.30%
Unit Mgmt TOTAL DU F $2,764,628 $2,953,144 $2,724,648 $2,828,031 $188,515 7.87% -$228,496 16.43% $103,383 -78.07%
Educat TOTAL DU G $984,946 $991,661 $938,757 $1,012,266 $6,715 0.28% -$52,903 3.80% $73,508 -55.51%
Leisure TOTAL DU H $414,379 $445,421 $419,372 $462,990 $31,042 1.30% -$26,049 1.87% $43,618 -32.94%
Religious TOTAL DU J $216,573 $219,373 $149,595 $366,782 $2,801 0.12% -$69,778 5.02% $217,187 -164.02%
Psych TOTAL DU K $669,679 $702,385 $534,681 $273,872 $32,705 1.36% -$167,704 12.06% -$260,809 196.96%
Admin. TOTAL DU M $2,456,648 $2,847,378 $1,943,924 $2,033,118 $390,730 16.30% -$903,454 64.94% $89,195 -67.36%
Training TOTAL DU N $262,220 $287,605 $277,994 $384,501 $25,385 1.06% -$9,610 0.69% $106,507 -80.43%
Maint. TOTAL DU P $3,560,547 $3,665,331 $3,782,430 $3,246,813 $104,784 4.37% $117,100 -8.42% -$535,618 404.49%
111 PERMANENT SAL $13,596,427 $13,820,477 $12,384,735 $12,479,865 $224,050 9.35% -$1,435,742 103.21% $95,130 -71.84%
113 OTH THAN PERM SAL $115,019 $121,413 $121,382 -$4,439 $6,393 0.27% -$31 0.00% -$125,821 95.02%
115 PREMIUM COMP. $1,295,873 $1,635,920 $1,773,306 $2,113,555 $340,047 14.19% $137,387 -9.88% $340,249 -256.95%
118 SPECIAL SERVICES $0 $0 $0 $0 $0 0.00% $0 0.00% $0 0.00%
121 BENEFITS $5,242,521 $5,598,954 $5,263,467 $5,318,695 $356,432 14.87% -$335,486 24.12% $55,228 -41.71%
210 TRAVEL $191,803 $242,141 $289,228 $306,889 $50,337 2.10% $47,088 -3.38% $17,661 -13.34%
220 TRANSPORTATION $80,167 $108,244 $62,255 $43,043 $28,077 1.17% -$45,990 3.31% -$19,212 14.51%
233 UTILITIES $1,095,356 $1,046,051 $1,684,834 $1,205,700 -$49,306 -2.06% $638,783 -45.92% -$479,134 361.84%
240 PRINTING $1,182 $0 $0 $0 -$1,182 -0.05% $0 0.00% $0 0.00%
250 OTHER SERVICES $1,722,450 $2,324,029 $2,433,791 $2,799,477 $601,579 25.10% $109,763 -7.89% $365,686 -276.16%
260 SUPPLIES $2,669,616 $3,451,611 $3,041,876 $2,683,240 $781,995 32.63% -$409,735 29.45% -$358,636 270.84%
310 EQUIPMENT $71,527 $128,041 $33,211 $5,296 $56,513 2.36% -$94,830 6.82% -$27,915 21.08%
410 GRANTS $19,970 $23,985 $20,735 $26,713 $4,015 0.17% -$3,250 0.23% $5,978 -4.51%
420 INSURANCE CLAIMS $2,675 $448 $1,348 -$282 -$2,227 -0.09% $900 -0.06% -$1,630 1.23%
430 INTEREST $0 $0 $0 $0 $0 0.00% $0 0.00% $0 0.00%
INST TOTAL $26,104,587 $28,501,311 $27,110,169 $26,977,753 $2,396,724 100.00% -$1,391,142 100.00% -$132,416 100.00%
AVG POP 1,389 1,504 1,547 1,447 115 43 -100
PER DIEM COST $51.49 $51.92 $48.01 $51.08 $0.43 -$3.91 $3.07

108
Appendix Table 6.11: Safford expenditures OCCD3 Data 1999 2000 2001 2002 00-99 01-00 02-01
Food TOTAL DU A $1,498,551 $1,575,519 $1,601,400 $1,510,490 $76,968 8.01% $25,882 15.68% -$90,911 -28.56%
Medical TOTAL DU B $1,512,474 $1,818,772 $1,792,590 $1,744,439 $306,298 31.86% -$26,182 -15.86% -$48,152 -15.13%
Oth Serv TOTAL DU C $297,474 $326,292 $310,800 $303,699 $28,817 3.00% -$15,492 -9.38% -$7,101 -2.23%
Security TOTAL DU E $3,451,611 $3,676,978 $3,749,299 $3,868,674 $225,368 23.44% $72,321 43.80% $119,375 37.51%
Unit Mgmt TOTAL DU F $1,730,699 $1,760,781 $1,979,699 $1,997,966 $30,082 3.13% $218,919 132.59% $18,267 5.74%
Educat TOTAL DU G $542,681 $558,672 $626,067 $677,800 $15,991 1.66% $67,395 40.82% $51,733 16.25%
Leisure TOTAL DU H $304,581 $319,879 $340,500 $353,100 $15,298 1.59% $20,621 12.49% $12,600 3.96%
Religious TOTAL DU J $116,676 $149,215 $113,199 $123,295 $32,538 3.38% -$36,016 -21.81% $10,096 3.17%
Psych TOTAL DU K $145,175 $151,369 $175,396 $188,783 $6,195 0.64% $24,027 14.55% $13,386 4.21%
Admin. TOTAL DU M $1,966,820 $2,065,214 $1,912,291 $2,032,242 $98,393 10.23% -$152,922 -92.62% $119,951 37.69%
Training TOTAL DU N $142,553 $200,913 $220,948 $186,611 $58,360 6.07% $20,035 12.13% -$34,337 -10.79%
Maint. TOTAL DU P $1,987,414 $2,054,513 $2,001,038 $2,154,393 $67,099 6.98% -$53,475 -32.39% $153,354 48.18%
111 PERMANENT SAL $7,171,313 $7,495,440 $7,691,440 $7,890,337 $324,127 33.71% $195,999 118.71% $198,898 62.49%
113 OTH THAN PERM SAL $7,082 $22,857 $17,871 $0 $15,775 1.64% -$4,986 -3.02% -$17,871 -5.62%
115 PREMIUM COMP. $467,992 $545,829 $472,404 $464,785 $77,837 8.10% -$73,425 -44.47% -$7,619 -2.39%
118 SPECIAL SERVICES $0 $0 $0 $0 $0 0.00% $0 0.00% $0 0.00%
121 BENEFITS $3,011,609 $3,172,645 $3,315,213 $3,611,361 $161,036 16.75% $142,569 86.35% $296,148 93.05%
210 TRAVEL $187,984 $203,400 $173,209 $130,583 $15,416 1.60% -$30,192 -18.29% -$42,626 -13.39%
220 TRANSPORTATION $85,862 $111,901 $77,800 $62,123 $26,039 2.71% -$34,100 -20.65% -$15,678 -4.93%
233 UTILITIES $421,904 $404,337 $454,621 $536,815 -$17,567 -1.83% $50,284 30.45% $82,194 25.83%
240 PRINTING $0 $0 $0 $0 $0 0.00% $0 0.00% $0 0.00%
250 OTHER SERVICES $656,017 $773,028 $918,355 $671,074 $117,010 12.17% $145,327 88.02% -$247,281 -77.70%
260 SUPPLIES $1,593,735 $1,829,149 $1,684,261 $1,758,316 $235,414 24.49% -$144,888 -87.75% $74,055 23.27%
310 EQUIPMENT $81,676 $88,654 $9,399 $9,163 $6,978 0.73% -$79,255 -48.00% -$236 -0.07%
410 GRANTS $11,271 $10,693 $8,424 $6,630 -$578 -0.06% -$2,269 -1.37% -$1,794 -0.56%
420 INSURANCE CLAIMS $266 $184 $232 $303 -$82 -0.01% $48 0.03% $71 0.02%
430 INTEREST $0 $0 $0 $0 $0 0.00% $0 0.00% $0 0.00%
INST TOTAL $13,696,708 $14,658,116 $14,823,228 $15,141,490 $961,407 100.00% $165,113 100.00% $318,262 100.00%
AVG POP 777 802 806 810 25 4 4
PER DIEM COST $48.30 $50.07 $50.39 $51.21 $1.78 $0.31 $0.83

109
Appendix Table 6.12: Seagoville expenditures
OCCD3 Data 1999 2000 2001 2002 00-99 01-00 02-01 Food TOTAL DU A $2,190,979 $2,588,909 $2,891,456 $2,650,531 $397,930 18.33% $302,548 10.46% -$240,925 -20.28%
Medical TOTAL DU B $2,257,988 $2,826,285 $3,354,673 $4,316,598 $568,296 26.18% $528,388 18.26% $961,924 80.96%
Oth Serv TOTAL DU C $440,312 $521,754 $557,288 $633,483 $81,442 3.75% $35,534 1.23% $76,195 6.41%
Security TOTAL DU E $6,753,141 $7,094,591 $7,944,280 $7,859,335 $341,449 15.73% $849,689 29.37% -$84,945 -7.15%
Unit Mgmt TOTAL DU F $2,933,979 $3,151,402 $3,638,984 $4,066,953 $217,423 10.02% $487,582 16.85% $427,969 36.02%
Educat TOTAL DU G $478,066 $546,917 $639,263 $647,669 $68,851 3.17% $92,346 3.19% $8,406 0.71%
Leisure TOTAL DU H $379,786 $397,673 $350,059 $390,634 $17,887 0.82% -$47,615 -1.65% $40,576 3.42%
Religious TOTAL DU J $286,826 $303,649 $294,417 $242,136 $16,823 0.77% -$9,232 -0.32% -$52,281 -4.40%
Psych TOTAL DU K $279,881 $335,330 $276,087 $351,186 $55,449 2.55% -$59,243 -2.05% $75,099 6.32%
Admin. TOTAL DU M $1,982,991 $2,224,211 $2,389,491 $2,419,217 $241,220 11.11% $165,280 5.71% $29,726 2.50%
Training TOTAL DU N $226,628 $224,508 $217,850 $208,343 -$2,121 -0.10% -$6,658 -0.23% -$9,507 -0.80%
Maint. TOTAL DU P $3,477,806 $3,643,880 $4,198,201 $4,154,105 $166,075 7.65% $554,321 19.16% -$44,097 -3.71%
111 PERMANENT SAL $11,962,109 $12,548,136 $13,260,398 $13,528,786 $586,027 27.00% $712,261 24.62% $268,389 22.59%
113 OTH THAN PERM SAL $0 $5,679 -$2,262 $0 $5,679 0.26% -$7,940 -0.27% $2,262 0.19%
115 PREMIUM COMP. $786,629 $1,099,353 $1,482,671 $1,714,036 $312,724 14.41% $383,318 13.25% $231,365 19.47%
118 SPECIAL SERVICES $14,925 $15,040 $18,150 $22,455 $115 0.01% $3,110 0.11% $4,305 0.36%
121 BENEFITS $4,577,377 $4,994,393 $5,343,287 $5,791,174 $417,016 19.21% $348,895 12.06% $447,886 37.70%
210 TRAVEL $162,364 $113,187 $139,890 $124,036 -$49,177 -2.27% $26,703 0.92% -$15,855 -1.33%
220 TRANSPORTATION $29,373 $46,482 $34,482 $26,593 $17,109 0.79% -$12,000 -0.41% -$7,889 -0.66%
233 UTILITIES $1,247,608 $1,268,381 $1,477,663 $1,354,911 $20,773 0.96% $209,282 7.23% -$122,752 -10.33%
250 OTHER SERVICES $389,691 $841,240 $923,826 $1,543,750 $451,549 20.80% $82,587 2.85% $619,923 52.18%
260 SUPPLIES $2,324,643 $2,840,340 $4,007,969 $3,831,213 $515,697 23.76% $1,167,629 40.36% -$176,756 -14.88%
310 EQUIPMENT $190,999 $86,306 $65,581 $2,230 -$104,693 -4.82% -$20,726 -0.72% -$63,351 -5.33%
410 GRANTS $1,996 $295 $180 $245 -$1,702 -0.08% -$115 0.00% $65 0.01%
420 INSURANCE CLAIMS $669 $276 $212 $762 -$394 -0.02% -$63 0.00% $550 0.05%
430 INTEREST $0 $0 $0 $0 $0 0.00% $0 0.00% $0 0.00%
INST TOTAL $21,688,385 $23,859,108 $26,752,048 $27,940,189 $2,170,723 100.00% $2,892,940 100.00% $1,188,141 100.00%
AVG POP 1,196 1,274 1,125 1,189 78 -149 64
PER DIEM COST $49.68 $51.31 $65.15 $64.38 $1.63 $13.84 -$0.77

110
Appendix Table 6.13: Texarkana expenditures
OCCD3 Data 1999 2000 2001 2002 00-99 01-00 02-01 Food TOTAL DU A $2,790,827 $2,753,654 $2,886,463 $2,558,059 -$37,173 -2.10% $132,809 10.70% -$328,404 -172.48%
Medical TOTAL DU B $3,603,201 $3,859,841 $3,778,376 $4,177,987 $256,641 14.52% -$81,465 -6.56% $399,610 209.88%
Oth Serv TOTAL DU C $673,161 $595,557 $673,558 $603,675 -$77,604 -4.39% $78,001 6.28% -$69,883 -36.70%
Security TOTAL DU E $6,308,116 $7,131,195 $7,526,614 $7,685,938 $823,079 46.56% $395,419 31.86% $159,324 83.68%
Unit Mgmt TOTAL DU F $3,215,077 $3,363,504 $3,461,884 $3,691,502 $148,428 8.40% $98,380 7.93% $229,618 120.60%
Educat TOTAL DU G $781,437 $875,773 $893,154 $792,788 $94,336 5.34% $17,382 1.40% -$100,366 -52.71%
Leisure TOTAL DU H $357,983 $402,592 $457,496 $485,081 $44,609 2.52% $54,904 4.42% $27,585 14.49%
Religious TOTAL DU J $111,821 $112,845 $205,546 $256,715 $1,024 0.06% $92,702 7.47% $51,169 26.87%
Psych TOTAL DU K $254,067 $218,061 $218,239 $231,195 -$36,006 -2.04% $179 0.01% $12,955 6.80%
Admin. TOTAL DU M $2,015,019 $2,715,182 $2,357,284 $2,504,041 $700,163 39.61% -$357,897 -28.83% $146,757 77.08%
Training TOTAL DU N $214,082 $216,746 $192,205 -$214,082 -12.11% $216,746 17.46% -$24,542 -12.89%
Maint. TOTAL DU P $3,463,081 $3,527,406 $4,121,446 $3,808,020 $64,324 3.64% $594,040 47.86% -$313,426 -164.62%
111 PERMANENT SAL $11,785,265 $12,439,209 $12,997,010 $13,363,723 $653,943 36.99% $557,801 44.94% $366,713 192.60%
113 OTH THAN PERM SAL $22,001 $38,026 $19,650 $19,472 $16,025 0.91% -$18,376 -1.48% -$177 -0.09%
115 PREMIUM COMP. $1,111,638 $1,098,910 $1,174,257 $1,467,611 -$12,727 -0.72% $75,346 6.07% $293,355 154.07%
118 SPECIAL SERVICES $13,173 $12,283 $15,475 $15,578 -$889 -0.05% $3,192 0.26% $103 0.05%
121 BENEFITS $4,282,340 $4,890,109 $5,159,667 $5,590,926 $607,769 34.38% $269,558 21.72% $431,258 226.50%
210 TRAVEL $136,626 $167,801 $142,977 $113,227 $31,175 1.76% -$24,824 -2.00% -$29,750 -15.62%
220 TRANSPORTATION $74,645 $118,555 $77,029 $100,181 $43,909 2.48% -$41,526 -3.35% $23,152 12.16%
232 OTHER RENT $0 $45,609 $49,625 $57,370 $45,609 2.58% $4,016 0.32% $7,745 4.07%
233 UTILITIES $1,162,038 $1,301,621 $1,716,472 $1,415,526 $139,583 7.90% $414,851 33.42% -$300,946 -158.06%
250 OTHER SERVICES $1,366,483 $1,798,928 $1,497,921 $1,642,905 $432,444 24.46% -$301,007 -24.25% $144,985 76.15%
260 SUPPLIES $3,520,836 $3,434,819 $3,898,169 $3,162,981 -$86,017 -4.87% $463,350 37.33% -$735,188 -386.13%
310 EQUIPMENT $285,224 $182,222 $24,656 $16,872 -$103,002 -5.83% -$157,566 -12.69% -$7,784 -4.09%
410 GRANTS $26,531 $26,954 $21,523 $20,790 $423 0.02% -$5,431 -0.44% -$733 -0.38%
420 INSURANCE CLAIMS $1,072 $562 $2,377 $44 -$510 -0.03% $1,815 0.15% -$2,333 -1.23%
430 INTEREST $0 $0 $0 $0 $0 0.00% $0 0.00% $0 0.00%
INST TOTAL $23,787,871 $25,555,608 $26,796,808 $26,987,207 $1,767,737 100.00% $1,241,200 100.00% $190,399 100.00%
AVG POP 1,655 1,674 1,714 1,571 19 40 -143
PER DIEM COST $39.38 $41.83 $42.83 $47.06 $2.45 $1.01 $4.23

111
Appendix Table 6.14: Yazoo City expenditures
OCCD3 Data 1999 2000 2001 2002 00-99 01-00 02-01 Food TOTAL DU A $2,049,085 $2,368,549 $2,602,167 $2,639,059 $319,463 16.13% $233,618 10.76% $36,892 2.43%
Medical TOTAL DU B $2,853,655 $2,892,550 $3,500,889 $4,017,647 $38,895 1.96% $608,339 28.02% $516,758 34.02%
Oth Serv TOTAL DU C $469,019 $458,335 $450,187 $614,312 -$10,684 -0.54% -$8,148 -0.38% $164,125 10.81%
Security TOTAL DU E $6,234,060 $7,239,821 $7,075,146 $7,876,290 $1,005,761 50.80% -$164,675 -7.58% $801,143 52.74%
Unit Mgmt TOTAL DU F $2,953,730 $3,252,244 $3,608,299 $3,761,617 $298,515 15.08% $356,055 16.40% $153,318 10.09%
Educat TOTAL DU G $589,832 $603,968 $751,573 $833,655 $14,136 0.71% $147,605 6.80% $82,081 5.40%
Leisure TOTAL DU H $304,093 $367,373 $394,768 $423,038 $63,279 3.20% $27,396 1.26% $28,270 1.86%
Religious TOTAL DU J $225,815 $230,957 $368,255 $255,148 $5,142 0.26% $137,298 6.32% -$113,107 -7.45%
Psych TOTAL DU K $107,366 $125,800 $126,535 $116,512 $18,433 0.93% $735 0.03% -$10,023 -0.66%
Admin. TOTAL DU M $2,247,540 $2,456,637 $2,463,041 $2,510,843 $209,097 10.56% $6,404 0.29% $47,802 3.15%
Training TOTAL DU N $284,489 $321,177 $419,754 $425,432 $36,688 1.85% $98,577 4.54% $5,678 0.37%
Maint. TOTAL DU P $2,751,121 $2,732,427 $3,460,398 $3,266,376 -$18,694 -0.94% $727,970 33.53% -$194,022 -12.77%
111 PERMANENT SAL $10,372,257 $11,085,059 $11,774,668 $12,323,333 $712,802 36.00% $689,608 31.76% $548,666 36.12%
113 OTH THAN PERM SAL $57,400 $52,337 $40,936 $38,912 -$5,064 -0.26% -$11,401 -0.53% -$2,025 -0.13%
115 PREMIUM COMP. $1,045,967 $1,391,774 $1,131,466 $1,597,283 $345,807 17.46% -$260,307 -11.99% $465,817 30.67%
121 BENEFITS $4,489,309 $4,819,590 $5,125,356 $5,789,176 $330,281 16.68% $305,766 14.08% $663,820 43.70%
210 TRAVEL $229,812 $224,368 $221,767 $213,328 -$5,445 -0.27% -$2,601 -0.12% -$8,439 -0.56%
220 TRANSPORTATION $58,093 $22,264 $34,107 $62,745 -$35,830 -1.81% $11,843 0.55% $28,639 1.89%
233 UTILITIES $1,026,129 $1,131,958 $1,288,899 $1,304,425 $105,829 5.34% $156,940 7.23% $15,527 1.02%
250 OTHER SERVICES $1,302,352 $1,301,258 $1,521,843 $1,866,690 -$1,093 -0.06% $220,585 10.16% $344,847 22.70%
260 SUPPLIES $2,462,526 $2,837,838 $4,053,598 $3,519,877 $375,312 18.95% $1,215,760 56.00% -$533,722 -35.14%
310 EQUIPMENT $0 $80,193 $0 $0 $80,193 4.05% -$80,193 -3.69% $0 0.00%
320 LAND & STRUCTURE $0 $72,975 $0 $0 $72,975 3.69% -$72,975 -3.36% $0 0.00%
410 GRANTS $22,829 $24,969 $21,000 $21,545 $2,140 0.11% -$3,969 -0.18% $545 0.04%
420 INSURANCE CLAIMS $3,018 $2,195 $7,464 $2,613 -$823 -0.04% $5,269 0.24% -$4,850 -0.32%
430 INTEREST $114 $3,061 -$92 $0 $2,947 0.15% -$3,153 -0.15% $92 0.01%
INST TOTAL $21,069,807 $23,049,838 $25,221,012 $26,739,929 $1,980,031 100.00% $2,171,174 100.00% $1,518,917 100.00%
AVG POP 1,649 1,880 1,922 2,034 231 42 112
PER DIEM COST $35.01 $33.59 $35.95 $36.02 -$1.42 $2.36 $0.07

112
This page left intentionally blank.
113
Appendix D: BOP Support costs, FY 1999–2002
Because the direct cost per inmate-day at the privately-run TCI has been just slightly higher than the per diem cost at the three comparison sites, the impact of outsourcing on taxpayers will depend on differences in support cost as between public and privately-managed facilities.
It is tempting to assign a full share of this “overhead” to publicly-managed facilities and little or nothing to private ones, arguing that the contract facilities do not actually receive this “support.” However, this approach does not reflect the financial reality of outsourcing. Although administrative overhead—generally labeled “support”—is allocated to all BOP institutions on the basis of their respective budgets, a significant proportion of these expenditures would continue even if the facilities were privatized. In other words, these support costs cannot be avoided through outsourcing.
To make realistic comparisons between public and private facilities, it is essential to distinguish between fixed and avoidable support costs. A common approach is to allocate only avoidable support costs to public facilities and to allocate only contract monitoring costs to privately-managed facilities. This technique makes it possible to determine the full financial impact of switching from public to private management at the facility level—the direct and indirect cost of running the publicly-managed facility is avoided, only to be replaced by the cost of contracting with a private sector provider of corrections services.38
38 The same results are obtained from a common alternative approach. Adding a share of all support costs to the budgets of public facilities and a share of unavoidable support to the cost of contract facilities does not change the estimated budget impact of privatization.

114
To put this approach into practice it is necessary to identify the fixed and avoidable components of BOP support cost. There are four major categories of support costs within the Federal Bureau of Prisons: Central Office, Regional Offices, Training, and National Programs. Of these cost categories, it is reasonable to assume that Central Office and Regional Office expenditures are fixed—they are not affected by the outsourcing of a limited number of federal facilities. In contrast, training costs are reasonably treated as avoidable because they would become the responsibility of any contractor assuming responsibility for a federal facility. National Program expenditures represent a mix of fixed and avoidable costs.39 Appendix Table 8 highlights the avoidable portion of support costs in each year for the period FY 1999 through 2002.
39A detailed breakdown of National Program costs is presented in Appendix Table 9.

115
Figure 14. BOP support costs for correctional facilities
Nat Program-Avoidable Cost
$92 millionNat Program
Avoidable Cost$90 million
Nat Program-Avoidable Cost
$87 millionNat Program-
Avoidable Cost$108 million
$0
$50
$100
$150
$200
$250
$300
$350Millions
Training $15,352,133 $15,527,153 $16,247,984 $17,669,193
Nat Prg-Avoidable $107,601,532 $87,329,872 $89,587,404 $91,601,436
Nat Prg-Unavoidable $15,041,427 $48,554,111 $47,828,532 $45,493,262
Regional Offices $54,557,055 $60,055,839 $62,124,003 $65,768,394
Central Office $88,368,873 $92,652,457 $97,455,634 $103,770,863
FY 1999 FY 2000 FY 2001 FY 2002

116
Figure 15. BOP direct expenditures and support costs
$158
$201
$207
$215
$123
$103
$106
$109
$0
$500
$1,000
$1,500
$2,000
$2,500
$3,000
$3,500
Millions
Avoidable $122,953,666 $102,857,025 $105,835,387 $109,270,629
Unavoidable $157,967,356 $201,262,407 $207,408,168 $215,032,518
Total Direct $2,354,037,884 $2,639,517,889 $2,924,559,979 $3,138,191,078
FY 1999 FY 2000 FY 2001 FY 2002

117
OMB circular A-76 specifies an overhead or support cost rate of 12 percent. In the case of prison privatization, this rate is far higher than the one needed to allocate the avoidable portion of support costs—it exceeds even the rate needed to allocate the full amount of support costs to secure facilities. As figure 10 shows, the support cost rate needed to make realistic comparisons between public and private facilities falls in the range of 3.5 percent to 5.5 percent. Table 7 summarizes the rates reported in figure 10.
Appendix Table 7. BOP support cost rates, FY 1998–2002 1998 1999 2000 2001 2002 Avoidable overhead costs
3.65% 5.22% 3.9% 3.62% 3.48%
Unavoidable overhead costs
8.19% 6.71% 7.62% 7.09% 6.85
Total overhead rate 11.84% 11.93% 11.52% 10.71% 10.33%

118
Appendix Table 8. BOP support cost breakdown FY 2002 FY 2001
Gross Avoidable Unavoidable Gross Avoidable Unavoidable
Support cost components
Regional offices 65,768,394 65,768,394 62,124,003 62,124,003
Central office 103,770,863 103,770,863 97,455,634 97,455,634
Training 17,669,193 17,669,193 16,247,984 16,247,984
National programs 137,094,698 91,601,436 45,493,262 137,415,935 89,587,404 47,828,532
Total support costs, adult facilities 324,303,147 109,270,629 215,032,518 313,243,556 105,835,387 207,408,168
Support rate 10.61% 3.57% 7.04% 10.99% 3.71% 7.28%
Secure institutions: Direct Support Rate Minimum 121,596,973 12,901,547 10.61% 116,151,361 12,761,340 10.99%Low 543,615,467 57,678,084 10.61% 520,749,115 57,213,761 10.99%Medium 705,645,684 74,869,633 10.61% 684,842,301 75,242,382 10.99%High 282,847,315 30,010,351 10.61% 246,730,026 27,107,781 10.99%Detention 257,208,722 27,290,074 10.61% 249,128,725 27,371,321 10.99%Admin 27,939,810 2,964,439 10.61% 27,570,878 3,029,162 10.99%Complex 423,388,883 44,921,936 10.61% 408,157,886 44,843,567 10.99%Medical 343,500,165 36,445,672 10.61% 317,020,946 34,830,517 10.99%
Private (incl. Taft) 166,248,834 8,977,437 5.40% 145,969,866 7,964,897 5.46%
Total, active secure 2,871,991,852 296,059,173 2,716,321,105 290,364,728
Contract Community Corrections 146,942,160 130,336,055
Contract state & local 207,098,281 180,948,515
Total, active institutions 3,226,032,293 296,059,173 3,027,605,675 290,364,728
Taft (activation phase) NIC 20,560,004 2,181,435 10.61% 24,987,117 2,745,289 10.99%
Other off-line 245,639,221 26,062,539 10.61% 183,251,757 20,133,538 10.99%
Total BOP 3,492,231,519 324,303,147 3,235,844,550 313,243,556
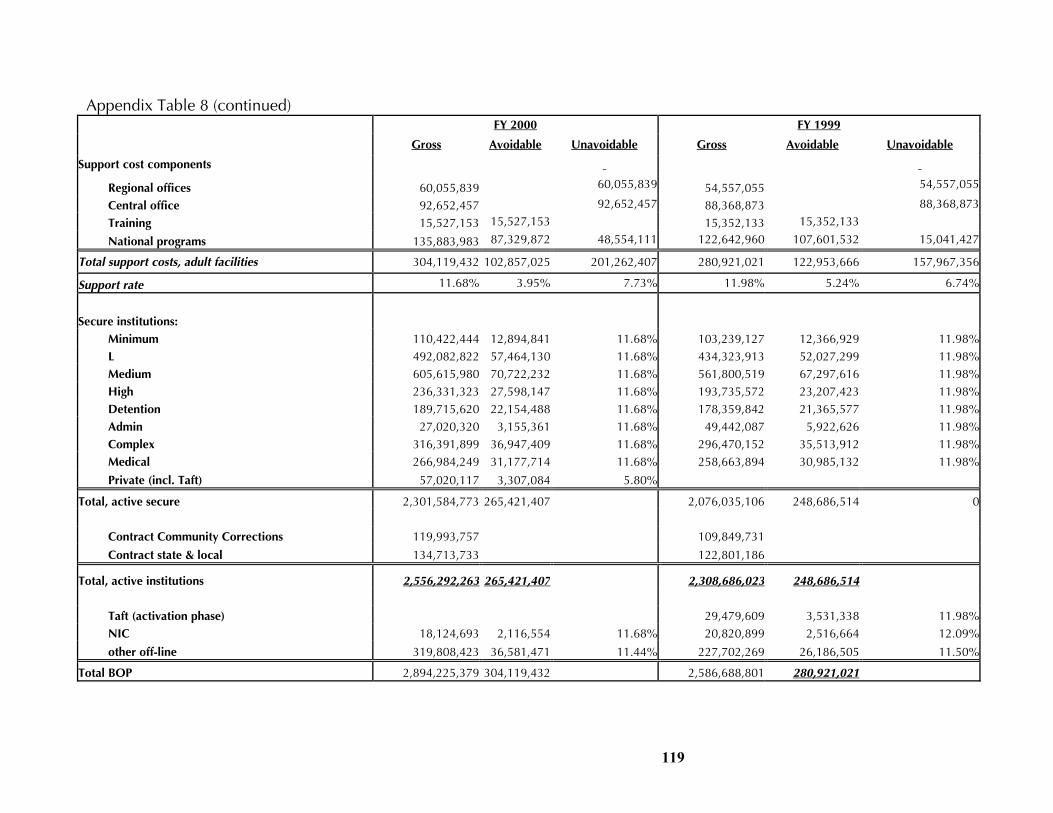
119
Appendix Table 8 (continued) FY 2000 FY 1999 Gross Avoidable Unavoidable Gross Avoidable Unavoidable Support cost components
Regional offices 60,055,839 60,055,839 54,557,055 54,557,055
Central office 92,652,457 92,652,457 88,368,873 88,368,873
Training 15,527,153 15,527,153 15,352,133 15,352,133
National programs 135,883,983 87,329,872 48,554,111 122,642,960 107,601,532 15,041,427
Total support costs, adult facilities 304,119,432 102,857,025 201,262,407 280,921,021 122,953,666 157,967,356
Support rate 11.68% 3.95% 7.73% 11.98% 5.24% 6.74%
Secure institutions:
Minimum 110,422,444 12,894,841 11.68% 103,239,127 12,366,929 11.98%L 492,082,822 57,464,130 11.68% 434,323,913 52,027,299 11.98%Medium 605,615,980 70,722,232 11.68% 561,800,519 67,297,616 11.98%High 236,331,323 27,598,147 11.68% 193,735,572 23,207,423 11.98%Detention 189,715,620 22,154,488 11.68% 178,359,842 21,365,577 11.98%Admin 27,020,320 3,155,361 11.68% 49,442,087 5,922,626 11.98%Complex 316,391,899 36,947,409 11.68% 296,470,152 35,513,912 11.98%Medical 266,984,249 31,177,714 11.68% 258,663,894 30,985,132 11.98%
Private (incl. Taft) 57,020,117 3,307,084 5.80%
Total, active secure 2,301,584,773 265,421,407 2,076,035,106 248,686,514 0
Contract Community Corrections 119,993,757 109,849,731 Contract state & local 134,713,733 122,801,186
Total, active institutions 2,556,292,263 265,421,407 2,308,686,023 248,686,514
Taft (activation phase) 29,479,609 3,531,338 11.98%NIC 18,124,693 2,116,554 11.68% 20,820,899 2,516,664 12.09%
other off-line 319,808,423 36,581,471 11.44% 227,702,269 26,186,505 11.50%
Total BOP 2,894,225,379 304,119,432 2,586,688,801 280,921,021

120
Appendix Table 9. National program costs itemized FY 2002 FY 2001 BUDGET ACTIVITY AND PROGRAM Gross ($) Avoidable($) Unavoidable($) Gross ($) Avoidable($)Unavoidable($)BA1 INMATE CARE & PROGRAMS DU B MEDICAL SERVICES 533,424 533,424 319,517 319,517 0 C OTHER INMATE SERVICES 0 0 0 0 F UNIT MANAGEMENT 165,038 165,038 97,650 97,650 0 G GEN. & OCCUPA. EDUC. 626,008 626,008 652,401 652,401 0TOTAL BA1 1,324,469 1,324,469 1,069,568 1,069,568 0
BA2 INSTITUTION SECURITY, ADMINISTRATION, AND MAINTENANCE
DU E INSTITUTION SECURITY 14,900,460 14,900,460 14,069,022 14,069,022 0 M INSTITUTION ADMINISTRATION: NATIONAL AWARDS 159,240 159,240 9,443 9,443 WORKERS COMPENSATION 25,275,380 25,275,380 22,639,681 22,639,681 0 UNEMPLOYMENT COMPENSATION 1,045,000 1,045,000 1,045,000 1,045,000 0 GSA RENT -863,625 -863,625 1,271,000 1,271,000 POSTAGE 2,329,528 2,329,528 2,280,000 2,280,000 0 UNICOR FORMS 1,900,000 1,900,000 2,023,365 2,023,365 FEDERAL TELEPHONE SERVICE 8,029,754 8,029,754 10,358,873 10,358,873 0 DOJ INVESTIGATION SUPPORT 85,283 85,283 76,723 76,723 CONSULTANT CREDIT REPORTS 120,610 120,610 54,164 54,164 0 MEDICAL CREDENTIAL VER 30,000 30,000 25,667 25,667 0 JUSTICE DATA PROCESSING 13,611,166 13,611,166 12,685,079 12,685,079 FMIS/HRMIS 5,123,002 5,123,002 5,769,279 5,769,279 SALARY CHECK PROCESSING 5,320,000 5,320,000 5,410,864 5,410,864 0 FINANCIAL STATEMENTS 1,175,662 1,175,662 1,053,631 1,053,631 EEO INVESTIGATIONS 450,112 450,112 606,894 606,894 0 OTHER SERVICES 327,200 327,200 7,856 7,856 NON-CASH AWARDS 64,870 64,870 INSURANCE CLAIMS 385,714 385,714 190,838 190,838 0 UNREFUNDED UNICOR RELOCATION CHARGES 598,137 598,137 45,000 45,000 RELOCATION CHARGES 83,299 83,299 52,038 52,038 RELOCATION SERVICES OPERATIONS 87,224 87,224 62,408 62,408 0 MISC SERVICES 5,611,632 5,611,632 4,117,584 4,117,584 0 OTHER: REFUND OF FMS MIGRATION COSTS -310,368 -310,368 OTHER: STATE PRISONER BILLINGS WRITE-OFF -618,136 -618,136 TOTAL DU M 70,573,950 48,768,253 21,805,697 69,232,120 46,844,010 22,388,110

121
FY 2002 FY 2001 BUDGET ACTIVITY AND PROGRAM Gross ($) Avoidable($) Unavoidable($) Gross ($) Avoidable($)Unavoidable($) N STAFF TRAINING 2,208 2,208 1,101 1,101 0 P INSTITUTION MAINTENANCE 2,146,397 2,146,397 1,539,658 1,539,658 0TOTAL BA2 87,623,015 65,817,318 21,805,697 84,841,901 62,453,791 22,388,110BA4 MANAGEMENT & ADMINISTRATION DU X ADMINISTRATION: CO BUILDING SECURITY 1,580,907 1,580,907 1,547,861 1,547,861 CO/RO BUILDING LEASE 10,459,368 10,459,368 9,911,265 9,911,265 WORKERS COMPENSATION 1,330,300 1,330,300 1,191,562 1,191,562 UNEMPLOYMENT COMPENSATION 55,000 55,000 55,000 55,000 INSURANCE CLAIMS 0 99,000 99,000 TELEPHONE SERVICES 3,225,797 3,225,797 3,137,582 3,137,582 UNICOR FORMS 0 111,430 111,430
BACKGROUNDS, POSTAGE, SALARY CHECKS, FMIS/HRMIS, DATA CENTER, ETC. 4,550,412 4,550,412 5,222,676 5,222,676
PERSONNEL COSTS/TRAVEL 6,832 6,832 11,054 11,054TOTAL BA4 21,208,616 21,208,616 21,287,430 21,287,430 SUBTOTAL - GROSS NATIONAL PROGRAMS CHARGES * 110,156,100 67,141,787 43,014,312107,198,899 63,523,359 43,675,540 ADJUSTMENTS TO GROSS: ** X 156 CHARGES TO CO -231 -231PROJECT 27Q (DEATH ROW) CHARGES TO TERRE HAUTE -72,754 -72,754
DATA PROCESSING CHARGES (M 158) CHARGES FROM FIELD, CO (75%) 7,801,081 7,801,081 7,865,283 7,865,283 0
LAW LIBRARY CHARGES (G75) FROM FIELD, CO 2,356,367 2,356,367 2,139,712 2,139,712 0
BACKGROUND INVESTIGATIONS/REIVESTIGATIONS FROM FIELD, CO (M 197) 7,862,987 7,650,936 212,051 8,218,536 7,996,896 221,639
VEHICLE PURCHASES (P 136) 6,842,334 6,842,334 4,998,220 4,998,220 0TERRE HAUTE BUS OPS (P 373) 1,425,693 1,425,693 1,321,633 1,321,633 0PRIVATIZATION, D.C. INITIATIVE FROM FIELD, CO (T 450, 451) 635,313 635,313 2,137,077 2,137,077SECURITY & BACKGROUND INVESTIGATION OPS (22MS) 1,710,408 1,710,408 1,611,113 1,611,113 0NATIONAL AWARD CHARGES FROM FIELD, CO (M 449) 178,413 178,413 195,753 195,753AUDITED FINANCIAL STATEMENTS, QA VISITS (M 456) 110,594 110,594 160,856 160,856 0D.C. RECORDS OFFICE CHARGES FROM FIELD, CO (F 429) 306,021 306,021 119,795 119,795FURLOUGH TRANSFER CHARGES FROM FIELD (F66 466) 202,656 202,656 89,169 89,169 0

122
FY 2002 FY 2001 BUDGET ACTIVITY AND PROGRAM Gross ($) Avoidable($) Unavoidable($) Gross ($) Avoidable($)Unavoidable($)FORMS CHARGES FROM CO (M 197) 162,296 162,296 236,839 236,839HRM AUTOMATION (22M4) 12,511 12,511
UNREFUNDED UNICOR RELOCATION CHARGES TO OFFLINE -598,137 -598,137 -45,000 -45,000
RELOCATION SERVICES OPS SALARIES FROM CO (M 156) 1,582,993 1,582,993 1,359,872 1,359,872UNICOR DIRECT MAIL REFUNDS less DU R (COMM CORR) LEASE CHARGES SPECIAL PROJECT CHARGES -3,652,930 -3,652,930 -118,838 -118,838 TOTAL ADJUSTMENTS TO NATIONAL PROGRAMS TOTAL 26,938,598 24,459,649 2,478,949 30,217,037 26,064,045 4,152,992GRAND TOTAL - NET NATIONAL PROGRAMS CHARGES 137,094,698 91,601,436 45,493,262137,415,935 89,587,404 47,828,532

123
Appendix Table 9 (continued) FY 2000 FY 1999 BUDGET ACTIVITY AND PROGRAM Gross Avoidable Unavoidable Gross Avoidable UnavoidableBA1 INMATE CARE & PROGRAMS DU B MEDICAL SERVICES 943,457 943,457 0 649,148 649,148 0 C OTHER INMATE SERVICES 8,000 8,000 0 4,208,870 4,208,870 0 F UNIT MANAGEMENT 179,934 179,934 0 338,407 338,407 0 G GEN. & OCCUPA. EDUC. 591,232 591,232 0 590,025 590,025 0TOTAL BA1 1,722,624 1,722,624 0 5,786,450 5,786,450 0
BA2 INSTITUTION SECURITY, ADMINISTRATION, AND MAINTENANCE
DU E INSTITUTION SECURITY 11,817,993 11,817,993 0 13,296,583 13,296,583 0 M INSTITUTION ADMINISTRATION: NATIONAL AWARDS 153,190 153,190 163,250 163,250 WORKERS COMPENSATION 20,930,489 20,930,489 20,451,724 20,451,724 UNEMPLOYMENT COMPENSATION 1,045,000 1,045,000 1,100,000 1,100,000 GSA RENT 301,647 301,647 1,702,429 1,702,429 POSTAGE 2,308,773 2,308,773 UNICOR FORMS 1,628,699 1,628,699 FEDERAL TELEPHONE SERVICE 10,520,802 10,520,802 DOJ INVESTIGATION SUPPORT 77,902 77,902 CONSULTANT CREDIT REPORTS 92,917 92,917 MEDICAL CREDENTIAL VER 28,000 28,000 JUSTICE DATA PROCESSING 10,582,108 10,582,108 FMIS/HRMIS 7,561,444 7,561,444 SALARY CHECK PROCESSING 4,750,000 4,750,000 FINANCIAL STATEMENTS 790,405 790,405 EEO INVESTIGATIONS OTHER SERVICES 9,310,464 9,310,464 NON-CASH AWARDS 34,765 34,765 INSURANCE CLAIMS 288,500 288,500 UNREFUNDED UNICOR RELOCATION CHARGES RELOCATION CHARGES RELOCATION SERVICES OPERATIONS 25,406 25,406 MISC SERVICES 45,222,125 45,222,125 OTHER: REFUND OF FMS MIGRATION COSTS OTHER: STATE PRISONER BILLINGS WRITE-OFF -1,416,073 -1,416,073 TOTAL DU M 67,385,737 39,989,886 27,395,850 70,268,227 66,773,849 3,494,378
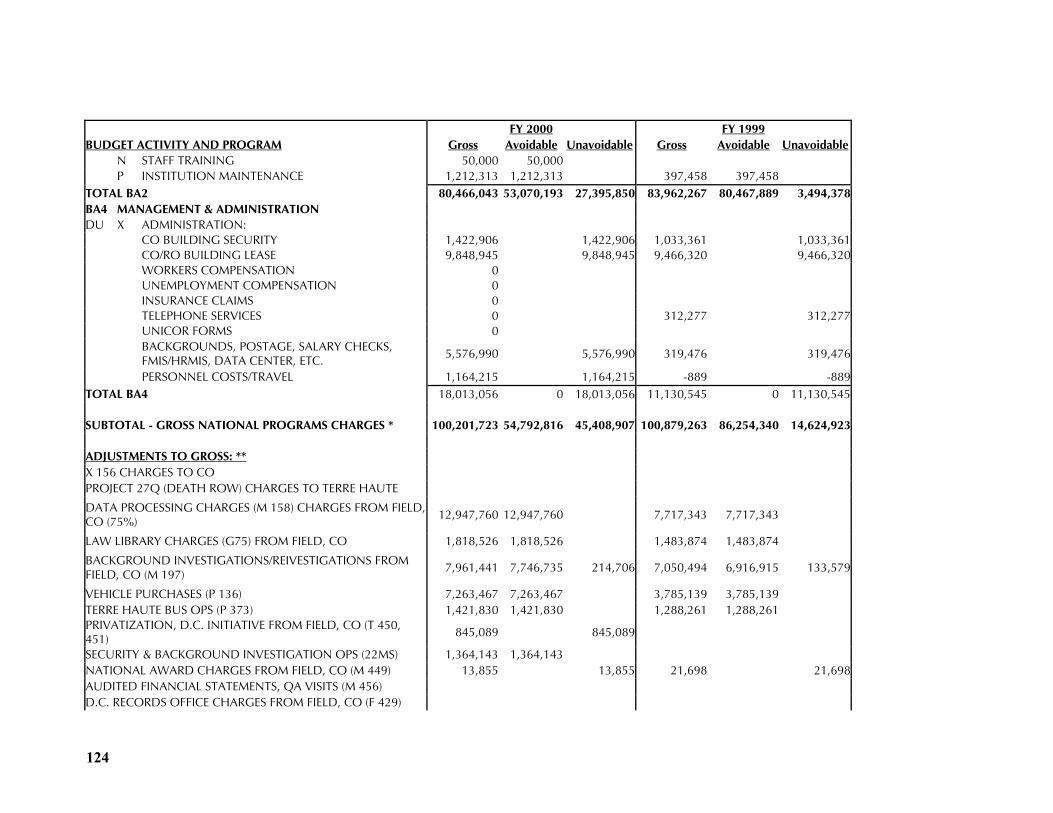
124
FY 2000 FY 1999 BUDGET ACTIVITY AND PROGRAM Gross Avoidable Unavoidable Gross Avoidable Unavoidable N STAFF TRAINING 50,000 50,000 P INSTITUTION MAINTENANCE 1,212,313 1,212,313 397,458 397,458 TOTAL BA2 80,466,043 53,070,193 27,395,850 83,962,267 80,467,889 3,494,378BA4 MANAGEMENT & ADMINISTRATION DU X ADMINISTRATION: CO BUILDING SECURITY 1,422,906 1,422,906 1,033,361 1,033,361 CO/RO BUILDING LEASE 9,848,945 9,848,945 9,466,320 9,466,320 WORKERS COMPENSATION 0 UNEMPLOYMENT COMPENSATION 0 INSURANCE CLAIMS 0 TELEPHONE SERVICES 0 312,277 312,277 UNICOR FORMS 0
BACKGROUNDS, POSTAGE, SALARY CHECKS, FMIS/HRMIS, DATA CENTER, ETC. 5,576,990 5,576,990 319,476 319,476
PERSONNEL COSTS/TRAVEL 1,164,215 1,164,215 -889 -889TOTAL BA4 18,013,056 0 18,013,056 11,130,545 0 11,130,545 SUBTOTAL - GROSS NATIONAL PROGRAMS CHARGES * 100,201,723 54,792,816 45,408,907 100,879,263 86,254,340 14,624,923 ADJUSTMENTS TO GROSS: ** X 156 CHARGES TO CO PROJECT 27Q (DEATH ROW) CHARGES TO TERRE HAUTE
DATA PROCESSING CHARGES (M 158) CHARGES FROM FIELD, CO (75%) 12,947,760 12,947,760 7,717,343 7,717,343
LAW LIBRARY CHARGES (G75) FROM FIELD, CO 1,818,526 1,818,526 1,483,874 1,483,874
BACKGROUND INVESTIGATIONS/REIVESTIGATIONS FROM FIELD, CO (M 197) 7,961,441 7,746,735 214,706 7,050,494 6,916,915 133,579
VEHICLE PURCHASES (P 136) 7,263,467 7,263,467 3,785,139 3,785,139 TERRE HAUTE BUS OPS (P 373) 1,421,830 1,421,830 1,288,261 1,288,261 PRIVATIZATION, D.C. INITIATIVE FROM FIELD, CO (T 450, 451) 845,089 845,089
SECURITY & BACKGROUND INVESTIGATION OPS (22MS) 1,364,143 1,364,143 NATIONAL AWARD CHARGES FROM FIELD, CO (M 449) 13,855 13,855 21,698 21,698AUDITED FINANCIAL STATEMENTS, QA VISITS (M 456) D.C. RECORDS OFFICE CHARGES FROM FIELD, CO (F 429)

125
FY 2000 FY 1999 BUDGET ACTIVITY AND PROGRAM Gross Avoidable Unavoidable Gross Avoidable UnavoidableFURLOUGH TRANSFER CHARGES FROM FIELD (F66 466) FORMS CHARGES FROM CO (M 197) 199,326 199,326 359,713 359,713HRM AUTOMATION (22M4) 155,661 155,661
UNREFUNDED UNICOR RELOCATION CHARGES TO OFFLINE
RELOCATION SERVICES OPS SALARIES FROM CO (M 156) 1,846,822 1,846,822 32,657 32,657UNICOR DIRECT MAIL REFUNDS -30,313 -30,313less DU R (COMM CORR) LEASE CHARGES -100,830 -100,830SPECIAL PROJECT CHARGES TOTAL ADJUSTMENTS TO NATIONAL PROGRAMS TOTAL 35,682,260 32,562,461 3,119,799 21,763,697 21,347,193 416,504GRAND TOTAL - NET NATIONAL PROGRAMS CHARGES 135,883,983 87,355,277 48,528,705 122,642,960 107,601,532 15,041,427

126
This page left intentionally blank.
127
Appendix E: Facility Staffing Patterns, FY 1999 through 2002
In this appendix, we list the staffing plans for a group of low security BOP facilities.

128
Staff FTEs by Facility, August 2002
Division ASH BAS BIG ELK FOR LAT LOR MIL PET SAF SEA TEX YAZ Avg., Non-
Comp.
Avg., Comp.
Site Diff.
ADMINSYS 10 10 10 15 13 17 7 16 9 6 11 9 12 10.5 13.3 2.8 BUSINESS 16 13 15 18 20 20 13 15 15 14 16 17 18 15.4 18.7 3.3 CMPSRV 2 2 2 2 2 3 1 2 2 2 2 1.6 2.0 0.4 CORRSVCS 116 89 93 143 122 153 90 139 129 59 118 115 121 110.1 128.7 18.6 EDUCVT 14 9 10 13 8 11 8 9 13 7 8 7 10 9.6 10.3 0.7 FOODSERV 16 15 13 18 13 21 13 18 15 9 18 16 11 15.4 14.0 -1.4 HOSPITAL 16 16 16 19 23 21 11 17 15 9 18 19 17 15.8 19.7 3.9
PHS (actual) 3 3 4 7 4 0 4 4 5 3 5 4 4 3.5 5.0 1.5 INMSRV 3 3 4 2 2 2 4 2 3 2 2.1 2.0 -0.1 MECHANIC 29 21 21 25 21 31 24 32 30 19 26 25 21 25.8 22.3 -3.5 PERSONEL 7 5 6 9 8 7 3 9 6 4 6 6 7 5.9 8.0 2.1 PSYCH 5 10 4 5 3 10 3 8 5 3 12 8 2 6.8 3.3 -3.5 RECREATN 6 7 6 9 8 8 5 7 6 4 5 7 6 6.1 7.7 1.6 RELIGION 3 2 2 2 3 3 2 3 4 1 2 3 3 2.5 2.7 0.2 UNTCSMGT 39 27 23 46 42 36 24 38 33 19 31 35 41 30.5 43.0 12.5 WARDNOFF 7 8 7 10 8 9 5 10 9 9 7 10 5 8.1 7.7 -0.4
Total, no UNICOR 292 237 235 345 298 352 215 329 298 166 287 286 282 269.7 308.3 38.6
ADP 1,394 1,445 927 2,335 2,018 1,728 1,214 1,594 1,447 810 1,189 1,571 2,034 1,331.9 2,129.0 797.1
Staff FTEs per 100 Inmates, August 2002
Division ASH BAS BIG ELK FOR LAT LOR MIL PET SAF SEA TEX YAZ
Avg., Non-
Comp.
Avg., Comp.
Site Diff.
ADMINSYS 0.72 0.69 1.08 0.64 0.64 0.98 0.58 1 0.62 0.74 0.93 0.57 0.59 0.8 0.6 -0.2 BUSINESS 1.15 0.9 1.62 0.77 0.99 1.16 1.07 0.94 1.04 1.73 1.35 1.08 0.88 1.2 0.9 -0.3 CMPSRV 0.14 0.14 0.22 0.09 0.1 0.17 0.08 0.13 0 0 0.17 0.13 0.1 0.1 0.1 0.0 CORRSVCS 8.32 6.16 10 6.12 6.05 8.85 7.41 8.72 8.91 7.28 9.92 7.32 5.95 8.3 6.0 -2.2 EDUCVT 1 0.62 1.08 0.56 0.4 0.64 0.66 0.56 0.9 0.86 0.67 0.45 0.49 0.7 0.5 -0.2 FOODSERV 1.15 1.04 1.4 0.77 0.64 1.22 1.07 1.13 1.04 1.11 1.51 1.02 0.54 1.2 0.7 -0.5 HOSPITAL 1.15 1.11 1.73 0.81 1.14 1.22 0.91 1.07 1.04 1.11 1.51 1.21 0.84 1.2 0.9 -0.3 PHS (AUTH) 0.22 0.21 0.43 0.3 0.2 0 0.33 0.25 0.35 0.37 0.42 0.25 0.2 0.3 0.2 0.0 INMSRV 0.22 0 0.32 0.17 0 0.12 0.16 0.13 0.28 0 0.17 0.19 0.1 0.2 0.1 -0.1 MECHANIC 2.08 1.45 2.27 1.07 1.04 1.79 1.98 2.01 2.07 2.35 2.19 1.59 1.03 1.9 1.0 -0.9 PERSONEL 0.5 0.35 0.65 0.39 0.4 0.41 0.25 0.56 0.41 0.49 0.5 0.38 0.34 0.4 0.4 -0.1 PSYCH 0.36 0.69 0.43 0.21 0.15 0.58 0.25 0.5 0.35 0.37 1.01 0.51 0.1 0.5 0.2 -0.4 RECREATN 0.43 0.48 0.65 0.39 0.4 0.46 0.41 0.44 0.41 0.49 0.42 0.45 0.29 0.5 0.4 -0.1 RELIGION 0.22 0.14 0.22 0.09 0.15 0.17 0.16 0.19 0.28 0.12 0.17 0.19 0.15 0.2 0.1 -0.1 UNTCSMGT 2.8 1.87 2.48 1.97 2.08 2.08 1.98 2.38 2.28 2.35 2.61 2.23 2.02 2.3 2.0 -0.3 WARDNOFF 0.5 0.55 0.76 0.43 0.4 0.52 0.41 0.63 0.62 1.11 0.59 0.64 0.25 0.6 0.4 -0.2
Total, no UNICOR 20.9 16.4 25.4 14.8 14.8 20.4 17.7 20.6 20.6 20.5 24.1 18.2 13.9 20.2 14.5 -5.8
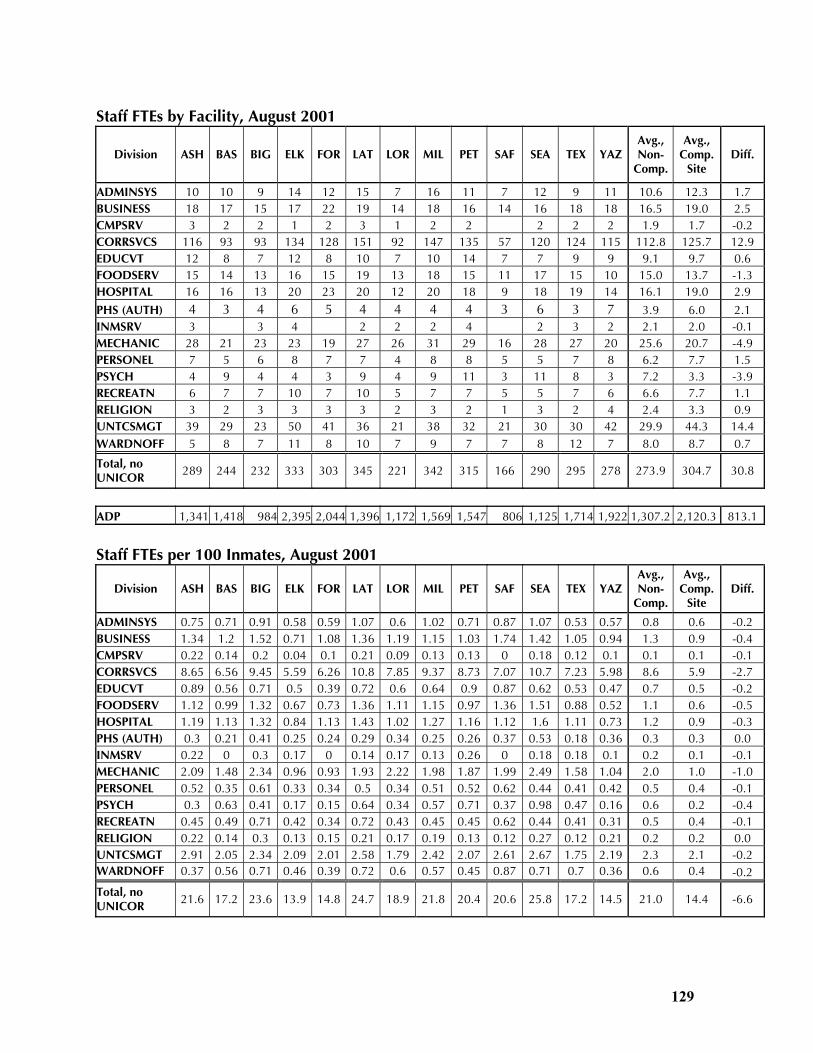
129
Staff FTEs by Facility, August 2001
Division ASH BAS BIG ELK FOR LAT LOR MIL PET SAF SEA TEX YAZ Avg., Non-
Comp.
Avg., Comp.
Site Diff.
ADMINSYS 10 10 9 14 12 15 7 16 11 7 12 9 11 10.6 12.3 1.7 BUSINESS 18 17 15 17 22 19 14 18 16 14 16 18 18 16.5 19.0 2.5 CMPSRV 3 2 2 1 2 3 1 2 2 2 2 2 1.9 1.7 -0.2 CORRSVCS 116 93 93 134 128 151 92 147 135 57 120 124 115 112.8 125.7 12.9 EDUCVT 12 8 7 12 8 10 7 10 14 7 7 9 9 9.1 9.7 0.6 FOODSERV 15 14 13 16 15 19 13 18 15 11 17 15 10 15.0 13.7 -1.3 HOSPITAL 16 16 13 20 23 20 12 20 18 9 18 19 14 16.1 19.0 2.9
PHS (AUTH) 4 3 4 6 5 4 4 4 4 3 6 3 7 3.9 6.0 2.1 INMSRV 3 3 4 2 2 2 4 2 3 2 2.1 2.0 -0.1 MECHANIC 28 21 23 23 19 27 26 31 29 16 28 27 20 25.6 20.7 -4.9 PERSONEL 7 5 6 8 7 7 4 8 8 5 5 7 8 6.2 7.7 1.5 PSYCH 4 9 4 4 3 9 4 9 11 3 11 8 3 7.2 3.3 -3.9 RECREATN 6 7 7 10 7 10 5 7 7 5 5 7 6 6.6 7.7 1.1 RELIGION 3 2 3 3 3 3 2 3 2 1 3 2 4 2.4 3.3 0.9 UNTCSMGT 39 29 23 50 41 36 21 38 32 21 30 30 42 29.9 44.3 14.4 WARDNOFF 5 8 7 11 8 10 7 9 7 7 8 12 7 8.0 8.7 0.7
Total, no UNICOR 289 244 232 333 303 345 221 342 315 166 290 295 278 273.9 304.7 30.8
ADP 1,341 1,418 984 2,395 2,044 1,396 1,172 1,569 1,547 806 1,125 1,714 1,922 1,307.2 2,120.3 813.1
Staff FTEs per 100 Inmates, August 2001
Division ASH BAS BIG ELK FOR LAT LOR MIL PET SAF SEA TEX YAZ Avg., Non-
Comp.
Avg., Comp.
Site Diff.
ADMINSYS 0.75 0.71 0.91 0.58 0.59 1.07 0.6 1.02 0.71 0.87 1.07 0.53 0.57 0.8 0.6 -0.2 BUSINESS 1.34 1.2 1.52 0.71 1.08 1.36 1.19 1.15 1.03 1.74 1.42 1.05 0.94 1.3 0.9 -0.4 CMPSRV 0.22 0.14 0.2 0.04 0.1 0.21 0.09 0.13 0.13 0 0.18 0.12 0.1 0.1 0.1 -0.1 CORRSVCS 8.65 6.56 9.45 5.59 6.26 10.8 7.85 9.37 8.73 7.07 10.7 7.23 5.98 8.6 5.9 -2.7 EDUCVT 0.89 0.56 0.71 0.5 0.39 0.72 0.6 0.64 0.9 0.87 0.62 0.53 0.47 0.7 0.5 -0.2 FOODSERV 1.12 0.99 1.32 0.67 0.73 1.36 1.11 1.15 0.97 1.36 1.51 0.88 0.52 1.1 0.6 -0.5 HOSPITAL 1.19 1.13 1.32 0.84 1.13 1.43 1.02 1.27 1.16 1.12 1.6 1.11 0.73 1.2 0.9 -0.3 PHS (AUTH) 0.3 0.21 0.41 0.25 0.24 0.29 0.34 0.25 0.26 0.37 0.53 0.18 0.36 0.3 0.3 0.0 INMSRV 0.22 0 0.3 0.17 0 0.14 0.17 0.13 0.26 0 0.18 0.18 0.1 0.2 0.1 -0.1 MECHANIC 2.09 1.48 2.34 0.96 0.93 1.93 2.22 1.98 1.87 1.99 2.49 1.58 1.04 2.0 1.0 -1.0 PERSONEL 0.52 0.35 0.61 0.33 0.34 0.5 0.34 0.51 0.52 0.62 0.44 0.41 0.42 0.5 0.4 -0.1 PSYCH 0.3 0.63 0.41 0.17 0.15 0.64 0.34 0.57 0.71 0.37 0.98 0.47 0.16 0.6 0.2 -0.4 RECREATN 0.45 0.49 0.71 0.42 0.34 0.72 0.43 0.45 0.45 0.62 0.44 0.41 0.31 0.5 0.4 -0.1 RELIGION 0.22 0.14 0.3 0.13 0.15 0.21 0.17 0.19 0.13 0.12 0.27 0.12 0.21 0.2 0.2 0.0 UNTCSMGT 2.91 2.05 2.34 2.09 2.01 2.58 1.79 2.42 2.07 2.61 2.67 1.75 2.19 2.3 2.1 -0.2 WARDNOFF 0.37 0.56 0.71 0.46 0.39 0.72 0.6 0.57 0.45 0.87 0.71 0.7 0.36 0.6 0.4 -0.2
Total, no UNICOR 21.6 17.2 23.6 13.9 14.8 24.7 18.9 21.8 20.4 20.6 25.8 17.2 14.5 21.0 14.4 -6.6

130
Staff FTEs by Facility, August 2000
Division ASH BAS BIG ELK FOR LAT LOR MIL PET SAF SEA TEX YAZ
Avg., Non-
Comp.
Avg., Comp.
Site Diff.
ADMINSYS 10 8 10 15 13 12 7 15 14 7 11 11 12 10.5 13.3 2.8 BUSINESS 17 17 15 18 21 14 16 18 17 15 16 17 19 16.2 19.3 3.1 CMPSRV 1 1 2 2 2 2 1 3 2 2 2 1 1.6 1.7 0.1 CORRSVCS 120 92 98 124 130 107 77 141 133 60 121 119 120 106.8 124.7 17.9 EDUCVT 14 8 7 11 9 7 6 10 13 6 7 10 8 8.8 9.3 0.5 FOODSERV 16 12 14 15 16 16 12 17 13 9 17 17 9 14.3 13.3 -1.0 HOSPITAL 15 15 13 18 23 18 13 22 16 9 17 19 14 15.7 18.3 2.6
PHS (AUTH) 6 3 4 6 3 3 5 4 4 4 6 4 6 4.3 5.0 0.7 INMSRV 3 2 4 2 2 2 4 2 3 2 2.0 2.0 0.0 MECHANIC 28 22 22 22 20 28 26 30 29 17 28 24 19 25.4 20.3 -5.1 PERSONEL 6 7 6 8 7 7 4 9 7 5 5 7 9 6.3 8.0 1.7 PSYCH 5 10 4 5 5 9 3 11 11 2 11 8 4 7.4 4.7 -2.7 RECREATN 7 6 5 9 7 7 5 7 7 5 6 6 6 6.1 7.3 1.2 RELIGION 3 2 3 3 3 3 2 3 2 2 3 1 2 2.4 2.7 0.3 UNTCSMGT 41 29 25 47 42 33 20 35 30 19 30 31 37 29.3 42.0 12.7 WARDNOFF 7 7 7 8 7 7 7 10 11 8 7 10 9 8.1 8.0 -0.1
Total, no UNICOR 299 239 237 315 308 275 206 337 313 168 289 289 277 265.2 300.0 34.8
ADP 1,353 1,320 1,259 2,238 2,085 1,346 875 1,474 1,504 802 1,274 1,674 1,880 1288.1 2067.7 779.6
Staff FTEs per 100 Inmates, August 2000
Division ASH BAS BIG ELK FOR LAT LOR MIL PET SAF SEA TEX YAZ
Avg., Non-
Comp.
Avg., Comp.
Site Diff.
ADMINSYS 0.74 0.61 0.79 0.67 0.62 0.89 0.80 1.02 0.93 0.87 0.86 0.66 0.64 0.82 0.64 -0.2 BUSINESS 1.26 1.29 1.19 0.80 1.01 1.04 1.83 1.22 1.13 1.87 1.26 1.02 1.01 1.26 0.94 -0.3 CMPSRV 0.07 0.08 0.16 0.09 0.10 0.15 0.11 0.20 0.13 0.00 0.16 0.12 0.05 0.12 0.08 0.0 CORRSVCS 8.87 6.97 7.78 5.54 6.24 7.95 8.80 9.57 8.84 7.48 9.50 7.11 6.38 8.29 6.03 -2.3 EDUCVT 1.03 0.61 0.56 0.49 0.43 0.52 0.69 0.68 0.86 0.75 0.55 0.60 0.43 0.68 0.45 -0.2 FOODSERV 1.18 0.91 1.11 0.67 0.77 1.19 1.37 1.15 0.86 1.12 1.33 1.02 0.48 1.11 0.64 -0.5 HOSPITAL 1.11 1.14 1.03 0.80 1.10 1.34 1.49 1.49 1.06 1.12 1.33 1.14 0.74 1.22 0.89 -0.3 PHS (AUTH) 0.44 0.23 0.32 0.27 0.14 0.22 0.57 0.27 0.27 0.50 0.47 0.24 0.32 0.33 0.24 -0.1 INMSRV 0.22 0.00 0.16 0.18 0.00 0.15 0.23 0.14 0.27 0.00 0.16 0.18 0.11 0.16 0.10 -0.1 MECHANIC 2.07 1.67 1.75 0.98 0.96 2.08 2.97 2.04 1.93 2.12 2.20 1.43 1.01 1.97 0.98 -1.0 PERSONEL 0.44 0.53 0.48 0.36 0.34 0.52 0.46 0.61 0.47 0.62 0.39 0.42 0.48 0.49 0.39 -0.1 PSYCH 0.37 0.76 0.32 0.22 0.24 0.67 0.34 0.75 0.73 0.25 0.86 0.48 0.21 0.57 0.23 -0.3 RECREATN 0.52 0.45 0.40 0.40 0.34 0.52 0.57 0.47 0.47 0.62 0.47 0.36 0.32 0.47 0.35 -0.1 RELIGION 0.22 0.15 0.24 0.13 0.14 0.22 0.23 0.20 0.13 0.25 0.24 0.06 0.11 0.19 0.13 -0.1 UNTCSMGT 3.03 2.20 1.99 2.10 2.01 2.45 2.29 2.37 1.99 2.37 2.35 1.85 1.97 2.27 2.03 -0.2 WARDNOFF 0.52 0.53 0.56 0.36 0.34 0.52 0.80 0.68 0.73 1.00 0.55 0.60 0.48 0.63 0.39 -0.2
Total, no UNICOR 22.1 18.1 18.8 14.1 14.8 20.4 23.5 22.9 20.8 20.9 22.7 17.3 14.7 20.6 14.5 -6.1

131
Staff FTEs by Facility, August 1999
Division ASH BAS BIG ELK FOR LAT LOR MIL PET SAF SEA TEX YAZ
Avg., Non-
Comp.
Avg., Comp.
Site Diff.
ADMINSYS 10 9 11 14 12 13 7 15 14 7 12 11 11 10.9 12.3 1.4 BUSINESS 18 18 16 23 23 14 17 19 19 14 15 16 18 16.6 21.3 4.7 CMPSRV 1 2 2 2 2 2 1 3 2 1 2 2 1 1.8 1.7 -0.1 CORRSVCS 122 91 90 119 119 103 78 140 139 60 115 109 117 104.7 118.3 13.6 EDUCVT 13 9 7 13 8 6 6 10 14 7 4 10 8 8.6 9.7 1.1 FOODSERV 16 15 15 15 14 16 12 19 14 11 16 17 11 15.1 13.3 -1.8 HOSPITAL 16 16 15 19 21 17 13 24 17 7 18 21 13 16.4 17.7 1.3
PHS (AUTH) 6 3 4 6 3 4 4 4 5 4 5 4 6 4.3 5.0 0.7 INMSRV 3 3 2 2 2 4 1 3 3 2.0 1.0 -1.0 MECHANIC 28 23 22 21 23 27 26 30 29 18 28 26 19 25.7 21.0 -4.7 PERSONEL 8 7 6 9 8 7 4 9 9 3 6 7 10 6.6 9.0 2.4 PSYCH 5 10 4 5 4 9 3 11 11 3 9 9 5 7.4 4.7 -2.7 RECREATN 6 6 6 8 8 7 5 7 7 5 6 6 5 6.1 7.0 0.9 RELIGION 3 2 2 3 3 3 2 3 3 2 3 1 3 2.4 3.0 0.6 UNTCSMGT 41 29 23 43 33 34 18 37 31 19 30 29 36 29.1 37.3 8.2 WARDNOFF 8 8 8 10 7 9 7 11 10 7 8 9 9 8.5 8.7 0.2
Total, no UNICOR 304 248 234 310 288 273 205 344 328 168 278 280 275 266.2 291.0 24.8
ADP 1,309 1,244 1,119 2,013 1,780 1,322 837 1,369 1,389 777 1,196 1,655 1,649 1221.7 1814.0 592.3
Staff FTEs per 100 Inmates, August 1999
Division ASH BAS BIG ELK FOR LAT LOR MIL PET SAF SEA TEX YAZ
Avg., Non-
Comp.
Avg., Comp.
Site Diff.
ADMINSYS 0.76 0.72 0.98 0.7 0.67 0.98 0.84 1.1 1.01 0.9 1 0.66 0.67 0.9 0.7 -0.2 BUSINESS 1.38 1.45 1.43 1.14 1.29 1.06 2.03 1.39 1.37 1.8 1.25 0.97 1.09 1.4 1.2 -0.2 CMPSRV 0.08 0.16 0.18 0.1 0.11 0.15 0.12 0.22 0.14 0.13 0.17 0.12 0.06 0.1 0.1 -0.1 CORRSVCS 9.32 7.32 8.04 5.91 6.69 7.79 9.32 10.2 10 7.72 9.62 6.59 7.1 8.6 6.5 -2.0 EDUCVT 0.99 0.72 0.63 0.65 0.45 0.45 0.72 0.73 1.01 0.9 0.33 0.6 0.49 0.7 0.5 -0.2 FOODSERV 1.22 1.21 1.34 0.75 0.79 1.21 1.43 1.39 1.01 1.42 1.34 1.03 0.67 1.2 0.7 -0.5 HOSPITAL 1.22 1.29 1.34 0.94 1.18 1.29 1.55 1.75 1.22 0.9 1.51 1.27 0.79 1.3 1.0 -0.4 PHS (AUTH) 0.46 0.24 0.36 0.3 0.17 0.3 0.48 0.29 0.36 0.51 0.42 0.24 0.36 0.4 0.3 -0.1 INMSRV 0.23 0 0.27 0 0 0.15 0.24 0.15 0.29 0 0.08 0.18 0.18 0.2 0.1 -0.1 MECHANIC 2.14 1.85 1.97 1.04 1.29 2.04 3.11 2.19 2.09 2.32 2.34 1.57 1.15 2.1 1.2 -0.9 PERSONEL 0.61 0.56 0.54 0.45 0.45 0.53 0.48 0.66 0.65 0.39 0.5 0.42 0.61 0.5 0.5 0.0 PSYCH 0.38 0.8 0.36 0.25 0.22 0.68 0.36 0.8 0.79 0.39 0.75 0.54 0.3 0.6 0.3 -0.3 RECREATN 0.46 0.48 0.54 0.4 0.45 0.53 0.6 0.51 0.5 0.64 0.5 0.36 0.3 0.5 0.4 -0.1 RELIGION 0.23 0.16 0.18 0.15 0.17 0.23 0.24 0.22 0.22 0.26 0.25 0.06 0.18 0.2 0.2 0.0 UNTCSMGT 3.13 2.33 2.06 2.14 1.85 2.57 2.15 2.7 2.23 2.45 2.51 1.75 2.18 2.4 2.1 -0.3 WARDNOFF 0.61 0.64 0.71 0.5 0.39 0.68 0.84 0.8 0.72 0.9 0.67 0.54 0.55 0.7 0.5 -0.2
Total, no UNICOR 23.2 19.9 20.9 15.4 16.2 20.7 24.5 25.1 23.6 21.6 23.2 16.9 16.7 21.8 16.0 -5.7

132
This page left intentionally blank.

133
References
Atkins, Jennifer et al. OMB Circular A-76: Alternatives to Overhead, Apr 2005 (CNA Annotated Briefing D0011131).
Cunningham III, William A., Justin W. Lavadour. “Pitfalls of the A-76 process—Pressures of a Shrinking Budget—Outsourcing.” Air Force Journal of Logistics. Winter 2001
Executive Office of the President, Office of Management and Budget, Competitive Sourcing: Conducting Public-Private Competition in a Reasoned and Responsible Manner, July 2003
Executive Office of the President, Office of Management and Budget, Letter from David Safavian addressed to The Honorable Richard B. Cheney, President of the Senate dated January 25, 2005. Cited as OMB (Jan 2005).
Executive Office of the President, Office of Management and Budget. “OMB Guidance for the use of Commercial Reason Code A Justification,” attachment to David Safavian, “2005 Inventories of Commercial and Inherently Governmental Activities,” Memorandum for Heads of Executive Departments and Agencies, M-05-12 (May 23, 2005)
Gruber, Amelia. “Daily Briefing: Procurement chief weighs changes to job competition rules.” Government Executive, Jan 14, 2005
Kelley, Joseph T. Costing government services: A guide for decision-making. Washington D.C.: Government Finance Officers’ Association, 1989
---------------------. Cost Information and Government Decision-Making. Working paper, 2002

134
Martin, Lawrence. How To Compare Costs Between In-house and Contracted Services. Washington DC: Reason Public Policy Institute. Mar 1993
Massachusetts Department of Revenue, Division of Local Services. Costing Municipal Services: Workbook and Case Study. Mar 2005
McDonald, Douglas C. Contracting for Imprisonment in the Federal Prison System: Cost and Performance of the Privately Operated Taft Correctional Institution (review draft). Cambridge, MA: Abt Associates. Mar 2005
Nelson, Julianne B. Taft Prison Facility: Cost Scenarios. U.S. Department of Justice, National Institute of Corrections, 1999
---------------------. Taft Prison Facility: A Comparison of Evaluation Methods, Jul 2005(CNAC Research Memorandum (IPR)11523)
United States Department of Defense. Guidebook for Using and Understanding Activity-Based Costing. Electronic College of Process Innovation, Jun 9, 1995
United States Department of Defense, Comptroller, Office of the Secretary of Defense. Activity-Based Costing: Accounting for Operational Readiness, A Concept Paper. 2002
United States Department of Justice, Federal Bureau of Prisons, Office of Research and Evaluation. Evaluation of the Taft Demonstration Project: Cost and Performance of a Private-Sector Prison and the BOP. Sep 23, 2004. (Cites as USDOJ/BOP/ORE (2004).)
United States Department of Justice, Federal Bureau of Prisons, Office of Research and Evaluation. 2005. Evaluation of the Taft Demonstration Project: Performance of a Private-Sector Prison and the BOP. Oct 7, 2005. (Cited as USDOJ/BOP/ORE (2005).)
United States General Accounting Office. DOD Competitive Sourcing: Questions about Goals, Pace and Risks of Key Reform Initiatives. (Feb 1999). GAO/NSIAD-99-46
135
United States General Accounting Office. DoD Competitive Sourcing: Effects of A-76 Studies on Federal Employees’ Employment, Pay and Benefits Vary. (Mar 2001) GAO-01-388
United States General Accounting Office. Competitive Sourcing: Challenges in Expanding A-76 Government-wide (Statement of Barry W. Holman, Directors Defense Capabilities and Management). (Mar 7, 2002) GAO-02-498T.
United States General Accounting Office. Commercial Activities Panel: Improving the Sourcing of the Federal Government. (Statement of David M. Walker, Comptroller General of the United States and Chair of the Commercial Activities Panel.) (Sep 27, 2002) GAO-02-847T
United States General Accounting Office. Competitive Sourcing: Implementation will be Challenging for Federal Agencies. (Statement of David M. Walker, Comptroller General of the United States). (Jul 24, 2003) GAO-03-1022T
United States General Accounting Office. Competitive Sourcing: Greater Emphasis Needed on Increasing Efficiency and Improving Performance. (Feb 2004) GAO-04-367
United States General Accounting Office. Results-Oriented Government: GPRA has Established a Solid Foundation for Achieving Greater Results. (Mar 2004) GAO-04-38
United States Government Accountability Office. Management Reform: Assessing the President’s Management Agenda (Statement of David M. Walker, Comptroller General of the United States). (Apr 21, 2005) GAO-05-574T

136
This page left intentionally blank.

137
List of figures
Figure 1. Average daily inmate population ...........................................30
Figure 2. Security levels at comparison sites, FY 1999–2002.................32
Figure 3. Predicted contract and avoidable in-house costs compared with observed contract costs ...................................................37
Figure 4. Reported facility-level per diem costs (excluding avoidable support costs) ...........................................................................39
Figure 5. Reported avoidable per diem cost (including avoidable support costs) ............................................................................................42
Figure 6. Observed and predicted facility-level per diem costs............44
Figure 7. Observed and predicted avoidable per diem costs (including avoidable support costs) ........................................................45
Figure 8. Observed contract costs and updated avoidable in-house costs 50
Figure 9. Inmate population by security level, FY 2002 ........................55
Figure 10. Facility expenditures per inmate-day, FY 2002......................59
Figure 11. Facility budget shares, FY 2002...............................................61
Figure 12. Staffing ratios: FTEs per 100 inmates ....................................64
Figure 13. Compensation per hour worked in Kern County, CA: Service Contract Act corrections officer and GS-6, step 5 law enforcement officer ..................................................................................70
Figure 14. BOP support costs for correctional facilities .......................115
Figure 15. BOP direct expenditures and support costs........................116

138
This page left intentionally blank.

139
List of tables Table 1. FY 1998 obligations.....................................................................11
Table 2. Expected direct contract cost, FY 1998 prices ..........................14
Table 3. BOP staffing patterns, March 1999............................................15
Table 4. GEO staffing pattern (specified in original bid) ......................15
Table 5. Blended GS locality rates—law enforcement staff in the “rest of the U.S.,” 1997 and 1998 .............................................................17
Table 6. Blended WS locality rates—“rest of the U.S.”, 1997–1998 .......18
Table 7. Expected cost of government salaries and benefits..................19
Table 8. Expected labor cost of government employees, FY 1997–1998 blended salaries................................................................................20
Table 9. Cost of inmate services by facility ..............................................20
Table 10. Other direct costs, FY 1998 ......................................................21
Table 11. Operating cost comparison, FY 1998 prices............................23
Table 12. BOP support cost breakdown, FY 1998 ...................................25
Table 13. Total cost estimates for in-house and contract operations (FY 1998 prices) ........................................................................................26
Table 14. Predicted and observed contract costs (current dollars).......34
Table 15. Predicted expenditures for in-house operations ....................36
Table 16. Predicted and observed cost at BOP comparison facilities (current dollars) .......................................................................................47
Table 17. Updated in-house cost estimates .............................................49
Table 18. Average daily population at BOP low-security facilities..........54

140
Table 19. Facility-level costs per inmate-day at BOP institutions............56
Table 20: Annual rates of inflation and GS cost of living increases .......57
Table 21. Contributions to per diem costs, FY 2002 ...............................60
Table 22. Per diem cost components, averages for FY 2002...................60
Table 23. Cost shares, averages for FY 2002 ............................................62
Table 24. Cost per hour worked for SCA corrections officers ...............67
Table 25. Cost per hour worked, GS-7 law enforcement........................68
Table 25. Cost per hour worked, GS-7 law enforcement (continued)...69
Table 26. Staffing patterns at comparison facilities ................................71
Table 27. Staff per 100 inmates at comparison facilities ........................72
Table 28. FTEs per 100 inmates at low security institutions...................73
Table 29. Elkton activation costs (then-year prices) ...............................76
Table 30. Inflation-adjusted activation costs (Elkton, FY 1998 prices) ..77
Table 31. Activation expenses compared ................................................78
Table 32. Aggregate financial impact of the Taft contract—current, beginning, and ending values of avoidable costs .......................................80
Table 33. Aggregate financial impact of the Taft contract—current, beginning, and ending values for total expenditures .................................81
Appendix Table 6.1. Ashland expenditures ............................................98
Appendix Table 6.2. Bastrop expenditures.............................................99
Appendix Table 6.3: Big Spring expenditures ......................................100
Appendix Table 6.4: Butner expenditures ............................................101
Appendix Table 6.5: Elkton Expenditures ............................................102
Appendix Table 6.6: Forrest City expenditures ....................................103

141
Appendix Table 6.7: La Tuna expenditures..........................................104
Appendix Table 6.8: Loretto expenditures ...........................................105
Appendix Table 6.9: Milan expenditures ..............................................106
Appendix Table 6.10: Petersburg Expenditures ...................................107
Appendix Table 6.11: Safford expenditures .........................................108
Appendix Table 6.12: Seagoville expenditures .....................................109
Appendix Table 6.13: Texarkana expenditures....................................110
Appendix Table 6.14: Yazoo City expenditures ....................................111
Appendix Table 7. BOP support cost rates, FY 1998–2002 ..................117
Appendix Table 8. BOP support cost breakdown.................................118
Appendix Table 9. National program costs itemized ...........................120

142
This page left intentionally blank.


IPR
116
47